Abstract
BACKGROUND
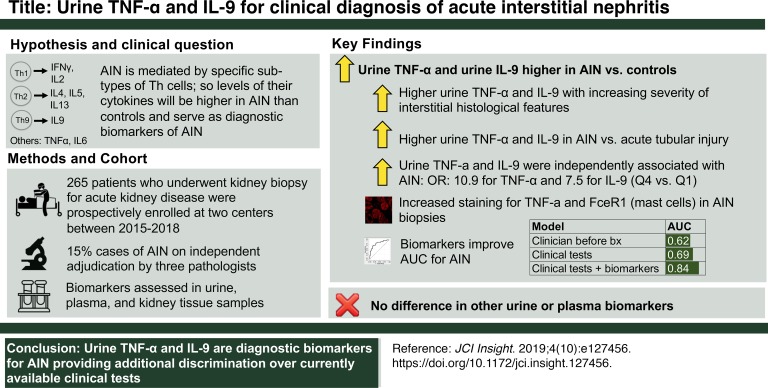
Clinical diagnosis of acute interstitial nephritis (AIN) is challenging because of lack of a diagnostic biomarker and requires a kidney biopsy. We hypothesized that AIN is mediated by specific T cell subsets such that specific T cell cytokine levels could serve as biomarkers to distinguish AIN from other causes of acute kidney disease (AKD).
METHODS
We enrolled consecutive sampling participants who underwent a kidney biopsy for AKD evaluation at 2 centers between 2015 and 2018. Three pathologists independently established AIN diagnosis through review of kidney biopsies. Through univariable and multivariable analysis of 12 selected urine and plasma cytokines, we identified 2 that were diagnostic of AIN.
RESULTS
Of the 218 participants, 32 (15%) were diagnosed with AIN by all 3 pathologists. Participants with AIN had consistently higher levels of urine TNF-α and IL-9 than those with other diagnoses, including acute tubular injury, glomerular diseases, and diabetic kidney disease, and those without any kidney disease. As compared with participants in the lowest quartile, we noted higher odds of AIN in participants in the highest quartiles of TNF-α levels (adjusted odds ratio, 10.9 [1.8, 65.9]) and IL-9 levels (7.5 [1.2, 45.7]) when controlling for blood eosinophils, leukocyturia, and proteinuria. Addition of biomarkers improved area under receiver operating characteristic curve over clinicians’ prebiopsy diagnosis (0.84 [0.78, 0.91]) vs. 0.62 [(0.53, 0.71]) and a model of current tests (0.84 [0.76, 0.91] vs. 0.69 [0.58, 0.80]).
CONCLUSIONS
Inclusion of urinary TNF-α and IL-9 improves discrimination over clinicians’ prebiopsy diagnosis and currently available tests for AIN diagnosis.
FUNDING
Supported by NIH awards K23DK117065, T32DK007276, K24DK090203, K23DK097201, R01DK113191, UG3-DK114866, P30DK079310; the Robert E. Leet and Clara Guthrie Patterson Trust; and American Heart Association award 18CDA34060118.
Keywords: Inflammation, Nephrology
Keywords: Cytokines, Diagnostics, T cells
Urine tumor necrosis factor-α and interleukin-9 are higher in cases of acute interstitial nephritis than those with other kidney diseases and improve discrimination over currently available tests.
Introduction
Acute interstitial nephritis (AIN) is the cause of over 15% cases of acute loss of kidney function (1). Unlike many other causes of acute loss of kidney function, AIN is treatable. However, ongoing inflammation can lead to permanent kidney damage in AIN if it is not diagnosed and treated promptly. In fact, it is estimated that 40% to 60% of cases of AIN result in development of chronic kidney disease (CKD). Delay in diagnosis is one of the best predictors of incomplete recovery of kidney function. Recent studies estimated that at least 2% to 3% of cases of CKD could be from undiagnosed AIN from proton pump inhibitor use, a figure that is equivalent to 1 million US adults (2–5). Thus, a noninvasive biomarker for timely diagnosis of AIN could improve clinical care of patients suspected to have AIN and may reduce occurrence of CKD.
A major challenge of AIN is distinguishing it from the other causes of acute rise in serum creatinine. When AIN was first described in association with β-lactam antibiotics, such as methicillin, it presented with typical features of an allergic reaction, such as onset of fever, rash, and eosinophilia, shortly after starting the medication. Currently, AIN commonly occurs because of various non–β-lactam antibiotics, proton pump inhibitors, nonsteroidal antiinflammatory drugs, and cancer immunotherapy agents (6, 7). Clinical presentation of AIN from these newer medications is subtle and occurs without any typical symptom or sign, which leads to failure of clinicians to suspect this disease. Clinically available tests, such as urine microscopy, urine eosinophils, and imaging studies, lack accuracy for AIN diagnosis (8). As a result, establishing AIN diagnosis requires the clinician to maintain a high index of suspicion and perform a kidney biopsy for confirmation, which carries risk and may not be feasible in some patients (9, 10). Even in those who undergo a kidney biopsy, histological interpretation by a single pathologist may be unreliable because of lack of inter-rater agreement on interstitial features (11).
Because AIN is likely to be a hypersensitivity reaction to a drug, we hypothesized that AIN would be mediated by a specific type of CD4+ Th cells acting through release of characteristic cytokines, such as IFN-γ and IL-2 (type 1); IL-4, IL-5, and IL-13 (type 2); or IL-9 (type 9), and predicted that specific cytokine patterns would be higher in participants with AIN than in other causes of acute rise in serum creatinine. In a cohort of participants with biopsy-proved, 3-pathologist-adjudicated AIN and participants with other causes of acute rise in serum creatinine, we tested plasma and urine inflammatory cytokines as diagnostic biomarkers of AIN.
Results
Cohort characteristics and case adjudication.
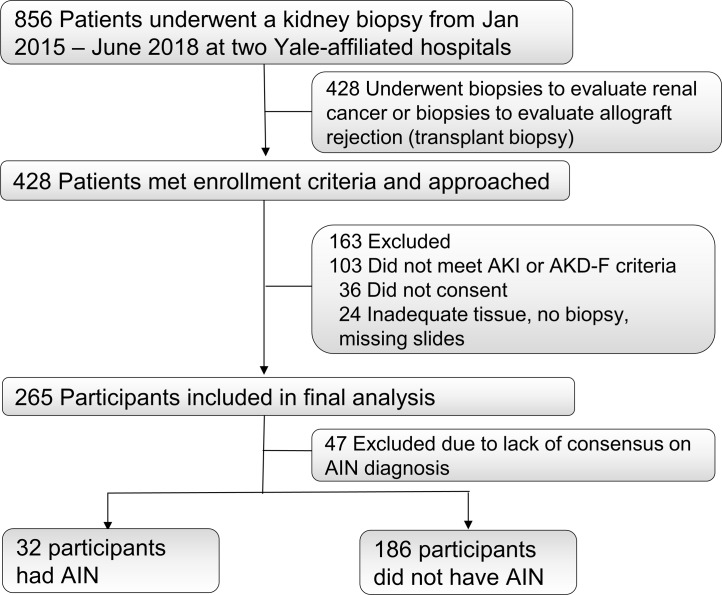
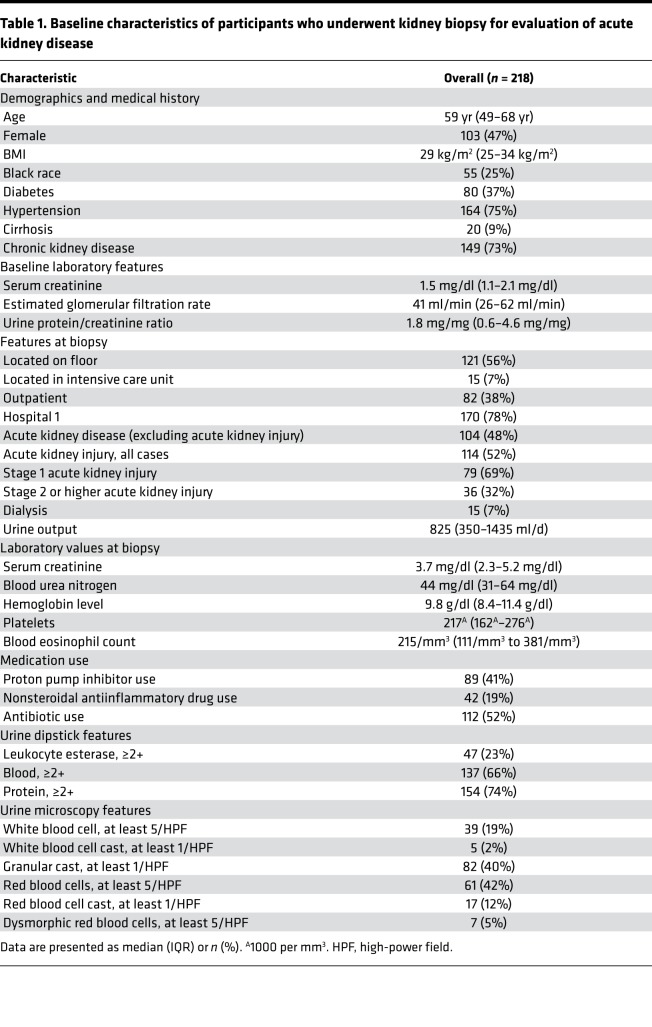
We enrolled 265 participants who underwent a kidney biopsy for evaluation of acute kidney disease (AKD) between January 2015 and June 2018 at 2 Yale-affiliated hospitals (Figure 1). Out of the 265 participants, 79 (30%) of biopsies were reported as AIN on official biopsy reports. Of these 79 biopsies, 32 (41%) were diagnosed as AIN by all 3 study pathologists and were included as cases in the primary analysis (Supplemental Table 1; supplemental material available online with this article; https://doi.org/10.1172/jci.insight.127456DS1). The 186 participants without AIN on official biopsy reports were included as controls. Baseline characteristics of study participants included in the primary analysis are presented in Table 1. At least 2 out of 3 pathologists diagnosed AIN in 55 participants, which were included as cases in a sensitivity analysis (Supplemental Table 1).
Figure 1. STARD flow diagram of participant enrollment.
Table 1. Baseline characteristics of participants who underwent kidney biopsy for evaluation of acute kidney disease.
Urine TNF-α and IL-9 were identified as biomarkers of AIN.
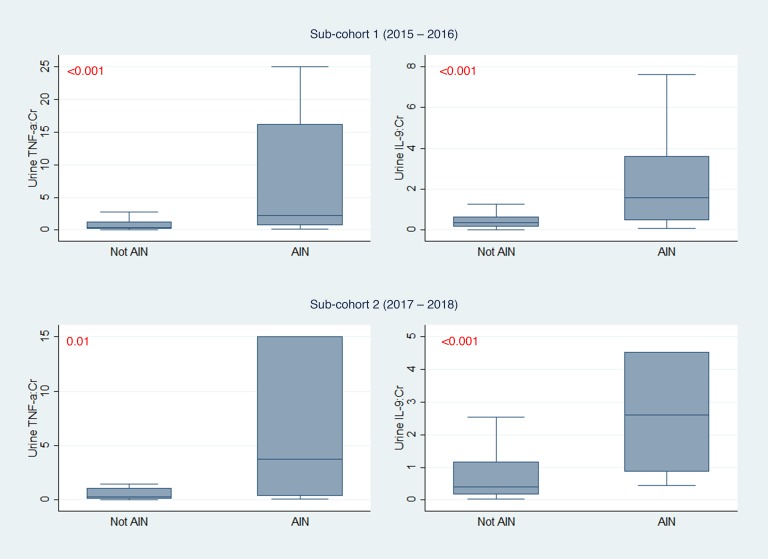
We measured 12 urine and 10 plasma inflammatory biomarkers. These included cytokines specifically associated with CD4+ T cell subsets but also included more general inflammatory cytokines, such as TNF-α and IL-6. To identify biomarkers for further analysis, we divided the overall cohort into 2 subcohorts separated by chronology of enrollment into 155 (59%) participants in cohort 1 (years 2015–2016) and 110 (41%) participants in cohort 2 (years 2017–2018). Out of the 22 total biomarkers tested, 3 urine biomarkers, TNF-α, IL-9, and IL-6, were associated with AIN in both subcohorts, whereas none of the plasma biomarkers was associated with AIN (Supplemental Table 2). We chose the 2 urine cytokines with the strongest association with AIN and biological plausibility, urine TNF-α and IL-9, for further analysis (Figure 2 and Supplemental Figure 1). TNF-α and IL-9 remained associated with AIN on an alternative validation technique where we divided the cohort by site of enrollment (Supplemental Table 3). We found consistent results in 3 sensitivity analyses evaluating association of urine TNF-α and IL-9 with alternative case definitions, including AIN diagnosed by at least 2 out of 3 study pathologists, AIN diagnosed by the treating clinicians after their review of the kidney biopsies, and AIN on official biopsy reports (Supplemental Table 4).
Figure 2. Comparison of urine TNF-α and IL-9 between AIN and controls in 2 subcohorts.
Median (horizontal line), 25th and 75th percentiles (box), and 5th and 95th percentiles (whiskers) of biomarkers are shown. Biomarker values in pg/mg of creatinine. Wilcoxon’s rank-sum test. Cohort 1 includes 22 participants with AIN and 105 without AIN; cohort 2 includes 10 participants with AIN and 81 without AIN. AIN, acute interstitial nephritis; Cr, creatinine. Values shown in red represent P values.
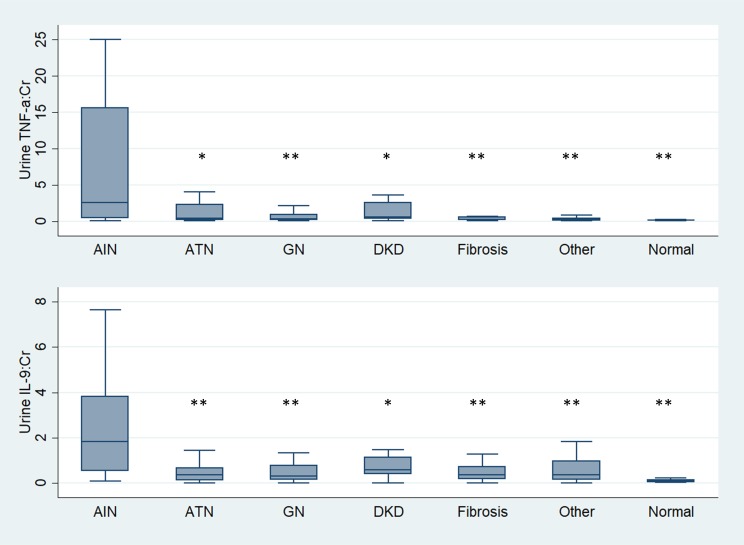
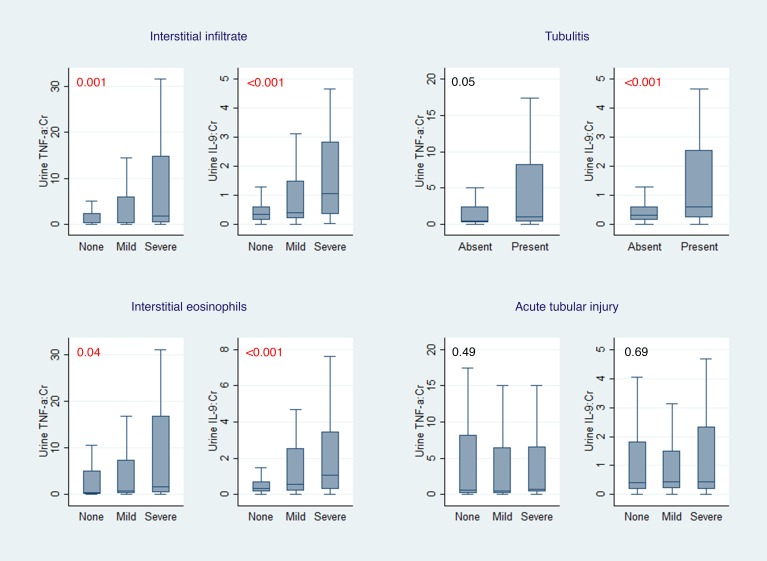
Participants with AIN also had higher urine TNF-α and IL-9 levels than those with other causes of AKD, including acute tubular injury, glomerular diseases, diabetic kidney disease, and progressive CKD (Figure 3). These biomarkers were higher in AIN than in participants without any kidney disease. Urine TNF-α and IL-9 levels were also higher in those cases of AIN that were determined to be drug related (n = 20, Supplemental Table 5) than those without AIN, whereas levels were comparable between AIN cases thought to be drug related as compared with AIN due to other causes (Supplemental Table 6). In addition, urine TNF-α and IL-9 were higher with increasing severity of interstitial histological features pathognomic of AIN, such as fraction of kidney tissue with lymphocytic infiltrate, presence of tubulitis, and number of interstitial eosinophils per high-power field (Figure 4). In contrast, biomarkers did not correlate with degree of tubular injury reported on the adjudicated biopsies, which is the hallmark finding of acute tubular injury (ATI).
Figure 3. Urine TNF-α and IL-9 in participants with AIN compared with those with other kidney diseases and no kidney disease.
Median (horizontal line), 25th and 75th percentiles (box), and 5th and 95th percentiles (whiskers) of biomarkers are shown. Both urine biomarkers are normalized to urine creatinine and shown in pg/mg. *0.001 < P < 0.05, and **P < 0.001. Wilcoxon’s rank-sum test comparing biomarker levels among AIN (n = 32) and acute tubular necrosis (ATN; n = 38), glomerular disease (GN; n = 59), diabetic kidney disease (DKD; n = 37), arterionephrosclerosis (fibrosis; n = 24), other diagnoses (n = 27), and participants without known kidney disease (n = 20). Cr, creatinine.
Figure 4. Association of urine TNF-α and IL-9 with interstitial histological features.
Median (horizontal line), 25th and 75th percentiles (box), and 5th and 95th percentiles (whiskers) of biomarkers are shown. Both urine biomarkers are normalized to urine creatinine and shown in pg/mg. Wilcoxon’s rank-sum test comparing biomarkers with interstitial histological features. Cr, creatinine. Values shown in red represent P values.
Urine TNF-α and IL-9 were independently associated with AIN.
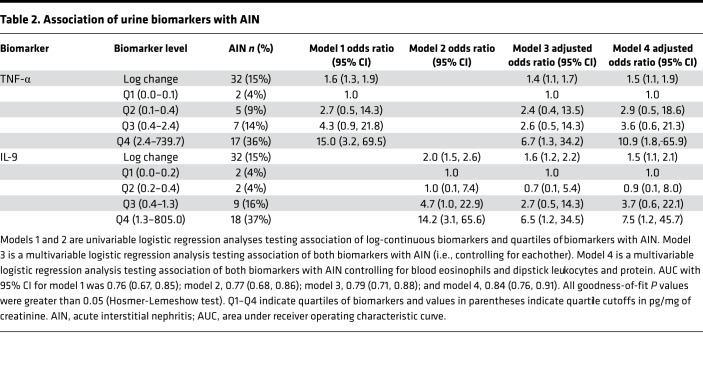
Table 2 shows sequential models testing association of log-continuous biomarkers and quartiles of biomarkers with AIN. Both log-continuous and highest quartiles of each biomarker were associated with higher odds of AIN in univariable analyses (models 1 and 2). The model containing both biomarkers (model 3) had an area under receiver operating characteristic curve (AUC) of 0.79 (0.71, 0.88). In a model controlling for key confounders, such as blood eosinophil count, dipstick leukocyturia, and dipstick proteinuria (model 4), the highest quartiles of TNF-α and IL-9 were independently associated with 10.9-fold and 7.5-fold higher odds of AIN, respectively.
Table 2. Association of urine biomarkers with AIN.
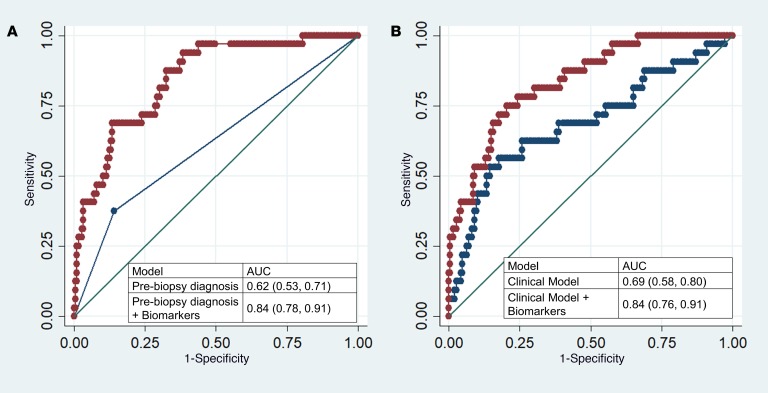
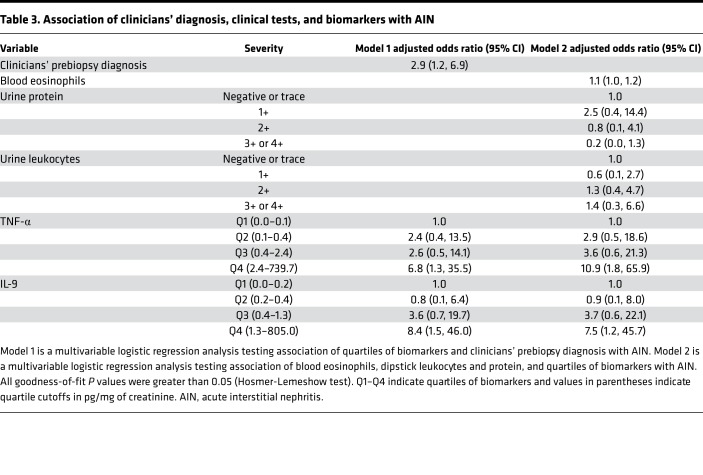
We evaluated the contribution of biomarkers to 2 models based on information currently available to clinicians. First, we reviewed clinical charts to determine whether AIN was the most likely diagnosis suspected by the clinical nephrologist before the biopsy, which had an AUC of 0.62 (0.53, 0.71) for AIN diagnosis. Second, we created a parsimonious model consisting of clinical variables typically associated with AIN. This model consisted of blood eosinophils, dipstick proteinuria, and dipstick leukocyturia and had an AUC of 0.69 (0.58, 0.80). Addition of biomarkers to either model improved the AUC significantly such that clinicians’ prebiopsy diagnosis plus biomarkers had an AUC of 0.84 (0.78, 0.91, P < 0.001) and the clinical model plus biomarkers had an AUC of 0.84 (0.76, 0.91, P < 0.001) (Figure 5). In the analysis containing biomarkers and clinical variables, the biomarkers were associated with AIN whereas the clinical variables were not (Table 3).
Figure 5. Comparison of AUC between clinicians, clinical model, and biomarkers.
(A) Comparison of AUC of clinical nephrologists’ prebiopsy diagnosis with the model including biomarkers. (B) Comparison of AUC of the clinical model consisting of blood eosinophils, and dipstick protein and white blood cells, with the model including biomarkers. P < 0.001 for both comparisons of models with and without biomarkers (likelihood ratio test).
Table 3. Association of clinicians’ diagnosis, clinical tests, and biomarkers with AIN.
Clinical application of study findings.
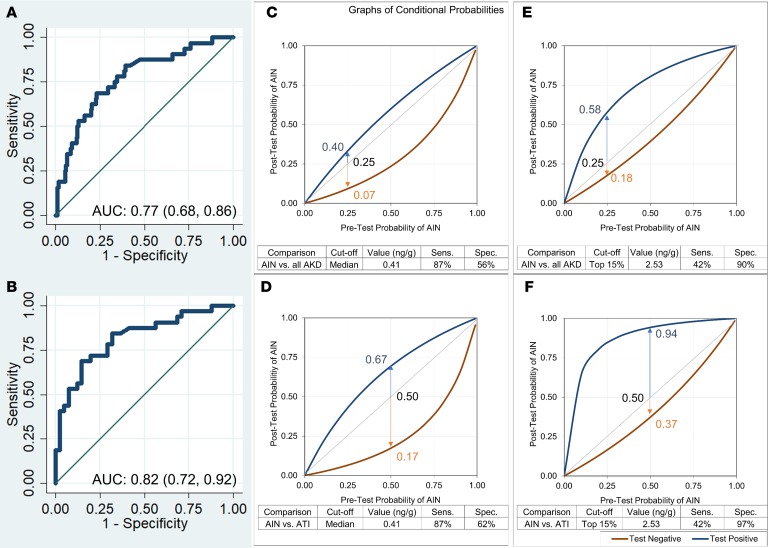
To demonstrate the clinical utility of urine IL-9 for clinical diagnosis of AIN, we evaluated 2 cutoffs: a high-specificity cutoff of 2.53 ng/g, which corresponds to the top 15% of study participants, and a high-sensitivity cutoff of 0.41 ng/g, which corresponds to the median biomarker value. Figure 6, A and B, shows AUC of urine IL-9 for AIN diagnosis when compared with AKD controls and ATI controls, respectively Figure 6, C–F, and Supplemental Table 7 show post-test probabilities at a range of pretest probabilities at the 2 cutoffs. In a common scenario where a clinician wishes to distinguish AIN from ATI and has a pretest probability of 0.50 for AIN diagnosis, a positive IL-9 test at 2.53 ng/g cutoff will increase the post-test probability to 0.94, whereas a negative test at 0.41 cutoff will reduce post-test probability to 0.17. In both scenarios, the clinician may be able to avoid a kidney biopsy. We found similar results for TNF-α (Supplemental Figure 2).
Figure 6. Post-test probabilities of AIN at a range of pretest probabilities at 2 cutoffs of IL-9.
AUC for outcome of AIN versus all causes of AKD (A) and AIN versus ATI (B). Post-test probability of AIN at a range of pretest probabilities at IL-9 cutoff equal to median (C and D) and top 15% values (E and F). Top 15% cutoff was chosen based on 15% prevalence of AIN in cohort.
Determining the source of TNF-α and IL-9.
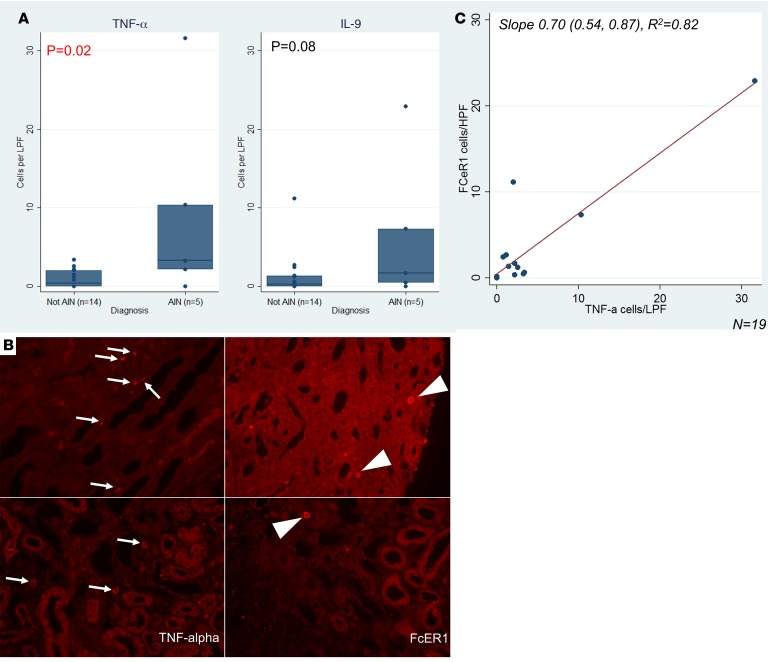
To determine whether the urine biomarkers were being produced in the kidneys or filtered from the blood, we used 3 approaches. First, we used kidney biopsies from study participants to identify intrarenal cells containing TNF-α and mast cells. Because we could not reliably stain kidney biopsies for IL-9, we stained for the presence of mast cells, which are not normally present in kidneys and are considered downstream surrogates of IL-9 activity. Figure 7 shows that biopsies with AIN had higher TNF-α+ cells than controls and shows a trend toward higher FcεRI+ cells, a mast cell marker. We noted a high degree of correlation between cells staining for TNF-α and FcεRI on the same biopsy (Figure 7). We also noted a high degree of correlation between urine TNF-α and cells staining for TNF-α on kidney biopsy (rho = 0.48, P = 0.03) but not between urine IL-9 and FcεRI (rho = 0.29, P = 0.22) (Supplemental Table 8). Among participants with AIN, 24 (28%) out of 85 TNF-α+ cells colocalized with FcεRI expression, and 24 (60%) out of FcεRI+ cells (n = 40) colocalized with TNF-α expression (Supplemental Figure 3).
Figure 7. Immunofluorescence of kidney tissue for TNF-α and FcεRI.
(A) Median (horizontal line), 25th and 75th percentiles (box), and 5th and 95th percentiles (whiskers) of number of cells per low-power field by diagnosis are shown. P value obtained using 2-tailed t test comparing cells per low-power field by diagnosis. (B) Representative images of immunostaining from AIN (top row) and not AIN (bottom row) samples immunostained for TNF-α (left column) or FcεRI (right column). TNF-α+ cells are noted by arrows. FcεRI+ mononuclear cells are shown by arrowheads. (C) Scatter plot showing correlation of cells staining positive for TNF-α and FcεRI. Best fit line is shown in red.
Second, we noted that although plasma biomarkers were not different between cases and controls, the ratio of urine to plasma TNF-α was higher in AIN than in controls (Supplemental Table 9). Third, to determine whether the presence of biomarkers in urine was associated with abnormal glomerular filtration barrier, we compared the ratio of urine biomarkers to urine albumin between AIN and controls. We found that this ratio was higher in AIN than in controls. Taken together, these approaches suggest that the urine biomarkers originated primarily in the kidneys.
Eosinophils, IL-5, and AIN.
Eosinophils in the renal tubulointerstitium are used histopathologically to diagnose AIN. AIN was diagnosed by the pathologists in all 16 (100%) biopsies with more than 5 eosinophils/ high-power field (HPF), 12 (75%) biopsies with 1–5 eosinophils/HPF, and 4 (14%) biopsies with no eosinophils. We noted that urine IL-5, an eosinophil-related cytokine, but not urine IL-9, was higher in AIN with more than 5 eosinophils/HPF than in AIN cases with less than or equal to 5 eosinophils/HPF (Supplemental Figure 4). However, we did not identify any association of eotaxin-1 or eotaxin-2, 2 chemokines involved in eosinophil chemotaxis, with AIN.
Effect of corticosteroid therapy on urine biomarker levels.
Corticosteroid therapy was administered to 35 (16%) study participants before urine was collected for biomarker measurement, which included 2 (6%) participants diagnosed as having AIN and 33 (18%) with other diagnoses. Urine TNF-α and IL-9 levels were comparable between those who received corticosteroids before urine collection compared with those who did not (Supplemental Table 10). However, among those who received steroids, we noted higher corticosteroid dose was associated with lower urine IL-9 levels but not TNF-α levels in an analysis controlling for AIN diagnosis (model 2 in Supplemental Table 11). We noted that with each log increase in IL-9 levels, the corticosteroid dose administered was 180 mg (27 mg, 333 mg) lower. Similarly, those with IL-9 levels above the median had received a 330 mg (19 mg, 640 mg) to lower dose of corticosteroids.
Discussion
We demonstrate that urine TNF-α and IL-9 levels were consistently higher in participants with biopsy-proved, adjudicated AIN compared with other causes of AKD, whereas other plasma and urine biomarkers were comparable between the 2 groups. These biomarkers were higher in AIN than in various causes of AKD, including ATI, glomerular diseases, and diabetic kidney disease, as well as in participants without kidney disease. Urine TNF-α and IL-9 improved discrimination for AIN diagnosis as compared with the clinical nephrologist’s prebiopsy diagnosis of AIN and a model consisting of currently available blood and urine tests. We also demonstrate an increase in cells staining for TNF-α and for FcεRI, a marker of mast cells, indicating that IL-9–driven mast cell release of TNF-α could be a potential source of this cytokine. Overall, our results indicate that concomitantly elevated levels of urine TNF-α and IL-9 are specific to AIN and may be a useful biomarker to distinguish AIN from other clinical causes of AKD.
Among the various causes of AKD, AIN is one of the few with a specific treatment. Yet, the clinical diagnosis of AIN is challenging because of its subacute presentation, lack of a pathognomonic clinical sign or symptom, and lack of a noninvasive diagnostic test. This challenge results in delay in diagnosis, increased fibrosis, and occurrence of CKD. For example, 1 study found that AIN was suspected in only 25% of cases from PPI before the biopsy (12). Unrecognized subclinical AIN is thought to be the cause of CKD in 2% to 3% of patients (2). Similar to earlier studies, we found that the clinicians’ prebiopsy diagnosis had an AUC of only 0.62 and a model with currently available clinical tests for AIN had an AUC of 0.69, which are indicative of the current challenges with the clinical diagnosis of AIN. We found that urine TNF-α and IL-9 had consistent association with AIN and significantly improved the discrimination for AIN diagnosis over the clinicians’ prebiopsy impression and the model of clinical tests. Addition of these urine biomarkers to current clinical information could aid in the diagnosis of AIN by supplementing or replacing the kidney biopsy.
We selected biomarkers to be evaluated based on the hypothesis that AIN is a hypersensitivity reaction mediated by cytokines from specific T cell subsets and predicted that the relevant cytokines would be higher in AIN than other causes of AKD (Supplemental Table 12). Kidney biopsies from patients with AIN are characterized by presence of lymphocytic infiltrate consisting predominantly of CD4+ T cells (13), which produce both type 1 and type 2 cytokines (14). IL-9 was not evaluated in this earlier study. Type 2 immune responses, characterized by cytokines IL-4, IL-5, and IL-13, play an important role in allergen-induced diseases, including drug allergy. IL-5 is particularly associated with eosinophilic infiltrates. IL-9 is often associated with type 2 responses in allergic disorders, such as atopic dermatitis (15), allergic asthma (16), and food allergy (17), and is produced by a distinct CD4+ T cell subset designated as Th9 (15). Among these cytokines, we found that IL-9 was most associated with AIN. IL-9 leads to differentiation, survival, and tissue accumulation of mast cells, including infiltration of mast cells in the renal tubulointerstitium (18). Mast cells can also release preformed TNF-α and increase transcription of TNF-α (19) and are a critical source of TNF-α in allergic diseases (20). A study showed that AIN kidney biopsies had significantly higher mast cell numbers than biopsies with ATI (21). We noted a trend toward higher mast cells in AIN than other causes of AKD. We also noted that a majority of FcεRI-staining mast cells colocalized with TNF-α. Thus, a unifying hypothesis based on our findings is that AIN is caused by IL-9–mediated activation of mast cells, which subsequently release TNF-α. Future studies could focus on further exploring the role of IL-9–producing CD4+ T cells and mast cells for understanding the pathogenesis of AIN. Moreover, although the current therapies in AIN provide nonspecific immunosuppression using corticosteroids, future studies could investigate therapies specific to TNF-α and mast cells in treatment of AIN.
Presence of eosinophils in the renal interstitium is suggestive of diagnosis of drug-induced AIN. In our study the pathologists were more likely to diagnose AIN if the biopsies had eosinophils in the renal interstitium. We tested the key cytokine involved in eosinophil production, IL-5, and 2 chemokines involved in eosinophil chemotaxis in tissues, eotaxin-1 and eotaxin-2. Although IL-5 was not associated with AIN in the overall cohort, we noted that the subset of AIN cases with more than 5 eosinophils/HPF had higher urine IL-5 than AIN cases with fewer eosinophils or non-AIN cases that. A recent study showed that despite the presence of eosinophils in the kidney tissue, urine eosinophils were neither sensitive nor specific for AIN (22). However, this study did not specifically study the subgroup with high tissue eosinophilia. It is often observed clinically that cases with antibiotic-induced AIN have many kidney tissue eosinophils whereas those related to nonsteroidal antiinflammatory drugs have few. Together these findings point to a subset of AIN cases with high degree of renal interstitial eosinophils and urine IL-5 levels. Anti–IL-5 therapies could be a potential treatment for this subgroup of AIN patients.
Among the type 1 cytokines tested in this study, none was higher in AIN, indicating that type 1 immune responses are not predominantly associated with inflammation in AIN. Moreover, all the significant differences in cytokine levels between AIN and controls were in the urine, whereas none was noted in the plasma. Inflammation in AIN is usually limited to the kidneys, which makes urine a likely source for detection of inflammatory mediators. Detection of cytokines in the plasma in renal-limited inflammation would require reabsorption into the circulation from the kidneys, where cytokine concentration would be diluted in the extracellular fluid volume. Moreover, controls in this study included patients with systemic vasculitis, sepsis, and other systemic illnesses, all of which are conditions that are expected to have increased plasma levels of cytokines. Thus, measuring urine, rather than plasma, cytokines provides specificity for renal inflammation in AIN.
Our study design has several strengths. First, prospective enrollment allowed us to standardize sample collection, processing, storage, and biomarker measurement. Second, AIN diagnosis in our study was established by adjudication by 3 independent pathologists blinded to clinical history and biopsy report. Third, we tested the consistency of our findings across various sensitivity analyses using alternative definitions of AIN. Fourth, we selected as controls participants who were selected for a biopsy for evaluation of AKD by their nephrologists, ensuring generalizability to clinical practice. Finally, we showed consistent association across various subgroups to eliminate false positive associations. Our study also has some limitations. First, we carefully selected a list of biomarkers based on the current understanding of the disease, which may have excluded pathways that are not presently known. A future study could focus on using an untargeted approach to biomarker discovery. Second, our results could be influenced by selection bias because all participants underwent a kidney biopsy deemed clinically necessary by their nephrologists. As a result, our findings may not be generalizable to participants not being considered for a diagnostic kidney biopsy. Third, although we show consistency of results across various subcohorts, these findings need to be validated in an external validation cohort before clinical application. Fourth, although we showed mast cells are a source of TNF-α, they may not be the dominant source of this cytokine. Because of limited availability of tissue from study participants, we did not identify the other cellular sources of TNF-α. We did, however, show that a majority of mast cells produce TNF-α, which combined with the known role of IL-9 in mast cell activation indicate that mast cells may play an important role in AIN. Fifth, because we did not power our study to detect drug class–specific biomarkers of AIN, we could not differentiate between AIN caused by different drugs. We also noted modest inter-rater agreement among our pathologists on AIN diagnosis and interstitial histological features. Such low inter-rater agreement, although concerning, has been reported by others in kidney biopsies from transplants (11) and glomerular disease (23). We were aware of such discordance among pathology raters and attempted to overcome this by asking multiple pathologists to review each biopsy. We then used the pathologists’ consensus diagnosis as our “gold standard” case definition.
In conclusion, we show that urine TNF-α and IL-9 are consistently associated with AIN and improve discrimination over a clinician’s prebiopsy diagnosis and a model of currently available clinical tests. These results could guide diagnostic approaches in patients suspected to have AIN for early management that could supplement or replace a kidney biopsy. Moreover, our findings point to potentially novel insights into the role of mast cells and Th9 cells in AIN for future mechanistic studies.
Methods
Study design and participants.
We prospectively enrolled participants who were scheduled to undergo a clinically indicated kidney biopsy at 2 Yale University–affiliated hospitals: Yale New Haven Hospital and St. Raphael’s Hospital (both in New Haven, Connecticut, USA) from January 2015 to June 2018 (9, 24). We included all consecutive sampling adult participants who met the Kidney Disease Improving Global Outcomes AKD criteria (25). AKD criteria include AKI and allow for a less abrupt loss of renal function over 3 months. The former criteria were selected based on a prior study that showed that although the AKD criteria include over 90% of participants with AIN on biopsy, the AKI criteria miss about half of all AIN cases (26). If no baseline serum creatinine (SCr) was available to assess AKD criteria, we enrolled participants with SCr at biopsy of greater than or equal to 1.5 mg/dl. We excluded kidney transplant recipients because acute rejection cannot reliably be differentiated from AIN on histology. We also excluded participants who were undergoing a kidney biopsy to evaluate a renal malignancy.
Establishing AIN diagnosis.
Three renal pathologists independently evaluated biopsy slides to establish AIN diagnosis. The pathologists were blinded to clinical history and official biopsy report. They evaluated all cases with official biopsy report of AIN (n = 79) and a subset of those without any mention of AIN on the official biopsy report (n = 28). These pathologists determined the presence or absence of AIN and rated the interstitial features on an ordinal scale developed for this study (Supplemental Table 13). Out of 79 biopsies with official biopsy report of AIN, 32 (41%) were classified as AIN by all 3 pathologists, 23 (29%) were classified as AIN by 2 out of 3 pathologists, whereas 24 (30%) were classified as not AIN by at least 2 out of 3 pathologists (Supplemental Table 1). None of the 28 biopsies without AIN on the official interpretation was classified as AIN by the adjudicating pathologists. We noted a modest inter-rater agreement and κ statistic among the pathologists for AIN diagnosis (agreement 63%–70%, Fleiss’s κ = 0.35).
In our primary analysis, we defined a biopsy as “AIN” case when all 3 pathologists classified the biopsy as AIN and “not AIN” control when none reported AIN. We excluded biopsies where one or 2 pathologists diagnosed AIN and included as “not AIN” controls all participants without official biopsy report of AIN. In 3 sensitivity analyses, we used alternative case and control definitions. First, we defined cases and controls as the majority diagnosis among the pathologists without excluding any participant. Second, we defined cases and controls based on the diagnoses of the treating nephrologists after their review of the biopsies. Third, we defined cases and controls based on official biopsy interpretation.
Biomarker testing.
We measured biomarkers from plasma and urine samples stored at –80ºC after a single controlled thaw. The sample processing protocol and biorepository tracking details have been described in a prior publication from our group (27). Urine and plasma samples were collected a median (IQR) of 2.1 (–2.2 to 4.0) and 6.2 (1.6 to 26.7) hours before the biopsy. We used the manufacturer-validated 10-plex Proinflammatory Panel 1 from Mesoscale Discovery to test plasma TNF-α, IFN-γ, IL-1β, IL-2, IL-4, IL-6, IL-8, IL-10, IL-12p70, and IL-13. We validated the above 10-plex panel in the urine. We also created and validated a custom 2-plex urine assay for IL-5 and IL-9. Mean interassay CV was 2.4% to 12% for all urine biomarkers except urine IL-10 (22.6%) and 2.3% to 10.4% for plasma biomarkers (Supplemental Table 14). We normalized all urine biomarkers to urine creatinine to account for urine concentration differences. We also performed urine albumin and creatinine measurements using Randox RX Daytona machine and urine dipstick analysis using Clinitek Status analyzer (Siemens Healthcare Diagnostics Inc.). We also performed urine sediment microscopy (Laxco LMC4BF, Fisher Scientific) and took representative pictures. The personnel measuring biomarkers, urine dipsticks, and urinalysis were blinded to the case status.
Sources of data.
We collected demographic, clinical history, laboratory results, medications, and nephrologists’ pre- and postbiopsy diagnosis through chart review of the Epic electronic health record (EHR) and cross-referenced with patient interviews. We also checked scanned laboratory records or called physicians’ offices if the above data were not available from the EHR. Biopsy-related complications were also assessed in a subset of participants enrolled until December 2017 (n = 256); 12 (5%) participants required a blood transfusion, and 2 (0.8%) required an angiographic intervention because of biopsy-related bleeding (9).
Immunofluorescence.
We selected 5 AIN and 15 non-AIN samples for immunostaining for TNF-α and the mast cell marker FcεRI. Mast cells were used as a surrogate for IL-9 because we were unable to reproducibly detect IL-9 in human tissue via immunofluorescence or in situ hybridization. Formalin-fixed, paraffin-embedded human kidney was deparaffinized at 60°C overnight followed by incubation in xylene for 20 minutes twice. Samples were rehydrated into tap water, and antigen retrieval was performed for 20 minutes at 96°C in 1.25 mM EDTA, pH 8.0. Slides were cooled and blocked in TBS/0.05% Tween/0.3% BSA + 1 μg/ml Fc block + 25% heat-inactivated FBS (Fc block from BD Biosciences, 564220), for 2 hours at room temperature. Samples were then incubated with primary antibody overnight at 4°C (TNF-α Abcam ab212899 at a concentration of 1:250 or FcεRI Abcam ab54411 at a concentration of 1:100). Samples were washed in TBS with Tween twice and TBS once and incubated with Alexa Fluor 546–conjugated goat anti-mouse at 1:100 for 1 hour at room temperature (Life Sciences A11003). Image quantification was performed using ×20 objective (Nikon Eclipse TE200) by an observer blinded to case status. Representative images were taken of AIN and non-AIN samples at identical exposure with ×40 objective. We could not costain TNF-α and FcεRI because they were both mouse antibodies. Thus, to demonstrate colocalization, we manually aligned images from serial sections where morphology allowed, and when the same cell was captured on both sections, we performed scoring for each marker.
Statistics.
We present data as median (IQR) or count (percentage). We performed univariable comparison of biomarkers with AIN using Kruskal-Wallis test after dividing the overall cohort into 2 temporal subcohorts (subcohort 1 from 2015 to 2017 and subcohort 2 from 2017 to 2018). We selected TNF-α and IL-9 for further analysis of biomarkers based on their association with AIN in both subcohorts. We also used an alternative method of dividing the cohort by site of enrollment. We performed sensitivity analyses by using alternative case definitions of AIN as described above in Establishing AIN Diagnosis. We calculated overall inter-rater agreement among pathologists (more than 2 raters providing more than 2 ratings) as described by Fleiss, Nee, and Landis using the “kap” command in Stata Statistical Software release 14 (StataCorp LP) (28).
To test the independent association of these biomarkers with AIN, we fit logistic models with outcome of AIN and predictors as log-transformed biomarkers or quartiles of biomarkers. We controlled the analysis for blood eosinophils, urine protein, and urine leukocytes. To build a diagnostic model for AIN using currently available variables, we selected variables thought to be associated with AIN (29, 30). We then divided our cohort into a random 70% subset, fit a stepwise backward regression method with threshold for exclusion of P values greater than 0.2, repeated this procedure 200 times, and picked variables that were selected in over 50% of the models. For categorical variables, we replaced missing values with a separate term in analyses, and for continuous variables, we replaced the missing term with the median. To compare additional value of biomarkers over clinical information, we fit 2 models with outcome as AIN and predictors as clinicians’ prebiopsy diagnosis (Table 2, model 3) and the clinical model developed above (Table 2, model 4). We then added the biomarkers to these models and reported increase in discrimination using change in the AUC. We compared models using the likelihood ratio test and tested model calibration using Hosmer-Lemeshow goodness-of-fit tests. To test the association of biomarkers with histological features, we fit ordinal logistic models with outcome as the interstitial feature reported by each individual pathologist and predictors as log-transformed biomarker values controlling for the pathologist and clustered at the level of the participant. We tested the proportional odds assumption in ordinal logistic regression using the Brant test. We tested 2 biomarker cutoffs to demonstrate clinical application. First, we tested a high-specificity cutoff corresponding to the top 15% biomarker values in the cohort given the 15% prevalence of AIN. Second, we tested a high-sensitivity cutoff corresponding to the median biomarker value in the cohort. We report sensitivity and specificity at these cutoffs. In addition, we show post-test probabilities of AIN at a range of pretest probabilities for each of these cutoffs. To test the effect of corticosteroid therapy on biomarker levels, we used Wilcoxon’s rank-sum test to compare biomarker values between those who did and did not receive steroids 7 days to 6 hours before the urine collection. Among those who received corticosteroid therapy before urine collection, we used linear regression to test the association of steroid dose with log-transformed biomarker values as well as values above and below the median. We controlled this analysis for postbiopsy diagnosis given the association of AIN with biomarkers. Our calculations indicated that we required 36 AIN cases to detect a 50% difference in biomarker level between cases and controls (80% power, 2-sided α = 0.05, assuming standard deviation = mean, and case/control = 1:6). We required at least 33 cases to detect a 0.15 increase in AUC provided that the AUC of baseline model was 0.60 (31). We used Stata Statistical Software release 14 (StataCorp LP) for all analyses. All statistical tests were 2 sided with a significance level of P < 0.05.
Study approval.
This study was approved by the Yale Human Investigation Committee under approval number 11110009286. All participants provided written informed consent.
Author contributions
DGM, FPW, MAP, RLL, LGC, JSP, HL, and CRP designed the research studies. DGM, WO, and NS conducted experiments. DGM, WO, NS, GWM, M. Kuperman, and M. Kashgarian acquired data. DGM, HL, and CRP analyzed data. DGM and CRP wrote the manuscript, and all the authors provided critical edits.
Supplementary Material
Acknowledgments
We wish to thank the participants of the Yale biopsy study, without whom this study would not have been possible. We also wish to thank Bettina Cheung, Selin Isguven, and Lidiya Kukova for their help with participant recruitment. This study was supported by NIH awards K23DK117065 (to DGM), T32DK007276 (to LGC, DGM, and NS), K24DK090203 (to CRP), K23DK097201 (to FPW), R01DK113191 (to FPW), UG3-DK114866 (to CRP), and P30DK079310 (to CRP and LGC); the Robert E. Leet and Clara Guthrie Patterson Trust (to DGM); and American Heart Association award 18CDA34060118 (to DGM). The content is the responsibility of the authors alone and does not necessarily reflect the views or policies of the US Department of Health and Human Services, nor does mention of trade names, commercial products, or organizations imply endorsement by the US government. These organizations were not involved in study design, analysis, interpretation, or manuscript creation.
Version 1. 05/16/2019
Electronic publication
Footnotes
Conflict of interest: CRP and DGM are named inventors on provisional patent number 62/716,465 titled “System and methods for diagnosing acute interstitial nephritis.”
Copyright: © 2019 American Society for Clinical Investigation
Reference information: JCI Insight. 2019;4(10):e127456. https://doi.org/10.1172/jci.insight.127456.
Contributor Information
Dennis G. Moledina, Email: dennis.moledina@yale.edu.
F. Perry Wilson, Email: francis.p.wilson@yale.edu.
Jordan S. Pober, Email: jordan.pober@yale.edu.
Mark A. Perazella, Email: mark.perazella@yale.edu.
Nikhil Singh, Email: nikhil.singh@yale.edu.
Wassim Obeid, Email: wassim.obeid@jhu.edu.
Haiqun Lin, Email: haiqun.lin@yale.edu.
Michael Kuperman, Email: michael.kuperman@arkanalabs.com.
Gilbert W. Moeckel, Email: gilbert.moeckel@yale.edu.
Michael Kashgarian, Email: michael.kashgarian@yale.edu.
Lloyd G. Cantley, Email: lloyd.cantley@yale.edu.
Chirag R. Parikh, Email: chirag.parikh@jhmi.edu.
References
- 1.Chawla LS, et al. Acute kidney disease and renal recovery: consensus report of the Acute Disease Quality Initiative (ADQI) 16 Workgroup. Nat Rev Nephrol. 2017;13(4):241–257. doi: 10.1038/nrneph.2017.2. [DOI] [PubMed] [Google Scholar]
- 2.Nochaiwong S, et al. The association between proton pump inhibitor use and the risk of adverse kidney outcomes: a systematic review and meta-analysis. Nephrol Dial Transplant. 2018;33(2):331–342. doi: 10.1093/ndt/gfw470. [DOI] [PubMed] [Google Scholar]
- 3.Lazarus B, et al. Proton pump inhibitor use and the risk of chronic kidney disease. JAMA Intern Med. 2016;176(2):238–246. doi: 10.1001/jamainternmed.2015.7193. [DOI] [PMC free article] [PubMed] [Google Scholar]
- 4.Xie Y, Bowe B, Li T, Xian H, Balasubramanian S, Al-Aly Z. Proton pump inhibitors and risk of incident CKD and progression to ESRD. J Am Soc Nephrol. 2016;27(10):3153–3163. doi: 10.1681/ASN.2015121377. [DOI] [PMC free article] [PubMed] [Google Scholar]
- 5.Peng YC, Lin CL, Yeh HZ, Chang CS, Wu YL, Kao CH. Association between the use of proton pump inhibitors and the risk of ESRD in renal diseases: A Population-Based, Case-Control Study. Medicine (Baltimore) 2016;95(15):e3363. doi: 10.1097/MD.0000000000003363. [DOI] [PMC free article] [PubMed] [Google Scholar]
- 6.Muriithi AK, et al. Biopsy-proven acute interstitial nephritis, 1993-2011: a case series. Am J Kidney Dis. 2014;64(4):558–566. doi: 10.1053/j.ajkd.2014.04.027. [DOI] [PubMed] [Google Scholar]
- 7.Shirali AC, Perazella MA, Gettinger S. Association of acute interstitial nephritis with programmed cell death 1 inhibitor therapy in lung cancer patients. Am J Kidney Dis. 2016;68(2):287–291. doi: 10.1053/j.ajkd.2016.02.057. [DOI] [PubMed] [Google Scholar]
- 8.Perazella MA. Clinical approach to diagnosing acute and chronic tubulointerstitial disease. Adv Chronic Kidney Dis. 2017;24(2):57–63. doi: 10.1053/j.ackd.2016.08.003. [DOI] [PubMed] [Google Scholar]
- 9.Moledina DG, et al. Kidney biopsy-related complications in hospitalized patients with acute kidney disease. Clin J Am Soc Nephrol. 2018;13(11):1633–1640. doi: 10.2215/CJN.04910418. [DOI] [PMC free article] [PubMed] [Google Scholar]
- 10.Korbet SM, Gashti CN, Evans JK, Whittier WL. Risk of percutaneous renal biopsy of native kidneys in the evaluation of acute kidney injury. Clin Kidney J. 2018;11(5):610–615. doi: 10.1093/ckj/sfy048. [DOI] [PMC free article] [PubMed] [Google Scholar]
- 11.Liapis H, et al. Banff histopathological consensus criteria for preimplantation kidney biopsies. Am J Transplant. 2017;17(1):140–150. doi: 10.1111/ajt.13929. [DOI] [PMC free article] [PubMed] [Google Scholar]
- 12.Muriithi AK, et al. Clinical characteristics, causes and outcomes of acute interstitial nephritis in the elderly. Kidney Int. 2015;87(2):458–464. doi: 10.1038/ki.2014.294. [DOI] [PubMed] [Google Scholar]
- 13.D’Agati VD, Theise ND, Pirani CL, Knowles DM, Appel GB. Interstitial nephritis related to nonsteroidal anti-inflammatory agents and beta-lactam antibiotics: a comparative study of the interstitial infiltrates using monoclonal antibodies. Mod Pathol. 1989;2(4):390–396. [PubMed] [Google Scholar]
- 14.Spanou Z, et al. Involvement of drug-specific T cells in acute drug-induced interstitial nephritis. J Am Soc Nephrol. 2006;17(10):2919–2927. doi: 10.1681/ASN.2006050418. [DOI] [PubMed] [Google Scholar]
- 15.Ciprandi G, De Amici M, Giunta V, Marseglia A, Marseglia G. Serum interleukin-9 levels are associated with clinical severity in children with atopic dermatitis. Pediatr Dermatol. 2013;30(2):222–225. doi: 10.1111/j.1525-1470.2012.01766.x. [DOI] [PubMed] [Google Scholar]
- 16.Yao W, et al. Interleukin-9 is required for allergic airway inflammation mediated by the cytokine TSLP. Immunity. 2013;38(2):360–372. doi: 10.1016/j.immuni.2013.01.007. [DOI] [PMC free article] [PubMed] [Google Scholar]
- 17.Chen CY, et al. Induction of interleukin-9-producing mucosal mast cells promotes susceptibility to IgE-mediated experimental food allergy. Immunity. 2015;43(4):788–802. doi: 10.1016/j.immuni.2015.08.020. [DOI] [PMC free article] [PubMed] [Google Scholar]
- 18.Godfraind C, et al. Intraepithelial infiltration by mast cells with both connective tissue-type and mucosal-type characteristics in gut, trachea, and kidneys of IL-9 transgenic mice. J Immunol. 1998;160(8):3989–3996. [PubMed] [Google Scholar]
- 19.Gordon JR, Galli SJ. Mast cells as a source of both preformed and immunologically inducible TNF-α/cachectin. Nature. 1990;346(6281):274–276. doi: 10.1038/346274a0. [DOI] [PubMed] [Google Scholar]
- 20.Kim YS, et al. Mast cells play a key role in the development of late airway hyperresponsiveness through TNF-α in a murine model of asthma. Eur J Immunol. 2007;37(4):1107–1115. doi: 10.1002/eji.200636612. [DOI] [PubMed] [Google Scholar]
- 21.Zand L, et al. The role of type I hypersensitivity reaction and IgE-mediated mast cell activation in acute interstitial nephritis. Clin Nephrol. 2015;84(3):138–144. doi: 10.5414/CN108254. [DOI] [PubMed] [Google Scholar]
- 22.Muriithi AK, Nasr SH, Leung N. Utility of urine eosinophils in the diagnosis of acute interstitial nephritis. Clin J Am Soc Nephrol. 2013;8(11):1857–1862. doi: 10.2215/CJN.01330213. [DOI] [PMC free article] [PubMed] [Google Scholar]
- 23.Barisoni L, et al. Reproducibility of the NEPTUNE descriptor-based scoring system on whole-slide images and histologic and ultrastructural digital images. Mod Pathol. 2016;29(7):671–684. doi: 10.1038/modpathol.2016.58. [DOI] [PMC free article] [PubMed] [Google Scholar]
- 24.Moledina DG, et al. A survey of patient attitudes toward participation in biopsy-based kidney research. Kidney Int Rep. 2018;3(2):412–416. doi: 10.1016/j.ekir.2017.11.008. [DOI] [PMC free article] [PubMed] [Google Scholar]
- 25.Kellun JA, et al. KDIGO clinical practice guideline for acute kidney injury. Kidney Int. 2012;2(suppl 1):1–138. [Google Scholar]
- 26.Chu R, Li C, Wang S, Zou W, Liu G, Yang L. Assessment of KDIGO definitions in patients with histopathologic evidence of acute renal disease. Clin J Am Soc Nephrol. 2014;9(7):1175–1182. doi: 10.2215/CJN.06150613. [DOI] [PMC free article] [PubMed] [Google Scholar]
- 27.Nadkarni PM, Kemp R, Parikh CR. Leveraging a clinical research information system to assist biospecimen data and workflow management: a hybrid approach. J Clin Bioinforma. 2011;1:22. doi: 10.1186/2043-9113-1-22. [DOI] [PMC free article] [PubMed] [Google Scholar]
- 28.Fleiss JL, Nee JCM, Landis JR. Large sample variance of kappa in the case of different sets of raters. Psychological Bulletin. 1979;86(5):974–977. doi: 10.1037/0033-2909.86.5.974. [DOI] [Google Scholar]
- 29.Perazella MA. Diagnosing drug-induced AIN in the hospitalized patient: a challenge for the clinician. Clin Nephrol. 2014;81(6):381–388. doi: 10.5414/CN108301. [DOI] [PMC free article] [PubMed] [Google Scholar]
- 30.Moledina DG, Perazella MA. PPIs and kidney disease: from AIN to CKD. J Nephrol. 2016;29(5):611–616. doi: 10.1007/s40620-016-0309-2. [DOI] [PubMed] [Google Scholar]
- 31.Pencina MJ, D’Agostino RB, D’Agostino RB, Vasan RS. Evaluating the added predictive ability of a new marker: from area under the ROC curve to reclassification and beyond. Stat Med. 2008;27(2):157–172. doi: 10.1002/sim.2929. [DOI] [PubMed] [Google Scholar]
Associated Data
This section collects any data citations, data availability statements, or supplementary materials included in this article.


