

Abstract
Adipose tissue macrophages (ATMs) are crucial for maintaining adipose tissue homeostasis and mediating obesity-induced metabolic abnormalities, including prediabetic conditions and type 2 diabetes mellitus. Despite their key functions in regulating adipose tissue metabolic and immunologic homeostasis under normal and obese conditions, a high-resolution transcriptome annotation system that can capture ATM multifaceted activation profiles has not yet been developed. This is primarily attributed to the complexity of their differentiation/activation process in adipose tissue and their diverse activation profiles in response to microenvironmental cues. Although the concept of multifaceted macrophage action is well accepted, no current model precisely depicts their dynamically regulated in vivo features. To address this knowledge gap, we generated single-cell transcriptome data from primary bone marrow–derived macrophages under polarizing and nonpolarizing conditions to develop new high-resolution algorithms. The outcome was the creation of a 2-index platform, MacSpectrum (https://macspectrum.uconn.edu), that enables comprehensive high-resolution mapping of macrophage activation states from diverse mixed cell populations. MacSpectrum captured dynamic transitions of macrophage subpopulations under both in vitro and in vivo conditions. Importantly, MacSpectrum revealed unique signature gene sets in ATMs and circulating monocytes that displayed significant correlation with BMI and homeostasis model assessment of insulin resistance (HOMA-IR) in obese human patients. Thus, MacSpectrum provides unprecedented resolution to decode macrophage heterogeneity and will open new areas of clinical translation.
Keywords: Inflammation, Metabolism
Keywords: Diabetes, Macrophages, Obesity
Single-cell transcriptomics based MacSpectrum enabled fine-mapping of monocyte/macrophage activation states with high resolution and revealed a unique diabetic signature in obesity.
Introduction
Adipose tissue inflammation and systemic insulin resistance are the hallmarks of obesity and causal factors of obesity-induced metabolic disorders such as prediabetic conditions and type 2 diabetes mellitus (T2DM). Adipose tissue macrophages (ATMs) are the most abundant immune population in obese visceral adipose tissue and play a central role in modulating adipose tissue function and homeostasis. The plasticity of macrophages allows swift, fine-tuned, and diverse responses to execute crucial functions during pathogen infection and tissue homeostasis. Such plasticity coupled with dynamic tissue- and stress-specific responses generates highly heterogeneous macrophage subpopulations with phenotypic complexity that is difficult to characterize. This challenge is exemplified by the confusing and conflicting results obtained when macrophages are characterized as single populations from specific tissues or in response to pathogenic challenges. The inability to define specific functional macrophage populations may underlie failures in the development of effective disease therapies; therefore, new approaches are needed (1).
Several models proposed to understand macrophage function define cells by either pathogen/antigen-specific responses or tissue-specific outcomes (1–3). The most popular macrophage polarization model separates macrophages into classical (M1) and alternative (M2) activation states, based on responses elicited by T helper 1 (Th1) (or other pathogens) and Th2 cell–derived cytokines, respectively (4–7). Other models separate M1 and M2 into subtypes based on limited features examined in different contexts (8). However, no currently available model allows comprehensive annotation of complex macrophage features under different conditions (9). Advances in high-throughput sequencing technologies allow in-depth analyses of cell populations to identify distinct subsets and dissect regulatory mechanisms underlying cell function. However, currently available algorithms that perform comparisons of transcriptomes from whole populations are unable to define complex and subtle differences among subpopulations within one lineage, and have even less capacity to characterize the dynamic activation-state changes of each subpopulation. Hence, the results are often ambiguous when macrophages are analyzed as bulk samples using these methods, which weakens our understanding of human macrophages.
To identify critical signaling networks governing ATM action under healthy or obese conditions, we generated single-cell transcriptome data to develop new algorithms for high-resolution macrophage analysis. This resulted in the creation of a macrophage annotation platform, MacSpectrum (https://macspectrum.uconn.edu) that can differentiate macrophage subpopulations by polarized activation state and terminal maturation (Table 1) stage. The 2 newly developed algorithms that drive MacSpectrum, the macrophage polarization index (MPI) and the activation-induced macrophage differentiation index (AMDI) (Table 1), enable full-spectrum coverage and high-resolution annotation of macrophage subpopulations in vivo through the fine-mapping of each cell to a well-supported inflammatory or “terminal maturation” state. MacSpectrum divided ATMs into M1-like, M2-like, transitional, and preactivation phenotypes to allow further characterization. More importantly, MacSpectrum revealed unprecedented information about macrophage responses under obese conditions, including regulatory factors, signaling pathways, and diabetes-specific signature genes.
Table 1. Description of terms used in the present study.

With the increased severity of the obesity pandemic and its associated risk of T2DM, a practical challenge is to identify novel biomarkers in circulating monocytes, the most convenient venue for clinical diagnosis. Although great investments have been made, it remains difficult to identify functionally relevant biomarkers that directly contribute to T2DM pathogenesis in the ever-expanding obese population. Toward this goal, we analyzed CD14+ ATMs and circulating monocytes from obese patients using MacSpectrum and identified several biomarkers that correlated with high significance to diabetic phenotypes.
Thus, MacSpectrum provides what we believe is a novel and comprehensive platform to annotate macrophage function and dissect diverse programs under sophisticated conditions in vivo, a major challenge in macrophage biology.
Results
Conventional analysis of single-cell RNA sequencing data revealed nonoverlapping cell cluster distribution between primary ATMs and the in vitro bone marrow–derived macrophage polarization system.
ATMs are the most abundant immune population in white visceral fat (10) and are known to play crucial roles in maintaining adipose tissue function and immunological homeostasis (11). ATMs increase significantly in quantity and proportion in obese visceral fat (12), while the whole ATM population has been shown to shift from a less inflammatory M2-like activation state to a proinflammatory M1-like activation state (13). Nevertheless, despite transcriptome profiles of ATMs previously documented in different studies (14–16), no known transcriptome annotation tool allows full-spectrum capture of the dynamic action of macrophages in vivo or depiction of the dynamic yet distinct activation programs of ATMs under healthy or obese conditions. To fill this knowledge gap, we performed single-cell RNA sequencing (scRNA-seq) analyses of purified ATMs (CD45+CD11b+F4/80+) from diet-induced obese or normal chow diet–fed lean mice. In parallel, to facilitate characterization of ATM subpopulations with respect to activation and terminal differentiation states, we also generated scRNA-seq profiles of the in vitro polarization system, a well-established model where primary bone marrow–derived macrophages (BMDMs) are stimulated with robust polarization conditions: unstimulated for M0, IFN-γ plus LPS for M1, and IL-4 plus IL-13 for M2 (Figure 1A).
Figure 1. scRNA-seq profiles of cultured M0, M1, and M2 BMDMs and ATMs from lean and obese mice.

(A) scRNA-seq scheme. Cultured M0, M1, and M2 BMDMs were barcoded separately and processed together for scRNA-seq. ATMs from lean and obese mice were barcoded separately and processed together for scRNA-seq. (B and C) t-SNE clustering of scRNA-seq from 6979 M0, 4736 M1, and 6391 M2 BMDMs (B), and combined data from BMDMs (M0, M1, and M2) and 1710 lean and 1758 obese ATMs (C). (D) Expression of macrophage lineage markers (left panel), and well-known M1 (middle panel) and M2 markers (right panel) by t-SNE plots.
scRNA-seq profiles were analyzed using CellRanger, which was developed using the widely accepted t-distributed stochastic neighbor embedding (t-SNE) algorithm, to focus on similarity comparisons at the whole-transcriptome level. Three distinct BMDM cell clusters were identified using t-SNE that were consistent with the anticipated treatments in culture (Figure 1B), and were validated by the presence of mature macrophage signature genes (CD45, Adgre1 [F4/80], Lyz2) and their polarization signature gene expression patterns (e.g., Nos2, CD86, and Tnf for M1; Ym1, Arg1, Fizz-1, and Mgl2 for M2) (Figure 1D). However, when this strategy was applied using scRNA-seq profiles from ATMs isolated from obese or lean murine visceral adipose tissue, our t-SNE analysis yielded a very different pattern that featured unevenly distributed and poorly separated cells (Figure 1C and Supplemental Figure 1B; supplemental material available online with this article; https://doi.org/10.1172/jci.insight.126453DS1). Moreover, several classic M1/M2 signature genes were rarely expressed in ATMs and/or presented no obvious differences between lean and obese populations (Supplemental Figure 1C), despite that the latter was suggested to contain more M1-like subsets, as was identified using other classic M1 markers (17). These findings and those from more recent studies highlight the inadequacy of the classic model in characterizing macrophage populations (14, 18). Currently available methods (such as t-SNE and PCA) used to analyze these data focus on similarity comparisons at the whole-transcriptome level, with limited knowledge of details to capture complex biological function, and thus are inefficient at capturing relatively subtle differences within a population, such as multiple activation states of macrophages, and indeed, such limitations of current algorithms have been recently realized and discussed (19). Thus, to understand the molecular differences between some macrophage cell populations, higher-resolution methods are required.
MPI characterized the dynamic activation waves of macrophage responses in vitro.
To generate a platform tailored to capture the dynamic yet relatively subtle differences at the whole-transcriptome level among macrophage subpopulations, we took advantage of scRNA-seq profiles from the BMDM polarization system. We first performed a series of calculations to identify a gene set that could clearly separate M1 and M2 cells and retained the highest inclusion of the most differentially expressed genes (see Methods for details). Groups of top-ranked genes with preferential expression in M1 or M2 samples (FDR-adjusted P value < 1 × 10⁻¹⁰, detectable frequency > 1%, unique molecular identifier [UMI] > 1) were selected to calculate the similarity of each cell to the average UMI in either M1 or M2 samples using a method modified from Pearson’s correlation (Supplemental Figure 2 and Methods). Among all tested groups, the top 500 most differentially expressed genes were selected as the “polarization signature genes” (PSGs) (Table 1) because they allowed for efficient separation and yet retained effective gene coverage between M1 and M2 samples (Figure 2A). Next, we generated a linear regression line of all scRNA-seq profiles plotted by the correlation to M1 or M2 average expression levels of the PSGs (rm1, rm2), which we termed the “polarization axis” (Figure 2, B and C, and Table 1). Each cell was then assigned an MPI value with adjusted distance of their projection point to the starting point of the polarization axis (see Methods for details) (Figure 2C). We observed that M1 and M2 samples were well separated along the polarization axis and classic M1 and M2 markers displayed predicted correlations with MPI values (Figure 2, D and F, and Supplemental Table 1): higher MPI suggests more M1-like (more inflammatory) states and lower MPI suggests more M2-like (less inflammatory) states. Ontology analysis revealed that the PSGs are enriched for cell signaling pathways that are well recognized as macrophage polarization regulators (Figure 2E).
Figure 2. Generation of the macrophage polarization index (MPI).

(A) rm1 versus rm2 contour plots of 4736 M1 and M2 BMDMs using the top 500 most differentially expressed (absolute fold change) and significantly changed genes (FDR-adjusted P < 1 × 10⁻¹⁰) (PSG). (B) Polarization axis is the regression line of transcriptomes to M1 (rm1) or M2 gene sets (rm2). (C) MPI is calculated as l = P – P0. (D) Macrophage distributions along the MPI scale. (E) PSG-enriched pathways. (F) Heatmap of PSG. Known markers for M1 or M2 are indicated; complete gene list is in Supplemental Table 1. (G and H) MPI density distributions of human PBMC-derived macrophages stimulated with IFN-γ (GSE82227) (67) (G) and murine BMDMs after Salmonella exposure (GSE65528) (83) (H).
To evaluate the efficacy of MPI in deciphering macrophage activation states, we tested our model with several publicly available macrophage transcriptome data sets from other research groups that included human or murine macrophages challenged with different stimuli (www.ncbi.nlm.nih.gov/geo/). Interestingly, application of MPI not only demonstrated the activation states of macrophages in these experiments, but also revealed features in a more comprehensive and clearer way compared with previous experiments, such as a clear sequential “activation wave” of human (Figure 2G) or mouse (Figure 2H) macrophages from early to late time points after stimulation (Supplemental Figure 3). Thus, these validation tests supported the efficacy of MPI to annotate either murine or human macrophage activation states.
AMDI captures transition from preactivated to activated macrophages.
Next, we developed a second index, AMDI, to annotate the process from preactivation states (M0) toward fully activated and matured macrophages (M1/M2). Heterogeneity of tissue macrophages is not only defined by diverse activation states, but also by terminal maturation, i.e., how complete the activation process is. Studies suggest that tissue macrophages are derived from either embryonic or bone marrow precursors (20–22). Embryonic-origin tissue-resident macrophages are considered fully mature populations that maintain homeostasis (23). Under stress conditions, monocytes can also be recruited to tissues and transition into macrophages that either replenish the homeostasis-maintaining tissue-resident population or undergo activation to orchestrate inflammatory responses (20–22). Thus, to enable comprehensive investigations of in vivo–derived macrophages under normal or disease conditions, we created an index for macrophage terminal maturity. Indeed, comparison of whole transcriptomes among M0, M1, and M2 BMDMs revealed higher similarity between M0 and M2 than either M0 and M1 or M2 and M1 (Figure 3, A and B). Furthermore, MPI application successfully identified the M1 population but failed to distinguish M0 and M2 (Supplemental Figure 4A), suggesting that genes other than PSGs were responsible for the M0 to M2 terminal differentiation process.
Figure 3. Comparison of BMDM scRNA-seq profiles.

(A) Similarity analyses of individual cells in M0, M1, and M2 BMDM samples were calculated using whole transcriptomes. An equal number (4736) of cells were randomly selected from each population; rows and columns represent individual cells from the 2 populations being compared, and the color of their crossing point represents adjusted correlation coefficient r; higher (yellow) and lower (blue) r suggest higher and lower similarity, respectively. (B) Bulk similarities between the M0, M1, and M2 BMDM populations as in A. Distances between populations are indicated next to the connecting lines; longer distances indicate more different from each other.
Thus, we extracted a list of genes that correlated with macrophage terminal maturation but not polarized activation (see Methods for details), resulting in a total of 435 genes that we defined as “activation-induced macrophage differentiation signature genes” (AMDSGs) (Table 1). Ontology analysis confirmed that these genes were highly enriched for factors significantly altered during macrophage terminal maturation (e.g., Csf1r, Cebpb, Cd274, Itga4, etc.; refs. 24–27, respectively), canonical signaling pathways for cell cycle control, and development of macrophage functions (antigen presentation, communication between innate and adaptive immune cells, etc.; Figure 4A). Using the AMDSGs, we calculated the similarities between the averaged M0 BMDM gene expression and each BMDM cell (rm0) and found that cells with higher rm0 indicated higher similarity to M0 BMDMs; this indicated a preactivation and more immature phenotype, whereas cells with negative rm0 (–rm0) suggested less similarity to M0 cells, hence a more mature state. Accordingly, each cell was assigned an AMDI value (see Methods for details) to depict their relative maturity as a macrophage (Figure 4B). Furthermore, compared with unsupervised clustering with whole transcriptome (Figure 1D), t-SNE analyses using PSG and AMDSG gene sets presented lean or obese ATMs with cell clusters either overlapping with or close to BMDM clusters, suggesting features that are more comparable to ex vivo culture systems (Supplemental Figure 4B).
Figure 4. Generation of the activation-induced macrophage differentiation index (AMDI).

(A) Pathways significantly enriched in the 435 AMDSGs. (B) Macrophage distributions along the AMDI scale. (C and D) Single-cell trajectory of M0, M1, and M2 BMDMs (4736 cells/sample) with Monocle (30) using PSGs and AMDSGs colored by BMDM population (C) or pseudotime (D). (E) Heatmap showing smoothened relative expression of PSGs and AMDSGs along pseudotime progression, from M0 to M1 and M2 branches of the single-cell trajectory. Known signature genes are indicated. Hierarchical clustering generated 6 expression groups: groups I and III enriched in M1, group II enriched in M2 or M1 and M2, groups V and VI enriched in M0, group IV enriched in M0 or M2.
Importantly, with the application of PSGs and AMDSGs, the 3 BMDM M0/M1/M2 cell populations were assigned to 3 separate branches when cell trajectory algorithms (28–30) were applied (Figure 4C); intriguingly, these aligned along a pseudotime progression scale, suggesting a mechanistic process where M0 cells precede M1 and M2 cells (30) (Figure 4D). PSGs and AMDSGs displayed significantly altered expression patterns within each branch as well (Figure 4E). In contrast, a cell trajectory plot built using whole transcriptomes presented substantial overlap between M0 and M2 BMDMs (Supplemental Figure 4C). In summary, compared with whole-transcriptome-based cell cluster characterization or cell trajectory analyses, application of PSGs/AMDSGs provided a fine-mapping strategy tailored to capture macrophage activation.
MacSpectrum incorporates MPI and AMDI to define ATM subpopulations in obesity.
To enable a comprehensive depiction of macrophage activation and terminal maturation states, we incorporated the 2 newly created indices, MPI and AMDI, to establish the MacSpectrum platform (www.macspectrum.uconn.edu). Based on the combined relative values of MPI and AMDI for macrophages, we designated cells in each region of the MacSpectrum plot as A, “M2-like”; B, “M1-like”; C, “transitional M1-like”; and D, “preactivation” (Figure 5A). As expected, application of MacSpectrum successfully distinguished all 3 BMDM activation states, M0, M1, and M2 (Supplemental Figure 4, D and E). We next tested the ability of MacSpectrum to annotate complex in vivo macrophage states from scRNA-seq data sets that recorded artery macrophage responses under atherosclerotic (baseline) or regression conditions (GSE97941) (31). Integrating MPI and AMDI, MacSpectrum effectively depicted a dynamic macrophage subpopulation compositional change from atherosclerotic (baseline) to regression conditions, where a highly matured (high AMDI) and inflamed (high MPI) macrophage pattern transitioned to a more nonactivated and less inflammatory pattern (low AMDI and MPI, region D) (Supplemental Figure 4F), which was consistent with the original publication (31). Thus, these results suggest that the MacSpectrum model developed with expression changes of PSGs and AMDSGs was able to capture characteristic features of macrophages and effectively drive their separation into distinct subpopulations.
Figure 5. MacSpectrum characterization of visceral ATM subsets from lean and obese mice.

(A) Macrophage subsets on the MacSpectrum plot were designated as A,“M2-like”; B, “M1-like”; C, “transitional M1-like”; and D, “preactivation”. (B) MacSpectrum plot of 1710 lean and 1758 obese ATMs with percentages calculated for each region (A, B, C, or D). (C) Pathways enriched in lean (L) and obese (O) region-specific (A, B, C, or D) subpopulations. (D) Heatmap of ATM signature genes identified using MacSpectrum. Each gene was plotted as one row along MPI; all genes arranged by hierarchical clustering.
Next, we applied MacSpectrum to scRNA-seq profiles of ATMs to dissect their functional contribution to tissue homeostatic maintenance and actions under stress (Figure 5, B–D). ATMs are the most abundant immune cells in white visceral fat (10) and play crucial roles in maintaining adipose tissue function and immunological homeostasis (11). ATMs increase significantly in quantity and proportion in obese visceral stroma, and the whole ATM population has been shown to shift from a less inflammatory M2-like to a proinflammatory M1-like activation state (13). Given such a distinct phenotypic shift and proportional change between M1-/M2-like states in lean and obese ATMs, single-cell transcriptome analysis would be expected to display clear clusters of M1 or M2 cells. In practice, however, lean and obese ATMs analyzed using the t-SNE algorithm overlapped with themselves in a cluster that was separate from polarized M1 or M2 BMDM clusters (Figure 1D and Supplemental Table 1). Of note, classic M1/M2 signature genes were rarely or weakly expressed in ATMs and/or presented no obvious enrichment in either lean or obese populations (Supplemental Figure 1C), despite a report that obese ATMs contain more M1-like subsets (17).
MacSpectrum successfully identified various ATM populations with distinct activation and maturation states (Figure 5B and Supplemental Figure 5, A–D). Specifically, ATMs from lean tissue were predominantly enriched in region A, defined by cells with high AMDI and low MPI, while ATMs from obese tissue displayed a diversified profile with cells clustered in all 4 regions (Figure 5B). Compared with ATMs from lean mice, ATMs from obese mice had an overall increased proportion of cells with high MPI, and thus a greater proinflammatory activation status.
To precisely characterize ATM subpopulation properties and functions, we performed gene ontology and pathway analyses on cells from each region (A–D) (Figure 5 and Supplemental Figure 6). Overall, obese-tissue ATMs presented enhanced proinflammatory profiles compared with ATMs from lean tissue and contained a significantly higher proportion of cells in regions B and C (high MPI) (Figure 5B). Of note, cells in region B (high MPI/high AMDI) primarily consisted of obese ATMs with mature and strong inflammatory properties (Figure 5C), while the obese-dominated region C showed similar gene signatures (Supplemental Figure 7, A and B) with a previously reported proinflammatory CD9+ ATM subpopulation found in obese mice (15), consistent with its high MPI values. On the other side of the spectrum, region D cells exhibited early maturity (lowest AMDI) and low inflammatory features (low MPI) among all the ATM subpopulations, which might represent more monocytic cells that are newly recruited from peripheral blood. However, their origin requires further study, especially for lean ATMs which are suggested to primarily derive from embryonic origins (32). Interestingly, the macrophage/dendritic cell differentiation regulators Spi1 (PU.1) and Zeb2 (33, 34) and their downstream target genes were enriched in regions C and B of the obese ATMs, respectively (Supplemental Figure 8, C and D). Moreover, previously reported dendritic cell signature genes (35) including Cd11c and several MHC class members were enriched in region B of the obese ATMs (Supplemental Figure 7C), indicating potential contribution of dendritic cells to obesity-induced adipose tissue inflammation. However, considering the often overlapping characteristics of dendritic cells and macrophages (36–38), the specific identity of those cells requires further investigation.
Based on these observations combined with gene ontology studies (Supplemental Figure 8, A and B), we propose a model of obesity-induced alterations in ATM subpopulations (Supplemental Figure 8E). In lean adipose tissue, preactivation and less mature macrophages (D) primarily develop into resident M2 cells (A) to carry out tissue maintenance functions (12, 20, 39, 40). In obese adipose tissue, metabolic and immunological cues in the white visceral adipose tissue enhance monocyte recruitment (20, 41), activate a portion of cells into resident M2 ATMs (A), and activate another portion of cells into an acute/strong (C) then later a tuned/moderate inflammation state (B) (Supplemental Figure 8E), resulting in obesity-induced adipose tissue inflammation.
MacSpectrum identifies unique gene sets in diabetic conditions in obesity.
Plasticity is a key feature of macrophages that allows activation of condition-specific functions through specific signaling pathways in response to diverse stimuli. The proportions of cells across the 4 regions of MacSpectrum (Figure 5A) dictate the overall macrophage population character under a given condition, and can be used to identify stimulation- or disease-specific signature genes. Taking advantage of MacSpectrum resolution for defining complex macrophage subpopulations in vivo, we performed several comparisons to identify genes that could represent early biomarkers for obesity-related conditions in humans. We first identified genes with preferential expression in (a) “preactivation” cells, by comparing obese versus lean ATMs in region D from mice; and (b) mature macrophages with polarized inflammatory states, by comparing obese ATMs in region B with lean ATMs in region A from mice. We then cross-compared these gene sets to identify signature genes expected to be involved in the early stages of obesity inflammation. Finally, to determine whether any of these genes correlated with human conditions related to obesity, we cross-compared these genes with those from (i) obese human patients with and without diabetes, and (ii) obese human patients before and after bariatric surgery.
As shown in Supplemental Figure 9A, a total of 603 mouse genes displayed significant differential expression in obese versus lean preactivation (region D) cells (P < 0.05, fold change > 1.5). Among them, over 60% of genes consistently displayed polarization-associated expression preference (385 out of 603 genes, P < 0.05, fold change > 1.5 comparing obese M1-like cells in region B vs. lean M2-like cells in region A). Interestingly, 436 genes expressing a distinct macrophage polarization pattern in murine ATMs also displayed significant differential expression (P < 0.05) in CD14+ cells isolated from obese human subjects with or without diabetes (GSE54350). Signaling pathway analysis of these genes revealed enriched TNFR, IL-8, and IL-1 inflammatory signaling pathways and those involved in oxidative stress response (Supplemental Figure 9B).
To evaluate the contribution of monocytes in the pathogenesis of obesity-induced T2DM, we selected preactivation cells in region D mapped by MacSpectrum for comparison to circulating monocyte profiles generated from obese patients who underwent bariatric surgery (an effective procedure to ameliorate obesity-induced insulin resistance and metabolic disorder risks). A total of 185 genes that displayed differential expression patterns in murine preactivation ATMs (obese vs. lean ATMs in region D) were also significantly altered (P < 0.05) in circulating monocytes isolated from 18 patients before or 3 months after surgery. To identify genes that are important for ATM polarization in murine obesity but also altered in human obese subjects with or without diabetes (GSE54350) or associated with improved metabolic stress (GSE32575), we cross-examined the lists of genes with significant expression differences (P < 0.05) in each comparison and identified a total of 23 gene candidates (Figure 6A and Supplemental Table 6). Gene ontology analyses of these genes indicated roles in both inflammatory and metabolic regulation of monocytes/macrophages (Supplemental Figure 9C). Among this set of genes, several were previously reported as diabetes-associated genes by different studies, such as Ercc1 (42–44), Comt (45), Clic1, Gpx1 (46–48), Rnaset2 (49), Tkt (50, 51), Sparc (52), Gpc3 (53), Prrx1 (54, 55), and Bdh2 (56, 57). In addition to these known diabetes-related genes, we also identified 13 genes that potentially contribute to T2DM development in obese populations. For example, PRKAG2 encodes a member of the noncatalytic subunit of AMP-activated protein kinase (AMPK) gamma unit family that mediates binding to AMP/ADP/ATP for activating/inhibiting AMPK function (58). The function of PRKAG2 has not been analyzed in T2DM; however, mutations of this gene may lead to Wolff-Parkinson-White syndrome and other glycogen storage diseases in heart (59).
Figure 6. MacSpectrum identified unique gene sets associated with diabetes conditions in obesity.

(A) Heatmap showing expression of the 23 gene candidates identified using MacSpectrum in blood monocytes of 18 obese patients before and after bariatric surgery. (B and C) Correlation coefficients (r) of the 23 gene candidates with patients’ BMI (B) and HOMA-IR (C). (D and E) Correlation (D) of PRKAG2, ERCC1, AMOTL2, and BDH2 with HOMA-IR and BMI and their microarray-determined relative expression (E) in visceral adipose tissue CD14+ cells from 12 obese patients with (Dia) or without diabetes (No Dia) (GSE54350). Data represent mean ± SEM. *P < 0.05, **P < 0.01 by 2-tailed Welch’s t test.
In our mega-analysis using MacSpectrum, we found that PRKAG2 displayed significant correlation with BMI (P < 0.05, r = 0.59) and homeostasis model assessment of insulin resistance (HOMA-IR) (P < 0.05, r = 0.41) in obese patients that underwent bariatric surgery (Figure 6, A–D), which concomitantly displayed an expression pattern preferentially in CD14+ ATMs from obese subjects with diabetes than those without diabetes (Figure 6E). AMOTL2, a protein encoded by another gene also less known to contribute to T2DM pathogenesis, can bind to angiostatin to modulate angiogenesis and cell-matrix remodeling through inhibition of the Wnt/β-catenin pathway (60). AMOTL2 was suppressed in obese diabetic subjects compared with nondiabetic subjects (Figure 6E); concomitantly, the expression pattern of AMOTL2 was negatively correlated with BMI (P < 0.05, r = –0.64) and HOMA-IR (P < 0.05, r = –0.49; Figure 6, A–D). Expression patterns in obese subjects with or without diabetes, the expression distribution with Pearson’s correlation values to BMI or HOMA-IR, and the functions involved in metabolic/inflammatory regulation of each gene in this 23-gene set are summarized in Supplemental Table 6. Taken together, our results identified a signature of markers that distinguish T2DM risk in obese subjects in circulating monocytes, suggesting their potential functional contribution to the pathogenesis of T2DM in obesity.
Discussion
Macrophages are often the most dominant tissue immune cells that contribute to both tissue homeostasis and diseases. Under normal conditions, macrophages primarily maintain a noninflammatory state by facilitating tissue regeneration and wound healing. In response to immune challenges, macrophages are essential to innate immunity, with a diversified and quick response to invading pathogens and an ability to clear autologous tissue waste. Macrophages in various tissues may have either embryonic or bone marrow–derived hematopoietic origins, but their function in maintaining tissue homeostasis or responding to acute or chronic stress may be interchangeable (61–64). Given the important function of macrophages and their direct link to circulating monocyte recruitment under stress conditions, researchers have invested great efforts to delineate their diversified phenotypes and swift responses to both systemic and tissue microenvironmental cues. However, while functional annotation of macrophages in vivo is both necessary and heavily pursued, the precise landscape of macrophages in tissues under both healthy or stress conditions remains vague.
Technologies such as scRNA-seq have the potential to advance our understanding of macrophages in vivo by facilitating investigations into macrophage maturation and activation states at the individual cell level. However, current algorithms for mining such data rely on similarities and differences at the overall transcriptome level. Compared with features that define cell lineages, signals altered during macrophage terminal maturation and activation are relatively less distinct, as we observed in this study and others have pointed out as one of the major computational challenges in scRNA-seq clustering (19). To address this technical challenge, we generated a platform, MacSpectrum, specifically designed to capture macrophage dynamic changes during tissue infiltration and activation by incorporating original algorithms and scRNA-seq profiles from multiple macrophage data sets. Based on 2 created indices, MPI and AMDI, that fine-map each macrophage with a combination of terminal maturity and polarization states, MacSpectrum enables effective macrophage functional annotation with high resolution and sensitivity. The capability of MacSpectrum to segregate macrophage heterogeneity was well supported by its performance on samples from human and murine species, under in vitro and in vivo conditions, and in bulk and single-cell sequencing formats. The spectrum-like model of macrophage activation states revealed in the present study is consistent with previous studies (15, 65, 66), and MacSpectrum further provides quantitative indices that more finely map each macrophage, and thus will enable researchers to define macrophage subpopulations with high resolution that encompass inflammatory/antiinflammatory states as well as intermediate subpopulations from complex in vivo microenvironments under normal or stressed/diseased conditions. It should be noted that there are other features of macrophages, such as origins (e.g., bone marrow– vs. yolk sac–derived), that cannot be deciphered by MacSpectrum currently. In addition, the performance of MacSpectrum with human data sets will need to be examined more thoroughly to address several challenges, which include limited human monocyte/macrophage data availability, procedural variations, small sample sizes, and large variations in individual medical backgrounds.
Although MacSpectrum was built on murine macrophage (BMDM) gene expression profiles, the application strategy we developed does not rely on similarity comparisons between samples from one study (such as murine BMDMs, our starting point) to those from another study (any other mouse or human monocyte/macrophage study). The MacSpectrum strategy involves using signature gene lists, novel algorithms, and study-specific data to build indices. We generated 2 comprehensive signature gene lists (PSGs and AMSDGs; >400 genes each) that are most relevant to macrophage action based on a strong BMDM polarization model. Then, when MacSpectrum is applied to analyze any other macrophage/monocyte study, gene IDs from the PSGs and AMSDGs are extracted from the study data to be analyzed and their expression levels are used to calculate the MPI and AMDI indices, respectively. Thus, values of MPI and AMDI for each sample are only relative within the same study to capture the unique activation features for each study context. To test the efficacy of MacSpectrum, we rigorously tested its ability to annotate human macrophages under various physiological and pathogenic conditions. We have compared multiple sets of transcriptome profiles from human monocytes/macrophages that were isolated from different physiological conditions or exposed to various pathogens (GSE82227, GSE32575, GSE54350, GSE36952, and GSE92495; refs. 67–71, respectively). We found that close to 80% of expressed genes were shared by murine or human macrophages, consistent with previously reported conservation between monocytes/macrophages of the 2 species (72, 73). More importantly, these genes also displayed comparable expression patterns during activation (Figures 2 and 6, Supplemental Figures 3 and 9, Supplemental Table 6, and data not shown). Of note, these data were also generated using different platforms, such as microarray, conventional RNA-seq, or scRNA-seq, suggesting MacSpectrum exhibits tolerance for analyzing transcriptome profiles across techniques with varying depths. Thus, MacSpectrum displayed high potential to characterize monocyte/macrophage actions in both human and mouse models under normal or disease conditions. At its current stage, due to limitations of profiling technology, MacSpectrum aims to provide fine-mapping information of monocytes/macrophages within each study, rather than cross-study comparisons. We acknowledge that the model can be further strengthened and applied to human diseases when more unified standards in the profiling technology and more monocyte/macrophage data sets are available.
In addition to consistent identification of known features, MacSpectrum demonstrated great potential for uncovering novel characteristics of macrophages in tissues, as well as stimulation-specific gene sets. Under conditions of acute or chronic stress, circulating monocytes are recruited into tissues and subsequently undergo terminal differentiation and activation upon exposure to microenvironmental cues. Chronic inflammation is a hallmark of obesity and a risk factor for obesity-induced T2DM; this is accompanied by systemic metabolic and inflammatory exposure to circulating monocytes before their recruitment to obese adipose tissue, which may contribute to further differentiation and activation of the process locally. Therefore, it is not surprising to identify genes sharing similar expression preference in ATMs and circulating monocytes that allow for differential diabetic states in obese subjects.
Indeed, several studies have defined links between obesity, inflammation, circulating monocytes, and differential gene expression. Obesity can induce changes in miR expression in circulating monocytes; miR-146b-5p, which decreased in monocytes during obesity, is a major mediator of the antiinflammatory action of globular adiponectin (74). A separate study found an association between COX4I1 depression, insulin resistance, and T2DM in obesity (75), and its expression in monocytes reflected that in adipose tissues. In addition, researchers observed equal changes in abdominal adipose tissues from obese diabetic humans and mice.
These results support MacSpectrum as a framework to readily annotate previous macrophage classifications (e.g., M1 vs. M2) and as a systematic approach for dissecting the “many alternative faces of macrophage activation” (76). Clear separation of diverse macrophage populations along with functional annotation and identification of underlying tissue- or disease-specific gene signatures, as we initiated here for diabetes, will facilitate more focused therapeutic development. The data processing pipe of MacSpectrum is summarized in Figure 7.
Figure 7. Scheme showing the data processing pipeline of MacSpectrum.

MacSpectrum enabled fine-mapping of individual cells with respect to their terminal maturity and polarization states, and therefore allowed the comprehensive analysis of tissue macrophages. The shift of each macrophage subpopulation along the MPI and AMDI axes also facilitated a more precise annotation of the overall macrophage subpopulation dynamic under various physiological conditions. Of note, macrophage transcriptional activation programs are loyal to the outcomes imposed by specific stimuli, which are often multifactorial and with various magnitudes. Therefore, we expect to observe tissue- or disease-specific features when analyzing macrophages. Indeed, we observed that top-ranked genes display MPI and AMDI correlations while sharing less than 15% overall commonality between macrophages from visceral adipose tissue in diet-induced obesity and aorta macrophages isolated from an atherosclerosis model (data not shown). Therefore, stimulation-specific gene sets should be studied with different disease and tissue contexts, which is our future plan to further optimize the MacSpectrum system. This will facilitate the enhanced characterization of macrophages as well as other heterogeneous cell populations.
Methods
Patients and ethics statement
Human data collected in a previous study (68) were provided for our mega-analyses in this study. In summary, the original study (68) complies with the Declaration of Helsinki and the Medical Ethics Committee of the Katholieke Universiteit Leuven approved the study protocol (68). As stated in the previous study (68), all human participants gave written informed consent. The cohort comprised 18 obese individuals without clinical symptoms of cardiovascular disease (BMI: 45.1 ± 1.4 kg/m2, P < 0.001 compared with lean controls). These 18 morbidly obese subjects were referred to the hospital for bariatric surgery. Before they were included, individuals were evaluated by an endocrinologist, an abdominal surgeon, a psychologist, and a dietician. Only after multidisciplinary deliberation did the selected patients receive a laparoscopic Roux-en-Y gastric bypass (bariatric surgery) (68). CD14+ monocytes were collected before and 3 months after bariatric surgery (BMI: 37.5 ± 1.3 kg/m2, P < 0.001 compared with before weight loss), total RNA was extracted from these cells, and genome-wide expression analysis was performed. Insulin resistance was calculated as follows: HOMA = fasting plasma insulin (mU/l) × fasting blood glucose (mM)/22.5. The samples were collected between March 29, 2005 and May 30, 2006.
Animals
Mice (C57BL/6J) were purchased from The Jackson Laboratory (stock no. 000664), housed in a 12-hour light/12-hour dark cycle, and provided ad libitum access to food and water for the duration of the study unless stated otherwise. Male mice 5–6 weeks of age were used for feeding analyses. For dietary feeding studies, mice were fed with a high-fat diet (HFD; 60% fat calories, 20% protein calories, and 20% carbohydrate calories; catalog D12492, Research Diets, Inc.) or Teklad standard chow diet (18% fat calories, 24% protein calories, and 58% carbohydrate calories; catalog 2918, Envigo) for 12 weeks. After the feeding regimen, mice were subjected to phenotype characterization, metabolic assays, and postmortem tissue collection for cell isolation.
BMDM differentiation and polarization
BMDMs were prepared as previously described (12, 77). In brief, bone marrow cells were collected from the femur and tibia bones followed by erythrocyte lysis with ammonium chloride solution (8.3 g/l ammonium chloride, 1.0 g/l potassium bicarbonate, and 0.009% EDTA) and seeded in tissue culture plates at a concentration of 0.15 × 10⁶/cm2. Cells were induced for differentiation to monocytes in BMDM growth medium (Iscove’s Modified Dulbecco’s Medium [IMDM] + 10% FBS + 15% L-929 cell [ATCC, CCL-1]) for 7 days; fresh BMDM growth medium was replaced on day 3. Maturation and purity of BMDMs were evaluated on day 7 using flow cytometry analysis with fluorescence-conjugated antibodies against CD11b and F4/80. To induce polarization, BMDMs were stimulated 48 hours with 100 ng/ml LPS and 50 ng/ml IFN-γ for M1 activation, or 20 ng/ml IL-4 and 20 ng/ml IL-13 for M2 activation. Unstimulated BMDMs were collected as M0 state.
Isolation of stromal cells from visceral adipose tissue
Visceral adipose tissues (epididymal, retroperitoneal, and mesenteric fat pads) from 5 lean and 5 obese C57BL/6J male mice were isolated separately, mechanically dissected, and digested in Hank’s balanced salt solution (HBSS) containing 20 mM HEPES, 0.015 g/ml bovine serum albumin (BSA), and 2 mg/ml collagenase II (Invitrogen) for 1 hour at 37°C in an InGeneron ARC tissue processing system with periodic rotating and inverting. After removing erythrocytes with ammonium chloride solution, cells were filtered through a nylon mesh bag (250–300 μm, catalog 50-303-41, Thermo Fisher Scientific), then a 100-μm cell strainer. Cells were resuspended in PBS with 2% FBS, transferred into a BSA-coated tube, and left on ice before sorting.
FACS
Unless otherwise specified, antibodies (Abs) were from eBioscience. VSCs, ATMs, and BMDMs were stained with fluorescence-tagged Abs for lineage examination. Macrophages were detected with Abs against CD45.2 (catalog 17-0454-82), F4/80 (catalog 25-4801-82), CD11b (catalog 12-0112-82), CD206 (catalog 141706; BioLegend), and CD11c (catalog 12-0114-83). Macrophage activation was measured with Abs against CD206, CD11c, CD80 (catalog 12-0801- 85), CD69 (catalog 45-0691-82), and CD86 (catalog 17-0862-82). ATMs were defined as CD45.2+CD11b+F4/80+ cell populations and sorted on a BD Biosciences FACSAria II cell sorter. Approximately 60,000 ATMs were isolated from lean and obese samples and used for scRNA-seq analysis.
scRNA-seq library preparation and data processing
BMDM cells from M0, M1, and M2 populations were analyzed separately for scRNA-seq and MacSpectrum development. ATM cells pooled from 5 lean and 5 obese C57BL/6J male mice were pooled prior to scRNA-seq. All cells were resuspended in DPBS with 0.04% BSA, and immediately processed for scRNA-seq as follows. Cell count and viability were determined using trypan blue on a Countess FL II, and approximately 12,000 cells were loaded for capture onto the Chromium System using the v2 single cell reagent kit according to the manufacturer’s protocol (10× Genomics). Following capture and lysis, cDNA was synthesized and amplified (12 cycles) as per manufacturer’s protocol (10× Genomics). The amplified cDNA from each channel of the Chromium System was used to construct an Illumina sequencing library and was sequenced on a HiSeq 4000 with 150-cycle sequencing (asymmetric reads per 10× Genomics). Illumina basecall files (*.bcl) were converted to FASTQs using CellRanger v1.3, which uses bcl2fastq v2.17.1.14. FASTQ files were then aligned to mm10 mouse reference genome and transcriptome using the CellRanger v1.3 software pipeline with default parameters as reported previously (78); this demultiplexes the samples and generates a gene versus cell expression matrix based on the barcodes and assigns UMIs that enables determination of the individual cell from which the RNA molecule originated. Gene expression was normalized using CellView software (79). Briefly, the number of gene transcripts per cell was multiplied by the median of transcripts across all the cells, and then log2 transformed (following an addition of +1 pseudocount to prevent log error where the transcript count is 0; i.e., log2[0 + 1] = 0), resulting in normalized expression (NE) values. Composition of each gene set of BMDMs and ATMs is summarized in Supplemental Table 2. For clustering, genes were selected based on normalized dispersion analysis. Dimensionality reduction was performed using CellRanger and CellView pipeline with the 1000 most over-dispersed (i.e., variance/mean NE) genes using Barnes-Hut t-SNE with default parameters, and cell clusters were determined using DBSCAN (eps = 5.0, minpts = 15). Clusters were visualized (Figure 1, B and D, and Supplemental Figure 1B) using the t-SNE 2D graph.
Selection of PSGs and AMDSGs
A total of 6979 M0, 4736 M1, and 6391 M2 BMDM scRNA-seq transcriptome profiles were generated. An equal number (4736 cells) of scRNA-seq profiles were randomly selected from M0, M1, or M2 samples and used for further analysis.
PSGs.
To select genes with the most significant difference during M1 and M2 polarization, we first filtered all selected scRNA-seq sets for genes with UMI greater than 1 in at least 1% of cells in either M1 or M2 samples, resulting in a total of 11,315 unique gene IDs. Differentially expressed genes between M1 and M2 samples were calculated as log2 (fold change) and tested using the FDR-adjusted P value of Welch’s t test. A total of 6267 genes were selected with an FDR-adjusted P value less than 1 × 10⁻¹⁰. These genes were then ranked high to low according to their absolute log2 (fold change) values. As shown in Figure 2A and Supplemental Figure 2, top-ranked genes with the most significant differences were selected to test efficacy of separating M1 or M2 samples. The top 500 most significantly changed genes with P values less than 1 × 10⁻¹⁰ (FDR) were selected for further application, and termed the PSGs (Supplemental Table 4).
AMDSGs.
To identify genes that were significantly altered after M0 exposure to stimuli in M1/M2 activation, we performed the following steps: gene expression profiles of M1, M2, or M0 consisted of a total of 11,566 genes that were expressed (UMI > 1) in more than 1% of at least 1 of the 3 populations. Differential expression between M1 versus M0 and M2 versus M0 BMDMs were calculated and tested as above. Genes that showed FDR-adjusted P values less than 1 × 10⁻⁵ were ranked high to low according to their absolute log2 (fold change) values, and the top 1000 of each comparison were selected. Out of the selected genes, 435 showed either both-positive or both-negative log2 (fold change) between M1 versus M0 and M2 versus M0 BMDMs and were termed AMDSGs (Supplemental Table 5).
Pairwise similarity comparison among M0, M1, and M2 BMDM samples
Pairwise similarities between BMDM cells were calculated using Pearson’s correlation method. Pearson’s correlation coefficients of each M1 versus M2 cell, M2 versus M0 cell, and M1 versus M2 cell pairs were calculated using the 11,566 genes that were expressed at greater than 1% frequency in at least 1 population of the 3, as follows:
(Equation 1)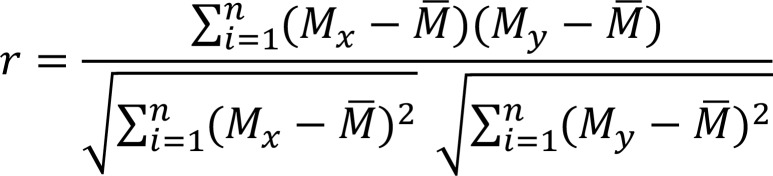
Where Mx and My are expression levels (UMI counts) of a certain gene in the 2 cells to be compared: Sct = S – Savg is the average expression of that gene in all the BMDMs, n is the total number of genes (11,566 genes) used for calculation, and r is the Pearson correlation coefficient of the 2 cells, as an indicator of similarity. A larger r means more similar. The calculated similarities were hierarchically clustered using Cluster 3.0 and visualized using Java TreeView 3.0 (http://jtreeview.sourceforge.net) (Figure 3A).
Macrophage single-cell transcriptome profile similarity comparison
Three sets of reference transcriptome profiles were generated as the average UMI of each detected gene (UMI > 1, detection frequency > 1% in either M0, M1, or M2 samples) in 4736 cells of M0, M1, or M2 samples as described above, and termed the M0-average reference transcriptome (M0aveR), M1aveR, or M2aveR.
Similarities between macrophage transcriptomes (a single-cell or bulk macrophage transcriptome profile) and reference, M0aveR, M1aveR, or M2aveR, were calculated using a method modified from Pearson’s correlation (rmj, equation listed below) in R. The PSGs and AMDSGs were first adapted to the macrophage transcriptomes, resulting in (sub)sets of PSG (PSGsub) and AMDSG (AMDSGsub) that were expressed in the macrophages to be tested. To emphasize the changes in gene expression during macrophage activation under various conditions, we performed a gene set centering adjustment to focus on fold-change difference of each individual gene in all samples within a study. The average expression level of a given gene (Savg) was calculated as the mean of this gene in each dataset (S) in the whole study. Sct is calculated as the centered value of this gene: let S be the original expression level, then the centered expression Sct will be:
Sct = S – Savg
Accordingly, 3 sets of reference transcriptomes, M0aveR, M1aveR, and M2aveR, were adjusted by centering each gene expression level as described, and termed Mj–ctR (j = 0, 1, 2). The similarity between a macrophage transcriptome profile and one centered reference transcriptome was calculated as the following: i represents a gene ID among the PSG set (for rm1 or rm2 calculation) or AMDSG set (for rm0 calculation); n = number of genes in PSGsub (for rm1, rm2) or AMDSGsub (for rm0); j = 0, 1, 2.
(Equation 2)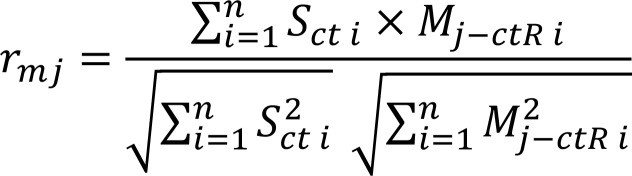
Adjusted correlation values for each comparison is provided as rm0, rm1, or rm2 for each transcriptome profile. Each cell in an scRNA-seq data set or an RNA-seq profile in a given experiment was treated as one transcriptome profile and calculated for all 3 r values.
Similarities between the 3 sets of reference transcriptomes, M0aveR, M1aveR, or M2aveR, were calculated following the same method as above. Adjusted correlations (rM1M0, rM2M0, rM1M2) between the 3 populations were calculated using all the 11,566 genes that were expressed (UMI > 1) in more than 1% of at least 1 of the 3 populations. The distances between the 3 populations were calculated as 1 – rM1M0, 1 – rM2M0, and 1 – rM1M2, respectively (Figure 3B). Larger distances indicate more different from the other.
Generation of MPI and AMDI for each cell
Calculations described below were applied to all tested transcriptome profiles, including scRNA-seq and RNA-seq profiles. Transcriptome profiles generated using other platforms, such as qRT-PCR and microarray, were also tested (data not shown).
The rm1 and rm2 values were calculated as mentioned above for each cell in M1 or M2 BMDMs with PSG and plotted (Figure 2C). Linear regression of the cell distribution (M1 and M2 BMDMs) on the rm1-rm2 plot was performed using R (Figure 2, B and C). The adjusted R2 value was 0.998 and the regression line was defined as the polarization axis. Let the equation of the regression line be: ax + by + c = 0.
The coordinates of each sample’s P were calculated as follows:
(Equation 3)
The most upper-left P (xp0, yp0) in the BMDM M1-M2 samples was set as the reference 0 point (P0). Accordingly, the most lower-right P (xpmax, ypmax) was set as the reference Pmax point. The distance l from the reference 0 point to a given sample’s P (xp, yp) was calculated as follows:
(Equation 4)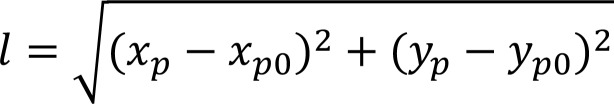
The distance between Pmax and P0 was scaled to a –50 (P0) to 50 (Pmax) range and each rescaled individual sample was termed its MPI.
Three sets of BMDM (M0, M1, and M2) scRNA-seq data were applied to compute AMDI. The rm0 of each cell in BMDM data sets (M0, M1, and M2) was calculated as mentioned above using the AMDSG set. The highest and lowest rm0 of the cells in the BMDM data sets were set as –50 and 50, and all the other rm0 values were rescaled accordingly with linear relation, and were termed AMDI. Plots were generated using ggplot2 (80) or our own R codes.
Heatmap generation of gene expression along the polarization axis
The polarization axes were divided into intervals with a given bin size and cells within a certain bin were treated as a small group. A gene expression value (log2 transformed) was calculated as the average level (UMI, FPKM, TPM, etc.) of all cells in each bin group. In figures presented in this study, the bin size of MPI values was 5 (Figure 2F) or 2.5 (Figure 5D and Supplemental Table 3) units. The range of gene expression levels in all bins was rescaled to a 0 to 100 artificial unit range and the expression levels were accordingly transformed along this scale with linear relation. Transformed expression levels of genes in each bin group were then hierarchically clustered by the hclust function of R using the complete-link agglomeration method; distances used for clustering were calculated by the dist function using the Euclidean method. The clustered relative expression values along the polarization axis were visualized using R plotly package (https://plot.ly).
Cell-trajectory analysis
Single-cell trajectories of BMDMs were built using the Monocle package (version 2.8.0) (28–30, 81). Whole-transcriptome trajectories of BMDMs were built using the total 11,566 genes that were expressed (UMI > 1) in more than 1% of at least 1 of the 3 populations. In our modified trajectory analyses, BMDMs were sorted using the 500 PSGs plus 435 AMDSGs. Dimensionality reduction was conducted using the DDRTree method and the minimum spanning tree was plotted using the plot_cell_trajectory function.
Expression levels of the signature genes along pseudotime in the 2 lineages (i.e., from M0-dominant state to M1-dominant state and from M0-dominant state to M2-dominant state) were visualized using the plot_genes_branched_heatmap function; on the generated heatmap, gene expression levels were smoothened using the VGAM package and rescaled to a –3 to 3 range, and were hierarchically clustered.
Dimensionality reduction and clustering
t-SNE dimensionality reduction of BMDMs and ATMs based on whole transcriptomes was generated by 10× Genomics Cell Ranger pipeline (version 2.1). Dimensionality of gene-barcode matrices was first reduced to 10 principal components using principal components analysis (PCA). PCA-reduced data were further reduced to 2-dimensional space using the t-SNE method and visualized in the Loupe Cell Browser (10× Genomics) and/or by R. Graph-based clustering of cells was conducted in the PCA space; a sparse nearest-neighbor graph of the cells was built first and Louvain modularity optimization was then applied. The number of nearest neighbors was logarithmically in accordance with the number of cells. In the last step, repeated cycles of hierarchical clustering and merging of cluster pairs that had no significant differential expression was performed, until no more cluster pairs could merge.
Dimensionality reduction of ATMs and atherosclerosis macrophages based on specific PSGs and AMDSGs were conducted using the Rtsne function of R. The cell-gene matrices including only the selected signature genes were first reduced to 50 principal components by PCA, which were passed to the Barnes-Hut t-SNE algorithm to further reduce the data to 2-dimensional space. The t-SNE plots overlaid with gene expression were visualized by R.
Other bioinformatic analyses
Signaling pathway enrichment and upstream regulator prediction were analyzed using Ingenuity Pathway Analysis (IPA) (Qiagen), unless indicated specifically. Gene ontology analysis for each data set was performed using various platforms or online servers, including PANTHER classification system (www.pantherdb.org) (82), ToppGene Suite (toppgene.cchmc.org), and NIH DAVID Bioinformatics Resources (david-d.ncifcrf.gov).
Statistics
Unless otherwise stated, P values of gene differential expression were determined by 2-tailed Welch’s t test. P values of enrichment of pathways, upstream regulators, and gene ontology terms were generated by the corresponding bioinformatics tools.
Study approval
All animal procedures were approved by and carried out in accordance with the policies of the Institutional Animal Care and Use Committee of UConn Health. Patient data were collected by P. Holvoet and complied with the Declaration of Helsinki and the Medical Ethics Committee of the Katholieke Universiteit Leuven approved the study protocol (68). As stated in the previous study (68), all human participants gave written informed consent prior to inclusion in the study.
Data availability.
Expression profiles of human circulating CD14+ monocytes from obese and nonobese human subjects with and without bariatric surgery or with and without diabetes are available through NCBI GEO accession numbers GSE32575 and GSE54350, respectively. BMDM and ATM scRNA-seq data are available through NCBI GEO accession number GSE117176.
Code availability.
The R scripts used to build MacSpectrum and analyze macrophage data sets in this study are available from the corresponding author upon request.
Author contributions
BZ conceived the project. ZO proposed the scRNA-seq experiments. BZ and CL designed the experiments and interpreted results. CL prepared cells for scRNA-seq, and designed and performed the computational analysis with assistance from BZ, ATV, ZO, and CF. AM and ATV contributed to in vitro experiments and data analyses. PH supervised studies in patients and compared gene expression in mouse and human samples. The manuscript was written by CL and edited by ATV, CB, and BZ with input from all authors.
Supplementary Material
Acknowledgments
The authors are grateful for the services of the JAX-UConn Single Cell Genomics Center for scRNA-seq library preparation and sequencing. We thank Z. Huang from the University of Connecticut Department of Immunology for assisting with ATM isolation, E. Jellison from the UConn Health Flow Cytometry Core for performing fluorescence-activated cell sorting, P. Robson from the Jackson Laboratory for Genomic Medicine Single Cell Biology Laboratory for conducting fluorescence-activated cell sorting and single-cell transcriptome generation, and M. Bolisetty from the Jackson Laboratory for Genomic Medicine Single Cell Biology Laboratory for scRNA-seq read alignments and UMI matrices generation. Human data collected in a previous study (68) were provided by Paul Holvoet for our analysis. The funders had no role in study design, data collection and analysis, decision to publish, or preparation of the manuscript. This work was supported by the NIH/National Institute of Diabetes and Digestive and Kidney Diseases (NIDDK 1R01DK098662 to BZ).
Version 1. 04/16/2019
In-Press Preview
Version 2. 05/16/2019
Electronic publication
Footnotes
Conflict of interest: The authors have declared that no conflict of interest exists.
Copyright: © 2019 American Society for Clinical Investigation
Reference information: JCI Insight. 2019;4(10):e126453. https://doi.org/10.1172/jci.insight.126453.
Contributor Information
Chuan Li, Email: chuali@uchc.edu.
Antoine Menoret, Email: menoret@uchc.edu.
Cullen Farragher, Email: cullen.farragher@uconn.edu.
Zhengqing Ouyang, Email: zhengqing.ouyang@jax.org.
Christopher Bonin, Email: bonin@uchc.edu.
Paul Holvoet, Email: paul.holvoet@med.kuleuven.be.
Anthony T. Vella, Email: vella@uchc.edu.
Beiyan Zhou, Email: bzhou@uchc.edu.
References
- 1.Davies LC, Jenkins SJ, Allen JE, Taylor PR. Tissue-resident macrophages. Nat Immunol. 2013;14(10):986–995. doi: 10.1038/ni.2705. [DOI] [PMC free article] [PubMed] [Google Scholar]
- 2.Martinez FO, Gordon S. The M1 and M2 paradigm of macrophage activation: time for reassessment. F1000Prime Rep. 2014;6:13. doi: 10.12703/P6-13. [DOI] [PMC free article] [PubMed] [Google Scholar]
- 3.Mosser DM, Edwards JP. Exploring the full spectrum of macrophage activation. Nat Rev Immunol. 2008;8(12):958–969. doi: 10.1038/nri2448. [DOI] [PMC free article] [PubMed] [Google Scholar]
- 4.Nathan CF, Murray HW, Wiebe ME, Rubin BY. Identification of interferon-gamma as the lymphokine that activates human macrophage oxidative metabolism and antimicrobial activity. J Exp Med. 1983;158(3):670–689. doi: 10.1084/jem.158.3.670. [DOI] [PMC free article] [PubMed] [Google Scholar]
- 5.Stein M, Keshav S, Harris N, Gordon S. Interleukin 4 potently enhances murine macrophage mannose receptor activity: a marker of alternative immunologic macrophage activation. J Exp Med. 1992;176(1):287–292. doi: 10.1084/jem.176.1.287. [DOI] [PMC free article] [PubMed] [Google Scholar]
- 6.Mantovani A, Sica A, Sozzani S, Allavena P, Vecchi A, Locati M. The chemokine system in diverse forms of macrophage activation and polarization. Trends Immunol. 2004;25(12):677–686. doi: 10.1016/j.it.2004.09.015. [DOI] [PubMed] [Google Scholar]
- 7.Li C, Xu MM, Wang K, Adler AJ, Vella AT, Zhou B. Macrophage polarization and meta-inflammation. Transl Res. 2018;191:29–44. doi: 10.1016/j.trsl.2017.10.004. [DOI] [PMC free article] [PubMed] [Google Scholar]
- 8.Biswas SK, Mantovani A. Macrophage plasticity and interaction with lymphocyte subsets: cancer as a paradigm. Nat Immunol. 2010;11(10):889–896. doi: 10.1038/ni.1937. [DOI] [PubMed] [Google Scholar]
- 9.Murray PJ, et al. Macrophage activation and polarization: nomenclature and experimental guidelines. Immunity. 2014;41(1):14–20. doi: 10.1016/j.immuni.2014.06.008. [DOI] [PMC free article] [PubMed] [Google Scholar]
- 10.Weisberg SP, McCann D, Desai M, Rosenbaum M, Leibel RL, Ferrante AW. Obesity is associated with macrophage accumulation in adipose tissue. J Clin Invest. 2003;112(12):1796–1808. doi: 10.1172/JCI19246. [DOI] [PMC free article] [PubMed] [Google Scholar]
- 11.Martinez-Santibañez G, Lumeng CN. Macrophages and the regulation of adipose tissue remodeling. Annu Rev Nutr. 2014;34:57–76. doi: 10.1146/annurev-nutr-071812-161113. [DOI] [PubMed] [Google Scholar]
- 12.Li C, et al. IRF6 regulates alternative activation by suppressing PPARγ in male murine macrophages. Endocrinology. 2017;158(9):2837–2847. doi: 10.1210/en.2017-00053. [DOI] [PMC free article] [PubMed] [Google Scholar]
- 13.Chawla A, Nguyen KD, Goh YP. Macrophage-mediated inflammation in metabolic disease. Nat Rev Immunol. 2011;11(11):738–749. doi: 10.1038/nri3071. [DOI] [PMC free article] [PubMed] [Google Scholar]
- 14.Boutens L, Hooiveld GJ, Dhingra S, Cramer RA, Netea MG, Stienstra R. Unique metabolic activation of adipose tissue macrophages in obesity promotes inflammatory responses. Diabetologia. 2018;61(4):942–953. doi: 10.1007/s00125-017-4526-6. [DOI] [PMC free article] [PubMed] [Google Scholar]
- 15.Hill DA, et al. Distinct macrophage populations direct inflammatory versus physiological changes in adipose tissue. Proc Natl Acad Sci USA. 2018;115(22):E5096–E5105. doi: 10.1073/pnas.1802611115. [DOI] [PMC free article] [PubMed] [Google Scholar]
- 16.Ehrlund A, et al. The cell-type specific transcriptome in human adipose tissue and influence of obesity on adipocyte progenitors. Sci Data. 2017;4:170164. doi: 10.1038/sdata.2017.164. [DOI] [PMC free article] [PubMed] [Google Scholar]
- 17.Fujisaka S, et al. Regulatory mechanisms for adipose tissue M1 and M2 macrophages in diet-induced obese mice. Diabetes. 2009;58(11):2574–2582. doi: 10.2337/db08-1475. [DOI] [PMC free article] [PubMed] [Google Scholar]
- 18.Coats BR, et al. Metabolically activated adipose tissue macrophages perform detrimental and beneficial functions during diet-induced obesity. Cell Rep. 2017;20(13):3149–3161. doi: 10.1016/j.celrep.2017.08.096. [DOI] [PMC free article] [PubMed] [Google Scholar]
- 19.Kiselev VY, Andrews TS, Hemberg M. Challenges in unsupervised clustering of single-cell RNA-seq data. Nat Rev Genet. 2019;20(5):273–282. doi: 10.1038/s41576-018-0088-9. [DOI] [PubMed] [Google Scholar]
- 20.Boutens L, Stienstra R. Adipose tissue macrophages: going off track during obesity. Diabetologia. 2016;59(5):879–894. doi: 10.1007/s00125-016-3904-9. [DOI] [PMC free article] [PubMed] [Google Scholar]
- 21.Epelman S, Lavine KJ, Randolph GJ. Origin and functions of tissue macrophages. Immunity. 2014;41(1):21–35. doi: 10.1016/j.immuni.2014.06.013. [DOI] [PMC free article] [PubMed] [Google Scholar]
- 22.Ginhoux F, Guilliams M. Tissue-resident macrophage ontogeny and homeostasis. Immunity. 2016;44(3):439–449. doi: 10.1016/j.immuni.2016.02.024. [DOI] [PubMed] [Google Scholar]
- 23.Guilliams M, Scott CL. Does niche competition determine the origin of tissue-resident macrophages? Nat Rev Immunol. 2017;17(7):451–460. doi: 10.1038/nri.2017.42. [DOI] [PubMed] [Google Scholar]
- 24.de Bruin RG, et al. Quaking promotes monocyte differentiation into pro-atherogenic macrophages by controlling pre-mRNA splicing and gene expression. Nat Commun. 2016;7:10846. doi: 10.1038/ncomms10846. [DOI] [PMC free article] [PubMed] [Google Scholar]
- 25.Tamura A, et al. C/EBPβ is required for survival of Ly6C. Blood. 2017;130(16):1809–1818. doi: 10.1182/blood-2017-03-772962. [DOI] [PMC free article] [PubMed] [Google Scholar]
- 26.Ou JN, Wiedeman AE, Stevens AM. TNF-α and TGF-β counter-regulate PD-L1 expression on monocytes in systemic lupus erythematosus. Sci Rep. 2012;2:295. doi: 10.1038/srep00295. [DOI] [PMC free article] [PubMed] [Google Scholar]
- 27.Crosslin DR, et al. Genetic variation associated with circulating monocyte count in the eMERGE Network. Hum Mol Genet. 2013;22(10):2119–2127. doi: 10.1093/hmg/ddt010. [DOI] [PMC free article] [PubMed] [Google Scholar]
- 28.Qiu X, Hill A, Packer J, Lin D, Ma YA, Trapnell C. Single-cell mRNA quantification and differential analysis with Census. Nat Methods. 2017;14(3):309–315. doi: 10.1038/nmeth.4150. [DOI] [PMC free article] [PubMed] [Google Scholar]
- 29.Qiu X, et al. Reversed graph embedding resolves complex single-cell trajectories. Nat Methods. 2017;14(10):979–982. doi: 10.1038/nmeth.4402. [DOI] [PMC free article] [PubMed] [Google Scholar]
- 30.Trapnell C, et al. The dynamics and regulators of cell fate decisions are revealed by pseudotemporal ordering of single cells. Nat Biotechnol. 2014;32(4):381–386. doi: 10.1038/nbt.2859. [DOI] [PMC free article] [PubMed] [Google Scholar]
- 31.Rahman K, et al. Inflammatory Ly6Chi monocytes and their conversion to M2 macrophages drive atherosclerosis regression. J Clin Invest. 2017;127(8):2904–2915. doi: 10.1172/JCI75005. [DOI] [PMC free article] [PubMed] [Google Scholar]
- 32.Hassnain Waqas SF, et al. Adipose tissue macrophages develop from bone marrow-independent progenitors in. J Leukoc Biol. 2017;102(3):845–855. doi: 10.1189/jlb.1A0317-082RR. [DOI] [PMC free article] [PubMed] [Google Scholar]
- 33.Dahl R, et al. Regulation of macrophage and neutrophil cell fates by the PU.1:C/EBPalpha ratio and granulocyte colony-stimulating factor. Nat Immunol. 2003;4(10):1029–1036. doi: 10.1038/ni973. [DOI] [PubMed] [Google Scholar]
- 34.Wu X, et al. Transcription factor Zeb2 regulates commitment to plasmacytoid dendritic cell and monocyte fate. Proc Natl Acad Sci USA. 2016;113(51):14775–14780. doi: 10.1073/pnas.1611408114. [DOI] [PMC free article] [PubMed] [Google Scholar]
- 35.Merad M, Sathe P, Helft J, Miller J, Mortha A. The dendritic cell lineage: ontogeny and function of dendritic cells and their subsets in the steady state and the inflamed setting. Annu Rev Immunol. 2013;31:563–604. doi: 10.1146/annurev-immunol-020711-074950. [DOI] [PMC free article] [PubMed] [Google Scholar]
- 36.Guilliams M, et al. Dendritic cells, monocytes and macrophages: a unified nomenclature based on ontogeny. Nat Rev Immunol. 2014;14(8):571–578. doi: 10.1038/nri3712. [DOI] [PMC free article] [PubMed] [Google Scholar]
- 37.Wentworth JM, et al. Pro-inflammatory CD11c+CD206+ adipose tissue macrophages are associated with insulin resistance in human obesity. Diabetes. 2010;59(7):1648–1656. doi: 10.2337/db09-0287. [DOI] [PMC free article] [PubMed] [Google Scholar]
- 38.Li P, et al. Functional heterogeneity of CD11c-positive adipose tissue macrophages in diet-induced obese mice. J Biol Chem. 2010;285(20):15333–15345. doi: 10.1074/jbc.M110.100263. [DOI] [PMC free article] [PubMed] [Google Scholar]
- 39.Rosen ED, Spiegelman BM. What we talk about when we talk about fat. Cell. 2014;156(1-2):20–44. doi: 10.1016/j.cell.2013.12.012. [DOI] [PMC free article] [PubMed] [Google Scholar]
- 40.Waqas SFH, et al. Neuropeptide FF increases M2 activation and self-renewal of adipose tissue macrophages. J Clin Invest. 2017;127(7):2842–2854. doi: 10.1172/JCI90152. [DOI] [PMC free article] [PubMed] [Google Scholar]
- 41.Russo L, Lumeng CN. Properties and functions of adipose tissue macrophages in obesity. Immunology. 2018;155(4):407–417. doi: 10.1111/imm.13002. [DOI] [PMC free article] [PubMed] [Google Scholar]
- 42.Perfetti R, Lee-Kwon W, Montrose-Rafizadeh C, Bernier M. Overexpression and activation of the insulin receptor enhances expression of ERCC-1 messenger ribonucleic acid in cultured cells. Endocrinology. 1997;138(5):1829–1835. doi: 10.1210/endo.138.5.5096. [DOI] [PubMed] [Google Scholar]
- 43.Lee-Kwon W, Park D, Bernier M. Involvement of the Ras/extracellular signal-regulated kinase signalling pathway in the regulation of ERCC-1 mRNA levels by insulin. Biochem J. 1998;331(Pt 2):591–597. doi: 10.1042/bj3310591. [DOI] [PMC free article] [PubMed] [Google Scholar]
- 44.Wang C, George B, Chen S, Feng B, Li X, Chakrabarti S. Genotoxic stress and activation of novel DNA repair enzymes in human endothelial cells and in the retinas and kidneys of streptozotocin diabetic rats. Diabetes Metab Res Rev. 2012;28(4):329–337. doi: 10.1002/dmrr.2279. [DOI] [PubMed] [Google Scholar]
- 45.Kanasaki M, et al. Deficiency in catechol-o-methyltransferase is linked to a disruption of glucose homeostasis in mice. Sci Rep. 2017;7(1):7927. doi: 10.1038/s41598-017-08513-w. [DOI] [PMC free article] [PubMed] [Google Scholar]
- 46.Vats P, Sagar N, Singh TP, Banerjee M. Association of superoxide dismutases (SOD1 and SOD2) and glutathione peroxidase 1 (GPx1) gene polymorphisms with type 2 diabetes mellitus. Free Radic Res. 2015;49(1):17–24. doi: 10.3109/10715762.2014.971782. [DOI] [PubMed] [Google Scholar]
- 47.Liu D, Liu L, Hu Z, Song Z, Wang Y, Chen Z. Evaluation of the oxidative stress-related genes ALOX5, ALOX5AP, GPX1, GPX3 and MPO for contribution to the risk of type 2 diabetes mellitus in the Han Chinese population. Diab Vasc Dis Res. 2018;15(4):336–339. doi: 10.1177/1479164118755044. [DOI] [PubMed] [Google Scholar]
- 48.Lei XG, Vatamaniuk MZ. Two tales of antioxidant enzymes on β cells and diabetes. Antioxid Redox Signal. 2011;14(3):489–503. doi: 10.1089/ars.2010.3416. [DOI] [PMC free article] [PubMed] [Google Scholar]
- 49.Reiber JH, van Eldik-Helleman P, Kooijman CJ, Tijssen JG, Serruys PW. How critical is frame selection in quantitative coronary angiographic studies? Eur Heart J. 1989;10 Suppl F:54–59. doi: 10.1093/eurheartj/10.suppl_f.54. [DOI] [PubMed] [Google Scholar]
- 50.Chalásová K, et al. Transketolase activity but not thiamine membrane transport change in response to hyperglycaemia and kidney dysfunction. Exp Clin Endocrinol Diabetes. 2018;126(4):255–262. doi: 10.1055/s-0043-115009. [DOI] [PubMed] [Google Scholar]
- 51.Ziegler D, et al. Association of transketolase polymorphisms with measures of polyneuropathy in patients with recently diagnosed diabetes. Diabetes Metab Res Rev. 2017;33(4):null. doi: 10.1002/dmrr.2811. [DOI] [PubMed] [Google Scholar]
- 52.Kos K, Wilding JP. SPARC: a key player in the pathologies associated with obesity and diabetes. Nat Rev Endocrinol. 2010;6(4):225–235. doi: 10.1038/nrendo.2010.18. [DOI] [PubMed] [Google Scholar]
- 53.Sárközy M, et al. Transcriptomic alterations in the heart of non-obese type 2 diabetic Goto-Kakizaki rats. Cardiovasc Diabetol. 2016;15(1):110. doi: 10.1186/s12933-016-0424-3. [DOI] [PMC free article] [PubMed] [Google Scholar]
- 54.Claussnitzer M, et al. Leveraging cross-species transcription factor binding site patterns: from diabetes risk loci to disease mechanisms. Cell. 2014;156(1-2):343–358. doi: 10.1016/j.cell.2013.10.058. [DOI] [PMC free article] [PubMed] [Google Scholar]
- 55.Du B, et al. The transcription factor paired-related homeobox 1 (Prrx1) inhibits adipogenesis by activating transforming growth factor-β (TGFβ) signaling. J Biol Chem. 2013;288(5):3036–3047. doi: 10.1074/jbc.M112.440370. [DOI] [PMC free article] [PubMed] [Google Scholar]
- 56.Drew BG, et al. Estrogen receptor (ER)α-regulated lipocalin 2 expression in adipose tissue links obesity with breast cancer progression. J Biol Chem. 2015;290(9):5566–5581. doi: 10.1074/jbc.M114.606459. [DOI] [PMC free article] [PubMed] [Google Scholar]
- 57.Lau W, Andrew T, Maniatis N. High-resolution genetic maps identify multiple type 2 diabetes loci at regulatory hotspots in African Americans and Europeans. Am J Hum Genet. 2017;100(5):803–816. doi: 10.1016/j.ajhg.2017.04.007. [DOI] [PMC free article] [PubMed] [Google Scholar]
- 58.Ahmad F, et al. Increased alpha2 subunit-associated AMPK activity and PRKAG2 cardiomyopathy. Circulation. 2005;112(20):3140–3148. doi: 10.1161/CIRCULATIONAHA.105.550806. [DOI] [PubMed] [Google Scholar]
- 59.Wolf CM, et al. Reversibility of PRKAG2 glycogen-storage cardiomyopathy and electrophysiological manifestations. Circulation. 2008;117(2):144–154. doi: 10.1161/CIRCULATIONAHA.107.726752. [DOI] [PMC free article] [PubMed] [Google Scholar]
- 60.Li Z, et al. The Amotl2 gene inhibits Wnt/β-catenin signaling and regulates embryonic development in zebrafish. J Biol Chem. 2012;287(16):13005–13015. doi: 10.1074/jbc.M112.347419. [DOI] [PMC free article] [PubMed] [Google Scholar]
- 61. Chanput W, Peters V, Wichers H. THP-1 and U937 Cells. In: Verhoeckx K, et al. eds. The Impact of Food Bioactives on Health: in vitro and ex vivo models. Cham, Switzerland: Springer; 2015:147-159. [PubMed] [Google Scholar]
- 62.Ginhoux F, et al. Fate mapping analysis reveals that adult microglia derive from primitive macrophages. Science. 2010;330(6005):841–845. doi: 10.1126/science.1194637. [DOI] [PMC free article] [PubMed] [Google Scholar]
- 63.Schulz C, et al. A lineage of myeloid cells independent of Myb and hematopoietic stem cells. Science. 2012;336(6077):86–90. doi: 10.1126/science.1219179. [DOI] [PubMed] [Google Scholar]
- 64.Yona S, et al. Fate mapping reveals origins and dynamics of monocytes and tissue macrophages under homeostasis. Immunity. 2013;38(1):79–91. doi: 10.1016/j.immuni.2012.12.001. [DOI] [PMC free article] [PubMed] [Google Scholar]
- 65.Xue J, et al. Transcriptome-based network analysis reveals a spectrum model of human macrophage activation. Immunity. 2014;40(2):274–288. doi: 10.1016/j.immuni.2014.01.006. [DOI] [PMC free article] [PubMed] [Google Scholar]
- 66.Sander J, et al. Cellular differentiation of human monocytes is regulated by time-dependent interleukin-4 signaling and the transcriptional regulator NCOR2. Immunity. 2017;47(6):1051–1066.e12. doi: 10.1016/j.immuni.2017.11.024. [DOI] [PMC free article] [PubMed] [Google Scholar]
- 67.Realegeno S, et al. S100A12 is part of the antimicrobial network against Mycobacterium leprae in human macrophages. PLoS Pathog. 2016;12(6):e1005705. doi: 10.1371/journal.ppat.1005705. [DOI] [PMC free article] [PubMed] [Google Scholar]
- 68.Hulsmans M, et al. Interleukin-1 receptor-associated kinase-3 is a key inhibitor of inflammation in obesity and metabolic syndrome. PLoS ONE. 2012;7(1):e30414. doi: 10.1371/journal.pone.0030414. [DOI] [PMC free article] [PubMed] [Google Scholar]
- 69.Dalmas E, et al. T cell-derived IL-22 amplifies IL-1β-driven inflammation in human adipose tissue: relevance to obesity and type 2 diabetes. Diabetes. 2014;63(6):1966–1977. doi: 10.2337/db13-1511. [DOI] [PubMed] [Google Scholar]
- 70.Beyer M, et al. High-resolution transcriptome of human macrophages. PLoS ONE. 2012;7(9):e45466. doi: 10.1371/journal.pone.0045466. [DOI] [PMC free article] [PubMed] [Google Scholar]
- 71.Gierahn TM, et al. Seq-Well: portable, low-cost RNA sequencing of single cells at high throughput. Nat Methods. 2017;14(4):395–398. doi: 10.1038/nmeth.4179. [DOI] [PMC free article] [PubMed] [Google Scholar]
- 72.Martinez FO, et al. Genetic programs expressed in resting and IL-4 alternatively activated mouse and human macrophages: similarities and differences. Blood. 2013;121(9):e57–e69. doi: 10.1182/blood-2012-06-436212. [DOI] [PubMed] [Google Scholar]
- 73.Ingersoll MA, et al. Comparison of gene expression profiles between human and mouse monocyte subsets. Blood. 2010;115(3):e10–e19. doi: 10.1182/blood-2009-07-235028. [DOI] [PMC free article] [PubMed] [Google Scholar]
- 74.Hulsmans M, Van Dooren E, Mathieu C, Holvoet P. Decrease of miR-146b-5p in monocytes during obesity is associated with loss of the anti-inflammatory but not insulin signaling action of adiponectin. PLoS ONE. 2012;7(2):e32794. doi: 10.1371/journal.pone.0032794. [DOI] [PMC free article] [PubMed] [Google Scholar]
- 75.Van der Schueren B, et al. Low cytochrome oxidase 4I1 links mitochondrial dysfunction to obesity and type 2 diabetes in humans and mice. Int J Obes (Lond) 2015;39(8):1254–1263. doi: 10.1038/ijo.2015.58. [DOI] [PubMed] [Google Scholar]
- 76.Hume DA. The many alternative faces of macrophage activation. Front Immunol. 2015;6:370. doi: 10.3389/fimmu.2015.00370. [DOI] [PMC free article] [PubMed] [Google Scholar]
- 77.Ying W, Cheruku PS, Bazer FW, Safe SH, Zhou B. Investigation of macrophage polarization using bone marrow derived macrophages. J Vis Exp. 2013;(76):e50323. doi: 10.3791/50323. [DOI] [PMC free article] [PubMed] [Google Scholar]
- 78.Zheng GX, et al. Massively parallel digital transcriptional profiling of single cells. Nat Commun. 2017;8:14049. doi: 10.1038/ncomms14049. [DOI] [PMC free article] [PubMed] [Google Scholar]
- 79. doi: 10.1101/123810. Bolisetty MT, Stitzel ML, Robson P. CellView: Interactive exploration of high dimensional single cell RNA-Seq data. bioRxiv Web site. Published April 4, 2017. Accessed April 23, 2019. [DOI]
- 80. Wickham H. ggplot2: Elegant Graphics for Data Analysis. New York, NY: Springer-Verlag ; 2016. [Google Scholar]
- 81.Dick SA, et al. Self-renewing resident cardiac macrophages limit adverse remodeling following myocardial infarction. Nat Immunol. 2019;20(1):29–39. doi: 10.1038/s41590-018-0272-2. [DOI] [PMC free article] [PubMed] [Google Scholar]
- 82.Mi H, et al. PANTHER version 11: expanded annotation data from Gene Ontology and Reactome pathways, and data analysis tool enhancements. Nucleic Acids Res. 2017;45(D1):D183–D189. doi: 10.1093/nar/gkw1138. [DOI] [PMC free article] [PubMed] [Google Scholar]
- 83.Avraham R, et al. Pathogen cell-to-cell variability drives heterogeneity in host immune responses. Cell. 2015;162(6):1309–1321. doi: 10.1016/j.cell.2015.08.027. [DOI] [PMC free article] [PubMed] [Google Scholar]
Associated Data
This section collects any data citations, data availability statements, or supplementary materials included in this article.
Supplementary Materials
Data Availability Statement
Expression profiles of human circulating CD14+ monocytes from obese and nonobese human subjects with and without bariatric surgery or with and without diabetes are available through NCBI GEO accession numbers GSE32575 and GSE54350, respectively. BMDM and ATM scRNA-seq data are available through NCBI GEO accession number GSE117176.