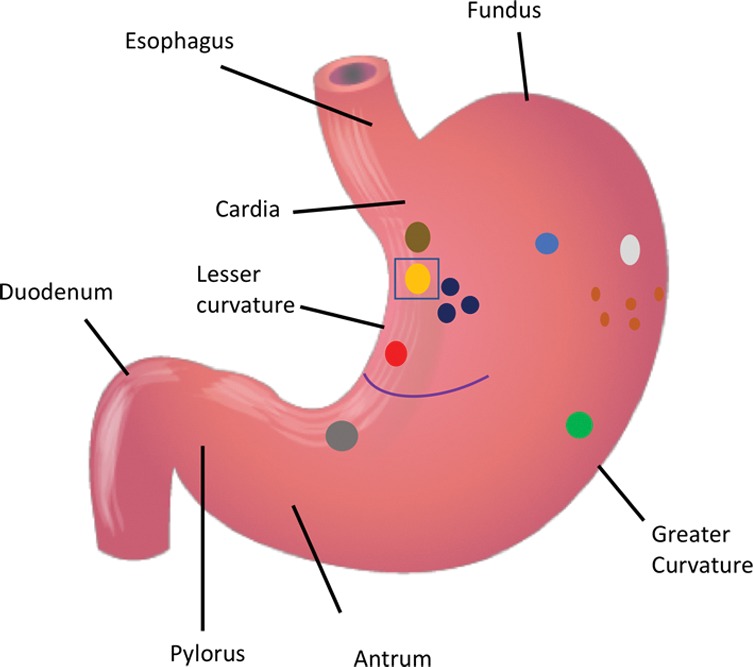
Figure 4a:

(a) Distribution of various gastric ulcerations observed during endoscopy 1 week after bariatric embolization. Relative sizes and shapes of ulcers are indicated by sizes and shapes of colored dots on diagram. Each color represents ulcers found on one participant (eg, the three black dots represent ulcers on one participant).The curved purple line represents a linear ulcer. The ulcer represented as a yellow oval and enclosed by a blue square corresponds to that shown in b–d. (b–d) Endoscopic images of the same location in one participant (48-year-old African American woman with a baseline weight of 127 kg): (b) at baseline, (c) at 2 weeks after embolization (arrow indicates a small, superficial gastric ulcer, measuring 1 cm on the longest axis), and (d) at 3 months after embolization (arrow indicates prior location of the ulcer).
