Abstract
Photon-counting detector (PCD) CT is an emerging technology that has shown tremendous progress in the last decade. Various types of PCD CT systems have been developed to investigate the benefits of this technology, which include reduced electronic noise, increased contrast-to-noise ratio with iodinated contrast material and radiation dose efficiency, reduced beam-hardening and metal artifacts, extremely high spatial resolution (33 line pairs per centimeter), simultaneous multienergy data acquisition, and the ability to image with and differentiate among multiple CT contrast agents. PCD technology is described and compared with conventional CT detector technology. With the use of a whole-body research PCD CT system as an example, PCD technology and its use for in vivo high-spatial-resolution multienergy CT imaging is discussed. The potential clinical applications, diagnostic benefits, and challenges associated with this technology are then discussed, and examples with phantom, animal, and patient studies are provided.
©RSNA, 2019
SA-CME LEARNING OBJECTIVES
After completing this journal-based SA-CME activity, participants will be able to:
■ Identify the fundamental principles of PCDs and recognize the differences between them and conventional energy- integrating detectors.
■ Describe the current status, benefits, and challenges of PCD CT.
■ Discuss potential clinical applications of PCD CT.
Introduction
Since its introduction in 1971, CT has been used widely in the diagnostic and therapeutic medical arenas because of its fast scanning speed, high spatial resolution, and broad availability. In the United States alone, more than 80 million CT examinations are performed every year, which makes CT one of the most important and widespread imaging modalities used for patient care (1). The wide range of available CT applications is attributed mainly to extensive and continual technological innovation during its history of more than 40 years, including improvements in CT detector technology.
The x-ray detector is a major component of a CT scanner that is critical to image formation and has a substantial effect on image quality and radiation dose. All current commercial CT scanners use solid-state detectors and share similar third-generation rotate-rotate designs, with minor implementation and design differences according to the scanner model and vendor (2). Dual-energy CT systems have been available commercially and have been used in routine clinical practice for approximately a decade. Different approaches have been used to perform dual-energy CT, such as dual-source, fast-kilovolt-switching, dual-layer detector, dual-filter, and two-consecutive-scan techniques (3,4). With the acquisition of two measurements corresponding to two different spectra, dual-energy CT enables material differentiation and quantification and has generated a range of new applications beyond the scope of conventional single-energy CT (4–6). In recent years, photon-counting detectors (PCDs), which are capable of spectral imaging, have been introduced as part of an experimental CT system (7,8). PCDs possess many inherent advantages over conventional CT detectors because of the fundamental differences in the physical mechanism responsible for photon detection and signal generation.
Although PCDs have been used widely in SPECT and PET, their application at x-ray CT has been hampered, because the photon-count rate used at CT is higher than the PCDs used in nuclear medicine imaging can handle (9–14). However, the potential clinical benefits from the inherent advantages of this technology have continued to motivate extensive research efforts in the past decade to bring PCDs into CT practice, especially with the development of higher atomic number detector materials and high-spatial-resolution fast application-specific integrated circuits (ASICs).
Benchtop PCD CT systems have been built in multiple research laboratories, and promising phantom and small-animal data have been reported in the literature (15–17). In addition, two PCD CT systems have been built on a commercial CT gantry to explore the potential of translating this technology into clinical practice (18–20). Of these, one is a whole-body research PCD CT system in which in vivo imaging of human subjects has been performed (7,18,19,21). This provided researchers with a working system to explore the benefit of PCD CT in clinical settings. In these different systems, studies with phantoms, animals, and human subjects have shown various benefits of PCD CT (Table 1), such as increased contrast-to-noise ratio and radiation dose efficiency, reduced electronic noise and beam-hardening and metal artifacts, and extremely high spatial resolution (>33 line pairs per centimeter) (22), and simultaneous multienergy data acquisition, which enables the ability to differentiate contrast agents and tissue types with a single scan.
Table 1:
Potential Benefits and Clinical Applications of PCD CT
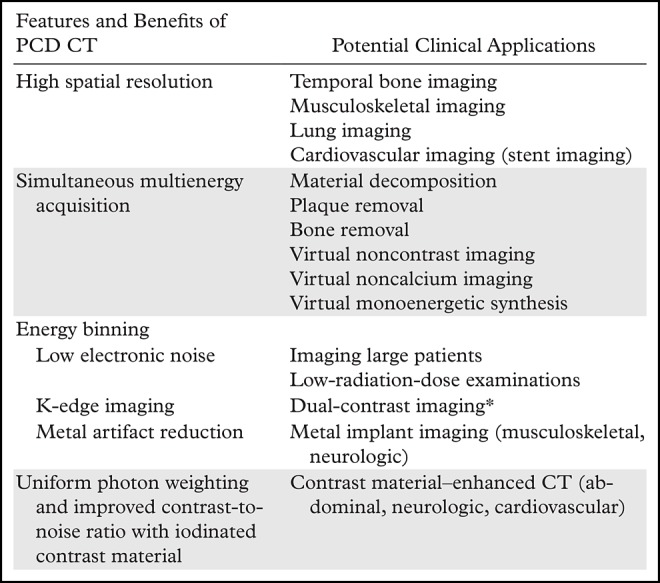
*Use is limited to research in animals.
Given the development of PCD CT technology and the promising results from recent studies, this article reviews this important emerging technology and its potential effect on medical imaging and patient care. We discuss PCD technology; the key differences between PCD and conventional energy-integrating detector (EID) technologies; and the clinical applications, benefits, and challenges of PCD CT.
Conventional and PCD Technologies
Conventional EID Technology
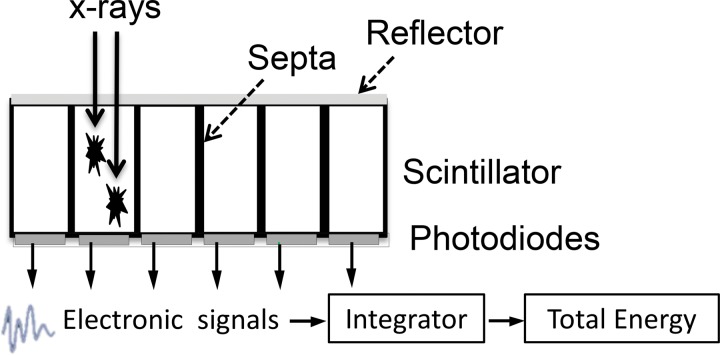
Conventional CT detectors are based on indirect conversion technology, which uses a layer of scintillators to convert x-ray photons into visible light that is consequently detected by a photodiode and converted into electronic signals (Fig 1a). The output signal of the detector is proportional to the total energy deposited by all detected x-ray photons; therefore, this type of detector usually is referred to as an EID. As the x-ray sources used at CT generate polyenergetic beams, and an EID weights the measured signal according to the energy of the detected photon, higher-energy photons generate stronger signals compared with lower-energy photons. In addition, because the detector integrates the energy from all detected photons, the detector signal does not carry any information regarding the energy of individual photons.
Figure 1a.
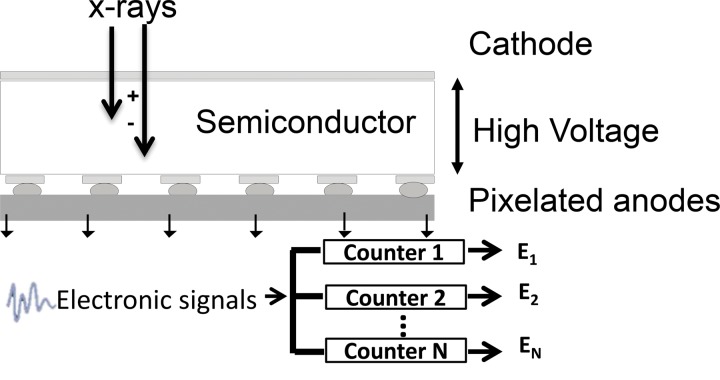
Schematic drawings illustrate the principles of EID (a) and PCD (b) technologies.
Figure 1b.
Schematic drawings illustrate the principles of EID (a) and PCD (b) technologies.
PCD Technology
PCDs use a direct conversion technology for x-ray detection that does not require a scintillator layer as in EIDs. The semiconductor detector material directly converts x-ray photons into electron hole pairs. With a bias voltage applied throughout the semiconductor, electrons travel to and are collected by the anode to generate electronic signals (Fig 1b).The most common semiconductor materials used in PCDs are cadmium telluride or cadmium zinc telluride, although other materials such as silicon and gallium arsenide also have been used (9–12,14,23–25). In contrast to the conventional EIDs, which integrate the energy levels of all detected photons, PCDs count the number of individual photons that exceed a specified energy level. For a given x-ray photon, the pulse height of the signal created by the charge deposition at the anode is proportional to the energy of the photon. Thus, the signal from PCDs carries with it energy information about each individually detected photon. The output signal from a PCD is processed by multiple electronic comparators and counters, where the number of comparators and counters depends on the electronic design of the PCD and its ASICs. Each detected signal is compared with a voltage that has been calibrated to reflect a specified photon energy level, referred to as an energy threshold. When the energy level of a detected photon exceeds an energy threshold associated with a counter, the photon count is increased by one. In this manner, the number of photons that have energy equal to or greater than a specified energy level is measured. This process is enabled by the very fast ASIC, a key element in PCDs.
The detector absorption efficiency depends on the detector material used and its thickness. High-atomic-number sensor materials such as cadmium telluride and cadmium zinc telluride have higher absorption efficiency per unit thickness and are the most common detector materials in PCDs (25). In general, the absorption efficiency is comparable between EIDs and PCDs (8); however, it may vary, depending on the specific design of each detector.
A detailed comparison between conventional EIDs and PCDs is given in Table 2.
Table 2:
Comparisons between Conventional EIDs and PCDs
PCD Datasets
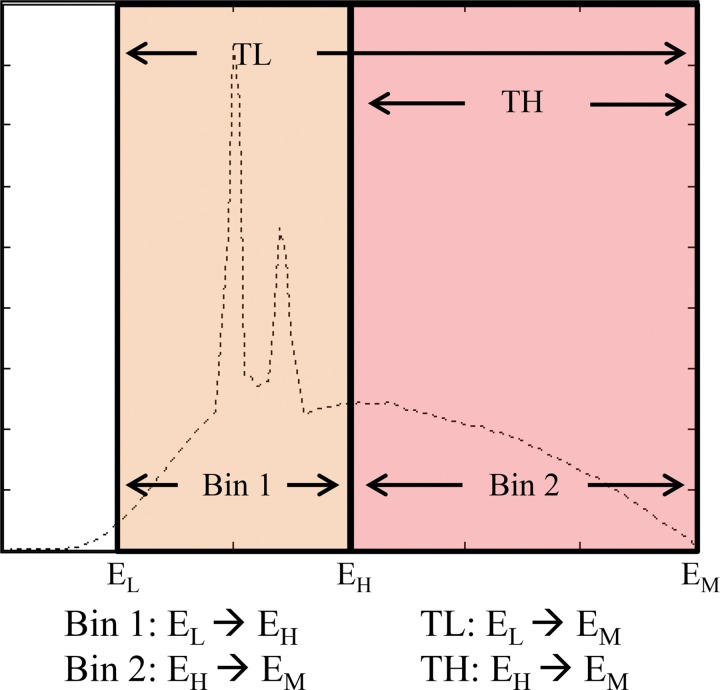
The number of energy thresholds of a PCD depends on the ASIC design, usually between two and eight thresholds. Users must set up the energy thresholds (in kiloelectron volts) before data acquisition. The output data at each energy threshold represent the number of photons with energy equal to or higher than the threshold, up to the maximum photon energy determined according to the tube potential (in kilovolts). Subtraction of the counts associated with two different energy thresholds creates energy bin data, which represent the number of photons between two different energy thresholds (Fig 2).
Figure 2.
PCD datasets for the x-ray tube potential or energy maximum (EM) and two energy thresholds (low-energy [EL] and high-energy [EH] thresholds): the two threshold datasets (low threshold [TL] and high threshold [TH]) correspond to photons with energy levels higher than the respective thresholds (EL, EH) but lower than the tube potential (EM), and two bin data (Bin 1 and Bin 2) corresponding to photons with energy levels between (arrow between energy levels) the two energy thresholds (Bin 1) or between the high-energy threshold and the tube potential (Bin 2). Note that high-threshold and Bin 2 data are identical. (Adapted and reprinted, with permission, from reference 8.)
For example, a PCD CT scan performed at 140 kV with energy thresholds of 25 and 65 keV facilitates the creation of two energy-threshold datasets, with photon energy ranges of 25–140 keV and 65–140 keV, respectively. Two energy bin datasets are then generated by the subtraction of the two threshold data, which gives 25–65 keV and 65–140 keV. Note that the highest energy bin data (ie, 65–140 keV) cover the same energy range as the highest energy threshold data (65–140 keV), making them identical datasets.
PCD CT
Micro CT and preclinical CT scanners that are capable of phantom and small-animal studies have been developed and evaluated (15–17,26–33). With smaller detector sizes and a limited field of view, these systems have enabled investigators to understand the basic principles governing the technology and the underlying physics. A preclinical PCD scanner using cadmium telluride was built on the basis of a clinical CT system gantry (Brilliance iCT; Philips Healthcare, Haifa, Israel), with a 16.8-cm in-plane field of view and 2.5-mm longitudinal coverage. Results of phantom and animal studies (20,34,35) performed with this system have been reported, including applications such as dual–contrast agent and K-edge imaging.
In 2010, a whole-body research PCD CT system was introduced (Somatom Count; Siemens Healthineers, Forchheim, Germany) that was the first PCD CT system capable of performing studies in human subjects (8,19). This system was built with a second-generation dual-source CT platform in which one source was coupled to an EID and the other to a PCD (Fig 3a). The PCD subsystem allows for high photon flux values, with tube current up to 550 mAs, which is sufficient for most clinical examinations (8). The ASICs associated with each subpixel allow for two energy thresholds (low and high thresholds). In the current implementation, the x-ray tube coupled with the PCD subsystem is the same as that of the EID subsystem. However, it is possible that the x-ray source and beam filtration could be optimized further for PCDs to improve system performance.
Figure 3a.
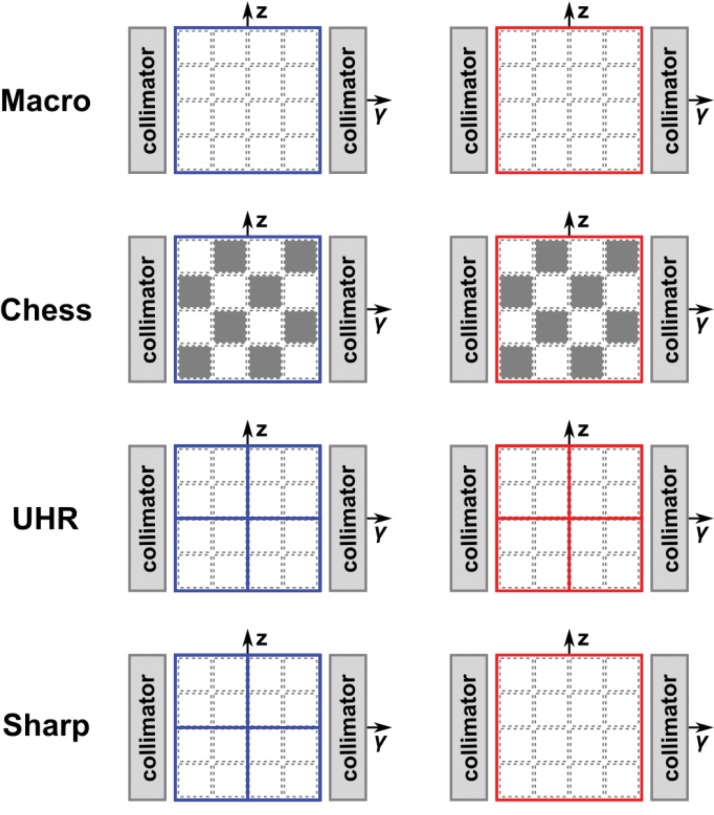
A whole-body research PCD CT scanner capable of human imaging at a clinical dose rate was built on the basis of a dual-source CT system with one of the EID arrays replaced with a cadmium telluride–based PCD array (a). The PCD CT system has four different acquisition modes (macro, chess, ultra-high-resolution [UHR], and sharp modes), each corresponding to a specific detector configuration (b). (Fig 3a adapted and reprinted, with permission, from reference 8.)
Figure 3b.
A whole-body research PCD CT scanner capable of human imaging at a clinical dose rate was built on the basis of a dual-source CT system with one of the EID arrays replaced with a cadmium telluride–based PCD array (a). The PCD CT system has four different acquisition modes (macro, chess, ultra-high-resolution [UHR], and sharp modes), each corresponding to a specific detector configuration (b). (Fig 3a adapted and reprinted, with permission, from reference 8.)
The PCD technique provides great flexibility in adjusting imaging resolution and the number of energy thresholds by combining detector pixels and using different pairings of energy thresholds. For example, on the current whole-body research PCD CT system, there are four data acquisition modes (Fig 3b): macro mode, chess mode, UHR mode, and sharp mode, depending on the energy-threshold and pixel configuration (8,36).
In the macro mode, the 4 × 4 neighboring subpixels (native detector elements) are grouped into one macro pixel, resulting in an effective pixel size of 0.5 mm × 0.5 mm at the isocenter. The same two energy thresholds are applied to all subpixels, resulting in a total of two energy bin datasets.
In the chess mode, the energy thresholds assigned to each subpixel in a macro pixel follow a chessboard pattern, effectively resulting in four energy thresholds. The chess mode is intended as a convenient way to provide four threshold datasets with ASICs that offer only two energy thresholds for each pixel. However, it is radiation dose inefficient, because only one-half of the delivered photons are used to create any given threshold dataset.
In UHR mode, the detector elements are grouped into a 2 × 2 pattern (instead of the 4 × 4 pattern as in macro and chess modes), resulting in an effective pixel size of 0.25 mm × 0.25 mm at the isocenter. The UHR mode was implemented to take advantage of the smaller subpixel size and to meet the clinical need for high spatial resolution in lung, vascular, musculoskeletal, and temporal bone applications. In the current implementation, only two energy thresholds are enabled for the UHR mode, which is similar to the macro mode.
In the sharp mode, the low-energy-threshold data are acquired with the same pixel dimension as that in the UHR mode, while the high-energy-threshold data are acquired with the pixel size of the macro mode. With the sharp mode, the low-energy-threshold dataset permits high-spatial-resolution anatomic imaging. Recall that the low-threshold data are generated with the use of all available photons, which, therefore, have the lowest noise and can tolerate a small pixel size. On the other hand, high-threshold data are generated from relatively fewer photons, and therefore, have stronger noise. Since the high-threshold data are only required for dual-energy processing, which is susceptible to noise amplification, higher spatial resolution is less desirable and the larger pixel size for high-threshold data can help to improve the signal-to-noise ratio.
Clinical Benefits and Applications of PCD CT
In this section, we discuss in detail the benefits of the PCD CT system and potential clinical applications, with sample cases associated with each of the applications. A general summary of the clinical applications of PCD CT is found in Table 1.
Reduced Electronic Noise
Noise on CT images originates from two sources: quantum noise and electronic noise. The quantum noise can be traced back to the random nature of x-ray photon interactions and is determined by the number of photons detected. The electronic noise, on the other hand, mainly originates from the analog electronic circuits in the x-ray detection system and is independent of the number of detected photons. The relative effect of these two noise sources is determined by the incident photon flux. In the realm of high photon flux, the quantum noise dominates the total noise magnitude, and the effect of electronic noise is negligible. However, when the number of detected photons is low, the magnitude of the electronic noise can be similar to or higher than that of the quantum noise. With modern EID CT systems, the electronic noise is usually negligible for protocols in which clinical radiation dose levels are used in average-sized patients. However, for low-dose scans or in morbidly obese patients, electronic noise can degrade image quality, particularly along highly attenuating path lengths (eg, through the shoulders) (Fig 4) (37,38).
Figure 4a.
The shoulder section of a thorax phantom reconstructed from data acquired with EID CT (a) and with PCD CT (b) using the same x-ray tube potential and radiation dose. Compared with the image acquired with EID CT, the PCD CT image has noticeably fewer horizontal streaking artifacts and an overall more uniform appearance, which indicates that electronic noise has a more noticeable effect on the EID image than on the PCD image. (Reprinted, with permission, from reference 39.)
Figure 4b.
The shoulder section of a thorax phantom reconstructed from data acquired with EID CT (a) and with PCD CT (b) using the same x-ray tube potential and radiation dose. Compared with the image acquired with EID CT, the PCD CT image has noticeably fewer horizontal streaking artifacts and an overall more uniform appearance, which indicates that electronic noise has a more noticeable effect on the EID image than on the PCD image. (Reprinted, with permission, from reference 39.)
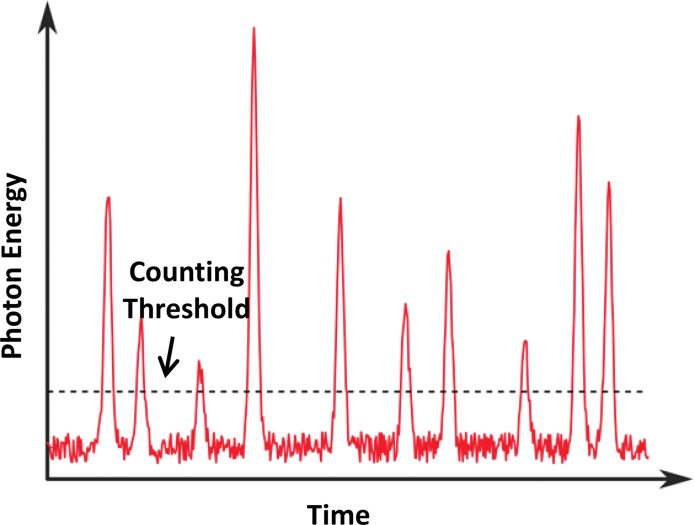
Because electronic noise usually is detected as a low-amplitude signal, it is interpreted by a PCD as a photon with energy located at the lower end of a typical x-ray spectrum. Thus, by setting the low energy threshold to be slightly higher than the energy level associated with the electronic noise signal amplitude (eg, 25 keV), electronic noise can be excluded readily from the measured count data (10), as demonstrated in Figure 5. Since a signal with an energy level lower than this threshold is very unlikely to be caused by a primary photon transmitted through the imaging object of interest, it typically does not contain meaningful information vital to any clinical task. However, electronic noise can have some effect on the detected energy spectrum, because its signal amplitude is added to that of a detected photon, which consequently artificially increases the energy of the detected photon.
Figure 5.
Graph shows signals of individual x-ray photons detected with the use of a PCD, with additive electronic noise. The PCD is able to discriminate the energy of each incident x-ray photon. Since the electronic noise usually is detected as a low-amplitude signal, it can be excluded readily from the measured counting data by setting a proper counting energy threshold to be slightly higher than the energy level associated with the electronic noise amplitude.
The intrinsic advantage of a PCD system for excluding electronic noise can be beneficial particularly for examinations with low detector signal intensity, such as those in morbidly obese patients and those performed with a low radiation dose (39). In these scenarios, the electronic noise can reduce image uniformity and cause noticeable streak artifacts on images acquired with an EID CT system compared with images from a PCD CT system, which have been shown to be more immune to the effect of electronic noise (Fig 4) (39). This rejection of electronic noise in a PCD CT system can be used to reduce overall image noise and improve image diagnostic quality for low-dose examinations. For low-dose lung cancer screening, PCD CT was shown to provide better CT number stability and scan reproducibility, as well as reduced image noise when compared with EID CT (21). Alternatively, a lower radiation dose can be used with a PCD system to reach the same noise level as that achieved with an EID CT system and a higher dose level, thereby improving dose efficiency.
Improved Iodine Contrast-to-Noise Ratio and Radiation Dose Efficiency
In the diagnostic x-ray energy range, the x-ray photons primarily interact with the scanned object through two physical mechanisms: the photoelectric effect (µPE) and Compton scattering. The attenuation due to photoelectric effect is proportional to the effective atomic number (Z) of a material and is inversely proportional to the energy (E) of incident x-ray photons:
,while the Compton scattering effect is relatively independent of material composition, and its energy dependence is relatively flat at a diagnostic energy range. Photoelectric effect contributes more to the attenuation of low-energy photons, while Compton scattering is the dominant effect that accounts for high-energy photons. Consequently, high-Z materials such as iodine allow better contrast on CT images because of stronger photon attenuation in the low-energy range through the photoelectric effect.
For a conventional EID CT system, the detector signal is proportional to the total energy of all detected x-ray photons. Therefore, lower-energy photons contribute relatively less to the detector signal than do higher-energy photons, which have less information content from high-Z materials such as iodine. Consequently, the underweighting of signal produced by lower-energy photons reduces the contrast-to-noise ratio of iodine signal in an EID CT system. However, PCD CT systems count each individual photon equally, regardless of the measured photon energy. Hence, the low-energy photons contribute more to the image contrast for PCD CT than for EID CT, which improves the image contrast and contrast-to-noise ratio of iodine contrast material (9–13,40–48). The increased iodine contrast can be observed for different patient sizes, ranging from newborns to large adults, and is more pronounced for higher tube potentials, such as 120 or 140 kV (19). Higher tube potentials are especially relevant in imaging of moderately sized to large patients. The improved iodine contrast on a PCD CT system results in an improved iodine contrast-to-noise ratio if radiation dose is maintained. Alternatively, if the same iodine contrast-to-noise ratio is desired, the PCD CT system acquisition can be altered to reduce either the radiation dose or the volume of iodine contrast agent compared with those with conventional EID CT. The contrast-to-noise ratio for a given material can be increased further by designing an optimal weighting scheme for the different narrow energy bin datasets available from a single PCD scan (49,50). Such schemes typically weight each energy bin dataset according to its image contrast level and noise variance. The weighted energy bin images are then combined to yield a final image with an improved contrast-to-noise ratio. The amount of improvement in contrast-to-noise ratio depends on the object size and material, the x-ray tube potential, the PCD energy threshold settings, and the energy response of the EID detector.
Reduction of Beam-hardening and Metal Artifacts
As photons pass through the scanned object, low-energy photons are preferentially attenuated compared with high-energy photons. Since polyenergetic beams are used in CT, this causes the effective photon energy to be shifted toward the higher end of the spectrum (a phenomenon known as beam hardening). This introduces artifacts, which are typically dark areas adjacent to highly attenuating objects such as cortical bone and metal implants, affecting the image appearance and CT number accuracy for nearby soft tissues.
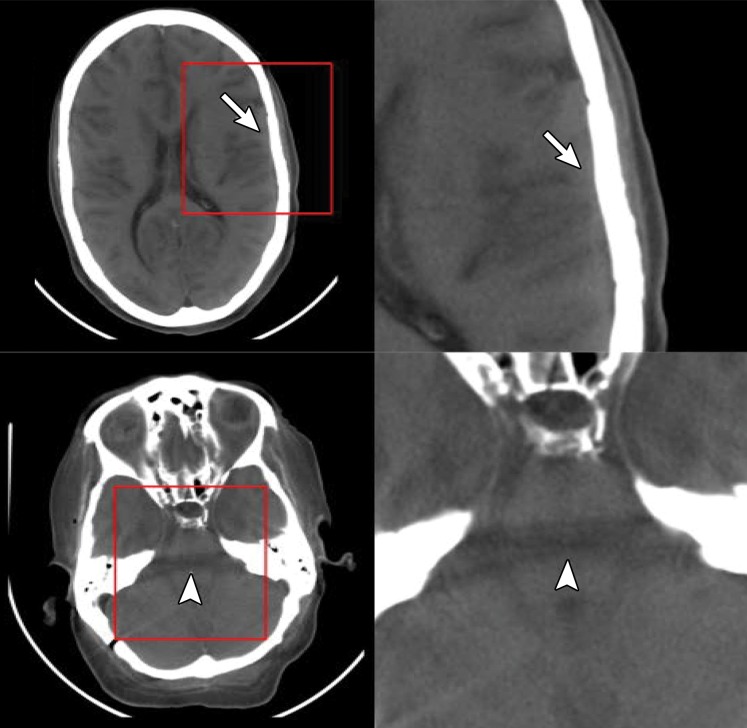
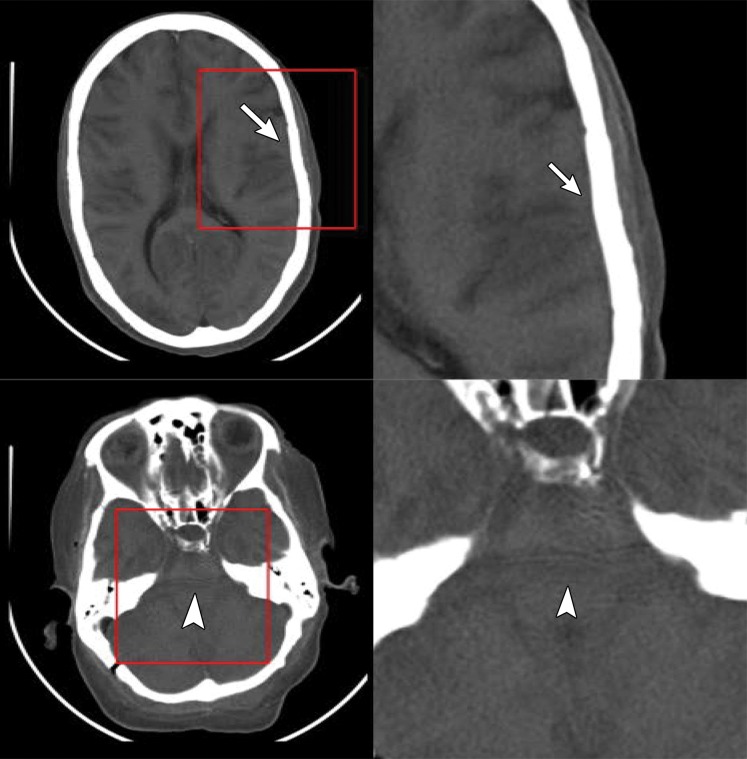
Since each individual photon is sorted according to its energy level at PCD CT, an energy bin image can be reconstructed with the use of only higher-energy photons (51). Compared with the conventional EID CT image or the low-energy-threshold image in a PCD acquisition, the high-energy-bin image is more immune to beam-hardening effects in areas around dense bones, such as the area around the posterior fossa (Fig 6). The high-energy-bin image also demonstrates reduced calcium blooming, which typically is observed around the interface between the calvarium and the brain (Fig 6) (8,19). However, the use of high-energy signal to reduce beam-hardening effects is at the cost of increased image noise and reduced radiation dose efficiency, because the lower energy photons are not used in the generation of the high-energy-bin image. To improve dose efficiency, the incident x-ray beam can be hardened further with additional filtration such as that with a tin filter, which increases the relative percentage of photons in the high-energy bin. The combination of using the high-energy-bin image and tin beam filtration can further reduce metal artifacts and image noise, thus providing improved delineation for tissue regions that would otherwise be affected by prominent metal artifacts (Fig 7) (52). Unlike true monochromatic x-ray imaging (such as that based on a synchrotron source) (53), the use of the PCD high-energy bin and additional filtration can reduce beam-hardening and metal artifacts but cannot completely eliminate them, because the quasi-monochromatic narrow energy bin images are reconstructed from a polychromatic x-ray spectrum.
Figure 6a.
Artifacts on EID and low- and high-energy PCD images. Axial EID (a), low-energy-threshold PCD (b), and high-energy-threshold PCD (c) CT images in a cadaver head (left images) and magnified images (right images) of the areas outlined in red squares show that the high-energy-threshold PCD CT images (c) have fewer blooming artifacts (arrows) and beam- hardening artifacts (arrowheads) than do the EID CT images (a) and low-energy-threshold PCD CT images (b). (Reprinted, with permission, from reference 19.)
Figure 7a.
Reduction of metal artifacts at PCD CT. Axial EID (a) and PCD (b) CT images of a fused lumbar spine in a 55-year-old man show that the reduction of metal artifacts arising from the posterior metallic hardware enables visualization of the spinal canal, which was obscured by the metal artifacts on a.
Figure 6b.
Artifacts on EID and low- and high-energy PCD images. Axial EID (a), low-energy-threshold PCD (b), and high-energy-threshold PCD (c) CT images in a cadaver head (left images) and magnified images (right images) of the areas outlined in red squares show that the high-energy-threshold PCD CT images (c) have fewer blooming artifacts (arrows) and beam- hardening artifacts (arrowheads) than do the EID CT images (a) and low-energy-threshold PCD CT images (b). (Reprinted, with permission, from reference 19.)
Figure 6c.
Artifacts on EID and low- and high-energy PCD images. Axial EID (a), low-energy-threshold PCD (b), and high-energy-threshold PCD (c) CT images in a cadaver head (left images) and magnified images (right images) of the areas outlined in red squares show that the high-energy-threshold PCD CT images (c) have fewer blooming artifacts (arrows) and beam- hardening artifacts (arrowheads) than do the EID CT images (a) and low-energy-threshold PCD CT images (b). (Reprinted, with permission, from reference 19.)
Figure 7b.
Reduction of metal artifacts at PCD CT. Axial EID (a) and PCD (b) CT images of a fused lumbar spine in a 55-year-old man show that the reduction of metal artifacts arising from the posterior metallic hardware enables visualization of the spinal canal, which was obscured by the metal artifacts on a.
High-Spatial-Resolution CT
Conventional EIDs require a finite-width reflective layer (septum) between detector pixels to avoid signal (visible light) leakage to neighboring detector pixels. Designing smaller detector pixels leads to an increase in the relative area of the septum compared with the scintillator material and a corresponding decrease in the fill factor, which consequently reduces the geometric dose efficiency. Another approach to high-spatial-resolution imaging is to place a dedicated attenuating filter (in the form of a comb or grid) in front of the detector array to reduce the detector pixel aperture, consequently reducing the effective detector pixel size (54). Because the high-spatial-resolution filter is placed directly in front of the detector, the x-rays blocked by the filter have already passed through the patient and contributed to the radiation dose but have not been detected by the detector; therefore, the use of this filter reduces radiation dose efficiency.
Although high-spatial-resolution CT is used currently in clinical practice for specific tasks such as temporal bone and extremity imaging, its use throughout the body has been restricted because of the dose inefficiency of this approach. Since PCDs use direct conversion technology, detector pixels can be designed without a mechanical separation (septum), which inherently improves the geometric dose efficiency. The use of smaller PCD pixels eliminates the need for high-spatial-resolution comb or grid filters, thereby enabling dose-efficient high-spatial-resolution imaging. Typical detector pixel sizes of 55–1000 mm (pixel pitch) have been reported in the literature (8,55,56).
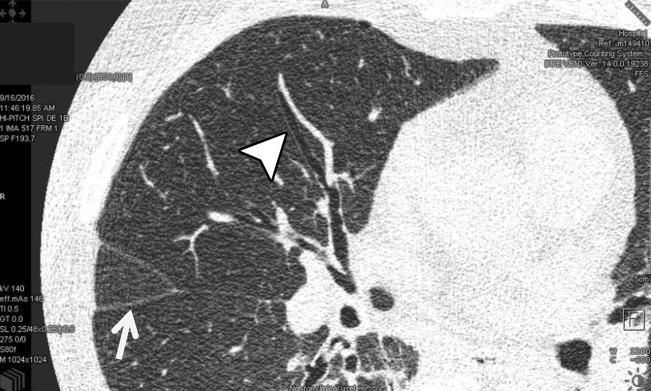
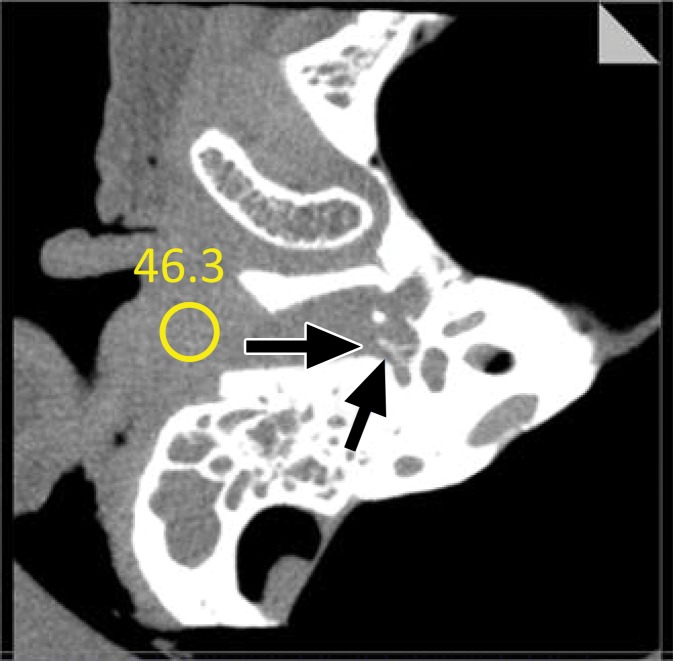
The sharp and UHR modes on the whole-body PCD CT system have an effective detector pixel size of 0.25 mm × 0.25 mm. The small detector pixel size allows spatial resolution to be limited to 150 µm (22). Numerous clinical applications may benefit from this improved spatial resolution, including lung, temporal bone, musculoskeletal, and vascular imaging. Figure 8 shows sample images of lung and wrist CT examinations performed in UHR mode. For the lung image, the benefit of high spatial resolution is shown with accurate delineation of the lung fissures and airway walls. In the wrist image, the high spatial resolution enables excellent visualization of the trabecular bone structures. Figure 9 shows sample EID and PCD CT images of a coronary stent. Individual struts are clearly delineated on the PCD CT images because of their high spatial resolution. Example EID images of the temporal bone acquired with high-spatial-resolution comb filters and PCD images acquired with UHR mode are shown in Figure 10. Note the higher conspicuity of the stapes superstructure on the PCD CT image compared with that on the EID CT image.
Figure 8a.
CT imaging in UHR mode. In vivo axial CT image of the lung in a 69-year-old woman (a) and coronal CT image of the wrist in a 59-year-old man (b) show that high spatial resolution enables accurate delineation of lung fissures (arrow in a), airway walls (arrowhead in a), and trabecular bone.
Figure 9a.
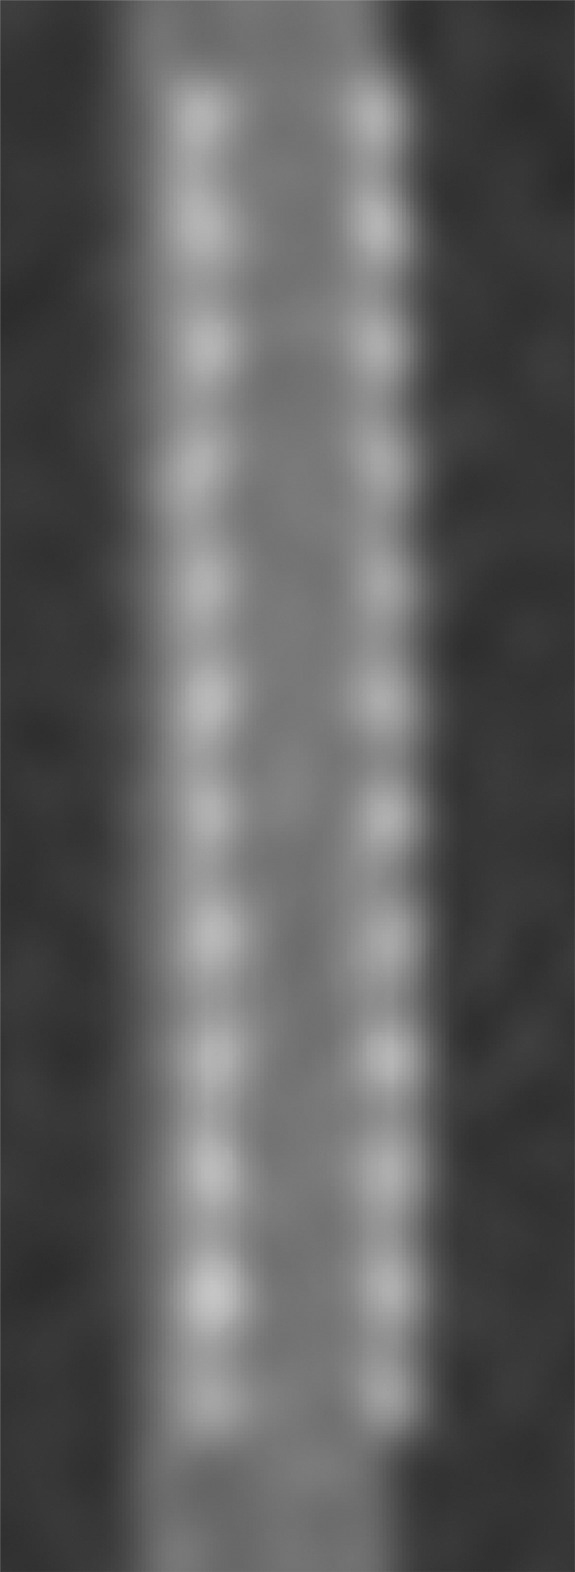
Coronal EID (a) and PCD CT images acquired in UHR mode (b) show examples of a coronary stent. The PCD image clearly shows the individual struts, which are evident on the corresponding three-dimensional rendering (c) of the PCD CT image.
Figure 10a.
Axial EID image (a) and PCD CT image acquired in UHR mode (b) of a cadaveric temporal bone specimen. The conspicuity of the stapes superstructure (arrows) is higher on the PCD CT image, and noise reduction of 29% was achieved with PCD CT at matched dose levels. (Reprinted, with permission, from reference 66.)
Figure 8b.
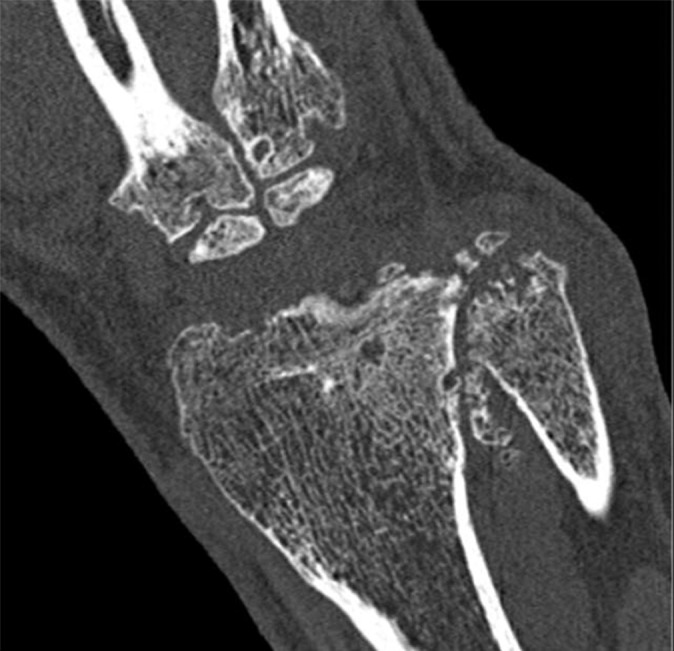
CT imaging in UHR mode. In vivo axial CT image of the lung in a 69-year-old woman (a) and coronal CT image of the wrist in a 59-year-old man (b) show that high spatial resolution enables accurate delineation of lung fissures (arrow in a), airway walls (arrowhead in a), and trabecular bone.
Figure 9b.

Coronal EID (a) and PCD CT images acquired in UHR mode (b) show examples of a coronary stent. The PCD image clearly shows the individual struts, which are evident on the corresponding three-dimensional rendering (c) of the PCD CT image.
Figure 9c.

Coronal EID (a) and PCD CT images acquired in UHR mode (b) show examples of a coronary stent. The PCD image clearly shows the individual struts, which are evident on the corresponding three-dimensional rendering (c) of the PCD CT image.
Figure 10b.
Axial EID image (a) and PCD CT image acquired in UHR mode (b) of a cadaveric temporal bone specimen. The conspicuity of the stapes superstructure (arrows) is higher on the PCD CT image, and noise reduction of 29% was achieved with PCD CT at matched dose levels. (Reprinted, with permission, from reference 66.)
Compared with EID CT images acquired with UHR mode and comb or grid filters, PCD CT images acquired with high spatial resolution show lower image noise at the same radiation dose because of improved dose efficiency. Phantom and cadaveric studies have shown a 29% reduction in noise with PCD CT high-spatial-resolution acquisition compared with EID CT high-spatial-resolution acquisition at matched radiation dose levels (Fig 10). This translates to a 50% reduction in radiation dose with PCD CT to achieve the same noise levels between PCD CT with high spatial resolution and EID CT with high spatial resolution.
Simultaneous Multienergy Acquisition
One of the main driving forces of the development of PCD CT is that it allows the acquisition of simultaneous multienergy CT images. PCD CT inherently allows dual-energy or multienergy (>2) acquisitions at a single x-ray tube potential owing to its energy-discriminating ability. This unique feature enables single-source, single-tube-potential, single-acquisition, single detector-layer, and single-filter multienergy CT imaging with perfect temporal and spatial registration in the acquired multienergy data, thereby eliminating many sources of artifacts. The user-defined energy threshold selection provides the freedom to select the correct energy thresholds tailored to the specific diagnostic task. For example, by selecting energy thresholds lower and higher than the K edge of a specific contrast agent, PCD CT may enable K-edge imaging. This task-driven energy-threshold selection helps resolve different tissue types or contrast media with optimal imaging settings to achieve the best image quality or lowest radiation dose. Also, the K-edge imaging ability of PCD CT has provided the opportunity for development of new types of contrast agents and imaging techniques such as nanoparticle-based blood pool imaging (57,58) or targeted imaging (29,59,60) with multiple-contrast-agent multiphase imaging (61–63). However, these are primarily research methods that are yet to be translated to mainstream clinical practice.
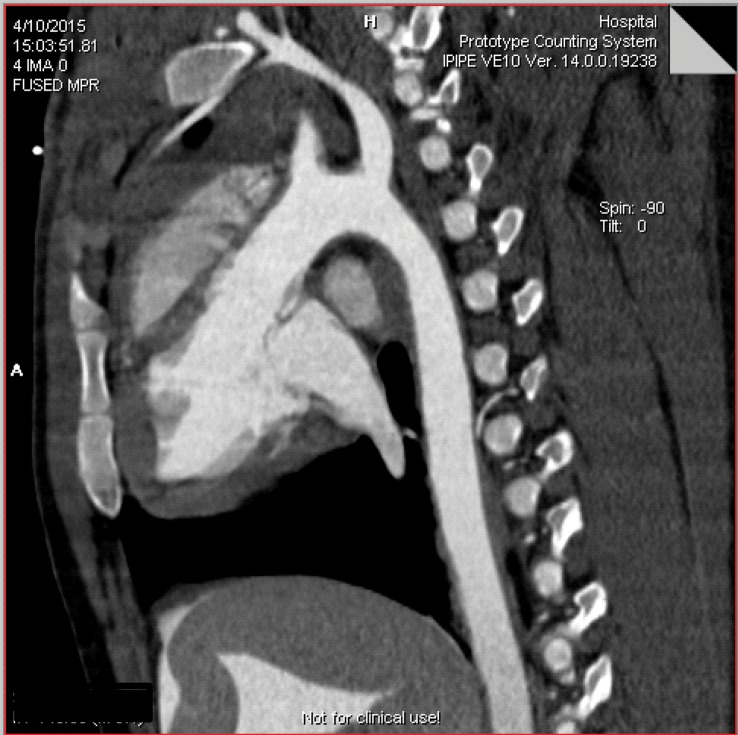
Multienergy PCD CT provides opportunities for advanced data processing, such as creation of virtual monoenergetic images, virtual noncontrast images, and images with automated bone removal. Figure 11 shows sample CT angiograms in a living swine with the PCD CT system, both a conventional single-energy image (Fig. 11a) and an iodine map image (Fig. 11b) after material decomposition. PCD CT has been shown to provide accurate iodine quantification (root mean square error of 0.5 mg of iodine per milliliter) for concentrations of 2–20 mg of iodine per milliliter at different phantom sizes (64). In addition, accurate CT numbers across different object sizes can be achieved on virtual monoenergetic images, with a percentage of error of 8.9% (64).
Figure 11a.
Sagittal single-energy CT angiogram (a) and iodine map (b) after material decomposition acquired with a whole-body PCD CT system in a living swine.
Figure 11b.
Sagittal single-energy CT angiogram (a) and iodine map (b) after material decomposition acquired with a whole-body PCD CT system in a living swine.
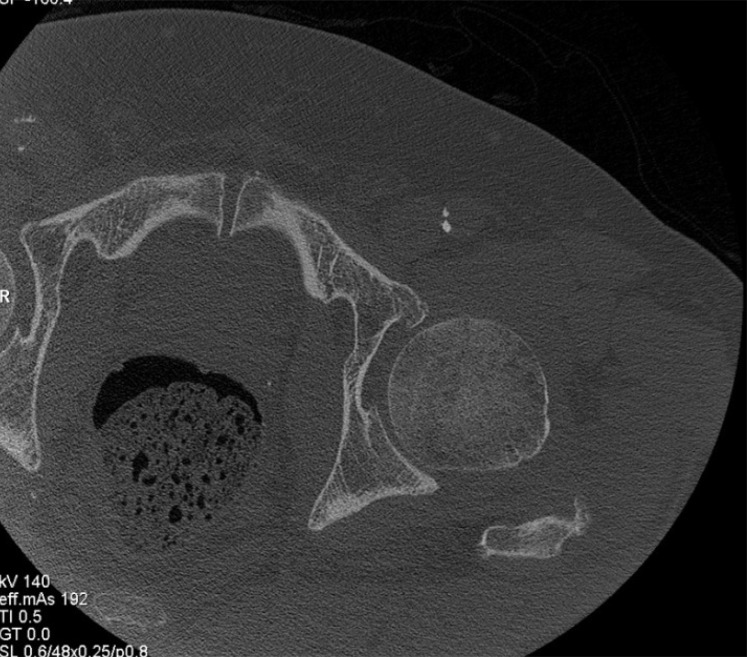
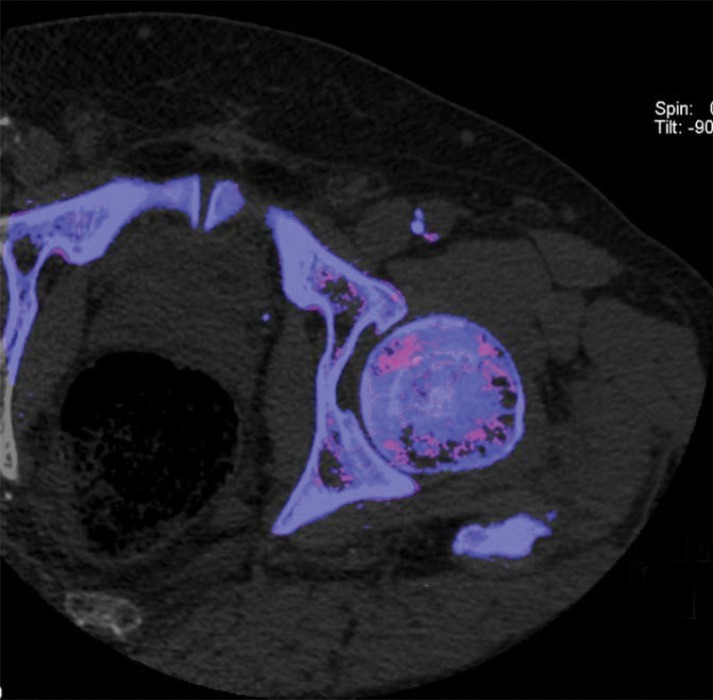
One specific aspect of PCD CT is its ability to allow simultaneous acquisition of high-spatial-resolution and multienergy images. Current dual-energy EID CT systems can be used to scan in either dual-energy mode or a UHR mode, but not both simultaneously. This creates a dilemma at clinical examinations in which both high-spatial-resolution and multienergy imaging are needed, such as musculoskeletal examinations. Figure 12 shows sample images of the pelvis acquired with a PCD CT system. The low-energy-threshold image shows clear delineation of fine bony structures and is used for standard diagnostic tasks (Fig 12a). With the use of low- and high-energy data that are simultaneously acquired, dual-energy postprocessing can be performed to remove bony anatomy from images or to evaluate for the presence of gout (Fig 12b, 12c). Similarly, in renal stone applications, high-spatial-resolution images with 0.25-mm image thickness demonstrated previously unobservable morphologic features, such as a thin highly attenuating outer shell and internal texture information (Fig 13a), while the dual-energy analysis allowed determination of stone composition (Fig 13b, 13c).
Figure 12a.
Sample PCD CT images, which were acquired with simultaneous high-spatial-resolution and multienergy capabilities, of the pelvis in a 72-year-old man. The high-spatial-resolution low-energy-threshold image (a) is used as a standard single-energy image for routine diagnosis, while dual-energy images can be processed for bone removal (b) or ruling out the presence of gout (c).
Figure 13a.

Renal stones in a 64-year-old man. (a) High-resolution single-energy PCD CT image shows the morphologic features of the stones. (b) Dual-energy image shows the stone composition. (c) Cinematic three-dimensional volume-rendered image enhances the visualization of stone morphology and composition.
Figure 12b.
Sample PCD CT images, which were acquired with simultaneous high-spatial-resolution and multienergy capabilities, of the pelvis in a 72-year-old man. The high-spatial-resolution low-energy-threshold image (a) is used as a standard single-energy image for routine diagnosis, while dual-energy images can be processed for bone removal (b) or ruling out the presence of gout (c).
Figure 12c.
Sample PCD CT images, which were acquired with simultaneous high-spatial-resolution and multienergy capabilities, of the pelvis in a 72-year-old man. The high-spatial-resolution low-energy-threshold image (a) is used as a standard single-energy image for routine diagnosis, while dual-energy images can be processed for bone removal (b) or ruling out the presence of gout (c).
Figure 13b.
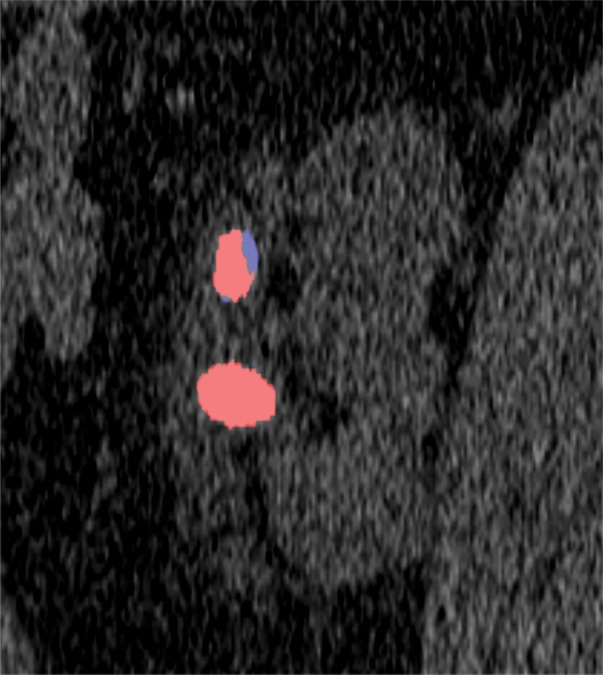
Renal stones in a 64-year-old man. (a) High-resolution single-energy PCD CT image shows the morphologic features of the stones. (b) Dual-energy image shows the stone composition. (c) Cinematic three-dimensional volume-rendered image enhances the visualization of stone morphology and composition.
Figure 13c.
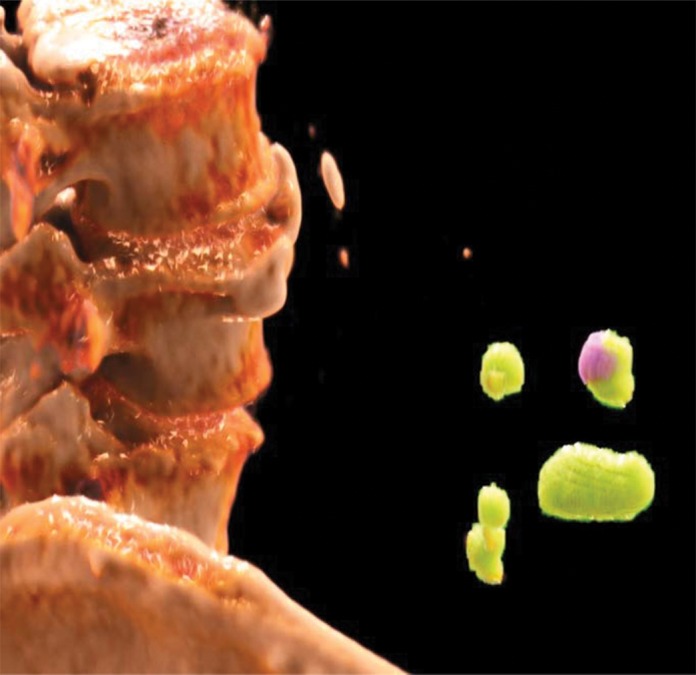
Renal stones in a 64-year-old man. (a) High-resolution single-energy PCD CT image shows the morphologic features of the stones. (b) Dual-energy image shows the stone composition. (c) Cinematic three-dimensional volume-rendered image enhances the visualization of stone morphology and composition.
Challenges
The PCD technique is not without limitations. There are still several technical challenges that must be addressed to realize the full potential of PCD CT. These include photon flux–independent effects such as charge sharing, charge trapping, and k fluorescence escape, as well as photon flux–dependent effects such as pulse pile-up (13). These nonideal effects can degrade the spatial resolution and energy-resolving ability of PCD, leading to compromised system performance. We refer interested readers to technical literature (13,30,65) for detailed discussions on these effects. In addition, the current PCD CT research systems have a limited field of view; however, this is not a fundamental limitation of the PCD technology and can be addressed readily by increasing the detector units mounted onto the scanner.
For a PCD CT acquisition, the transmitted x-ray spectrum is divided into a number of different energy bins, and the number of photons within any energy bin is less than the total number of photons reaching the detector. Reduced photon counts can substantially increase the noise on the energy bin images (4). In addition, the reduced detector size for UHR mode PCD CT also leads to increased image noise, because the number of photons hitting each detector cell is decreased (66). To address these challenges, various noise reduction and iterative image reconstruction algorithms have been developed (67–72). Iterative methods involving statistical and physical models for PCD-based x-ray measurements have allowed reconstruction of low-noise PCD CT images, reduced spectral distortion, and direct material reconstruction abilities (73–77). In addition to the conventional CT denoising strategies, techniques that exploit data redundancy that exist within a PCD dataset have been developed and can allow reduction in image noise while preserving the spatial and spectral resolution for multienergy PCD datasets (Fig 14) (70).
Figure 14a.
Axial reconstructed images in a swine. (a, b) Low-threshold CT image (corresponding to 20–140 keV) (a) and energy bin CT image (20–25 keV) (b) reconstructed with standard filtered back projection. Note the higher noise in the energy bin image (b) compared with that in the low-threshold image (a). (c) Energy bin CT image reconstructed with the spectral prior image constrained compressed sensing technique from the same dataset as that for b shows reduced image noise and preserved spatial and spectral information. (Reprinted, with permission, from reference 70.)
Figure 14b.
Axial reconstructed images in a swine. (a, b) Low-threshold CT image (corresponding to 20–140 keV) (a) and energy bin CT image (20–25 keV) (b) reconstructed with standard filtered back projection. Note the higher noise in the energy bin image (b) compared with that in the low-threshold image (a). (c) Energy bin CT image reconstructed with the spectral prior image constrained compressed sensing technique from the same dataset as that for b shows reduced image noise and preserved spatial and spectral information. (Reprinted, with permission, from reference 70.)
Figure 14c.
Axial reconstructed images in a swine. (a, b) Low-threshold CT image (corresponding to 20–140 keV) (a) and energy bin CT image (20–25 keV) (b) reconstructed with standard filtered back projection. Note the higher noise in the energy bin image (b) compared with that in the low-threshold image (a). (c) Energy bin CT image reconstructed with the spectral prior image constrained compressed sensing technique from the same dataset as that for b shows reduced image noise and preserved spatial and spectral information. (Reprinted, with permission, from reference 70.)
Conclusion
PCD CT is an emerging technology that, compared with conventional EID detector technology, has multiple advantages owing to its unique interaction physics, especially its dose-efficient, high-spatial-resolution, and energy-discrimination abilities. In addition to multiple preclinical systems, a whole-body research PCD CT system has been used to demonstrate a number of clinical benefits in human subjects. Large-scale production of high-quality PCDs at an affordable price remains the primary limit to commercialization of this technology. However, research into and development of PCD technology are sure to continue so that the theoretical and demonstrated benefits of PCDs can be translated into clinical practice.
Supported by the National Institutes of Health (EB016966, RR018898).
Presented as an education exhibit at the 2017 RSNA Annual Meeting.
For this journal-based SA-CME activity, the authors A.F.H. and C.H.M. have provided disclosures; all other authors, the editor, and the reviewers have disclosed no relevant relationships.
The content is solely the responsibility of the authors and does not necessarily represent the official views of the National Institutes of Health. The device described is a research scanner and is not commercially available.
Disclosures of Conflicts of Interest.—: A.F.H. Activities related to the present article: disclosed no relevant relationships. Activities not related to the present article: employed by Siemens Healthineers. Other activities: disclosed no relevant relationships. C.H.M. Activities related to the present article: disclosed no relevant relationships. Activities not related to the present article: royalties from Bayer Healthcare, grants/grants pending from Siemens Healthineers, intellectual property rights for patents owned by Mayo Clinic. Other activities: disclosed no relevant relationships.
Abbreviations:
- ASIC
- application-specific integrated circuit
- EID
- energy-integrating detector
- PCD
- photon-counting detector
- UHR
- ultra-high-resolution mode
References
- 1.The Organisation for Economic Co-operation and Development . Computed tomography (CT) exams (indicator). OECD website. https://data.oecd.org/healthcare/computed-tomography-ct-exams.htm. Published 2018. Accessed March 23, 2018. [Google Scholar]
- 2.Shefer E, Altman A, Behling R, et al. State of the art of CT detectors and sources: a literature review. Curr Radiol Rep 2013;1(1):76–91. [Google Scholar]
- 3.Johnson T, Fink C, Schönberg SO, Reiser MF, eds. Dual energy CT in clinical practice. Heidelberg, Germany: Springer, 2011. [Google Scholar]
- 4.McCollough CH, Leng S, Yu L, Fletcher JG. Dual- and multi-energy CT: principles, technical approaches, and clinical applications. Radiology 2015;276(3):637–653. [DOI] [PMC free article] [PubMed] [Google Scholar]
- 5.Johnson TR. Dual-energy CT: general principles. AJR Am J Roentgenol 2012;199(5 suppl):S3–S8. [DOI] [PubMed] [Google Scholar]
- 6.Johnson TR, Krauss B, Sedlmair M, et al. Material differentiation by dual energy CT: initial experience. Eur Radiol 2007;17(6):1510–1517. [DOI] [PubMed] [Google Scholar]
- 7.Pourmorteza A, Symons R, Sandfort V, et al. Abdominal imaging with contrast-enhanced photon-counting CT: first human experience. Radiology 2016;279(1):239–245. [DOI] [PMC free article] [PubMed] [Google Scholar]
- 8.Yu Z, Leng S, Jorgensen SM, et al. Evaluation of conventional imaging performance in a research whole-body CT system with a photon-counting detector array. Phys Med Biol 2016;61(4):1572–1595. 10.1088/0031-9155/61/4/1572 [DOI] [PMC free article] [PubMed] [Google Scholar]
- 9.Bennett JR, Opie AM, Xu Q, et al. Hybrid spectral micro-CT: system design, implementation, and preliminary results. IEEE Trans Biomed Eng 2014;61(2):246–253. [DOI] [PubMed] [Google Scholar]
- 10.Iwanczyk JS, Nygård E, Meirav O, et al. Photon counting energy dispersive detector arrays for x-ray imaging. IEEE Trans Nucl Sci 2009;56(3):535–542. [DOI] [PMC free article] [PubMed] [Google Scholar]
- 11.Schlomka JP, Roessl E, Dorscheid R, et al. Experimental feasibility of multi-energy photon-counting K-edge imaging in pre-clinical computed tomography. Phys Med Biol 2008;53(15):4031–4047. [DOI] [PubMed] [Google Scholar]
- 12.Shikhaliev PM. Energy-resolved computed tomography: first experimental results. Phys Med Biol 2008;53(20):5595–5613. [DOI] [PubMed] [Google Scholar]
- 13.Taguchi K, Iwanczyk JS. Vision 20/20: Single photon counting x-ray detectors in medical imaging. Med Phys 2013;40(10):100901. [DOI] [PMC free article] [PubMed] [Google Scholar]
- 14.Xu C, Danielsson M, Karlsson S, Svensson C, Bornefalk H. Preliminary evaluation of a silicon strip detector for photon-counting spectral CT. Nucl Instrum Methods Phys Res A 2012;677:45–51. [Google Scholar]
- 15.Anderson NG, Butler AP, Scott NJ, et al. Spectroscopic (multi-energy) CT distinguishes iodine and barium contrast material in mice. Eur Radiol 2010;20(9):2126–2134. [DOI] [PubMed] [Google Scholar]
- 16.Rajendran K, Löbker C, Schon BS, et al. Quantitative imaging of excised osteoarthritic cartilage using spectral CT. Eur Radiol 2017;27(1):384–392. [DOI] [PubMed] [Google Scholar]
- 17.Xu Q, Yu H, Bennett J, et al. Image reconstruction for hybrid true-color micro-CT. IEEE Trans Biomed Eng 2012;59(6):1711–1719. [DOI] [PMC free article] [PubMed] [Google Scholar]
- 18.Yu Z, Leng S, Kappler S, et al. A prototype whole-body PCCT system: initial results in phantom, cadavers, and swine. The 3rd Workshop on Medical Applications of Spectroscopic X-Ray Detectors, 2015. [Google Scholar]
- 19.Gutjahr R, Halaweish AF, Yu Z, et al. Human imaging with photon counting-based computed tomography at clinical dose levels: contrast-to-noise ratio and cadaver studies. Invest Radiol 2016;51(7):421–429. [DOI] [PMC free article] [PubMed] [Google Scholar]
- 20.Muenzel D, Bar-Ness D, Roessl E, et al. Spectral photon-counting CT: initial experience with dual-contrast agent K-edge colonography. Radiology 2017;283(3):723–728. [DOI] [PubMed] [Google Scholar]
- 21.Symons R, Cork TE, Sahbaee P, et al. Low-dose lung cancer screening with photon-counting CT: a feasibility study. Phys Med Biol 2017;62(1):202–213. [DOI] [PMC free article] [PubMed] [Google Scholar]
- 22.Leng S, Rajendran K, Gong H, et al. 150-μm spatial resolution using photon-counting detector computed tomography technology: technical performance and first patient images. Invest Radiol. 2018 Nov;53(11):655–662. [DOI] [PMC free article] [PubMed] [Google Scholar]
- 23.Xu C, Chen H, Persson M, et al. Energy resolution of a segmented silicon strip detector for photon-counting spectral CT. Nucl Instrum Methods Phys Res A 2013;715:11–17. [Google Scholar]
- 24.Tlustos L, Campbell M, Frojdh C, Kostamo P, Nenonen S. Characterisation of an epitaxial GaAs/Medipix2 detector using fluorescence photons. Nucl Instrum Methods Phys Res A 2008;591(1):42–45. [Google Scholar]
- 25.Hamann E, Koenig T, Zuber M, et al. Performance of a Medipix3RX spectroscopic pixel detector with a high resistivity gallium arsenide sensor. IEEE Trans Med Imaging 2015;34(3):707–715. [DOI] [PubMed] [Google Scholar]
- 26.Aamir R, Chernoglazov A, Bateman CJ, et al. MARS spectral molecular imaging of lamb tissue: data collection and image analysis. J Instrum 2014;9(02):P02005. [Google Scholar]
- 27.Bornefalk H, Danielsson M. Photon-counting spectral computed tomography using silicon strip detectors: a feasibility study. Phys Med Biol 2010;55(7):1999–2022. [DOI] [PubMed] [Google Scholar]
- 28.Cormode DP, Roessl E, Thran A, et al. Atherosclerotic plaque composition: analysis with multicolor CT and targeted gold nanoparticles. Radiology 2010;256(3):774–782. [DOI] [PMC free article] [PubMed] [Google Scholar]
- 29.Koenig T, Zuber M, Hamann E, et al. How spectroscopic x-ray imaging benefits from inter-pixel communication. Phys Med Biol 2014;59(20):6195–6213. [DOI] [PubMed] [Google Scholar]
- 30.Liu X, Gronberg F, Sjolin M, Karlsson S, Danielsson M. Count rate performance of a silicon-strip detector for photon-counting spectral CT. Nucl Instrum Methods Phys Res A 2016;827:102–106. [Google Scholar]
- 31.Ronaldson JP, Zainon R, Scott NJ, et al. Toward quantifying the composition of soft tissues by spectral CT with Medipix3. Med Phys 2012;39(11):6847–6857. [DOI] [PubMed] [Google Scholar]
- 32.Touch M, Clark DP, Barber W, Badea CT. A neural network-based method for spectral distortion correction in photon counting x-ray CT. Phys Med Biol 2016;61(16):6132–6153. [DOI] [PMC free article] [PubMed] [Google Scholar]
- 33.Zainon R, Ronaldson JP, Janmale T, et al. Spectral CT of carotid atherosclerotic plaque: comparison with histology. Eur Radiol 2012;22(12):2581–2588. [DOI] [PubMed] [Google Scholar]
- 34.Dangelmaier J, Bar-Ness D, Daerr H, et al. Experimental feasibility of spectral photon-counting computed tomography with two contrast agents for the detection of endoleaks following endovascular aortic repair. Eur Radiol 2018;28(8):3318–3325. [DOI] [PMC free article] [PubMed] [Google Scholar]
- 35.Si-Mohamed S, Bar-Ness D, Sigovan M, et al. Review of an initial experience with an experimental spectral photon-counting computed tomography system. Nucl Instrum Methods Phys Res A 2017;873:27–35. [Google Scholar]
- 36.Leng S, Gutjahr R, Ferrero A, et al. Ultra-high spatial resolution multi-energy CT using photon counting detector technology. In: Flohr TG, Lo JY, Gilat Schmidt T, eds. Proceedings of SPIE: medical imaging 2017—physics of medical imaging. Vol 10132. Bellingham, Wash: International Society for Optics and Photonics, 2017; 101320Y. [DOI] [PMC free article] [PubMed] [Google Scholar]
- 37.Duan X, Wang J, Leng S, et al. Electronic noise in CT detectors: impact on image noise and artifacts. AJR Am J Roentgenol 2013;201(4):W626–W632. [DOI] [PubMed] [Google Scholar]
- 38.Liu Y, Leng S, Michalak GJ, et al. Reducing image noise in computed tomography (CT) colonography: effect of an integrated circuit CT detector. J Comput Assist Tomogr 2014;38(3):398–403. [DOI] [PubMed] [Google Scholar]
- 39.Yu Z, Leng S, Kappler S, et al. Noise performance of low-dose CT: comparison between an energy integrating detector and a photon counting detector using a whole-body research photon counting CT scanner. J Med Imaging (Bellingham) 2016;3(4):043503. [DOI] [PMC free article] [PubMed] [Google Scholar]
- 40.Kappler S, Glasser F, Janssen S, Kraft E, Reinwand M. A research prototype system for quantum-counting clinical CT. Proc SPIE 2010;7622:76221Z. [Google Scholar]
- 41.Persson M, Huber B, Karlsson S, et al. Energy-resolved CT imaging with a photon-counting silicon-strip detector. Phys Med Biol 2014;59(22):6709–6727. [DOI] [PubMed] [Google Scholar]
- 42.Shikhaliev PM. Computed tomography with energy-resolved detection: a feasibility study. Phys Med Biol 2008;53(5):1475–1495. [DOI] [PubMed] [Google Scholar]
- 43.Shikhaliev PM. Photon counting spectral CT: improved material decomposition with K-edge-filtered x-rays. Phys Med Biol 2012;57(6):1595–1615. [DOI] [PubMed] [Google Scholar]
- 44.Shikhaliev PM. Soft tissue imaging with photon counting spectroscopic CT. Phys Med Biol 2015;60(6):2453–2474. [DOI] [PubMed] [Google Scholar]
- 45.Shikhaliev PM, Fritz SG. Photon counting spectral CT versus conventional CT: comparative evaluation for breast imaging application. Phys Med Biol 2011;56(7):1905–1930. [DOI] [PubMed] [Google Scholar]
- 46.Shikhaliev PM, Fritz SG, Chapman JW. Photon counting multienergy x-ray imaging: effect of the characteristic x rays on detector performance. Med Phys 2009;36(11):5107–5119. [DOI] [PubMed] [Google Scholar]
- 47.Silkwood JD, Matthews KL, Shikhaliev PM. Photon counting spectral breast CT: effect of adaptive filtration on CT numbers, noise, and contrast to noise ratio. Med Phys 2013;40(5):051905. [DOI] [PubMed] [Google Scholar]
- 48.Tümer TO, Clajus M, Visser G, et al. Preliminary results obtained from a novel CdZnTe pad detector and readout ASIC developed for an automatic baggage inspection system. IEEE nuclear science symposium conference record, Vol 1. 2000; Lyon, France: October 15–20. [Google Scholar]
- 49.Giersch J, Niederlohner D, Anton G. The influence of energy weighting on X-ray imaging quality. Nucl Instrum Methods Phys Res A 2004;531(1-2):68–74. [Google Scholar]
- 50.Schmidt TG. Optimal “image-based” weighting for energy-resolved CT. Med Phys 2009;36(7):3018–3027. [DOI] [PubMed] [Google Scholar]
- 51.Rajendran K, Walsh MF. Reducing beam hardening effects and metal artefacts in spectral CT using Medipix3RX. J Instrum 2014;9(03):P03015. [Google Scholar]
- 52.Zhou W, Abdurakhimova D, Rajendran K, McCollough C, Leng S. Metal artifact reduction and dose efficiency improvement on photon counting CT using an additional tin filter. Med Phys 2017;44(6):3235. [Google Scholar]
- 53.Cooper DM, Chapman LD, Carter Y, et al. Three dimensional mapping of strontium in bone by dual energy K-edge subtraction imaging. Phys Med Biol 2012;57(18):5777–5786. [DOI] [PubMed] [Google Scholar]
- 54.Flohr TG, Stierstorfer K, Süss C, Schmidt B, Primak AN, McCollough CH. Novel ultrahigh resolution data acquisition and image reconstruction for multi-detector row CT. Med Phys 2007;34(5):1712–1723. [DOI] [PubMed] [Google Scholar]
- 55.Roessl E, Proksa R. K-edge imaging in x-ray computed tomography using multi-bin photon counting detectors. Phys Med Biol 2007;52(15):4679–4696. [DOI] [PubMed] [Google Scholar]
- 56.Walsh MF, Nik SJ, Procz S, et al. Spectral CT data acquisition with Medipix3.1. J Instrum 2013;8(10):P10012. [Google Scholar]
- 57.Annapragada AV, Hoffman E, Divekar A, Karathanasis E, Ghaghada KB. High-resolution CT vascular imaging using blood pool contrast agents. Methodist DeBakey Cardiovasc J 2012;8(1):18–22. [DOI] [PMC free article] [PubMed] [Google Scholar]
- 58.Ghaghada KB, Sato AF, Starosolski ZA, Berg J, Vail DM. Computed tomography imaging of solid tumors using a liposomal-iodine contrast agent in companion dogs with naturally occurring cancer. PLoS One 2016;11(3):e0152718. [DOI] [PMC free article] [PubMed] [Google Scholar]
- 59.Badea CT, Holbrook M, Clark DP, Ghaghada K. Spectral imaging of iodine and gadolinium nanoparticles using dual-energy CT. In: Lo JY, Gilat Schmidt T, Chen GH, eds. Proceedings of SPIE: medical imaging 2018—physics of medical imaging. Vol 10573. Bellingham, Wash: International Society for Optics and Photonics, 2018; 105731I. [Google Scholar]
- 60.Pan D, Schirra CO, Senpan A, et al. An early investigation of ytterbium nanocolloids for selective and quantitative “multicolor” spectral CT imaging. ACS Nano 2012;6(4):3364–3370. [DOI] [PMC free article] [PubMed] [Google Scholar]
- 61.Cormode DP, Si-Mohamed S, Bar-Ness D, et al. Multicolor spectral photon-counting computed tomography: in vivo dual contrast imaging with a high count rate scanner. Sci Rep 2017;7(1):4784. [DOI] [PMC free article] [PubMed] [Google Scholar]
- 62.Muenzel D, Daerr H, Proksa R, et al. Simultaneous dual-contrast multi-phase liver imaging using spectral photon-counting computed tomography: a proof-of-concept study. Eur Radiol Exp 2017;1(1):25. [DOI] [PMC free article] [PubMed] [Google Scholar]
- 63.Symons R, Cork TE, Lakshmanan MN, et al. Dual-contrast agent photon-counting computed tomography of the heart: initial experience. Int J Cardiovasc Imaging 2017;33(8):1253–1261. [DOI] [PubMed] [Google Scholar]
- 64.Leng S, Zhou W, Yu Z, et al. Spectral performance of a whole-body research photon counting detector CT: quantitative accuracy in derived image sets. Phys Med Biol 2017;62(17):7216–7232. [DOI] [PMC free article] [PubMed] [Google Scholar]
- 65.Kim JC, Anderson SE, Kaye W, et al. Charge sharing in common-grid pixelated CdZnTe detectors. Nucl Instrum Meth A. 2011;654(1):233–243. [Google Scholar]
- 66.Leng S, Yu Z, Halaweish A, et al. Dose-efficient ultrahigh-resolution scan mode using a photon counting detector computed tomography system. J Med Imaging (Bellingham) 2016;3(4):043504. [DOI] [PMC free article] [PubMed] [Google Scholar]
- 67.Leng S, Yu L, Wang J, Fletcher JG, Mistretta CA, McCollough CH. Noise reduction in spectral CT: reducing dose and breaking the trade-off between image noise and energy bin selection. Med Phys 2011;38(9):4946–4957. [DOI] [PubMed] [Google Scholar]
- 68.Leng S, Yu L, Fletcher JG, McCollough CH. Maximizing iodine contrast-to-noise ratios in abdominal CT imaging through use of energy domain noise reduction and virtual monoenergetic dual-energy CT. Radiology 2015;276(2):562–570. [DOI] [PMC free article] [PubMed] [Google Scholar]
- 69.Liu J, Ding H, Molloi S, Zhang X, Gao H. TICMR: Total image constrained material reconstruction via nonlocal total variation regularization for spectral CT. IEEE Trans Med Imaging 2016;35(12):2578–2586. [DOI] [PMC free article] [PubMed] [Google Scholar]
- 70.Yu Z, Leng S, Li Z, McCollough CH. Spectral prior image constrained compressed sensing (spectral PICCS) for photon-counting computed tomography. Phys Med Biol 2016;61(18):6707–6732. [DOI] [PMC free article] [PubMed] [Google Scholar]
- 71.Zhang Y, Xi Y, Yang Q, Cong W, Zhou J, Wang G. Spectral CT reconstruction with image sparsity and spectral mean. IEEE Trans Comput Imaging 2016;2(4):510–523. [DOI] [PMC free article] [PubMed] [Google Scholar]
- 72.Li Z, Leng S, Yu L, Manduca A, McCollough CH. An effective noise reduction method for multi-energy CT images that exploit spatio-spectral features. Med Phys 2017;44(5):1610–1623. [DOI] [PMC free article] [PubMed] [Google Scholar]
- 73.Cai C, Rodet T, Legoupil S, Mohammad-Djafari A. A full-spectral Bayesian reconstruction approach based on the material decomposition model applied in dual-energy computed tomography. Med Phys 2013;40(11):111916. [DOI] [PubMed] [Google Scholar]
- 74.Foygel Barber R, Sidky EY, Gilat Schmidt T, Pan X. An algorithm for constrained one-step inversion of spectral CT data. Phys Med Biol 2016;61(10):3784–3818. [DOI] [PMC free article] [PubMed] [Google Scholar]
- 75.Long Y, Fessler JA. Multi-material decomposition using statistical image reconstruction for spectral CT. IEEE Trans Med Imaging 2014;33(8):1614–1626. [DOI] [PMC free article] [PubMed] [Google Scholar]
- 76.Mechlem K, Ehn S, Sellerer T, et al. Joint statistical iterative material image reconstruction for spectral computed tomography using a semi-empirical forward model. IEEE Trans Med Imaging 2018;37(1):68–80. [DOI] [PubMed] [Google Scholar]
- 77.Weidinger T, Buzug TM, Flohr T, Kappler S, Stierstorfer K. Polychromatic iterative statistical material image reconstruction for photon-counting computed tomography. Int J Biomed Imaging 2016;2016:5871604. [DOI] [PMC free article] [PubMed] [Google Scholar]


