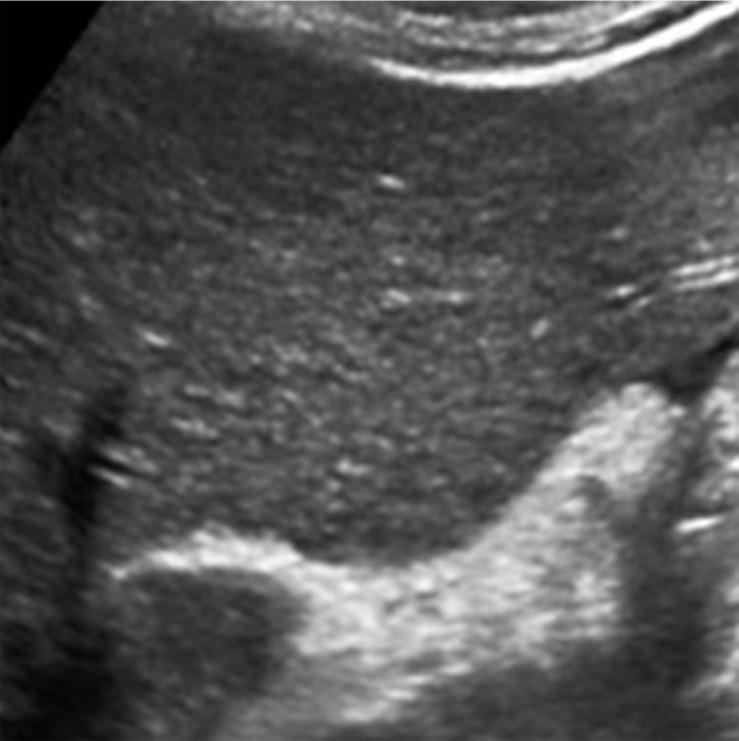
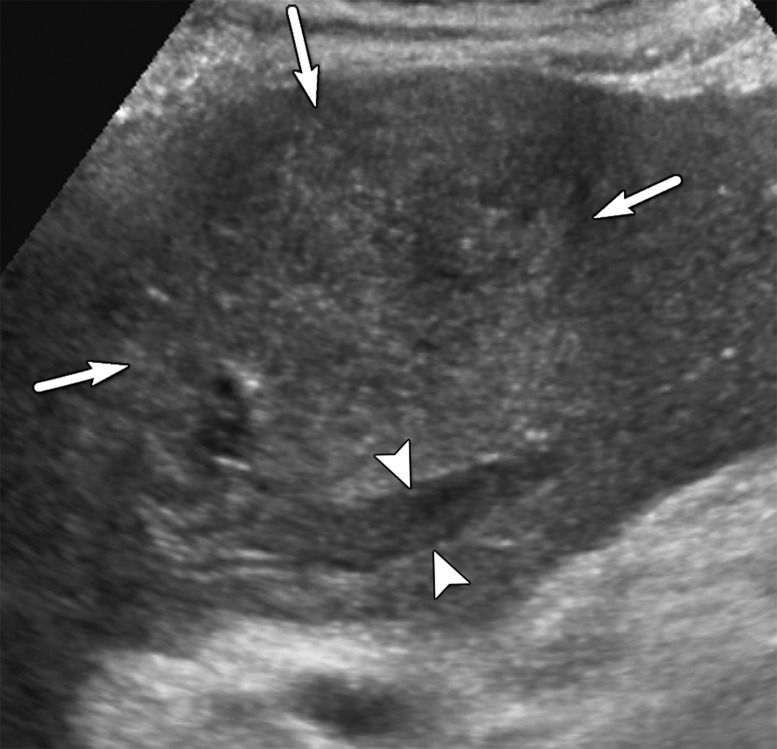
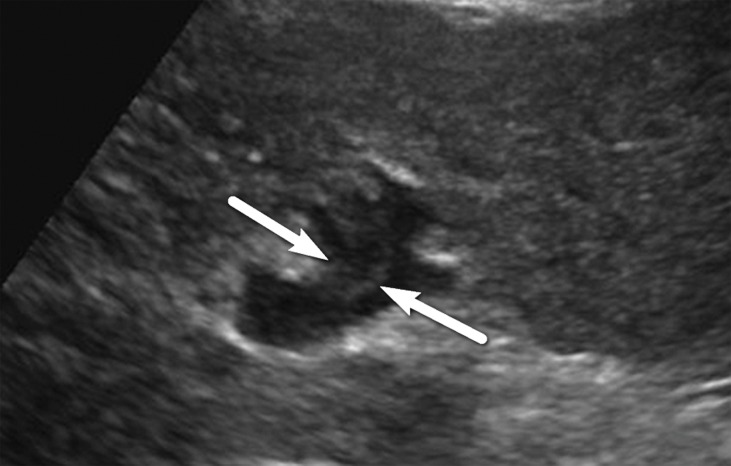
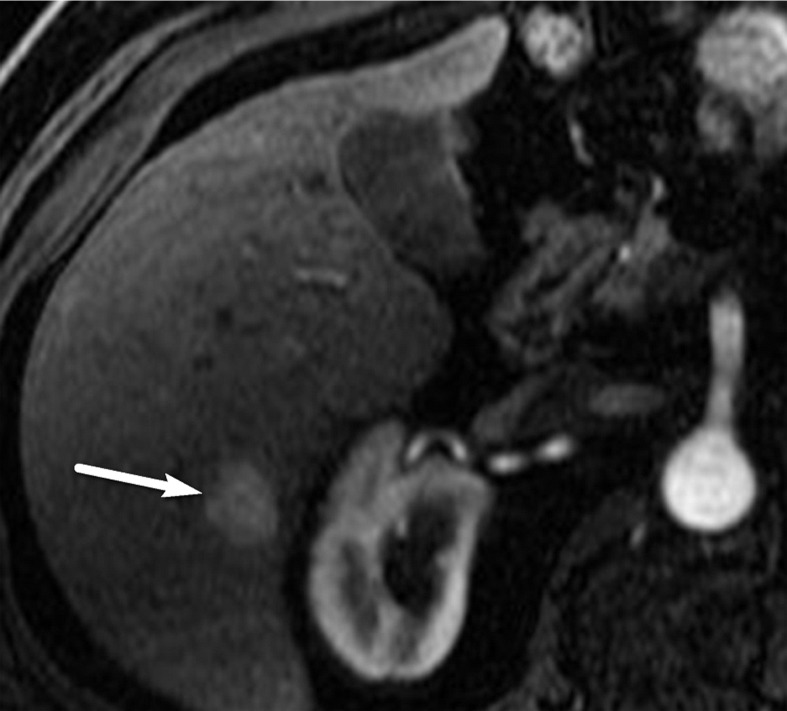
Abstract
The US Liver Imaging Reporting and Data System (LI-RADS) was released in 2017 and is the newest of the four American College of Radiology (ACR) LI-RADS algorithms. US LI-RADS provides standardized terminology, technical recommendations, and a reporting framework for US examinations performed for screening or surveillance in patients at risk for developing hepatocellular carcinoma (HCC). The appropriate patient population for screening and surveillance includes individuals who are at risk for developing HCC but do not have known or suspected cancer. This includes patients with cirrhosis from any cause and subsets of patients with chronic hepatitis B virus infection in the absence of cirrhosis. In an HCC screening or surveillance study, US LI-RADS recommends assigning two scores that apply to the entire study: the US category, which determines follow-up, and a visualization score, which communicates the expected level of sensitivity of the examination but does not affect management. Three US categories are possible: US-1 negative, a study with no evidence of HCC; US-2 subthreshold, a study in which an observation less than 10 mm is depicted that is not definitely benign; and US-3 positive, a study in which an observation greater than or equal to 10 mm or a new thrombus in vein is identified, for which diagnostic contrast material–enhanced imaging is recommended. Three visualization scores are possible: A (no or minimal limitations), B (moderate limitations), and C (severe limitations).
©RSNA, 2019
SA-CME LEARNING OBJECTIVES
After completing this journal-based SA-CME activity, participants will be able to:
■ Recognize the rationale for performing US HCC screening and surveillance and define the appropriate target population for the application of US LI-RADS.
■ Review the US LI-RADS algorithm including its study categories and visualization scores, and list tips for successful implementation of US LI-RADS into clinical practice.
■ Describe the technical recommendations and tips to optimize US in at-risk patients undergoing screening and surveillance liver US.
Introduction
Hepatocellular carcinoma (HCC) is the most common primary liver cancer, the sixth most common cancer worldwide, and the second leading cause of cancer death, resulting in almost 800 000 annual deaths worldwide (1–4). In addition, HCC is the fastest-rising cause of cancer-related mortality in the United States (5). The incidence rate of HCC varies widely depending on the geographic region, being highest in eastern Asia and sub-Saharan Africa and lower in the United States; however, the incidence rate has increased in the United States since the 1980s (3). More than 80% of HCCs occur in the cirrhotic liver, and the prevalence of HCC in patients with cirrhosis ranges between 1% and 8% per year (6–8). However, subsets of patients with hepatitis B virus (HBV) infection without cirrhosis are also at sufficiently high risk for HCC and warrant screening and surveillance.
Studies have shown that the effectiveness of HCC treatment is dependent on the disease stage at the time of detection (9). While detection at an advanced stage is associated with a dismal prognosis, detection at an earlier stage through screening and surveillance can enable curative treatments and decrease mortality.
Implementing a screening and surveillance program for early HCC detection on a worldwide basis is a considerable undertaking that should meet the criteria established by the World Health Organization (WHO) for determining the appropriateness of disease screening (10). The WHO criteria are summarized in Table 1. Some criteria relate to the disease itself, others to the performance and acceptability of the proposed screening or surveillance test, and others to the effectiveness of callback strategies and available treatments. Fundamentally, the cost of screening should be economically balanced between costs and benefits. HCC fulfills many of the disease-related WHO benchmarks, and screening and surveillance liver US in patients at risk for HCC (specifically in patients with cirrhosis when the risk is 1.5% per year or greater, and in HBV carriers when the prevalence of HCC is greater than 0.2% per year) has been shown to be cost-effective for detecting HCC at an early curative stage (7,11).
Table 1:
WHO Criteria for a Screening and Surveillance Program
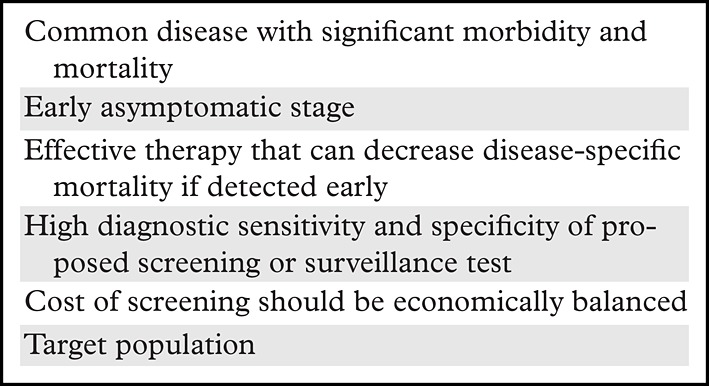
Source.—Reference 10.
First developed in 2011 to standardize imaging and reporting of imaging tests in patients with or who are at risk for developing HCC, the American College of Radiology (ACR) Liver Imaging Reporting and Data System (LI-RADS) has evolved as experience and evidence have accumulated. In 2017, US LI-RADS was added to the LI-RADS algorithm (12). In this article, we describe the role of US LI-RADS in the ACR LI-RADS algorithm and the rationale for HCC screening and surveillance, as well as the two key components of the US LI-RADS report: the US category and the visualization score. We also review the US LI-RADS technical recommendations along with tips to optimize US examination quality. Last, we provide suggestions for successful implementation of US LI-RADS into clinical practice. Such implementation is anticipated to facilitate early detection of HCC in at-risk patients, with potential for mortality reduction.
Integrating US LI-RADS into the ACR LI-RADS Algorithm
ACR LI-RADS is a comprehensive system that provides standardized terminology, techniques, interpretations, and reporting for liver imaging in patients with or who are at risk of developing HCC. First released in 2011 for CT- and MRI-based diagnosis of HCC, the system has since been updated in 2013, 2014, 2017, and 2018, with each update building on prior experience and new data.
The latest version of ACR LI-RADS has four algorithms: (a) US for HCC screening and surveillance (US LI-RADS); (b) contrast material–enhanced US for HCC diagnosis (CEUS LI-RADS); (c) CT/MRI for HCC diagnosis and staging (CT/MRI LI-RADS); and (d) CT/MRI for HCC treatment response assessment (TR LI-RADS).
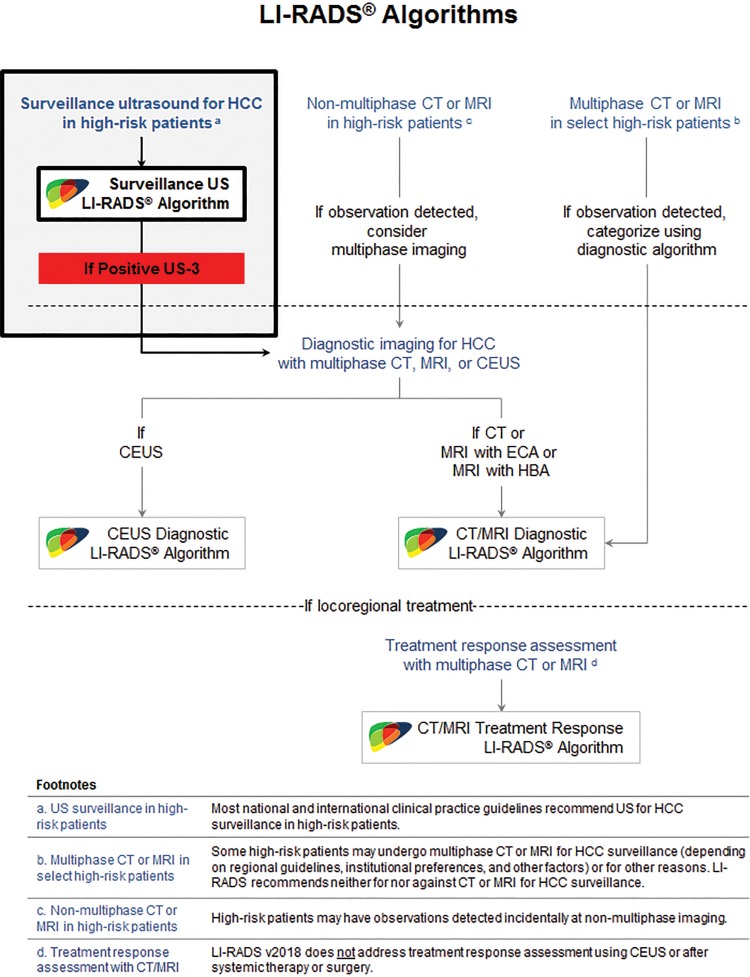
The relationships between the four algorithms are summarized in Figure 1 (13). As shown in Figure 1, LI-RADS recommends US performed every 6 months as the primary modality for HCC screening and surveillance in high-risk patients. The goal of screening and surveillance US is lesion detection, not characterization. The latter is reserved for diagnostic multiphase imaging with the administration of contrast material (ie, contrast-enhanced CT, MRI, or US), which generally is performed if HCC is suspected on the basis of positive screening or surveillance test results and/or incidental detection at imaging performed for other reasons. Readers are encouraged to visit the LI-RADS website (13) and to review recent articles (14–16) to become familiar with the other algorithms.
Figure 1.
Role of US LI-RADS in the ACR LI-RADS algorithm. CEUS = contrast-enhanced US, ECA = extracellular contrast agents, HBA = hepatobiliary agents. (Adapted and reprinted, with permission, from reference 13.)
Rationale for Screening and Surveillance US of the Liver
Screening is defined as the initial application of a test to a population at risk, and surveillance refers to the repeated application of the test at regular intervals. One of the most critical measures of a screening test is the ability to decrease disease-specific mortality. To that end, two large-scale randomized controlled trials (RCTs) have shown reduced HCC-specific mortality through the use of screening and surveillance US.
The first study, published in 1997, evaluated 17 920 patients with HBV or chronic hepatitis infection and found 1- and 2-year survival rates of 88.1% and 77.5%, respectively, after HCC diagnosis in the surveillance group, compared with 0% 1-year survival after HCC diagnosis in the nonscreened control group (17).
A second more robust RCT evaluated 18 816 patients with HBV infection or chronic hepatitis in urban Shanghai, randomized in the mid-1990s for surveillance with liver US and a serum α-fetoprotein (AFP) level test every 6 months versus no surveillance (18). Despite poor compliance, the surveillance group demonstrated a significant mortality reduction of 37%.
Of note, both RCTs were performed in HBV and chronic hepatitis patients who may or may not have had cirrhosis. Therefore, the study results may not generalize to patients with cirrhosis or with chronic liver disease from other causes. Although no large-scale RCTs have been performed specifically in patients with cirrhosis caused by other conditions, several lower-evidence cohort studies have corroborated a survival benefit from HCC surveillance with US in such groups (19–23).
In most of the aforementioned studies, screening and surveillance have been performed by means of liver US with or without AFP level tests. Evidence regarding the benefit of testing AFP levels for screening has been inconsistent, as not all HCCs secrete AFP (particularly early-stage HCCs), and AFP levels can be elevated in the absence of HCC. An older literature review found a pooled sensitivity of AFP levels for HCC detection of only 41%–65% (24). A more recent meta-analysis showed improved sensitivity for early-stage HCC detection in patients undergoing surveillance with both AFP level testing and US versus with US alone (25).
Because of these mixed results, testing AFP levels is not currently recommended as a screening tool by several practice guidelines, although the most recent American Association for the Study of Liver Diseases (AASLD) guidance article (26) lists testing for AFP levels as an optional supplement to US. Other key benchmarks in screening and surveillance include technology availability and patient acceptance, safety, and compliance. US is an attractive imaging modality owing to its safety profile, widespread accessibility, and relatively low cost.
The accuracy of US in HCC detection has been reported mainly in cohort studies. In a 2009 meta-analysis (27), pooled sensitivity for HCC detection at any stage was 94% but only 63% for early-stage HCC. Another meta-analysis (28) evaluating US sensitivity in the surveillance setting found a pooled sensitivity of 78% and a specificity of 89%.
An additional recent meta-analysis (25) reported a pooled sensitivity of 84% for US detection of HCC at any stage and a pooled sensitivity of 84% with CT/MRI at any stage. In this same study, early-stage sensitivity of CT/MRI for HCC detection was not evaluated but was found to be 47% with US, which improved to 63% when combined with AFP level (25). Of note, this meta-analysis included studies from the 1990s, the results of which may no longer be applicable owing to dramatic improvements in US resolution and technology over the past 30 years.
The meta-analysis (25) also compared studies of US sensitivity for HCCs less than 1 cm that were diagnosed on the basis of the results of explant pathology examinations, although a finding less than 1 cm cannot currently be definitively characterized as an HCC with any imaging modality. However, the researchers did conclude that “there are currently insufficient data to support routine use of CT- or MRI-based surveillance in all patients with cirrhosis” (25).
While it is recognized that select high-risk patients may undergo multiphase CT or MRI for HCC surveillance rather than US, this decision is dependent on regional guidelines, institutional preferences, and other factors, and LI-RADS neither advocates nor discourages this practice. At present, no study has shown that screening and surveillance with CT or MRI is cost-effective or has a greater impact on HCC-related mortality compared with that of US screening and surveillance. According to the latest AASLD guidelines, “there are no studies that have indicated the best surveillance strategy for those on the liver transplant waiting list, though clearly surveillance for HCC is indicated given the potential for curative therapy with transplant” (8).
HCC screening guidelines by the AASLD and its European counterpart, the European Association for the Study of the Liver (EASL), and the Asian Pacific Association for the Study of the Liver (APASL) are grounded in this literature (29,30). Guidelines from these societies recommend screening and surveillance for HCC in select high-risk populations with US alone (EASL), in concert with AFP (APASL), or with AFP as an option (AASLD), using a surveillance interval of 6 months. Given its proven survival benefit in RCTs, as well as its accessibility, safety, and cost-effectiveness, US is the most appropriate screening and surveillance imaging method in the majority of patients who are at high risk for HCC.
Target Population
Conceptually, the term target population refers to the group of individuals in whom surveillance is judged to be cost-effective. In general, these are patients with a substantially elevated risk of developing the disease in question (ie, HCC) and in whom the detection of early asymptomatic disease can prolong or improve the quality of life by enabling timely application of effective treatments. A necessary requirement is that the patient’s overall health is sufficiently good so that he or she can tolerate and benefit meaningfully from those treatments.
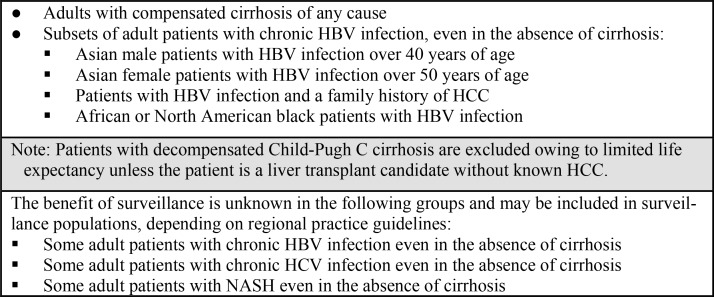
LI-RADS defers to regional practice guidelines for the operational definition of the target population for HCC surveillance. Here we review the recommendations of the AASLD, but readers are encouraged to be familiar with the clinical practice guidelines applicable in their geographic region. The target population for which the AASLD recommends regular HCC surveillance comprises adult patients without current or treated HCC with risk factors including compensated cirrhosis of any cause and subsets of adult patients with chronic HBV infection, even in the absence of cirrhosis (8). Figure 2 lists the target population for application of HCC screening and surveillance US (8, 26).
Figure 2.
Chart lists the target population for the application of HCC screening and surveillance US according to the AASLD recommendations. NASH = nonalcoholic steatohepatitis. (Sources.—References 8 and 26.)
In patients with cirrhosis with sustained virologic response after undergoing direct-acting antiviral treatment of hepatitis C virus (HCV) infection, the risk for developing HCC is reduced but not eliminated, and these patients should continue to undergo surveillance. In general, the AASLD does not recommend surveillance in patients with Child-Pugh C cirrhosis because their limited life expectancy lowers the anticipated survival benefit. One exception is liver transplant candidates without known HCC. These candidates should undergo surveillance as the presence and stage of HCC may affect transplantation eligibility and priority. Liver transplant centers should adhere to Organ Procurement and Transplantation Network policy for surveillance in such patients (31,32).
Although HCC can develop in children with cirrhosis, in adults with HCV infection without cirrhosis, in those patients with nonalcoholic fatty liver disease without cirrhosis, and in patients with chronic HBV infection who do not meet above criteria, the risk is considered to be too small to recommend routine surveillance. It is not known at this time whether screening and surveillance is cost-effective in these patients.
Observations at Surveillance US
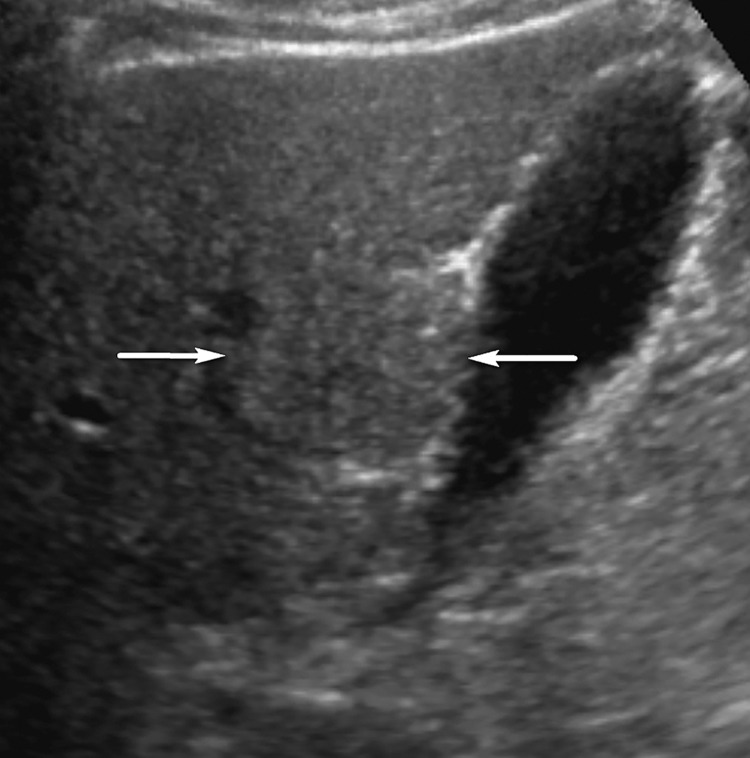
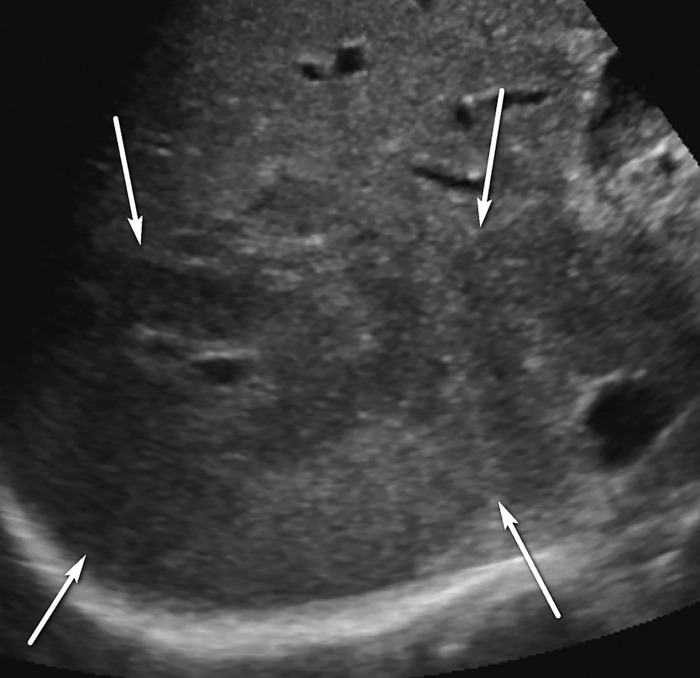
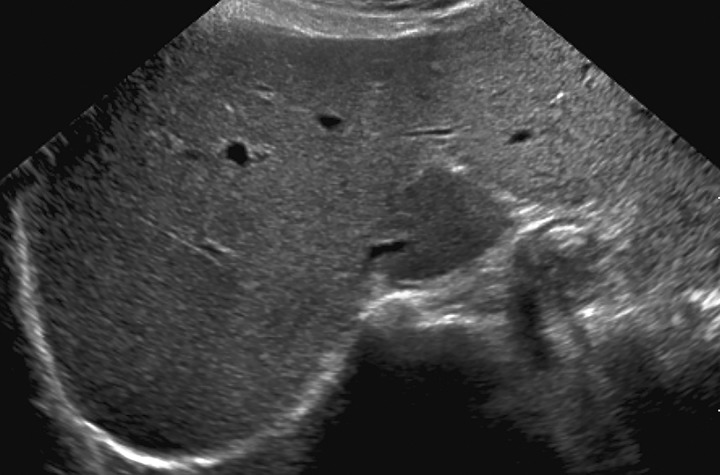
An observation at imaging includes any focal area distinct from background hepatic parenchyma. The term observation is preferred over lesion, as it does not imply level of suspicion (33,34). For example, an observation may include benign entities such as punctate calcifications, simple cysts, or previously characterized hemangiomas, although it can also include findings that warrant short-interval follow-up or multiphase contrast-enhanced imaging. An observation includes well-defined solid nodules that can be of any echogenicity: hyperechoic, isoechoic, or hypoechoic relative to that of the background liver (Fig 3). An observation may also include a focal or geographic area with any of the following characteristics: ill-defined borders, refractive edge shadowing, or loss of normal hepatic architecture distinct from that of the background liver (Fig 4).
Figure 3.
Isoechoic observation in a 47-year-old man with HCV infection and cirrhosis. Sagittal US image shows a 3.2-cm isoechoic observation (arrows) adjacent to the gallbladder, a US-3 positive finding, which corresponds to a regenerative nodule depicted on a subsequent multiphase contrast-enhanced MR image (not shown).
Figure 4.
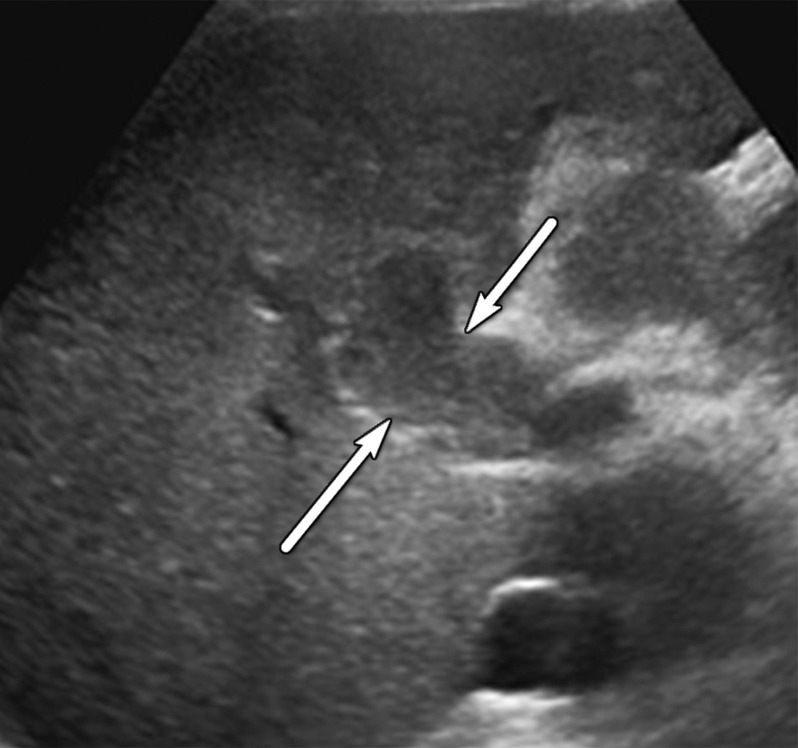
Parenchymal distortion in a 64-year-old man with HCV infection and cirrhosis. Sagittal gray-scale US image of the right lobe of the liver shows a large area of parenchymal distortion, with areas of decreased echogenicity (arrows) and loss of normal hepatic vessels. This observation was categorized as US-3 positive and was subsequently evaluated at multiphase contrast-enhanced MRI (not shown), which showed an infiltrative HCC corresponding to this observation.
US LI-RADS Algorithm: US LI-RADS Categories
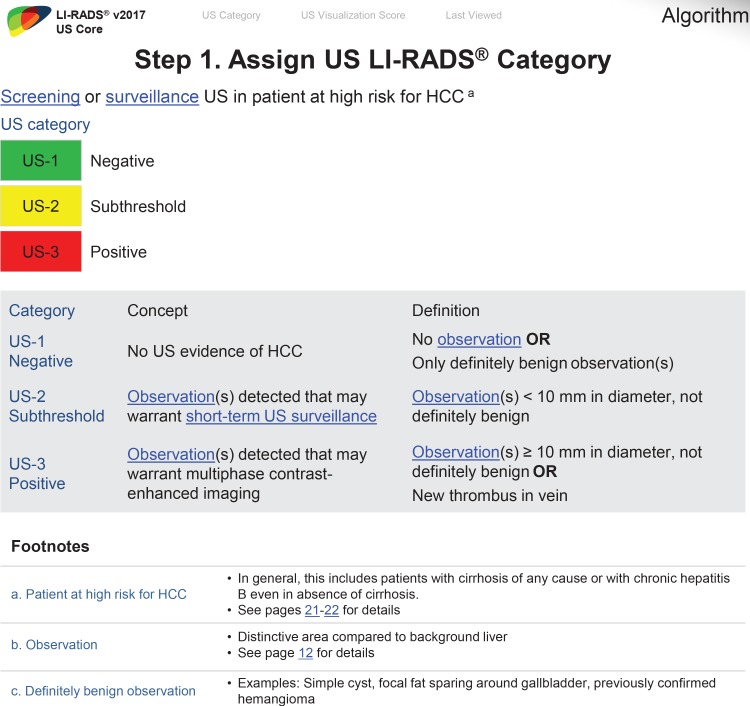
Unlike contrast-enhanced US LI-RADS or CT/MRI LI-RADS in which a category is applied to an individual observation, the US LI-RADS category applies to the entire US examination and is based on the most suspicious observations. There are three US categories: US-1 negative, US-2 subthreshold, and US-3 positive, and the result determines the follow-up recommendation (12).
Category US-1 Negative
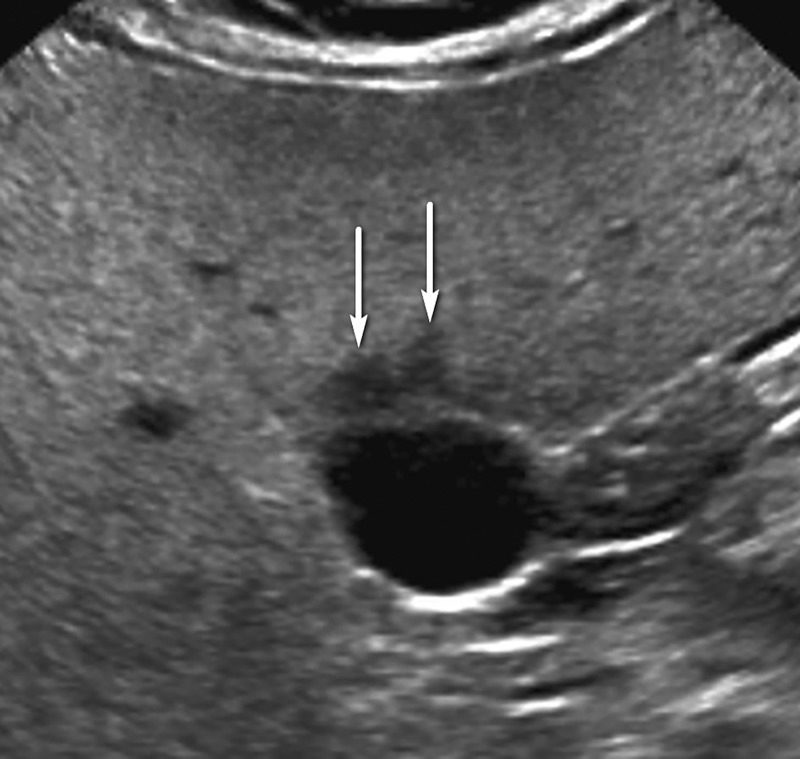
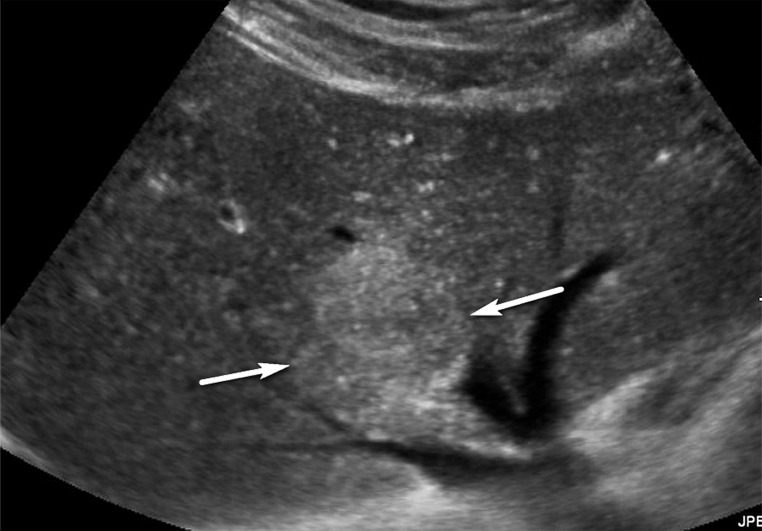
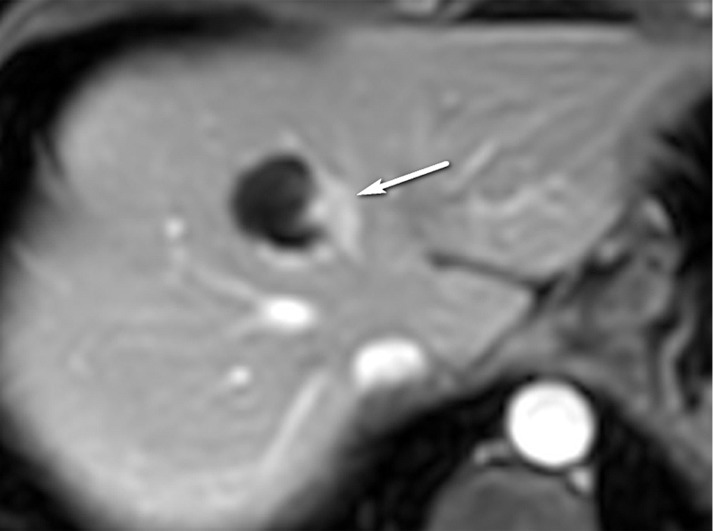
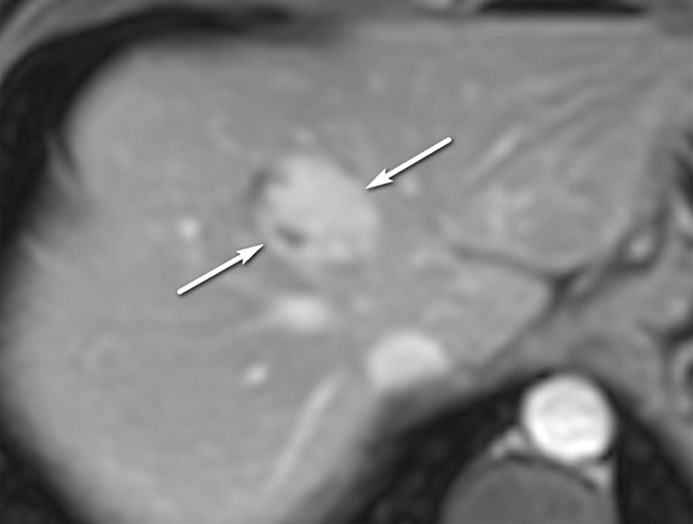
US-1 negative refers to an imaging study in which there is no evidence of HCC. This may include a liver with no focal observation or a liver in which only definitely benign observations are detected. Examples of definitely benign observations include focal fat sparing (Fig 5), simple cysts, punctate calcifications, or previously characterized hemangiomas (focal observations proven to be hemangiomas on the basis of prior contrast-enhanced imaging) (Fig 6).
Figure 5.
Definitely benign observation in a 42-year-old woman with HCV infection and cirrhosis and steatosis. Transverse US image shows flame-shaped regions of decreased echogenicity (arrows) adjacent to the gallbladder, corresponding to focal fat sparing, a definitely benign finding. As this was the only observation, this was assigned a US-1 negative category, and routine 6-month surveillance US was recommended.
Figure 6a.
Definitely benign observation in a 57-year-old woman with chronic HBV infection. (a) Transverse US image shows a solid echogenic 3.2-cm observation (arrows), characterized as a hemangioma at prior MRI. (b–d) Axial T1-weighted arterial phase (b) and delayed phase (c) and axial T2-weighted (d) MR images show discontinuous peripheral nodular enhancement (arrow in b), near-complete enhancement of the observation (arrows in c), and marked T2 hyperintensity (arrows in d), findings that are in keeping with the characterization of hemangioma at MRI. As this was the only observation, the study was assigned a US-1 negative category, and routine 6-month surveillance US was recommended.
Figure 6b.
Definitely benign observation in a 57-year-old woman with chronic HBV infection. (a) Transverse US image shows a solid echogenic 3.2-cm observation (arrows), characterized as a hemangioma at prior MRI. (b–d) Axial T1-weighted arterial phase (b) and delayed phase (c) and axial T2-weighted (d) MR images show discontinuous peripheral nodular enhancement (arrow in b), near-complete enhancement of the observation (arrows in c), and marked T2 hyperintensity (arrows in d), findings that are in keeping with the characterization of hemangioma at MRI. As this was the only observation, the study was assigned a US-1 negative category, and routine 6-month surveillance US was recommended.
Figure 6c.
Definitely benign observation in a 57-year-old woman with chronic HBV infection. (a) Transverse US image shows a solid echogenic 3.2-cm observation (arrows), characterized as a hemangioma at prior MRI. (b–d) Axial T1-weighted arterial phase (b) and delayed phase (c) and axial T2-weighted (d) MR images show discontinuous peripheral nodular enhancement (arrow in b), near-complete enhancement of the observation (arrows in c), and marked T2 hyperintensity (arrows in d), findings that are in keeping with the characterization of hemangioma at MRI. As this was the only observation, the study was assigned a US-1 negative category, and routine 6-month surveillance US was recommended.
Figure 6d.
Definitely benign observation in a 57-year-old woman with chronic HBV infection. (a) Transverse US image shows a solid echogenic 3.2-cm observation (arrows), characterized as a hemangioma at prior MRI. (b–d) Axial T1-weighted arterial phase (b) and delayed phase (c) and axial T2-weighted (d) MR images show discontinuous peripheral nodular enhancement (arrow in b), near-complete enhancement of the observation (arrows in c), and marked T2 hyperintensity (arrows in d), findings that are in keeping with the characterization of hemangioma at MRI. As this was the only observation, the study was assigned a US-1 negative category, and routine 6-month surveillance US was recommended.
Category US-2 Subthreshold
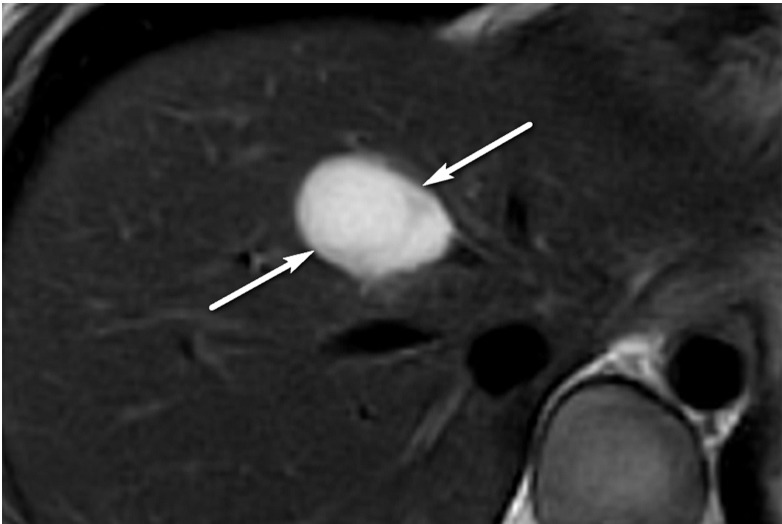
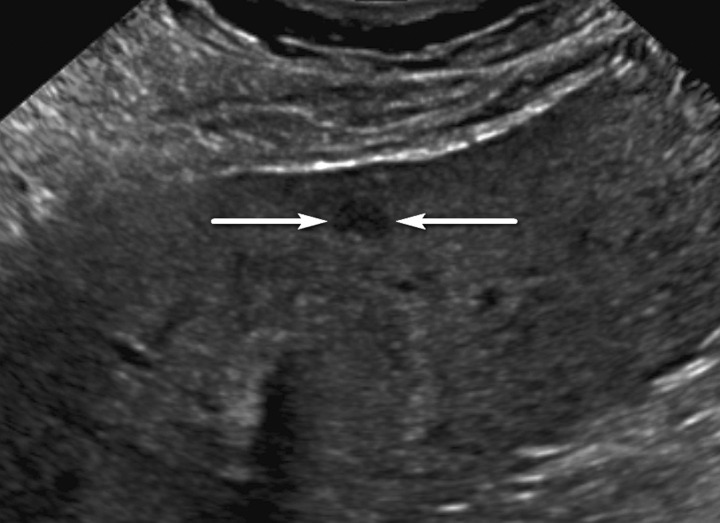
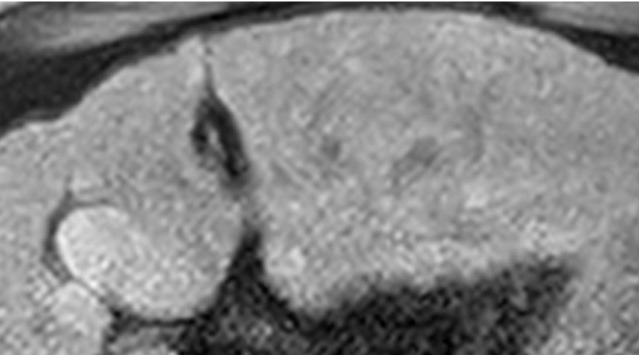
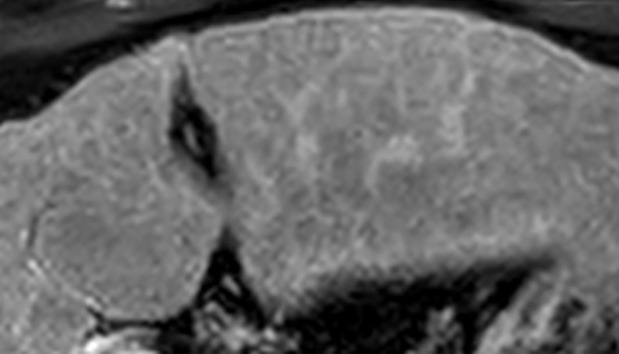
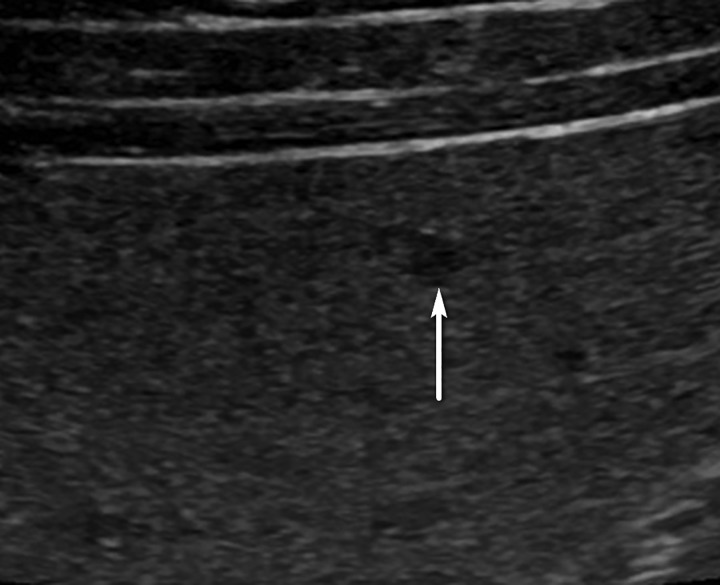
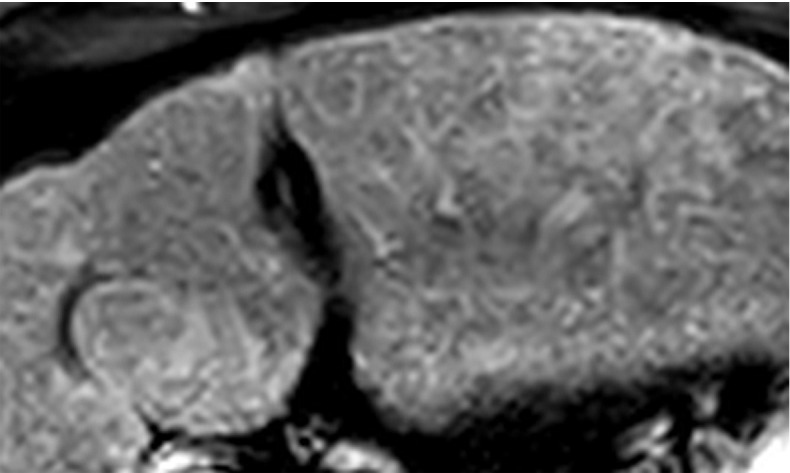
US-2 subthreshold refers to an imaging study in which an observation(s) measuring less than 10 mm is detected that is not definitely benign at imaging. Small observations measuring less than 10 mm at US are common, rarely malignant, and difficult to characterize definitively at contrast-enhanced imaging (Fig 7). Therefore, performing follow-up US in 3–6 months rather than diagnostic multiphase contrast-enhanced imaging is recommended for observations that are less than 10 mm.
Figure 7a.
US-2 subthreshold observation in a 60-year-old man with NASH cirrhosis. (a) Transverse gray-scale US image shows a 7-mm hypoechoic observation (arrows). (b–d) Subsequent T1-weighted fat-suppressed nonenhanced (b), arterial phase (c), and delayed phase (d) extracellular contrast-enhanced MR images show no corresponding findings. To decrease the false-positive rate at US screening, surveillance with 3–6-month follow-up US rather than multiphase contrast-enhanced CT, MRI, or US is recommended for observations measuring less than 1 cm.
Figure 7b.
US-2 subthreshold observation in a 60-year-old man with NASH cirrhosis. (a) Transverse gray-scale US image shows a 7-mm hypoechoic observation (arrows). (b–d) Subsequent T1-weighted fat-suppressed nonenhanced (b), arterial phase (c), and delayed phase (d) extracellular contrast-enhanced MR images show no corresponding findings. To decrease the false-positive rate at US screening, surveillance with 3–6-month follow-up US rather than multiphase contrast-enhanced CT, MRI, or US is recommended for observations measuring less than 1 cm.
Figure 7c.
US-2 subthreshold observation in a 60-year-old man with NASH cirrhosis. (a) Transverse gray-scale US image shows a 7-mm hypoechoic observation (arrows). (b–d) Subsequent T1-weighted fat-suppressed nonenhanced (b), arterial phase (c), and delayed phase (d) extracellular contrast-enhanced MR images show no corresponding findings. To decrease the false-positive rate at US screening, surveillance with 3–6-month follow-up US rather than multiphase contrast-enhanced CT, MRI, or US is recommended for observations measuring less than 1 cm.
Figure 7d.
US-2 subthreshold observation in a 60-year-old man with NASH cirrhosis. (a) Transverse gray-scale US image shows a 7-mm hypoechoic observation (arrows). (b–d) Subsequent T1-weighted fat-suppressed nonenhanced (b), arterial phase (c), and delayed phase (d) extracellular contrast-enhanced MR images show no corresponding findings. To decrease the false-positive rate at US screening, surveillance with 3–6-month follow-up US rather than multiphase contrast-enhanced CT, MRI, or US is recommended for observations measuring less than 1 cm.
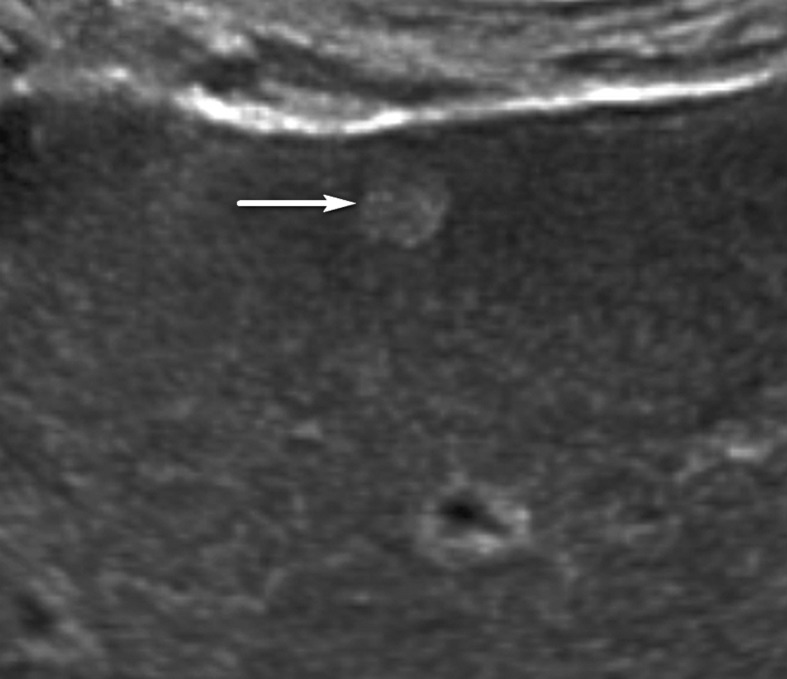
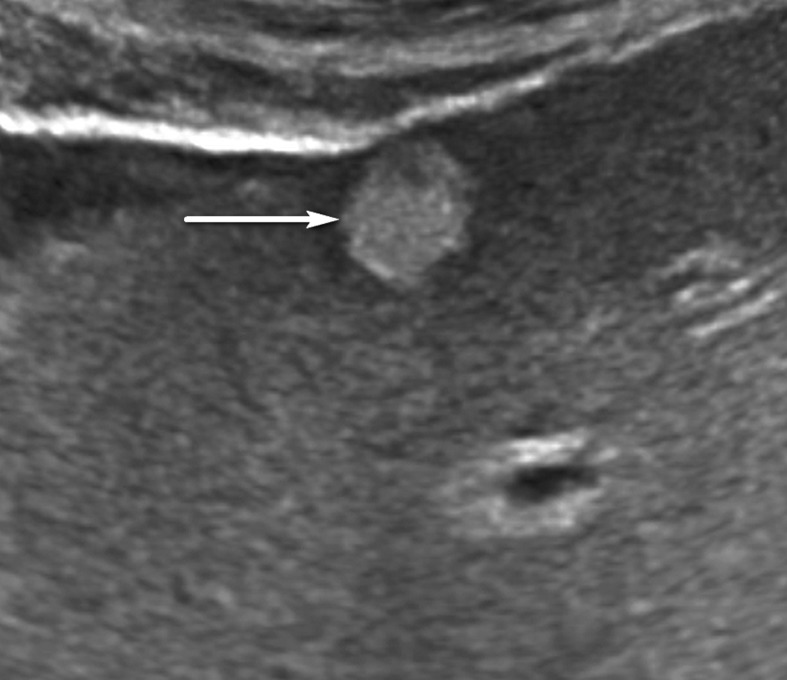
However, it is important to monitor subthreshold observations with US for up to 2 years. Those that remain stable in size and smaller than 10 mm over a 2-year period can be considered benign, and the study can then be categorized as US-1 negative (Fig 8). However, some observations that are initially less than 10 mm may grow to exceed the threshold diameter. The examination would then be categorized as US-3 positive and warrant further evaluation with multiphase contrast-enhanced imaging for definitive characterization (Fig 9).
Figure 8.
US-2 subthreshold observation in a 45-year-old man with chronic HBV infection. Transverse US image shows a 5-mm hypoechoic observation (arrow), indicating a US-2 subthreshold assignment and 3–6-month follow-up US surveillance. After 2 years of stability, this observation was considered definitely benign, and the study was recategorized as US-1 negative. Routine 6-month surveillance US was recommended.
Figure 9a.
US-2 subthreshold observation in a 64-year-old man with HCV infection and cirrhosis. (a) Transverse gray-scale US image shows an 8-mm echogenic observation (arrow), indicating a US-2 subthreshold category. (b) Transverse gray-scale US image obtained 6 months later shows increased size of the observation (arrow) to 11 mm, which now meets the criteria for a US-3 positive category. Definitive characterization with multiphase contrast-enhanced MRI was performed (not shown), and the findings indicated a CT/MRI LI-RADS category 5 (definitely HCC) observation.
Figure 9b.
US-2 subthreshold observation in a 64-year-old man with HCV infection and cirrhosis. (a) Transverse gray-scale US image shows an 8-mm echogenic observation (arrow), indicating a US-2 subthreshold category. (b) Transverse gray-scale US image obtained 6 months later shows increased size of the observation (arrow) to 11 mm, which now meets the criteria for a US-3 positive category. Definitive characterization with multiphase contrast-enhanced MRI was performed (not shown), and the findings indicated a CT/MRI LI-RADS category 5 (definitely HCC) observation.
Category US-3 Positive
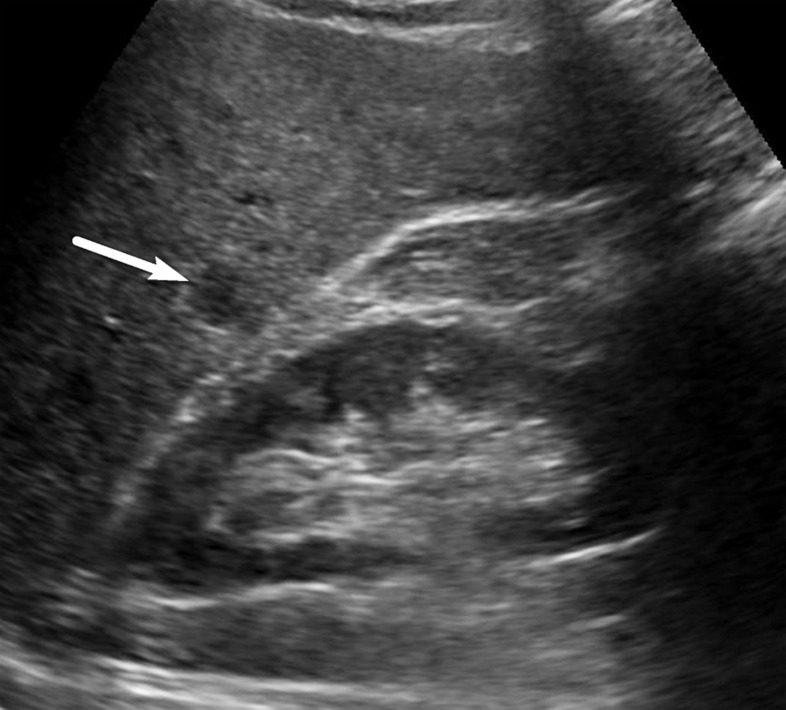
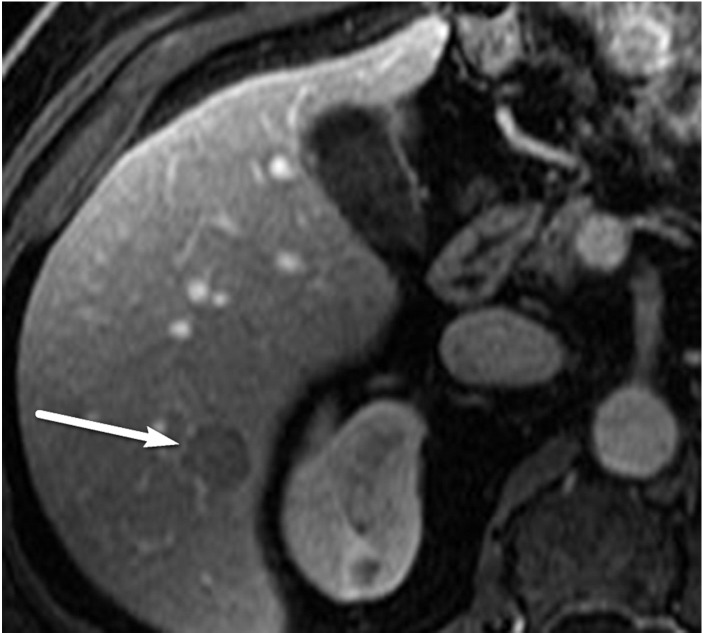
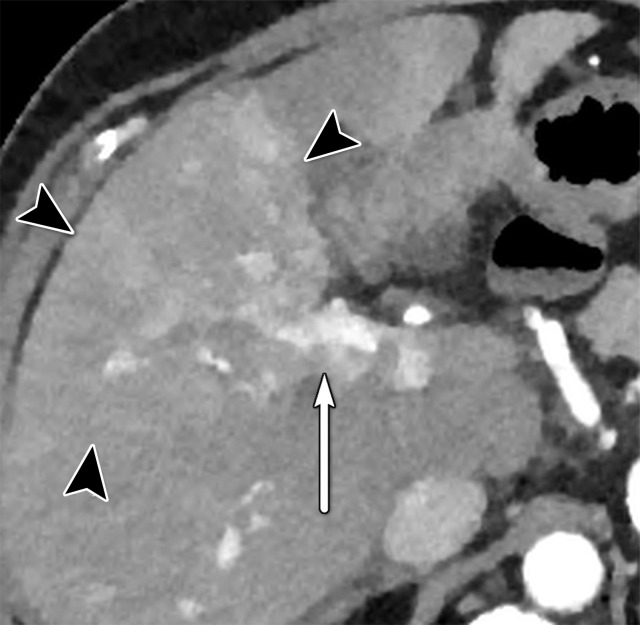
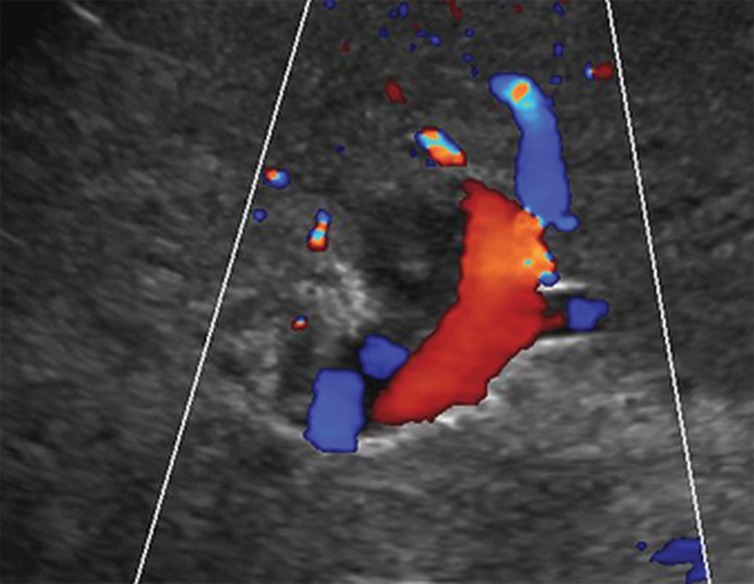
US-3 positive describes an examination in which one or more observations warranting further characterization are depicted. These observations include focal solid observation(s) greater than or equal to 10 mm in diameter (not previously characterized as definitely benign) (Fig 10) and geographic areas greater than or equal to 10 mm with parenchymal distortion (eg, ill-defined area of heterogeneity, refractive edge shadowing [Fig 11], loss of normal hepatic architecture, and distortion of the vessels, the combination of which suggests a diffuse or infiltrative subtype of HCC) (Fig 12). Last, US-3 positive also includes a new thrombus in the portal or hepatic veins (not previously confirmed to be benign), whether it appears to be bland thrombus or a tumor in vein, as these entities may coexist and can be indistinguishable at nonenhanced US (Fig 13).
Figure 10a.
US-3 positive observation in a 58-year-old man with HCV infection. (a) Longitudinal gray-scale US image shows a 1.4-cm hypoechoic observation (arrow) in the right hepatic lobe, indicating a US-3 positive category, for which multiphase contrast-enhanced diagnostic imaging was recommended. (b, c) Axial T1-weighted fat-suppressed MR images obtained in the arterial (b) and portal venous (c) phases show arterial phase hyperenhancement of the observation (arrow in b) and a washout appearance (arrow in c), findings that are in keeping with a CT/MRI LI-RADS category 5 observation (definitely HCC). (Case courtesy of the ACR.)
Figure 11a.
US-3 positive observation in a 63-year-old man with HCV infection and cirrhosis. (a) Transverse grayscale US image of the left lobe shows mild heterogeneity and coarse echotexture of the liver without a suspicious observation. (b) Longitudinal gray-scale US image of the right lobe shows asymmetric refractive shadowing (*) and a large area of parenchymal distortion, heterogeneity, and absent vessels, which are suspicious findings that warrant further evaluation. This demonstrates the clinical utility of comparing the right and left lobes of the liver. Subsequent multiphase contrast-enhanced CT images (not shown) showed infiltrative HCC in the right lobe of the liver.
Figure 12a.
US-3 positive observations in a 54-year-old man with HCV infection and cirrhosis. (a) Longitudinal gray-scale US image shows a thrombus in the right portal vein (arrowheads), a large area of parenchymal distortion (arrows), and capsular bulging, findings indicative of a US-3 positive category. (b) Transverse gray-scale US image shows echoes in the main portal vein (arrows). Diagnostic imaging was recommended. (c) Axial contrast-enhanced CT image obtained in the arterial phase shows enhancing soft tissue in the main portal vein (arrow), a finding associated with tumor in vein. Adjacent enhancing infiltrative HCC (arrowheads) corresponds to the area of parenchymal distortion and capsular bulging seen at US and CT/MRI LI-RADS category 5 with tumor in vein.
Figure 13a.
US-3 positive observation in a 55-year-old woman with cirrhosis. Transverse gray-scale (a) and color Doppler (b) US images of the left portal vein show mural echoes (arrows in a) owing to a thrombus that meets the criteria for US-3 positive. The color Doppler US image (b) shows flow in the vein, a finding consistent with nonocclusive thrombus. A diagnostic test was recommended, and follow-up multiphase contrast-enhanced CT images (not shown) showed bland thrombus.
Figure 10b.
US-3 positive observation in a 58-year-old man with HCV infection. (a) Longitudinal gray-scale US image shows a 1.4-cm hypoechoic observation (arrow) in the right hepatic lobe, indicating a US-3 positive category, for which multiphase contrast-enhanced diagnostic imaging was recommended. (b, c) Axial T1-weighted fat-suppressed MR images obtained in the arterial (b) and portal venous (c) phases show arterial phase hyperenhancement of the observation (arrow in b) and a washout appearance (arrow in c), findings that are in keeping with a CT/MRI LI-RADS category 5 observation (definitely HCC). (Case courtesy of the ACR.)
Figure 10c.
US-3 positive observation in a 58-year-old man with HCV infection. (a) Longitudinal gray-scale US image shows a 1.4-cm hypoechoic observation (arrow) in the right hepatic lobe, indicating a US-3 positive category, for which multiphase contrast-enhanced diagnostic imaging was recommended. (b, c) Axial T1-weighted fat-suppressed MR images obtained in the arterial (b) and portal venous (c) phases show arterial phase hyperenhancement of the observation (arrow in b) and a washout appearance (arrow in c), findings that are in keeping with a CT/MRI LI-RADS category 5 observation (definitely HCC). (Case courtesy of the ACR.)
Figure 11b.
US-3 positive observation in a 63-year-old man with HCV infection and cirrhosis. (a) Transverse grayscale US image of the left lobe shows mild heterogeneity and coarse echotexture of the liver without a suspicious observation. (b) Longitudinal gray-scale US image of the right lobe shows asymmetric refractive shadowing (*) and a large area of parenchymal distortion, heterogeneity, and absent vessels, which are suspicious findings that warrant further evaluation. This demonstrates the clinical utility of comparing the right and left lobes of the liver. Subsequent multiphase contrast-enhanced CT images (not shown) showed infiltrative HCC in the right lobe of the liver.
Figure 12b.
US-3 positive observations in a 54-year-old man with HCV infection and cirrhosis. (a) Longitudinal gray-scale US image shows a thrombus in the right portal vein (arrowheads), a large area of parenchymal distortion (arrows), and capsular bulging, findings indicative of a US-3 positive category. (b) Transverse gray-scale US image shows echoes in the main portal vein (arrows). Diagnostic imaging was recommended. (c) Axial contrast-enhanced CT image obtained in the arterial phase shows enhancing soft tissue in the main portal vein (arrow), a finding associated with tumor in vein. Adjacent enhancing infiltrative HCC (arrowheads) corresponds to the area of parenchymal distortion and capsular bulging seen at US and CT/MRI LI-RADS category 5 with tumor in vein.
Figure 12c.
US-3 positive observations in a 54-year-old man with HCV infection and cirrhosis. (a) Longitudinal gray-scale US image shows a thrombus in the right portal vein (arrowheads), a large area of parenchymal distortion (arrows), and capsular bulging, findings indicative of a US-3 positive category. (b) Transverse gray-scale US image shows echoes in the main portal vein (arrows). Diagnostic imaging was recommended. (c) Axial contrast-enhanced CT image obtained in the arterial phase shows enhancing soft tissue in the main portal vein (arrow), a finding associated with tumor in vein. Adjacent enhancing infiltrative HCC (arrowheads) corresponds to the area of parenchymal distortion and capsular bulging seen at US and CT/MRI LI-RADS category 5 with tumor in vein.
Figure 13b.
US-3 positive observation in a 55-year-old woman with cirrhosis. Transverse gray-scale (a) and color Doppler (b) US images of the left portal vein show mural echoes (arrows in a) owing to a thrombus that meets the criteria for US-3 positive. The color Doppler US image (b) shows flow in the vein, a finding consistent with nonocclusive thrombus. A diagnostic test was recommended, and follow-up multiphase contrast-enhanced CT images (not shown) showed bland thrombus.
Uncertainty in Assigning a US Category: Tie-breaking Rule
If there is uncertainty in deciding between two categories for a given examination, the category reflecting the greater level of suspicion should be assigned to maximize the sensitivity of the primary screening. Therefore, if deciding between US-1 negative or US-2 subthreshold, assign US-2 subthreshold. If deciding between US-2 subthreshold or US-3 positive, assign US-3 positive.
US LI-RADS Category and Management
The US LI-RADS category determines the management recommendation. For a US-1 negative assignment, the patient should undergo routine surveillance consisting of a liver US examination in 6 months. For a US-2 subthreshold assignment, a short-interval 3–6-month repeat US examination is recommended. Given the importance of early detection of small HCCs, US LI-RADS includes this category and management recommendation to monitor for interval growth of small observations, as nodules reaching 10 mm require further characterization. The follow-up time range allows for flexibility on the basis of physician, institutional, and patient preference, the level of suspicion of the observation, and whether the observation is new.
As observations less than 10 mm cannot meet the criteria for CT/MRI LI-RADS 5 (definitely HCC), repeat US surveillance of small observations is recommended to decrease false-positive rates and costs.
Finally, for a US-3 positive assignment, further characterization with multiphase contrast-enhanced CT, MRI, or US is recommended. Figure 14 summarizes the US categories and their recommended management (12).
Figure 14.
Chart depicts step 1 of the US LI-RADS and describes the categories that are applied to an entire US examination. The category helps guide patient management. Step 2 (not shown) is to apply the tie-breaking rule if necessary. (Reprinted, with permission, from reference 12.)
Visualization Score
The sensitivity of a screening or surveillance US examination is dependent on the degree of liver visualization and is affected by factors both extrinsic and intrinsic to the liver itself. Extrinsic factors that may impair liver visualization include interposed bowel, ribs, lung, or ascites, as well as patient factors such as obesity or inability to comply with breathing instructions. Intrinsic factors include severe steatosis, which can attenuate the ultrasound beam and cause inadequate penetration of the deepest portions of the liver, and severe parenchymal heterogeneity from advanced cirrhosis, which can obscure an underlying mass.
Global liver atrophy represents an additional intrinsic factor that can limit visualization of the liver by way of a subcostal approach. Of note, these intrinsic factors may also reduce the accuracy of CT and MRI.
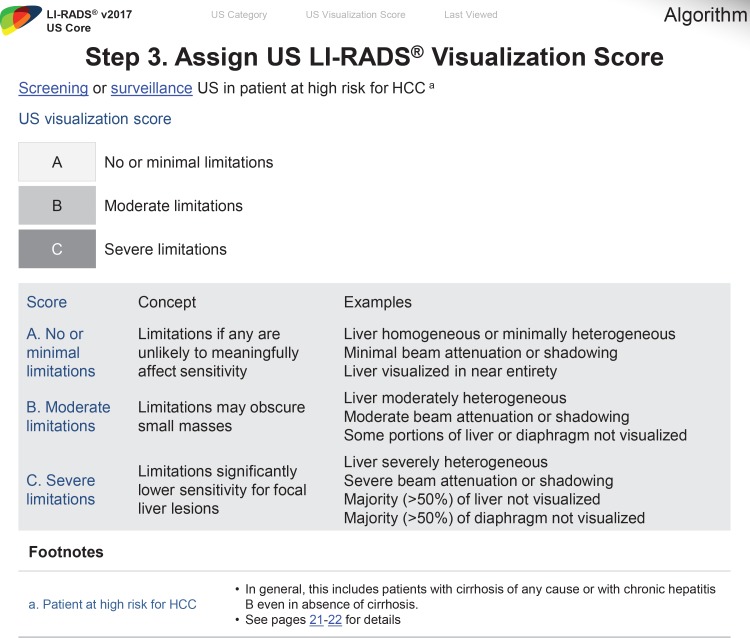
In an effort to communicate the expected level of the sensitivity of the test, US LI-RADS adopted the visualization score. Analogous to breast density categories assigned at mammography, the visualization score in US LI-RADS conveys the expected level of sensitivity of the examination but does not formally alter the management recommendation. Three visualization scores are possible at US and are defined as A (no or minimal limitations), B (moderate limitations), and C (severe limitations) (Fig 15) (12).
Figure 15.
Chart depicts step 3 of the US LI-RADS and describes each visualization score, which helps communicate the sensitivity of a screening or surveillance US examination and the degree of liver visualization. (Reprinted, with permission, from reference 12.)
Visualization Score A: No or Minimal Limitations
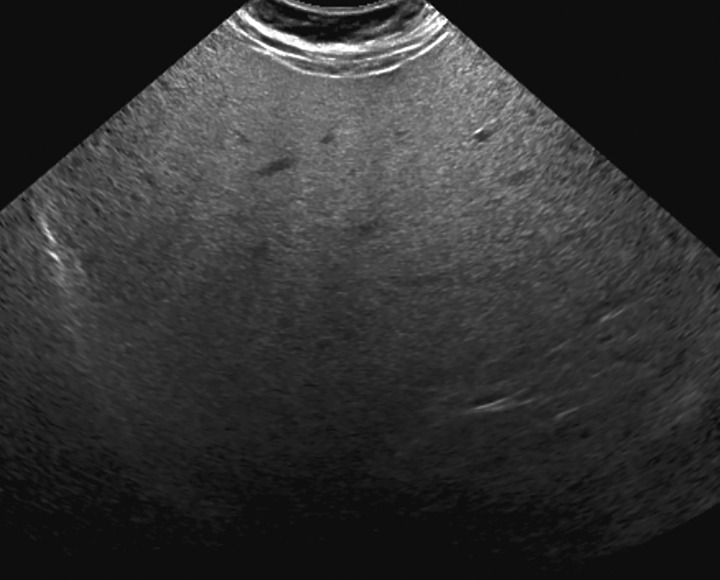
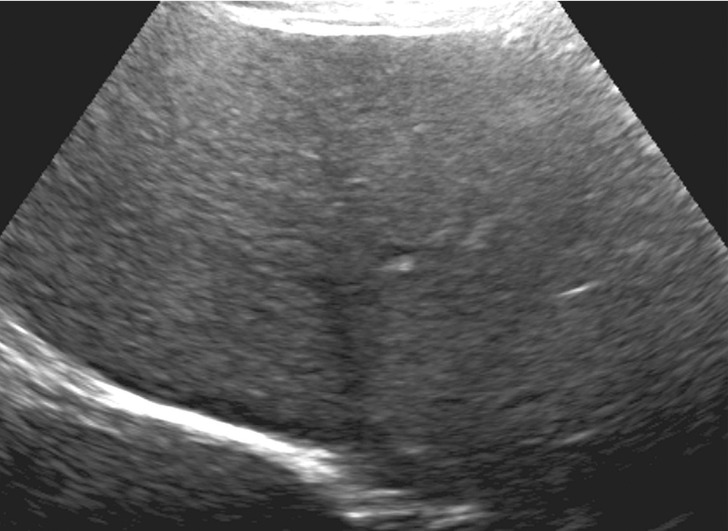
In visualization score A, the liver is visualized in its near entirety. If limitations are present, they are unlikely to meaningfully affect sensitivity for detection of focal liver observations. Examples of visualization score A include a diffusely homogeneous or minimally heterogeneous liver or a liver in which minimal beam attenuation or shadowing is depicted (Fig 16).
Figure 16.
Visualization score A in a 57-year-old woman with HCV infection and cirrhosis. Transverse gray-scale US image shows minimal liver heterogeneity and satisfactory visualization of the liver capsule and diaphragm.
Visualization Score B: Moderate Limitations
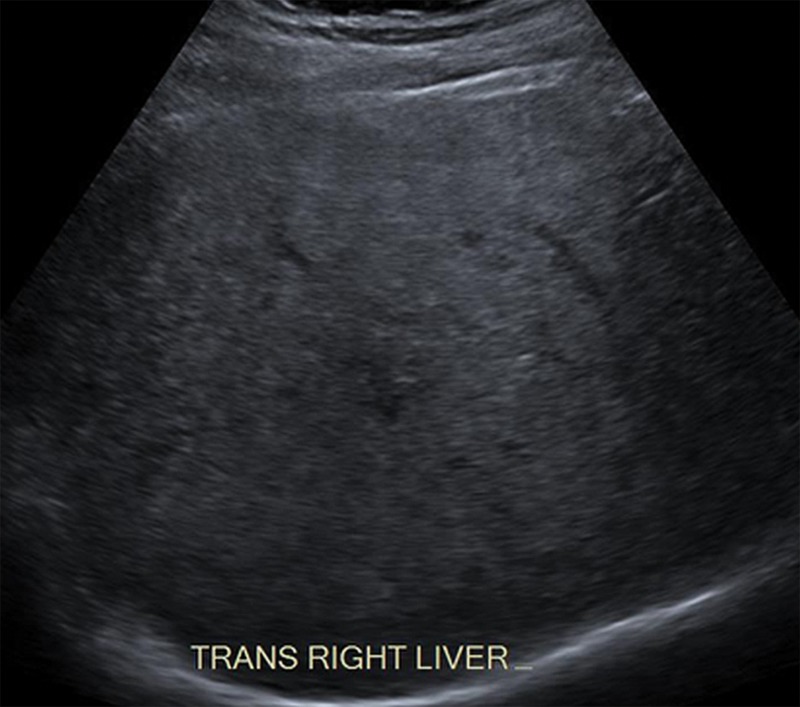
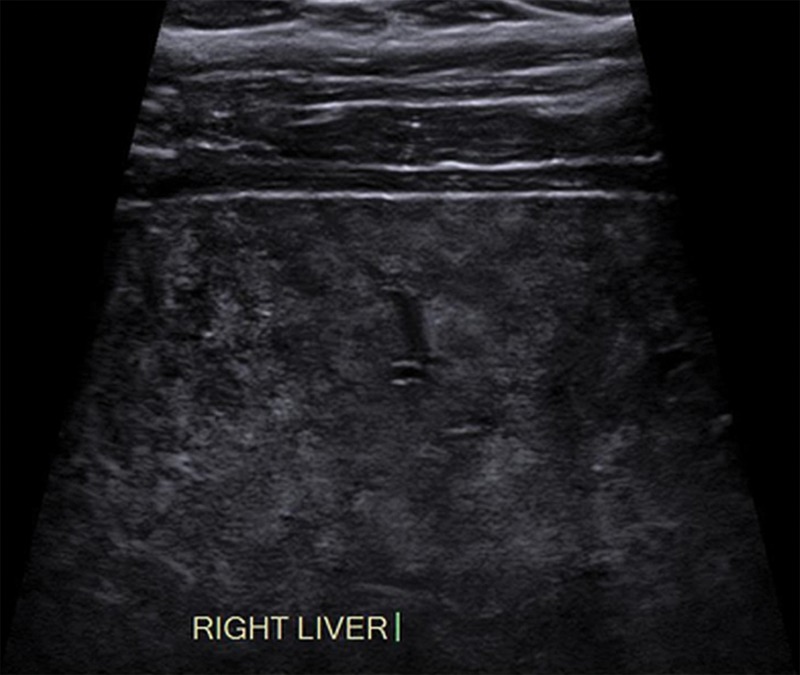
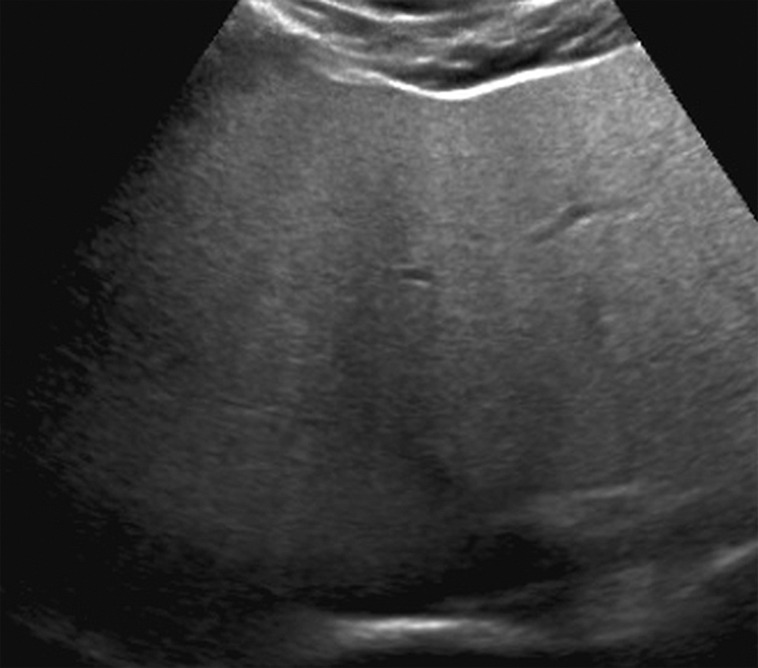
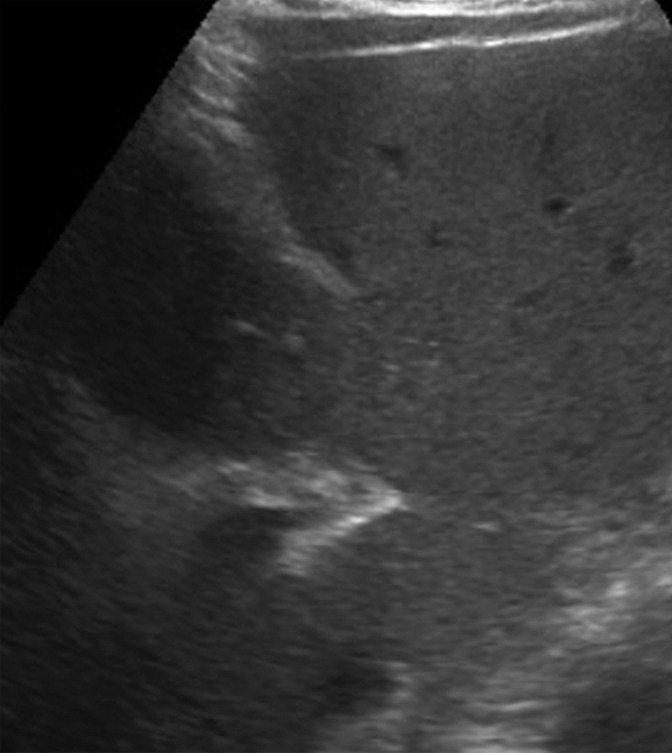
In visualization score B, limitations are present that may obscure small masses. Examples of visualization score B include moderate parenchymal heterogeneity (Fig 17), the presence of innumerable subcentimeter background nodules that may obscure or mimic tumors, and moderate beam attenuation from steatosis, bowel gas, or ribs that may obscure small portions (<50%) of the liver or diaphragm (Fig 18).
Figure 17a.
Visualization score B in a 52-year-old man with chronic HBV infection. Transverse gray-scale US images of the liver obtained using low-frequency (a) and high-frequency (b) transducers shows moderately heterogeneous liver parenchyma, which may limit the sensitivity for detecting small focal liver observations.
Figure 18.
Visualization score B in a 68-year-old woman with NASH cirrhosis. Gray-scale transverse US image of the liver shows a diffuse increase in the echogenicity of the liver, resulting in sound attenuation and partial obscuration of the right lobe of the liver, potentially decreasing the ability to detect small focal observations. However, the diaphragm (arrows) is still seen. (Case courtesy of the ACR.)
Figure 17b.
Visualization score B in a 52-year-old man with chronic HBV infection. Transverse gray-scale US images of the liver obtained using low-frequency (a) and high-frequency (b) transducers shows moderately heterogeneous liver parenchyma, which may limit the sensitivity for detecting small focal liver observations.
Visualization Score C: Severe Limitations
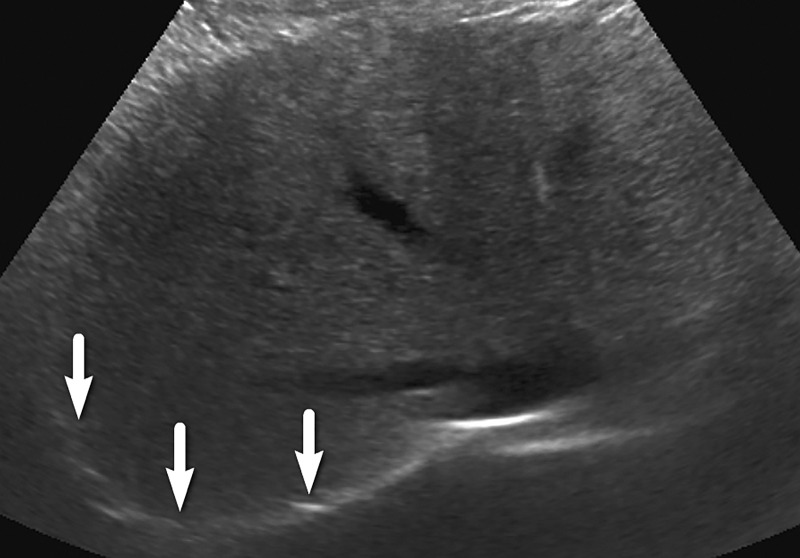
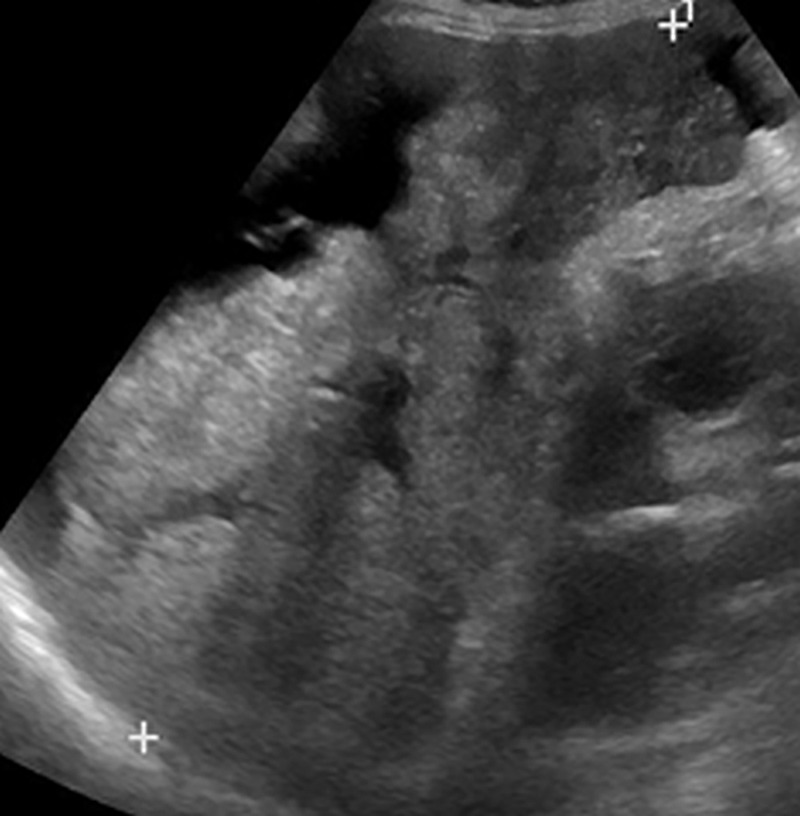
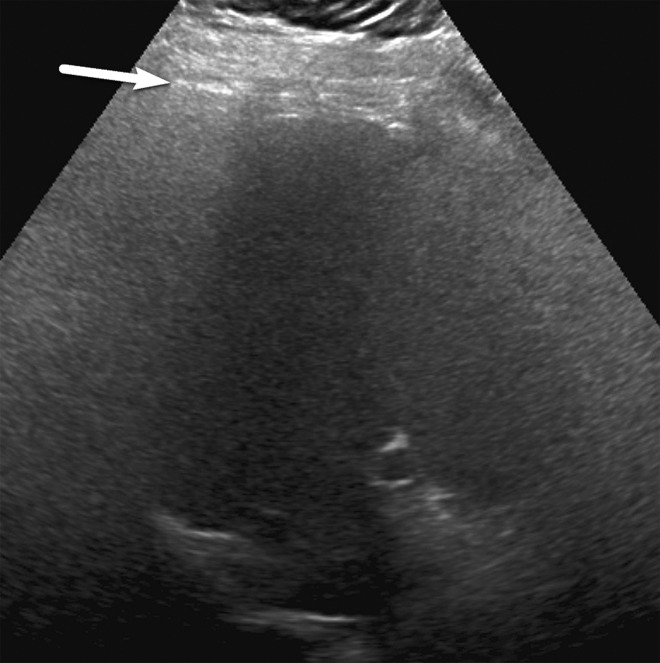
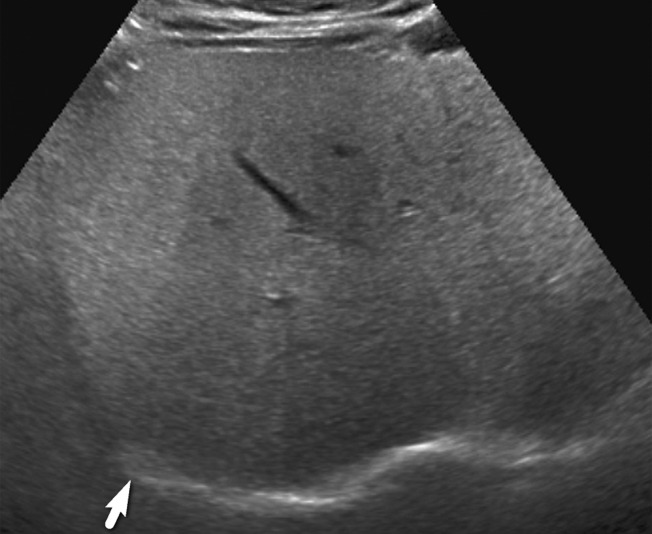
In visualization score C, the limitations are likely to significantly lower the sensitivity for focal liver observations. Examples include severe parenchymal heterogeneity and distortion (Fig 19), marked beam attenuation (Fig 20) obscuring more than 50% of the liver, or marked extrinsic shadowing from the ribs or bowel obscuring more than 50% of the liver.
Figure 19.
Visualization score C in a 70-year-old patient with cirrhosis. Longitudinal gray-scale US image shows marked liver heterogeneity, capsular retraction, wedge-shaped hypoechoic areas, and intrinsic liver heterogeneity that may significantly lower sensitivity for focal observations. Note that the ascites may indicate decompensated (Child-Pugh class C) cirrhosis. Therefore, this patient may no longer be considered a screening and surveillance candidate. (Case courtesy of the ACR.)
Figure 20.
Visualization score C in a 44-year-old woman with NASH cirrhosis. Sagittal gray-scale US image shows poor penetration and nonvisualization of the diaphragm owing to severe steatosis, which may significantly lower the sensitivity for detecting focal observations.
Management and Visualization Scores
Although the visualization scores communicate the expected level of sensitivity of the US examination, the formal management recommendation is not influenced by the visualization score. Therefore, it would be incorrect to recommend routine CT or MRI for surveillance purely on the basis of a visualization score of B or C. Rather, management should be determined on the basis of the US category (US-1 to US-3), noting that management decisions, if altered, should be individualized with input from a multidisciplinary team, which can balance the merits of alternative screening methods with the degree of clinical risk.
Visualization scores affected by extrinsic factors (ie, bowel gas) or patient factors (inability to cooperate) may change at follow-up examinations, whereas those affected by intrinsic factors may not. Continual optimization of US is paramount, as the simple act of changing a patient’s position or the US transducer frequency can significantly improve liver visualization. As performance and outcomes data are collected, recommendations on the basis of the visualization score may be introduced in the future, depending on the quality and strength of the evidence.
Technical Recommendations
The ACR–American Institute of Ultrasound in Medicine (AIUM)–Society of Pediatric Radiology (SPR)–Society of Radiologists in Ultrasound (SRU) collaborative committee has set recommendations for optimal technical parameters (35). To facilitate reproducibility and comparison with prior or subsequent studies, as well as between various imaging sites, screening and surveillance US of the abdomen should be performed in accordance with these set standards. The expert consensus panel of the ACR US LI-RADS working group provides additional liver US-specific recommendations. Whenever possible, comparison should be made with prior examinations, including US, CT, or MRI, which can also help to confirm a previously characterized benign observation.
Recommended patient and equipment-specific parameters for surveillance US of the liver by the US LI-RADS working group panel can be accessed on the ACR US LI-RADS website (12) and are as follows (33,34):
1. The patient should fast for at least 4–6 hours before the examination to avoid obscuration of the liver by overlying bowel gas.
2. Various patient positions and acoustic windows should be used to optimize visualization of the liver. These techniques include (a) supine and left lateral decubitus or left posterior oblique patient position (Fig 21); (b) deep suspended inspiration for better visualization of the hepatic dome and posterior superior hepatic segments; (c) subcostal and intercostal acoustic windows; and (d) adequate transducer pressure against the abdominal wall.
Figure 21a.
Effect of varying patient positions on liver visualization in a 61-year-old man with chronic HCV infection. Transverse gray-scale US images of the right lobe obtained with the patient in the supine (a) and left posterior oblique (b) positions show severe limitations in liver visualization in the supine position owing to rib shadow (arrow in a), with significant improvement in visualization of the liver parenchyma and diaphragm in b, such that the visualization score improved from C to B.
Figure 21b.
Effect of varying patient positions on liver visualization in a 61-year-old man with chronic HCV infection. Transverse gray-scale US images of the right lobe obtained with the patient in the supine (a) and left posterior oblique (b) positions show severe limitations in liver visualization in the supine position owing to rib shadow (arrow in a), with significant improvement in visualization of the liver parenchyma and diaphragm in b, such that the visualization score improved from C to B.
3. US examination of the liver is typically performed by using a curvilinear transducer (mean frequency, 1–9 MHz). A linear transducer (mean frequency, 5–12 MHz) may be used to assess surface nodularity and peripheral subcapsular parenchyma. The image settings should be optimized on the basis of intrinsic patient factors (including pulse frequencies, gain, field of view/depth, and harmonics) for adequate acoustic penetration and visualization of the entire liver parenchyma (Fig 22).
Figure 22a.
Effect of decreasing transducer frequency on liver visualization in a 45-year-old woman with severe steatosis. Transverse US images obtained with curved transducers with frequency ranges of 2–9 Mhz (a) and 1–5 Mhz (b) show the affect of lowering the transducer frequency in patients with steatosis, which improves both penetration of the liver and visualization of the diaphragm (arrow in b), likewise improving the visualization score from C to B.
Figure 22b.
Effect of decreasing transducer frequency on liver visualization in a 45-year-old woman with severe steatosis. Transverse US images obtained with curved transducers with frequency ranges of 2–9 Mhz (a) and 1–5 Mhz (b) show the affect of lowering the transducer frequency in patients with steatosis, which improves both penetration of the liver and visualization of the diaphragm (arrow in b), likewise improving the visualization score from C to B.
4. Color, power, and spectral Doppler US may be useful for evaluating vascular patency, flow direction, and velocity and may aid in differentiating vascular from nonvascular structures and/or observations.
5. Cine loops along with static images can be useful for documenting an observation and capturing its position within a particular liver segment and its relationship to critical structures, and for retrospective review at follow-up.
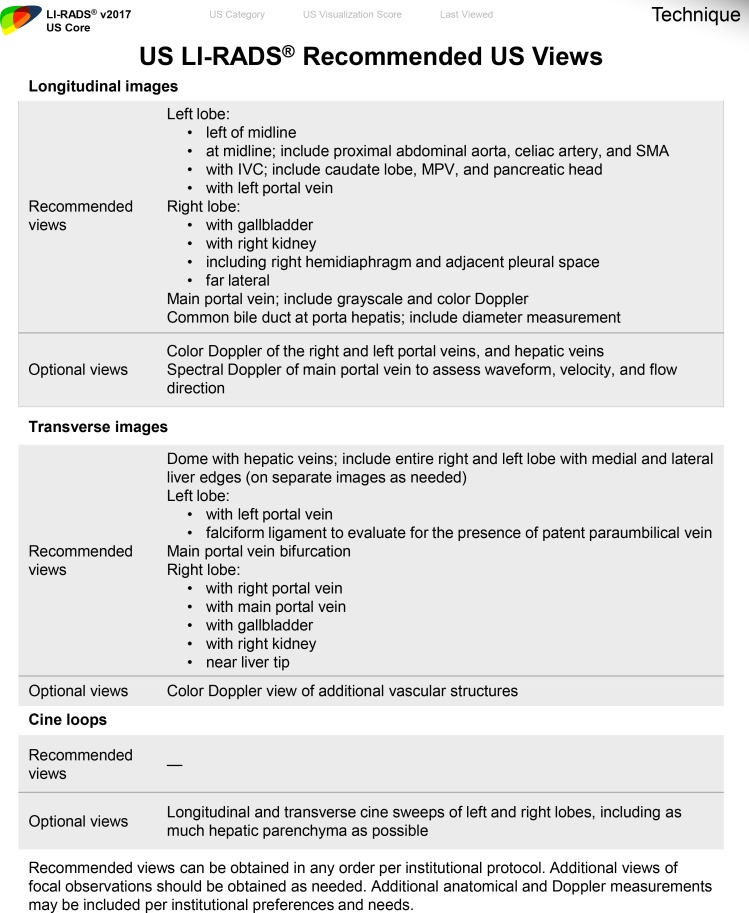
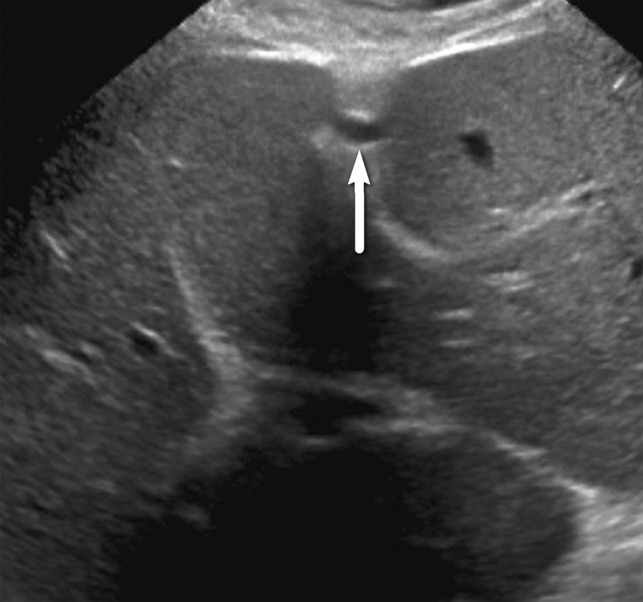
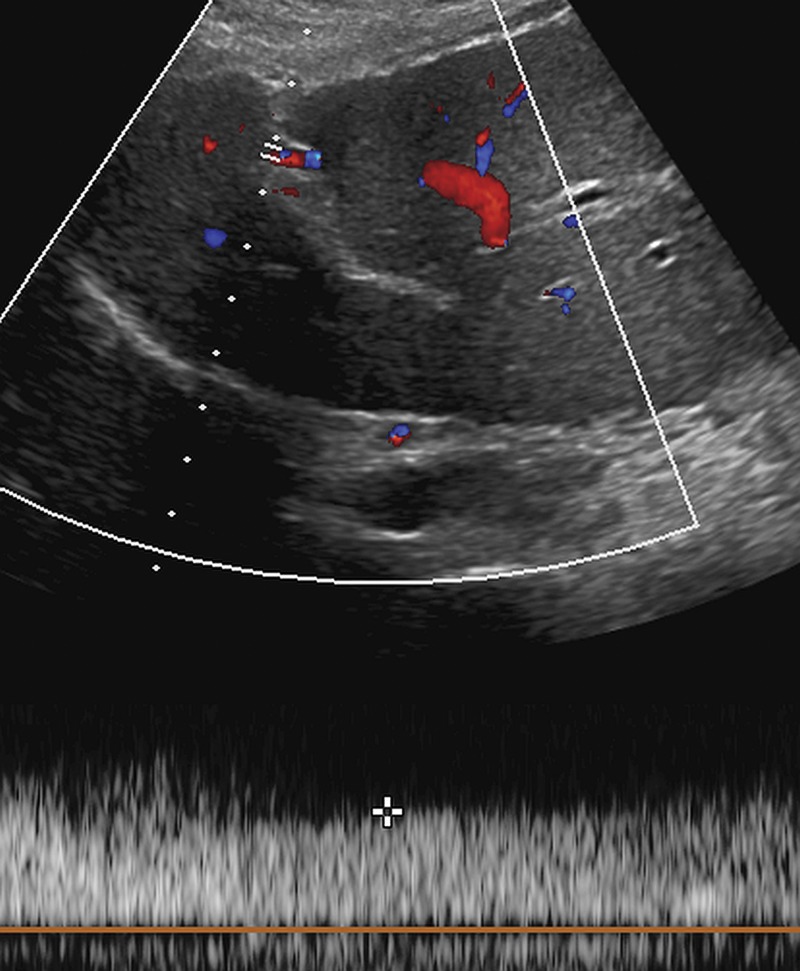
A standard US protocol should be followed at every institution, using the US LI-RADS recommended and optional US views as detailed in Fig 23. Tips to improve liver visualization are summarized in Table 2. Liver parenchyma should be evaluated in longitudinal and transverse views to include the entire liver. Any focal or diffuse observation should be further interrogated using cine loop and Doppler US for better delineation, characterization, and documentation. Any focal observation should be measured in three dimensions, documenting location within the hepatic Couinaud segment if possible and its relationship to major adjacent vessels (portal or hepatic veins). Doppler and spectral US should be used in patients with suspected venous thrombus to identify internal arterialization, which would suggest tumor in vein. Evaluation for relevant clinical markers of portal hypertension including splenomegaly, patent paraumbilical vein (Fig 24), and ascites can be performed with a liver US protocol, which may be useful in corroborating suspected cirrhosis.
Figure 23.
Form shows the US LI-RADS technical recommendations for US. IVC = inferior vena cava, MPV = main portal vein, SMA = superior mesenteric artery. (Reprinted, with permission, from reference 12.)
Table 2:
Improving Liver Visualization at US
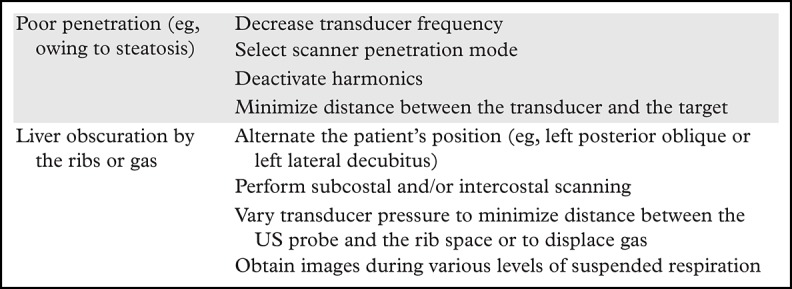
Figure 24a.
Portal hypertension in a 53-year-old man with HCV infection and cirrhosis, which was diagnosed through the evaluation of the falciform ligament. (a) Transverse gray-scale US image of the fissure for the falciform ligament shows a smooth liver contour and absence of a dilated paraumbilical vein. (b, c) Follow-up gray-scale (b) and spectral Doppler (c) US images obtained 2 years later show an anechoic structure in the falciform ligament (arrow in b) with portal venous flow (c), a finding characteristic of a patent paraumbilical vein and indicative of portal hypertension. The patient had no other signs of portal hypertension.
Figure 24b.
Portal hypertension in a 53-year-old man with HCV infection and cirrhosis, which was diagnosed through the evaluation of the falciform ligament. (a) Transverse gray-scale US image of the fissure for the falciform ligament shows a smooth liver contour and absence of a dilated paraumbilical vein. (b, c) Follow-up gray-scale (b) and spectral Doppler (c) US images obtained 2 years later show an anechoic structure in the falciform ligament (arrow in b) with portal venous flow (c), a finding characteristic of a patent paraumbilical vein and indicative of portal hypertension. The patient had no other signs of portal hypertension.
Figure 24c.
Portal hypertension in a 53-year-old man with HCV infection and cirrhosis, which was diagnosed through the evaluation of the falciform ligament. (a) Transverse gray-scale US image of the fissure for the falciform ligament shows a smooth liver contour and absence of a dilated paraumbilical vein. (b, c) Follow-up gray-scale (b) and spectral Doppler (c) US images obtained 2 years later show an anechoic structure in the falciform ligament (arrow in b) with portal venous flow (c), a finding characteristic of a patent paraumbilical vein and indicative of portal hypertension. The patient had no other signs of portal hypertension.
Implementing US LI-RADS in Clinical Practice
Any change in practice may impact clinical culture and workflow, and potential barriers to change exist in both areas. In 2017, US LI-RADS was incorporated into everyday clinical practice at seven academic radiology departments across the United States, and over 7000 HCC screening and surveillance US examinations were reported using the US LI-RADS system by January 2018 (36). We found that in departments where LI-RADS for CT/MRI was already in use, radiologists, hepatologists, and transplant surgeons had an awareness of the goals and benefits of standardized reporting for this frequently imaged patient population (36). This conceptual understanding and shared vocabulary helped to smooth the implementation, which built on an existing collaborative culture.
At sites where there was a less developed common culture around practice improvement for reporting in HCC, the methods and pacing of US LI-RADS adoption differed. However, all had in common the need to articulate the mission of the project and build alignment among the many stakeholders. Clear and repeated message delivery about the goals and potential benefits of standardized reporting—predictable formatting (37), consistent recommendations (38), coherence with society guidelines (39), and the ability to track patient outcomes (40)—was essential in this regard. In addition, implementation is more likely to be effective if the message can be delivered by a radiologist with a strong existing relationship with the clinical team.
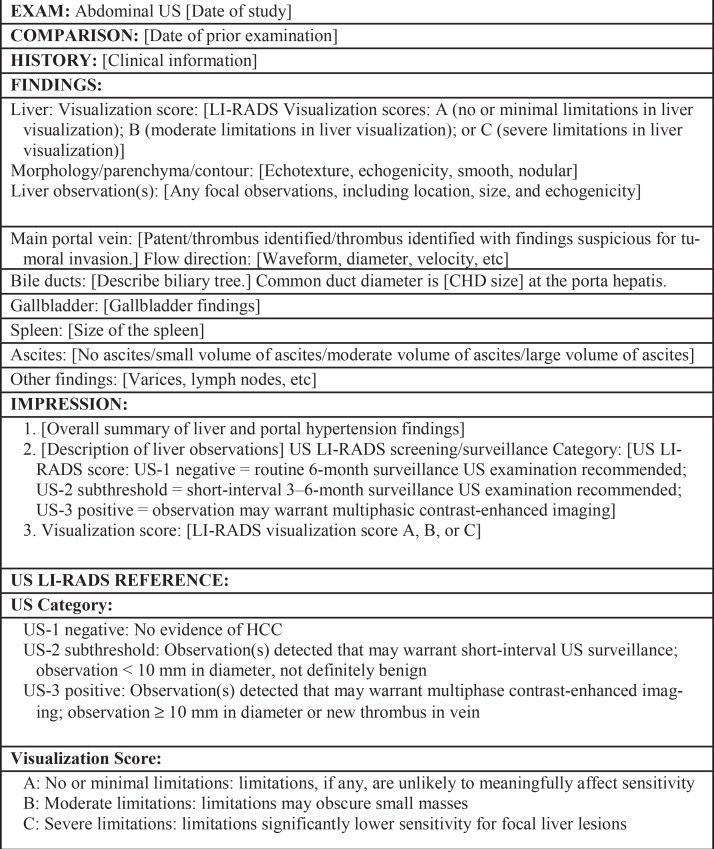
Some radiologists in participating departments objected to standardized reporting or the new obligation being added to their already busy clinical practice. Emphasis on mission and purpose, coupled with logistics that make it easy to comply (or harder not to comply), helped ease tensions and improve adoption. For any department moving through this transition, a locally specific dictation template containing the key features of a US LI-RADS visualization score and US category should be created (Fig 25). This can be a stand-alone template for a limited US abdomen examination used for HCC screening in many sites, or it may include dictation components for complete US abdomen, liver Doppler US, and transjugular intrahepatic portosystemic shunt (TIPS) assessments and/or elastography measurements, depending on local practice.
Figure 25.
Dictation template of a US LI-RADS report shows key features of a visualization score and US category. CHD = common hepatic duct.
The template shown in Figure 25 should be straightforward and easy to use, with built-in pick lists where possible. At some sites, the template can be set up to automatically load when a relevant examination is opened. At sites where residents and fellows dictate the majority of cases, these radiology trainees should be educated about this new practice standard and encouraged to give feedback.
The ACR Breast Imaging Reporting and Data System (BI-RADS) is well known as the original and most mature standardized reporting and data system in radiology. Within a decade of its initial 1993 release, the need for US and MRI versions of BI-RADS was obvious, and separate working groups were convened, analogous to the multiple working groups now linked to LI-RADS. During its 25-year history, the BI-RADS lexicon and categories have undergone continuous refinement in response to feedback from radiologists, patients, and outcomes research (38), and LI-RADS is intended to be similarly dynamic.
BI-RADS was developed in the context of the U.S. Food and Drug Administration’s movement toward mammography accreditation in the late 1980s, and the original version was endorsed by the American College of Surgeons and the American College of Obstetrics and Gynecology (41). BI-RADS implementation was thus facilitated by multidisciplinary consensus, and by 1999 the use of BI-RADS assessments was required by the federal Mammography Quality Standards Act final rules (38). This history provides some contrast to the rapid and largely voluntary implementation of LI-RADS and other emerging reporting and data systems, and it highlights both the growing acceptance and appreciation of such systems among radiologists and the ongoing need for alignment and harmonization with other professional societies.
Conclusion
The US LI-RADS encompasses performance, interpretation, reporting, and follow-up recommendations for screening and surveillance US in patients at risk for developing HCC. The US category summarizes the main study results and determines follow-up management. The visualization score conveys the expected level of sensitivity of the test but does not yet affect management. The technical recommendations include specific views that can aid in assessment of the liver and provide tips to improve liver visualization. User experience, feedback, and research will lead to further refinements of future versions of the US LI-RADS.
A.K. supported by National Cancer Institute grants (1 R01CA215520-01A1, 1 R01CA195443, and 1 U01 CA210020-01A1).
Presented as an education exhibit at the 2017 RSNA Annual Meeting.
For this journal-based SA-CME activity, the authors D.T.F., J.H.S., Y.K., C.B.S., and A.K have provided disclosures; all other authors, the editor, and the reviewers have disclosed no relevant relationships.
Disclosures of Conflicts of Interest.—: D.T.F. Activities related to the present article: disclosed no relevant relationships. Activities not related to the present article: consultancy fees from Philips Ultrasound, payment for lectures from Philips Healthcare, and consultation agreement with Siemens Medical Solutions USA. Other activities: disclosed no relevant relationships. J.H.S. Activities related to the present article: disclosed no relevant relationships. Activities not related to the present article: travel expenses from Bayer. Other activities: disclosed no relevant relationships. Y.K. Activities related to the present article: disclosed no relevant relationships. Activities not related to the present article: research support for US equipment for GE Healthcare and Canon Medical Systems; research support for contrast agents for Bracco Diagnostics and Lantheus Medical Imaging. Other activities: disclosed no relevant relationships. C.B.S. Activities related to the present article: disclosed no relevant relationships. Activities not related to the present article: consultant for University of California Regents for Boehringer Ingelheim, AMRA Medical, and Fulcrum Therapeutics; advisory board representative for University of California Regents for AMRA Medical, Geurbet, and Fulcrum Therapeutics; grants from Gilead Sciences, GE Healthcare, Siemens, GE Healthcare MRI, Bayer AMRI, GE Healthcare Digital, GE Ultrasound, ACR Innovation, and Philips; speaker’s fees from GE Healthcare and Bayer; educational presentation development payments from Medscape; and lab service agreements with Enanta/ICON Medical Imaging, Gilead Sciences, Shire, VirtualScopics, Intercept Pharmaceuticals, and Synageva. Other activities: disclosed no relevant relationships. A.K. Activities related to the present article: disclosed no relevant relationships. Activities not related to the present article: royalties from Elsevier. Other activities: disclosed no relevant relationships.
Abbreviations:
- AASLD
- American Association for the Study of Liver Diseases
- ACR
- American College of Radiology
- AFP
- α-fetoprotein
- HBV
- hepatitis B virus
- HCV
- hepatitis C virus
- HCC
- hepatocellular carcinoma
- LI-RADS
- Liver Imaging Reporting and Data System
- NASH
- nonalcoholic steatohepatitis
- RCT
- randomized controlled trial
- WHO
- World Health Organization
References
- 1.Ferenci P, Fried M, Labrecque D, et al. Hepatocellular carcinoma (HCC): a global perspective. J Clin Gastroenterol 2010;44(4):239–245. [DOI] [PubMed] [Google Scholar]
- 2.International Agency for Research on Cancer . GLOBOCAN 2012: estimated cancer incidence, mortality and prevalence worldwide in 2012. http://globocan.iarc.fr/Pages/fact_sheets_population.aspx. Accessed March 15, 2017.
- 3.Tang A, Hallouch O, Chernyak V, Kamaya A, Sirlin CB. Epidemiology of hepatocellular carcinoma: target population for surveillance and diagnosis. Abdom Radiol (NY) 2018;43(1):13–25. [DOI] [PubMed] [Google Scholar]
- 4.Global Burden of Disease Liver Cancer Collaboration , Akinyemiju T, Abera S, et al. The burden of primary liver cancer and underlying etiologies from 1990 to 2015 at the global, regional, and national level: results from the Global Burden of Disease Study 2015. JAMA Oncol 2017;3(12):1683–1691. [DOI] [PMC free article] [PubMed] [Google Scholar]
- 5.National Cancer Institute Surveillance, Epidemiology and End Results (SEER) Program. SEER stat database: incidence—SEER 9 regs research data, Nov 2009 sub (1973-2007). National Cancer Institute, Bethesda, Md, April 2010. [Google Scholar]
- 6.Llovet JM, Burroughs A, Bruix J. Hepatocellular carcinoma. Lancet 2003;362(9399):1907–1917. [DOI] [PubMed] [Google Scholar]
- 7.Bruix J, Sherman M; American Association for the Study of Liver Diseases . Management of hepatocellular carcinoma: an update. Hepatology 2011;53(3):1020–1022. [DOI] [PMC free article] [PubMed] [Google Scholar]
- 8.Marrero JA, Kulik LM, Sirlin CB, et al. Diagnosis, staging, and management of hepatocellular carcinoma: 2018 practice guidance by the American Association for the Study of Liver Diseases. Hepatology 2018;68(2):723–750. [DOI] [PubMed] [Google Scholar]
- 9.Bruix J, Sherman M; Practice Guidelines Committee, American Association for the Study of Liver Diseases. Management of hepatocellular carcinoma. Hepatology 2005;42(5):1208–1236. [DOI] [PubMed] [Google Scholar]
- 10.Wilson JMB, Jungner G. Principles and practices of screening for disease: public health paper no. 34. Geneva, Switzerland: World Health Organization, 1968. [Google Scholar]
- 11.Cucchetti A, Trevisani F, Cescon M, et al. Cost-effectiveness of semi-annual surveillance for hepatocellular carcinoma in cirrhotic patients of the Italian Liver Cancer population. J Hepatol 2012;56(5):1089–1096. [DOI] [PubMed] [Google Scholar]
- 12.American College of Radiology . Ultrasound LI-RADS v2017. https://www.acr.org/Clinical-Resources/Reporting-and-Data-Systems/LI-RADS/Ultrasound-LI-RADS-v2017. Accessed April 16, 2018.
- 13.American College of Radiology . Liver imaging reporting and data system. American College of Radiology website. https://www.acr.org/Quality-Safety/Resources/LIRADS. Accessed April 16, 2018.
- 14.Chernyak V, Santillan CS, Papadatos D, Sirlin CB. LI-RADS algorithm: CT and MRI. Abdom Radiol (NY) 2018;43(1):111–126. [DOI] [PubMed] [Google Scholar]
- 15.Wilson SR, Lyshchik A, Piscaglia F, et al. CEUS LI-RADS: algorithm, implementation, and key differences from CT/MRI. Abdom Radiol (NY) 2018;43(1):127–142. [DOI] [PubMed] [Google Scholar]
- 16.Kielar A, Fowler KJ, Lewis S, et al. Locoregional therapies for hepatocellular carcinoma and the new LI-RADS treatment response algorithm. Abdom Radiol (NY) 2018;43(1):218–230. [DOI] [PMC free article] [PubMed] [Google Scholar]
- 17.Yang B, Zhang B, Xu Y, et al. Prospective study of early detection for primary liver cancer. J Cancer Res Clin Oncol 1997;123(6):357–360. [DOI] [PubMed] [Google Scholar]
- 18.Zhang BH, Yang BH, Tang ZY. Randomized controlled trial of screening for hepatocellular carcinoma. J Cancer Res Clin Oncol 2004;130(7):417–422. [DOI] [PubMed] [Google Scholar]
- 19.Yang B, Zhang B, Tang Z. Randomized controlled prospective study of secondary prevention for primary liver cancer [in Chinese]. Zhonghua Yi Xue Za Zhi 1999;79(12):887–889. [PubMed] [Google Scholar]
- 20.McMahon BJ, Bulkow L, Harpster A, et al. Screening for hepatocellular carcinoma in Alaska natives infected with chronic hepatitis B: a 16-year population-based study. Hepatology 2000;32(4 t 1):842–846. [DOI] [PubMed] [Google Scholar]
- 21.Wong LL, Limm WM, Severino R, Wong LM. Improved survival with screening for hepatocellular carcinoma. Liver Transpl 2000;6(3):320–325. [DOI] [PubMed] [Google Scholar]
- 22.Gebo KA, Chander G, Jenckes MW, et al. Screening tests for hepatocellular carcinoma in patients with chronic hepatitis C: a systematic review. Hepatology 2002;36(5 suppl 1):S84–S92. [DOI] [PubMed] [Google Scholar]
- 23.Solmi L, Primerano AM, Gandolfi L. Ultrasound follow-up of patients at risk for hepatocellular carcinoma: results of a prospective study on 360 cases. Am J Gastroenterol 1996;91(6):1189–1194. [PubMed] [Google Scholar]
- 24.Gupta S, Bent S, Kohlwes J. Test characteristics of alpha-fetoprotein for detecting hepatocellular carcinoma in patients with hepatitis C: a systematic review and critical analysis. Ann Intern Med 2003;139(1):46–50. [DOI] [PubMed] [Google Scholar]
- 25.Tzartzeva K, Obi J, Rich NE, et al. Surveillance imaging and alpha fetoprotein for early detection of hepatocellular carcinoma in patients with cirrhosis: a meta-analysis. Gastroenterology 2018;154(6):1706–1718.e1. [DOI] [PMC free article] [PubMed] [Google Scholar]
- 26.Heimbach JK, Kulik LM, Finn RS, et al. AASLD guidelines for the treatment of hepatocellular carcinoma. Hepatology 2018;67(1):358–380. [DOI] [PubMed] [Google Scholar]
- 27.Singal A, Volk ML, Waljee A, et al. Meta-analysis: surveillance with ultrasound for early-stage hepatocellular carcinoma in patients with cirrhosis. Aliment Pharmacol Ther 2009;30(1):37–47. [DOI] [PMC free article] [PubMed] [Google Scholar]
- 28.Chou R, Cuevas C, Fu R, et al. Imaging techniques for the diagnosis of hepatocellular carcinoma: a systematic review and meta-analysis. Ann Intern Med 2015;162(10):697–711. [DOI] [PubMed] [Google Scholar]
- 29.Omata M, Cheng AL, Kokudo N, et al. Asia Pacific clinical practice guidelines on the management of hepatocellular carcinoma: a 2017 update. Hepatol Int 2017;11:317-370. [DOI] [PMC free article] [PubMed] [Google Scholar]
- 30.European Association for the Study of the Liver . EASL clinical practice guidelines: management of hepatocellular carcinoma. J Hepatol 2018;69:182-236. [DOI] [PubMed] [Google Scholar]
- 31.Organ Procurement and Transplantation Network (OPTN) . OPTN/UNOS policy 9: allocation of livers and liver intestines. http://optn.transplant.hrsa.gov/ContentDocuments/OPTN_Policies.pdf-nameddest=Policy_09. Published 2018. Accessed June 6, 2018.
- 32.Wald C, Russo MW, Heimbach JK, Hussain HK, Pomfret EA, Bruix J. New OPTN/UNOS policy for liver transplant allocation: standardization of liver imaging, diagnosis, classification, and reporting of hepatocellular carcinoma. Radiology 2013;266(2):376–382. [DOI] [PubMed] [Google Scholar]
- 33.Fetzer DT, Rodgers SK, Harris AC, et al. Screening and surveillance of hepatocellular carcinoma: an introduction to ultrasound liver imaging reporting and data system. Radiol Clin North Am 2017;55(6):1197–1209. [DOI] [PubMed] [Google Scholar]
- 34.Morgan TA, Maturen KE, Dahiya N, Sun MRM, Kamaya A; American College of Radiology Ultrasound Liver Imaging and Reporting Data System (US LI-RADS) Working Group. US LI-RADS: ultrasound liver imaging reporting and data system for screening and surveillance of hepatocellular carcinoma. Abdom Radiol (NY) 2018;43(1):41–55. [DOI] [PubMed] [Google Scholar]
- 35.American College of Radiology . ACR–AIUM–SPR–SRU practice parameter for the performance of an ultrasound examination of the abdomen and/or retroperitoneum. https://www.acr.org/-/media/ACR/Files/Practice-Parameters/US-Abd-Retro.pdf?la=en. Revised 2017. Accessed January 3, 2018.
- 36.American College of Radiology . CT/MRI LI-RADS v2018. https://www.acr.org/Clinical-Resources/Reporting-and-Data-Systems/LI-RADS/CT-MRI-LI-RADS-v2018. Published July 2018. Accessed February 19, 2019.
- 37.Schwartz LH, Panicek DM, Berk AR, Li Y, Hricak H. Improving communication of diagnostic radiology findings through structured reporting. Radiology 2011;260(1):174–181. [DOI] [PMC free article] [PubMed] [Google Scholar]
- 38.Burnside ES, Sickles EA, Bassett LW, et al. The ACR BI-RADS experience: learning from history. J Am Coll Radiol 2009;6(12):851–860. [DOI] [PMC free article] [PubMed] [Google Scholar]
- 39.Kahn CE, Jr, Heilbrun ME, Applegate KE. From guidelines to practice: how reporting templates promote the use of radiology practice guidelines. J Am Coll Radiol 2013;10(4):268–273. [DOI] [PMC free article] [PubMed] [Google Scholar]
- 40.Margolies LR, Pandey G, Horowitz ER, Mendelson DS. Breast imaging in the era of big data: structured reporting and data mining. AJR Am J Roentgenol 2016;206(2):259–264. [DOI] [PMC free article] [PubMed] [Google Scholar]
- 41.D’Orsi CJ, Kopans DB. Mammography interpretation: the BI-RADS method. Am Fam Physician 1997;55(5):1548–1550, 1552. [PubMed] [Google Scholar]


