Abstract
Neuronal activity-dependent transcription couples sensory experience to adaptive responses of the brain including learning and memory. Mechanisms of activity-dependent gene expression including alterations of the epigenome have been characterized1–8. However, the fundamental question of whether and how sensory experience remodels chromatin architecture in the adult brain in vivo to induce neural code transformations and learning and memory remains to be addressed. Here, in vivo calcium imaging, optogenetics, and pharmacological approaches reveal that granule neuron activation in the anterior dorsal cerebellar vermis (ADCV) plays a crucial role in a novel delay tactile startle learning paradigm in mice. Strikingly, using large-scale transcriptome and chromatin profiling, we have discovered that activation of the motor learning-linked granule neuron circuit reorganizes neuronal chromatin including through long-distance enhancer-promoter and transcriptionally active compartment interactions to orchestrate distinct granule neuron gene expression modules. Conditional CRISPR knockout of the chromatin architecture regulator Cohesin in ADCV granule neurons in adult mice disrupts enhancer-promoter interactions, activity-dependent transcription, and motor learning. These findings define how sensory experience patterns chromatin architecture and neural circuit coding in the brain to drive motor learning.
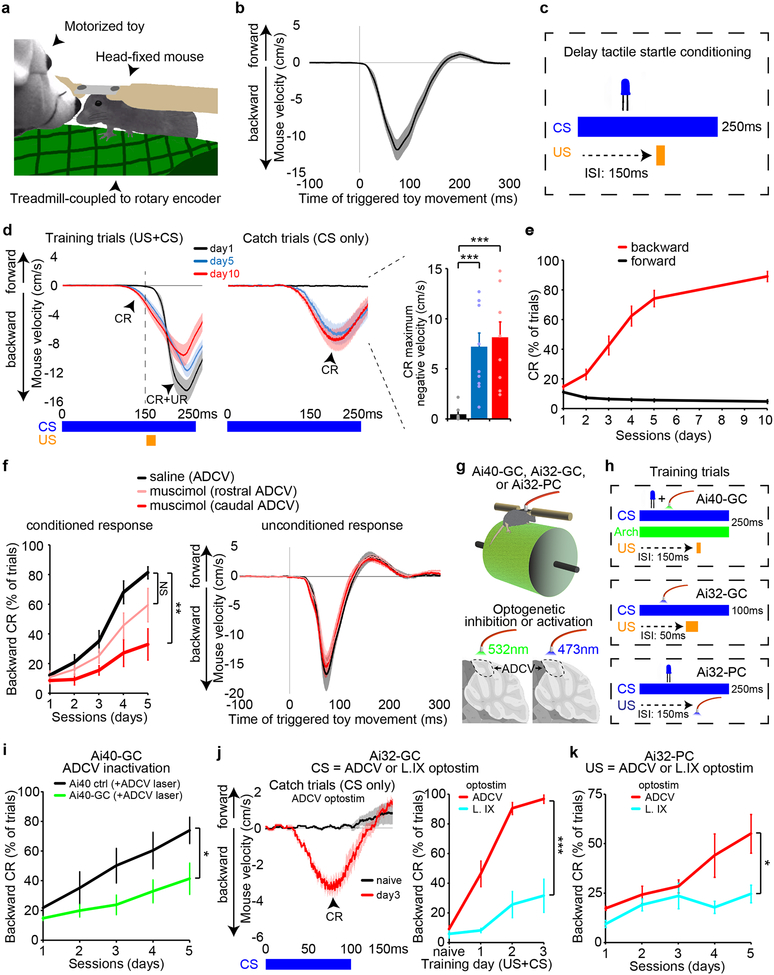
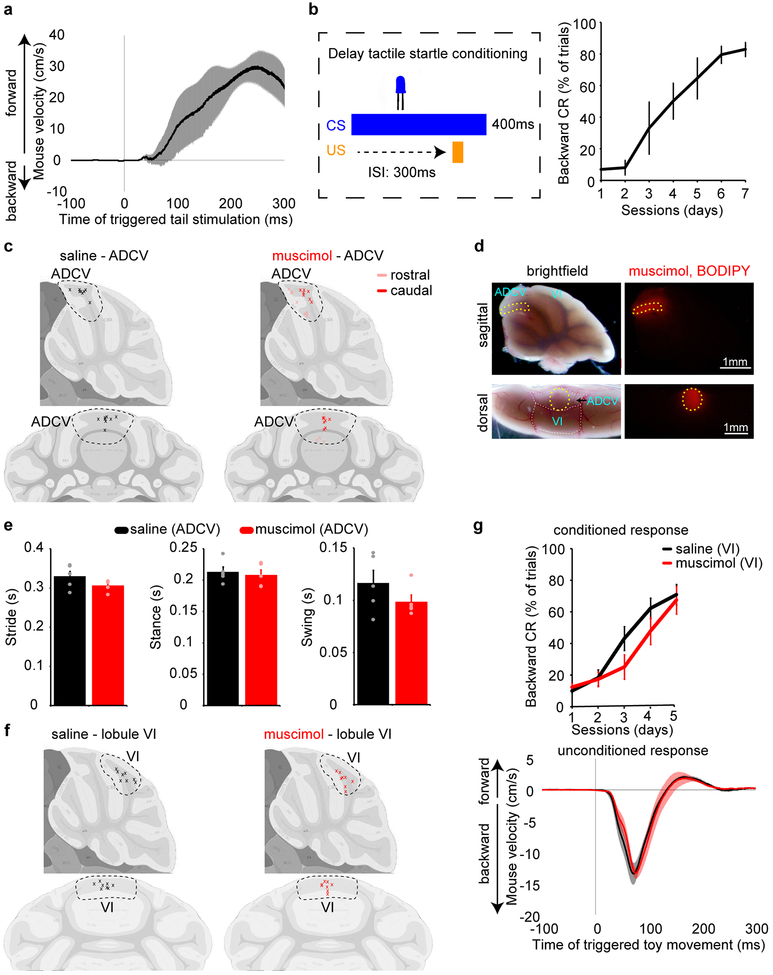
We developed a behavior paradigm that might be represented in the ADCV. The startle response is an evolutionarily conserved predator-evading animal reflex triggered by activation of trigeminal nerve dermatomes9. We induced the startle response by tactile stimulation of the nose of a head-fixed mouse on a treadmill using a motorized animal toy as the stimulus (Fig. 1a). Robust backward mouse locomotion was induced within 20 ms of electrically triggering tactile stimulation of the nose (Fig. 1b), but not of the tail (Extended Data Fig. 1a). When an LED used as the conditioned stimulus (CS) was repeatedly paired with a toy tactile stimulus as the unconditioned stimulus (US), animals learned to move backward in response to the LED cue over several days of training, including in catch trials in response to the CS only (Fig. 1c–e and Extended Data Fig. 1b). These results establish delay tactile startle conditioning as a novel motor learning paradigm.
Fig. 1. The ADCV plays a crucial role in delay tactile startle conditioning.
(a) Schematic of the tactile stimulus apparatus. (b) Mouse locomotion in response to tactile stimulation of the nose (n=20 mice). (c) The delay tactile startle conditioning paradigm using an LED light as conditioned stimulus (CS) and tactile stimulation as unconditioned stimulus (US). ISI: inter-stimulus interval. (d, e) Mouse locomotion during delay tactile startle conditioning (d, left and middle), and the maximum negative velocity of responses during catch trials (d, right, ***P=0.0006,0.0002 for day1-day10,day5-day10, one-way ANOVA with Dunnett’s post-hoc test, n=10,10,9 mice for day1,5,10) or percentage of trials with a conditioned response (CR) (e, backward CR on day1 vs day10, P=1.5×10⁻²³, two-tailed t-test, n=25,12 mice for day1,10). UR: unconditioned response. (f) Mice injected daily with muscimol or the saline vehicle control in the ADCV. The percentage of CR with training (left) and UR (right) upon muscimol-dependent neuronal inactivation during delay tactile startle conditioning (**P=0.0019, one-way ANOVA with Dunnett’s post-hoc test, n=8,7,7 mice for saline,musimol-rostral,muscimol-caudal). (g, h) Head-fixed mice expressing archaerhodopsin in granule neurons (Ai40-GC), channelrhodopsin in granule neurons (Ai32-GC), or channelrhodopsin in Purkinje cells (Ai32-PC) were optogenetically silenced or stimulated using fiber optic cannulae overlying the ADCV or lobule IX (L. IX). (i) Optogenetic silencing of the granule neuron pathway during the CS in delay tactile startle conditioning (*P=0.033, two-tailed t-test, n=9 mice). (j) Optostimulation of granule neurons in the ADCV or lobule IX as the CS in delay tactile startle conditioning (***P=0.00048, two-tailed t-test, n=5 mice). (k) Optostimulation of Purkinje cells in the ADCV or lobule IX as the US in delay tactile startle conditioning (*P=0.033, two-tailed t-test, n=7,5 mice for ADCV,lobule IX). In all panels, data show mean and shading or error bars denote standard error.
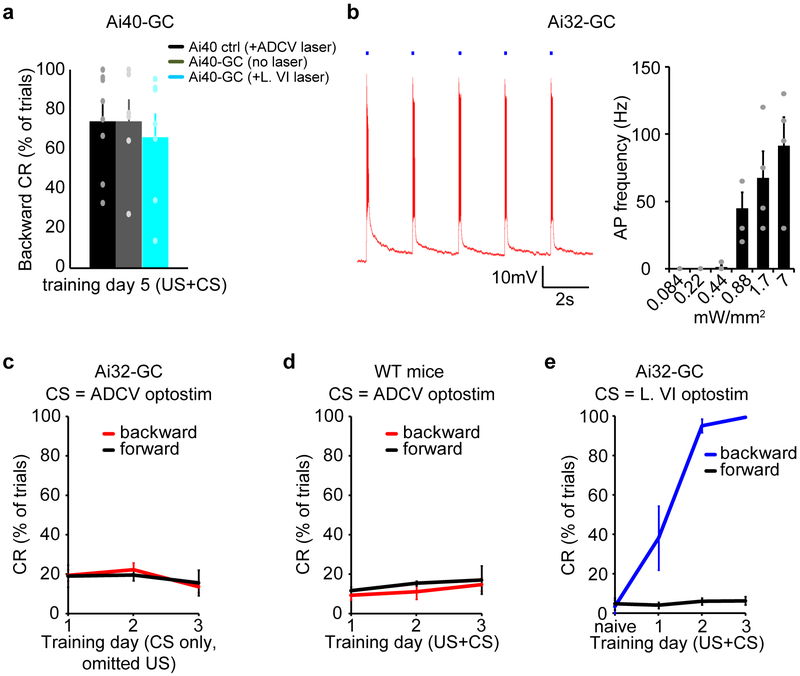
Delivery of the GABA(A) receptor agonist muscimol into the ADCV and in particular into the caudal ADCV, but not the contiguous lobule VI, robustly inhibited acquisition of the conditioned startle response in mice, but had little or no effect on the unconditioned response or gait dynamics (Fig. 1f and Extended Data Fig. 1c–g). In an optogenetic approach, silencing of granule neurons10,11 specifically in the ADCV during presentation of the CS inhibited acquisition of the conditioned response in mice (Fig. 1g–i). Little or no change in tactile startle conditioning was observed in distinct types of control mice (Extended Data Fig. 2a).
Direct optogenetic stimulation (optostimulation) of granule neurons12,13 in the ADCV as the CS, with the tactile stimulus (Fig. 1g, h and Extended Data Fig. 2b), triggered rapid associative motor learning in mice (Fig. 1j). By contrast, optostimulation of granule neurons in lobule IX as the CS or of distinct types of control mice failed to induce motor learning (Fig. 1j and Extended Data Fig. 2c, d). Together, our data suggest that the ADCV is required and sufficient for associative learning in the delay tactile startle conditioning paradigm. Notably, optostimulation of granule neurons in lobule VI as the CS induced animals to move backward (Extended Data Fig. 2e), suggesting that activation of lobule VI is sufficient, though not essential, to trigger motor learning.
In other experiments, optostimulation of Purkinje cells in the ADCV, but not in lobule IX, as the US led to acquisition of conditioned startle responses (Fig. 1g, h, k). Collectively, our data suggest that cerebellar cortical circuits in the ADCV orchestrate delay tactile startle conditioning.
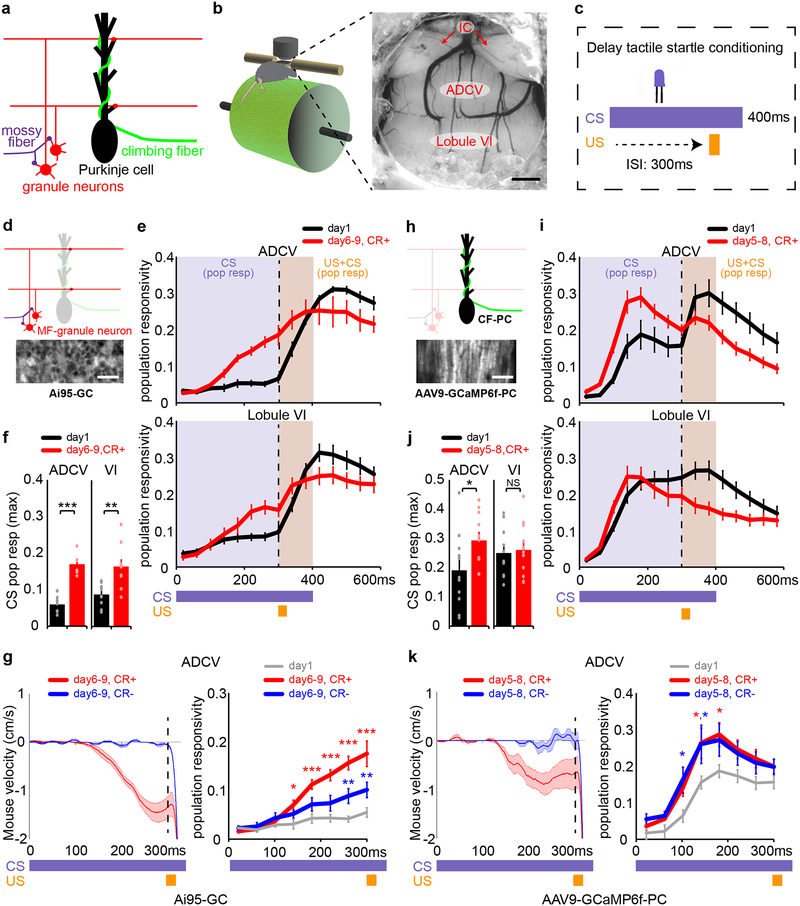
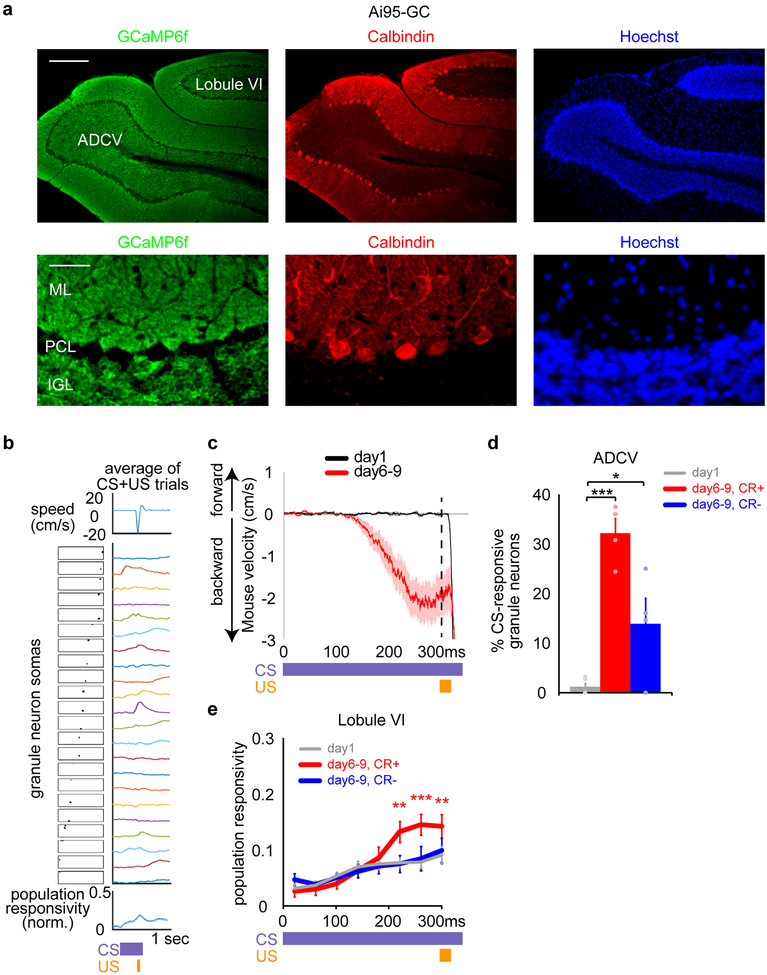
We next characterized how neural circuit activity in the ADCV evolves with learning (Fig. 2a). Granule neurons expressing the calcium indicator GCaMP6f10,11 were robustly activated in the ADCV in response to the CS in mice with motor learning, but not in naive mice (Fig. 2b–f and Extended Data Fig. 3a–c). CS-evoked granule neuron activity in the ADCV in trained mice was present in the presence or absence of expression of the conditioned response (Fig. 2f, g and Extended Data Fig. 3d). Granule neuron calcium transients were increased in lobule VI with motor learning, but only upon expression of the conditioned response (Fig. 2e, f and Extended Data Fig. 3e).
Fig. 2. Transformation of mossy fiber/granule neuron and climbing fiber/Purkinje cell neural coding in the anterior cerebellum during motor learning in mice.
(a) Schematic of glutamatergic brainstem projections to the cerebellum. (b, c) Head-fixed mice subjected to in vivo two-photon calcium imaging through a cranial window implanted over the anterior cerebellum (b, n=16 mice) during delay tactile startle conditioning (c). Scale bar: 500 μm, IC: inferior colliculus. (d-g) In vivo imaging of mossy fiber-driven granule neuron calcium activity in the anterior cerebellum of mice expressing GCaMP6f in granule neurons (Ai95-GC) (d, n=6 mice, scale bar: 20 μm). Population responsivity traces (e) and maximum CS-activated population responses (f, **P=0.0016,***P=1.3×10⁻⁵, two-tailed t-test) of granule neurons in the ADCV or lobule VI during delay tactile startle conditioning. The motor behavior of mice (g, left) and CS-activated population responsivity of granule neurons in the ADCV (g, right, *P<0.05,**P<0.01,***P<0.001, two-way repeated measures ANOVA with Dunnett’s post-hoc test) during trials with conditioned responses (CR+) or absent conditioned responses (CR-) after motor learning (in e-g, n=6,10 fields of view for ADCV,lobule VI in 6 mice). (h-k) In vivo imaging of climbing fiber-driven Purkinje cell dendrite calcium activity in anterior cerebellum of mice expressing GCaMP6f in Purkinje cells (AAV9-GCaMP6f-PC) (h, n=10 mice, scale bar: 100 μm). Population responsivity traces (i) and maximum CS-activated population responses (j, *P=0.042, two-tailed t-test) of Purkinje cell dendrites in the ADCV or lobule VI during delay tactile startle conditioning. The motor behavior of mice (k, left) and CS-activated population responsivity of Purkinje cell dendrites in the ADCV (k, right, *P<0.05, two-way repeated measures ANOVA with Dunnett’s post-hoc test) during trials with CR+ or CR- after motor learning (in i-k, n=11 fields of view in 10 mice). In all panels, data show mean and shading or error bars denote standard error.
Purkinje cell dendrites in the ADCV and lobule VI displayed calcium responses to the CS in naive mice, which were significantly enhanced in the ADCV, but not in lobule VI, upon motor learning (Fig. 2h–j and Extended Data Fig. 4). The increase in CS-dependent Purkinje cell calcium transients occurred independently of the conditioned response (Fig. 2j, k). Together, our data suggest that motor learning in the delay tactile startle paradigm triggers transformations in the CS-dependent neural code in granule neuron and Purkinje cell circuits specifically in the ADCV in adult mice.
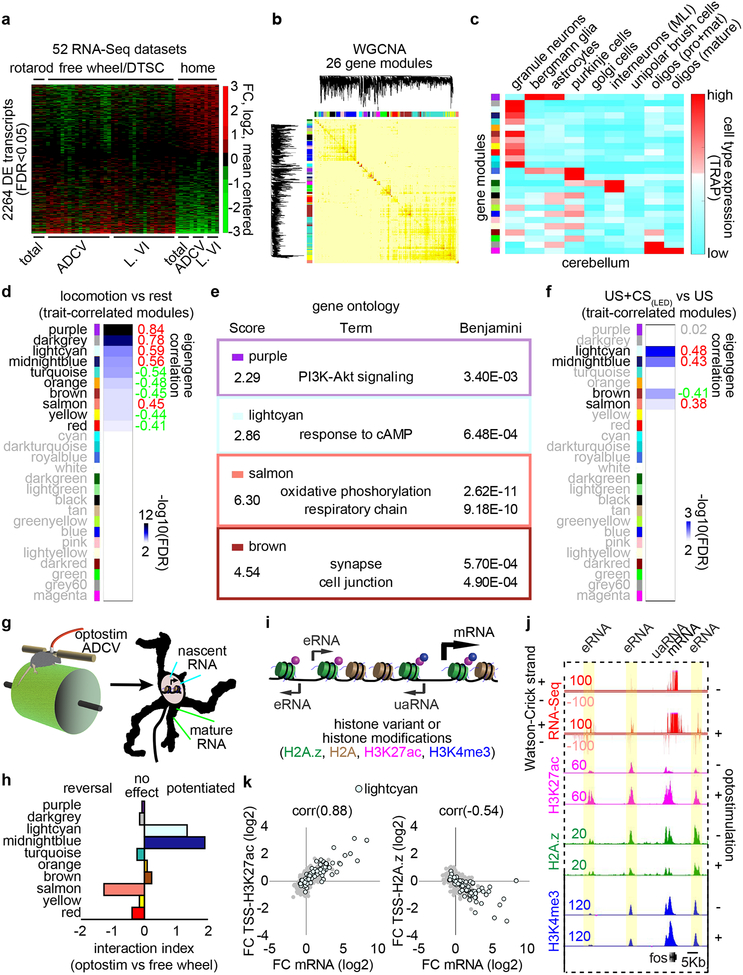
We next interrogated the molecular mechanisms underlying responses to neural circuit activation in the cerebellum during motor learning. In 52 RNA-Seq datasets, comparison of mice subjected to a battery of sensorimotor stimuli versus homecage control mice revealed over 2000 differentially expressed transcripts (Fig. 3a). A weighted gene co-expression network analysis (WGCNA)14 facilitated clustering of the adult cerebellar transcriptome into 26 distinct gene modules (Fig. 3b), which upon intersection with cerebellar cell type-specific expression data15,16, were enriched in granule neurons, Bergmann glia, Purkinje cells, molecular layer interneurons, or oligodendrocytes (Fig. 3c and Extended Data Fig. 5a).
Fig. 3. Sensorimotor stimulation triggers epigenetic regulation of cell type-enriched gene modules in the cerebellum in vivo.
(a) RNA from the cerebellum (total), ADCV, or lobule VI (L. VI) of adult mice undergoing forced rotarod locomotion, free wheel locomotion, delay tactile startle conditioning (DTSC), or homecage condition was subjected to RNA-Seq. A heatmap of significant differential gene expression induced by sensorimotor stimulation versus homecage condition (two-sided P-value from negative binomial distribution with Benjamini-Hochberg post-hoc test, n=52 biological samples, false discovery rate (FDR)<0.05, log2 mean centered). (b) Weighted gene co-expression network analysis (WGCNA) of the gene expression profiles in (a) and the heatmap of gene interconnectivity between modules. (c) Interrogation of gene modules identified in (b) using cell type-specific TRAP microarray data15. Molecular layer interneurons: MLI, progenitor: pro, mature: mat. (d) Correlation of the first principal component of gene modules (eigengene) with locomotion (n=40,12 biological samples for locomotion,rest). (e) Annotation of gene modules using DAVID (Fisher’s Exact test with Benjamini post-hoc test, n=118,93,98,452 transcripts for purple,lightcyan,salmon,brown). (f) Correlation of the eigengene with CS-activation in the delay tactile startle conditioning task (n=8 biological samples). (g) Optostimulation of ADCV granule neurons, followed by RNA-Seq of the chromatin bound fraction (nascent RNA) or nucleocytoplasmic fraction (mature RNA). (h) Effects of optostimulation of granule neurons compared with free wheel locomotion on gene module expression. (i) Transcripts and epigenetic regulation at enhancers and gene promoters. (j) A UCSC genome browser track at the fos locus. (k) Comparison of the log2 fold change of mRNA expression with the log2 fold change of enrichment of H3K27ac (left) or H2A.z (right) at TSSs of lightcyan module genes upon optostimulation of granule neurons. Pearson correlation coefficient (corr) is shown (n=79 transcripts). In d, f, correlation P-value with Storey post-hoc test.
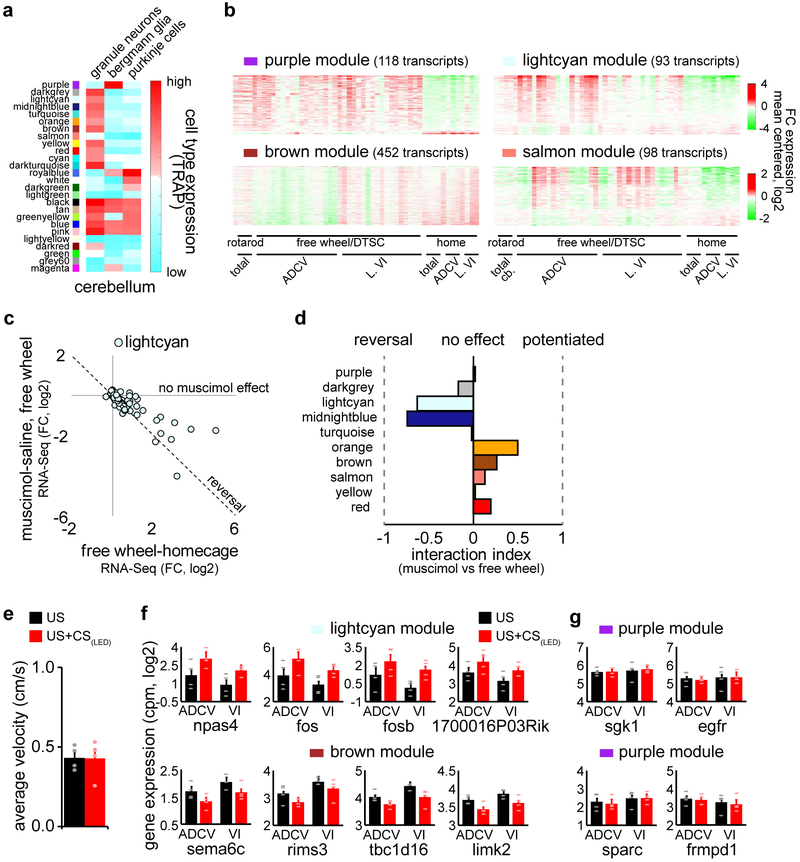
Sensorimotor stimuli regulated the expression of 10 gene modules enriched in granule neurons and Bergmann glia (Fig. 3d and Extended Data Fig. 5b), including genes encoding immediate early transcription factors and cAMP-regulated signaling proteins (lightcyan), synaptic proteins (brown), and oxidative phosphorylation proteins (salmon) in granule neurons (Fig. 3e). Silencing of ADCV cortical activity with muscimol reversed the locomotion-induced gene expression changes in the lightcyan and midnightblue modules (Extended Data Fig. 5c, d). Importantly, the conditioned stimulus (CS) in the delay tactile startle conditioning task activated the lightcyan, midnightblue, and salmon modules and repressed the brown gene module (Fig. 3f and Extended Data Fig. 5e–g).
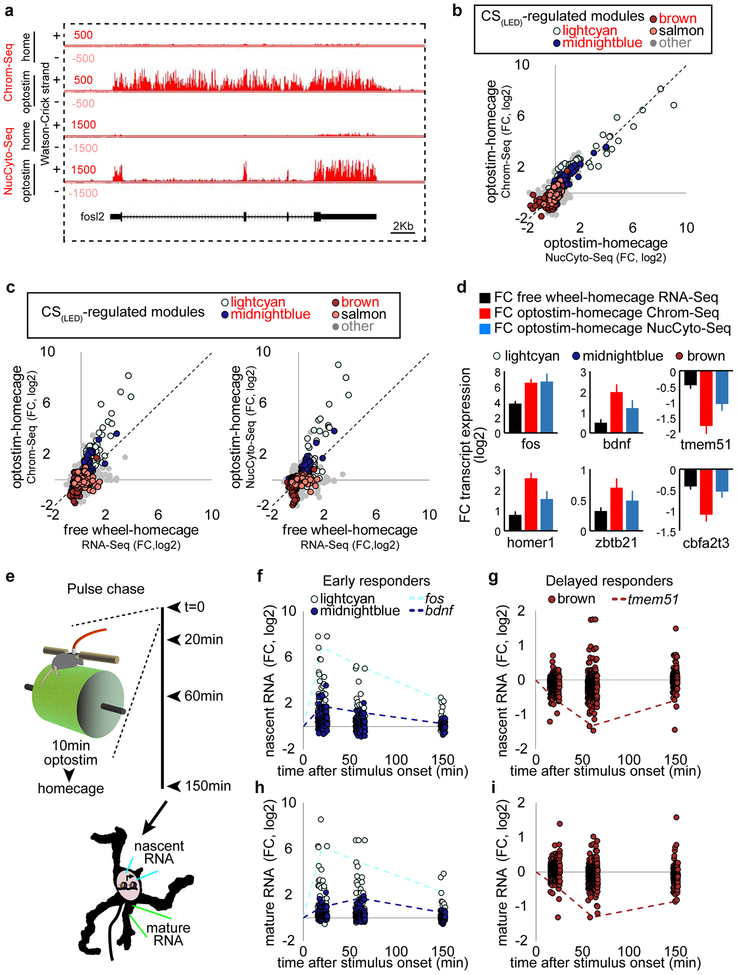
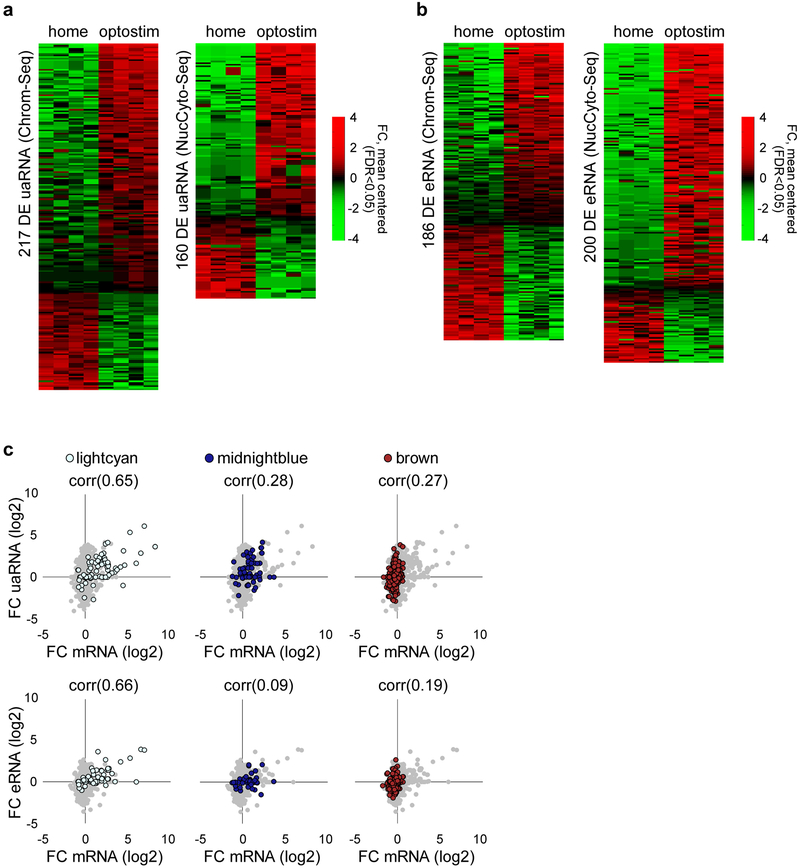
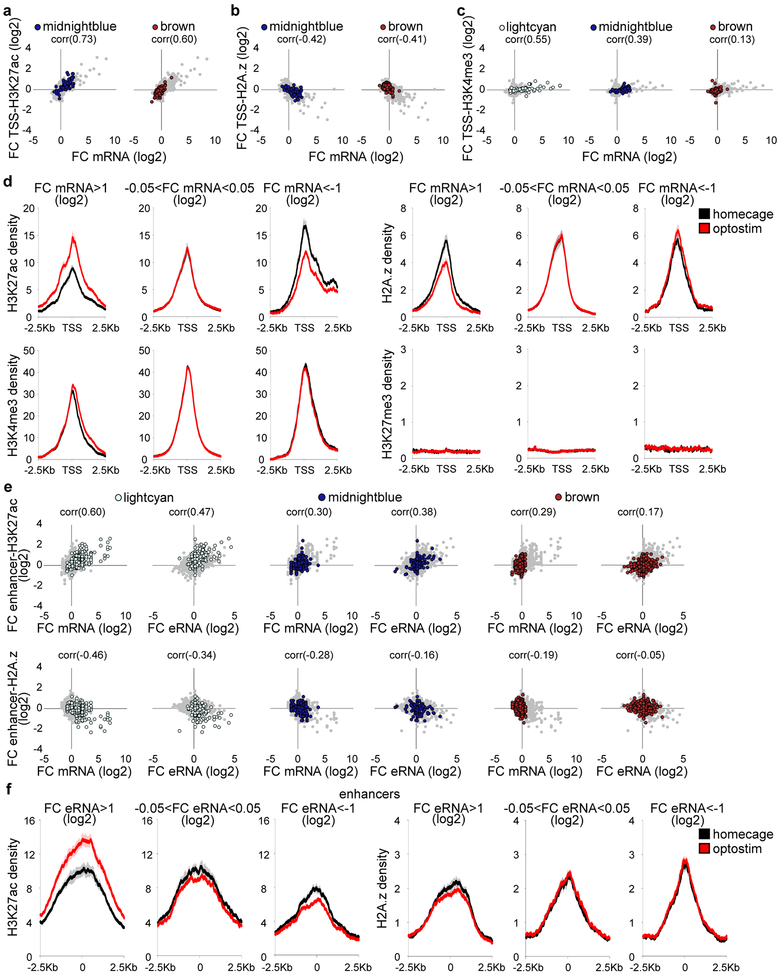
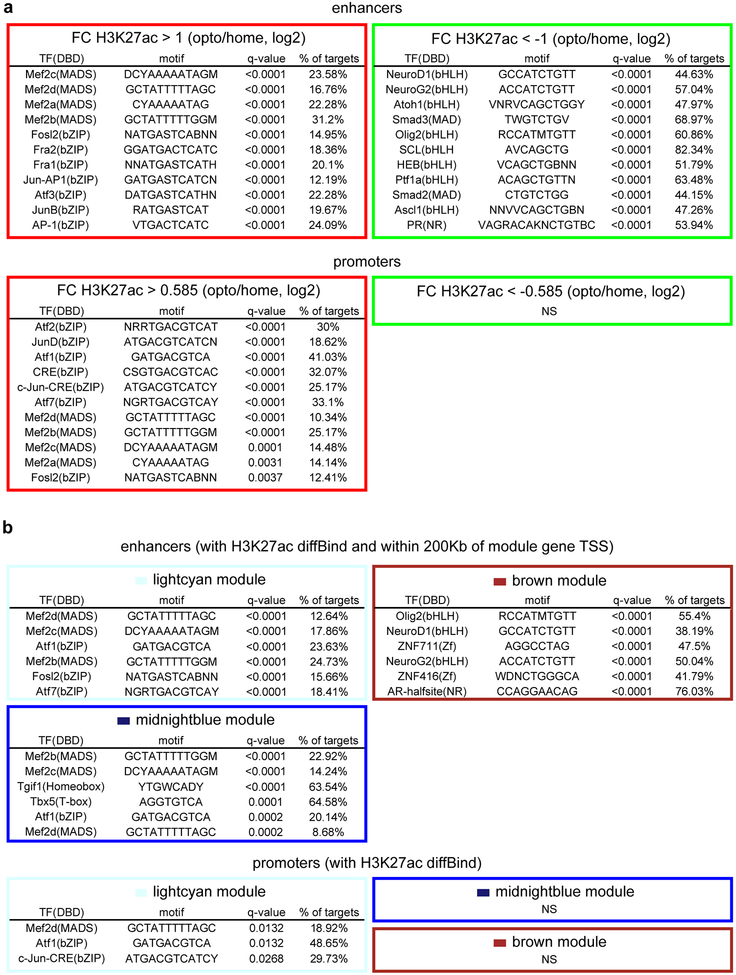
Direct optostimulation of the granule neuron CS pathway in the ADCV rapidly activated the lightcyan and midnightblue modules and repressed the brown module (Fig. 3g, h and Extended Data Fig. 6). Optostimulation of granule neurons also modulated expression of enhancer RNA (eRNA) and upstream antisense RNA (uaRNA) nearby CS-regulated genes (Fig. 3i, j and Extended Data Fig. 7). In vivo optostimulation of granule neurons in the ADCV followed by ChIP-Seq analyses revealed that H3K27ac enrichment at promoters and enhancers of CS-regulated gene modules positively correlated and H2A.z enrichment at promoters inversely correlated with gene expression upon activation of the CS pathway (Fig. 3i–k and Extended Data Fig. 8). The histone marks H3K4me3 and H3K27me3 exhibited little or no change at CS-regulated gene promoters in response to optostimulation of granule neurons (Fig. 3j and Extended Data Fig. 8c, d). The promoters and enhancers of CS-regulated granule neuron module genes were enriched with distinct activity-dependent transcription factor-binding motifs (Extended Data Fig. 9). Taken together, our results demonstrate that activation of the granule neuron CS pathway triggers distinct epigenetic mechanisms in the ADCV of adult mice in vivo.
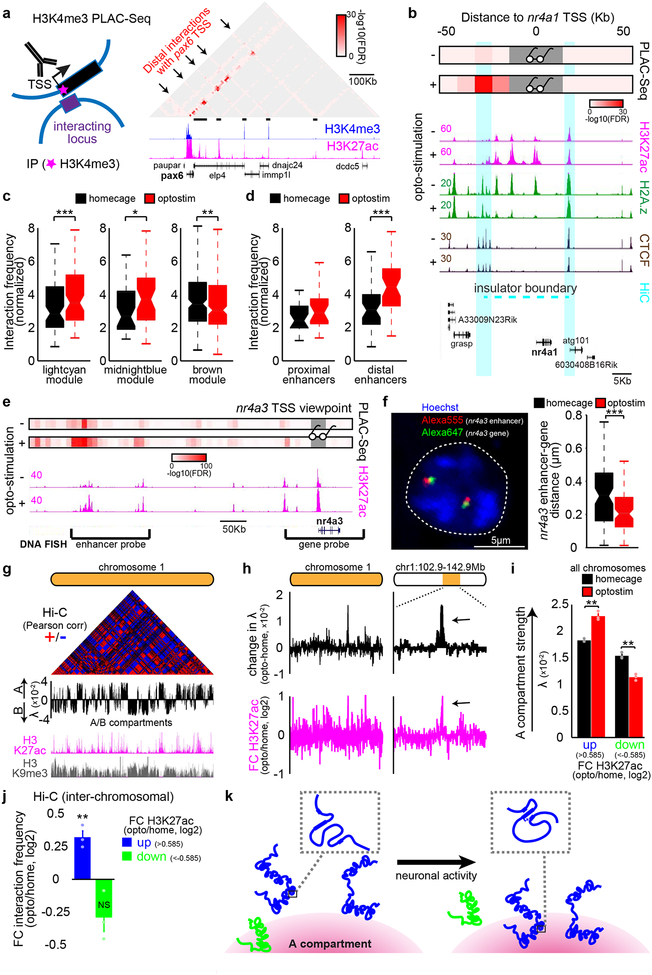
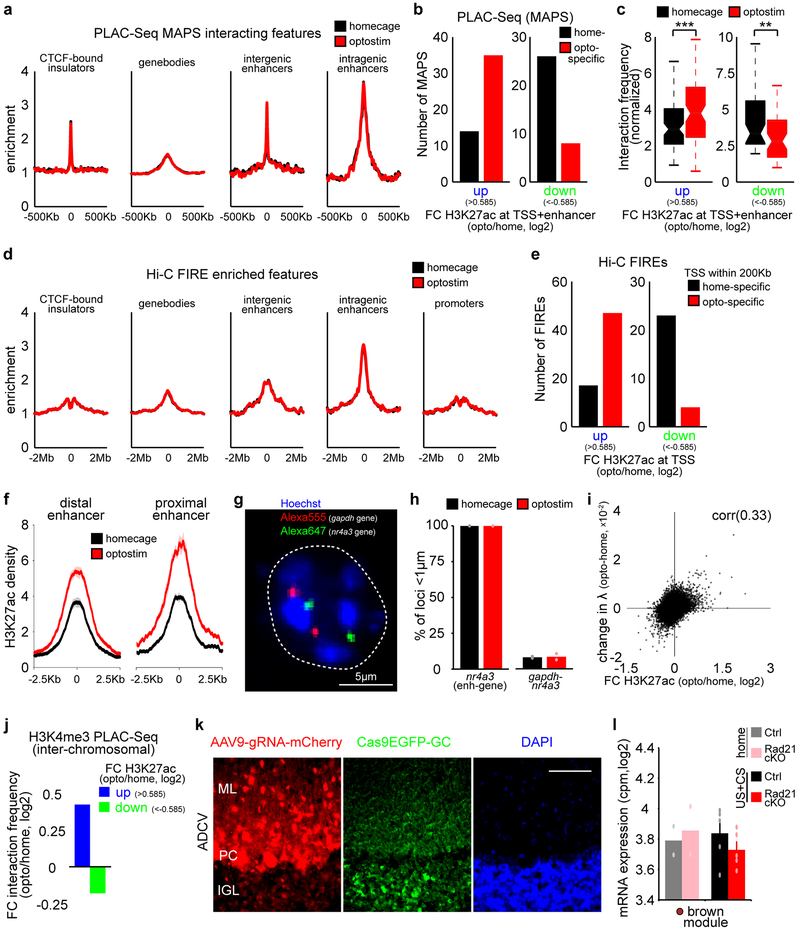
To detemine if the three-dimensional organization of chromatin architecture might be regulated in a dynamic manner in the brain, we employed in situ chromosome conformation capture with high-throughput sequencing (Hi-C) and proximity ligation-assisted ChIP-Seq (PLAC-Seq), the latter to enrich for promoter-centric interactions at H3K4me3-marked promoters17,18 (Fig. 4a). Model-based analysis of long-range chromatin interactions from PLAC-Seq (MAPS)19 identified 22,430 long-distance promoter-centric interactions in optostimulated and control mice, enriched for regulatory regions of the genome marked by H3K27ac or CTCF occupancy (Extended Data Fig. 10a). At the locus of the activity-dependent gene nr4a1, promoter interactions with enhancers within ~30Kb upstream from the TSS and in particular with the distal ~30Kb enhancer increased upon granule neuron activation (Fig. 4b). In genome-wide analyses, enhancer-promoter interactions at the CS-induced lightcyan and midnightblue module genes were increased and in particular with distal enhancers, whereas enhancer-promoter interactions were reduced in the CS-repressed brown gene module in the ADCV upon optostimulation (Fig. 4c, d). Enhancer-promoter interactions correlated with the levels of H3K27ac at gene promoters, but not with the levels of H3K27ac at proximal versus distal enhancers, upon optostimulation of ADCV granule neurons in adult mice (Extended Data Fig. 10b–f).
Fig. 4. Activation of granule neuron CS pathway promotes enhancer-promoter interactions and compartmentalization in vivo.
(a) Schematic of proximity ligation-assisted ChIP-Seq (PLAC-Seq) (left). A MAPS-normalized contact map at the pax6 gene locus in the ADCV (right). (b) Promoter-centric interactions at the nr4a1 locus at 10Kb resolution upon optostimulation of ADCV granule neurons. Glasses indicate viewpoint. (c, d) CS-regulated promoter interactions with enhancers (c, *P=0.014,**P=0.0035,***P=0.00043, two-sided Wilcoxon signed rank test, n=77,39,174 enhancer-promoters for lightcyan,midnightblue,brown) or activated promoter interactions with distal or proximal enhancers (d, ***P=0.00057, two-sided Wilcoxon signed rank test, n=22,38 multienhancer-promoters for proximal,distal) upon optostimulation of granule neurons. (e, f) Promoter-centric interactions at the nr4a3 locus and DNA FISH probes recognizing the distal nr4a3 enhancers and nr4a3 gene together with the DNA dye Hoechst (e, f, left, n=169 nuclei). Distance between the nr4a3 enhancers and gene upon optostimulation of granule neurons (f, right, ***P=0.00060, two-sided Mann-Whitney-Wilcoxon test, n=85,84 nuclei for homecage,optostim). (g) Genome organization of A/B compartments in chromosome 1 using the Pearson correlation matrix or first eigenvector (λ) of Hi-C contacts. (h) Change in compartment strength (λ) and H3K27ac levels along chromosome 1 upon optostimulation of granule neurons. (i) Compartment strength at genomic loci with changes in H3K27ac levels upon optostimulation of granule neurons (**P=0.0018,0.0023 for up,down, one-way ANOVA with Bonferroni post-hoc test). (j) Inter-chromosomal normalized interaction frequency between genomic loci with changes in H3K27ac levels (**P=0.0056, one-way ANOVA with Bonferroni post-hoc test). (k) A model of activity-dependent regulation of chromatin architecture at activated (blue) or repressed (green) genomic loci. In a, b, e, one-sided P-value from zero-truncated Poisson distribution with Benjamini-Hochberg post-hoc test. In a-f, n=2 biological replicates. In c, d, f, box plots show median, quartiles (box) and range (whiskers). In g-j, n=3 biological replicates. In i, j, data show mean ± standard error.
Consistently with PLAC-Seq analyses, DNA fluorescence in situ hybridization (FISH) analyses using probes targeting the nr4a3 gene and its distal enhancer located 500Kb upsteam revealed that the distance between the nr4a3 enhancer and the nr4a3 gene was reduced upon optostimulation (Fig. 4e, f and Extended Data Fig. 10g, h). Together, these data suggest that activation of the granule neuron CS pathway strengthens long distance enhancer-promoter interactions and tightly co-regulates enhancer-promoter interactions and gene transcription in vivo.
Genomic loci with increased H3K27ac levels in the ADCV upon optostimulation had enhanced association with transcriptionally active (A) compartments (Fig. 4g–i and Extended Data Fig. 10i). However, genes with decreased H3K27ac levels had reduced association with active (A) compartments (Fig. 4i and Extended Data Fig. 10i). Interaction frequencies of genomic loci across chromosomes was also augmented with increased H3K27ac in optostimulated ADCV granule neurons (Fig. 4j and Extended Data Fig. 10j). These results suggest that activated genes might be recruited to active transcriptional compartments to achieve efficient gene expression upon activation of the CS pathway in vivo (Fig. 4k).
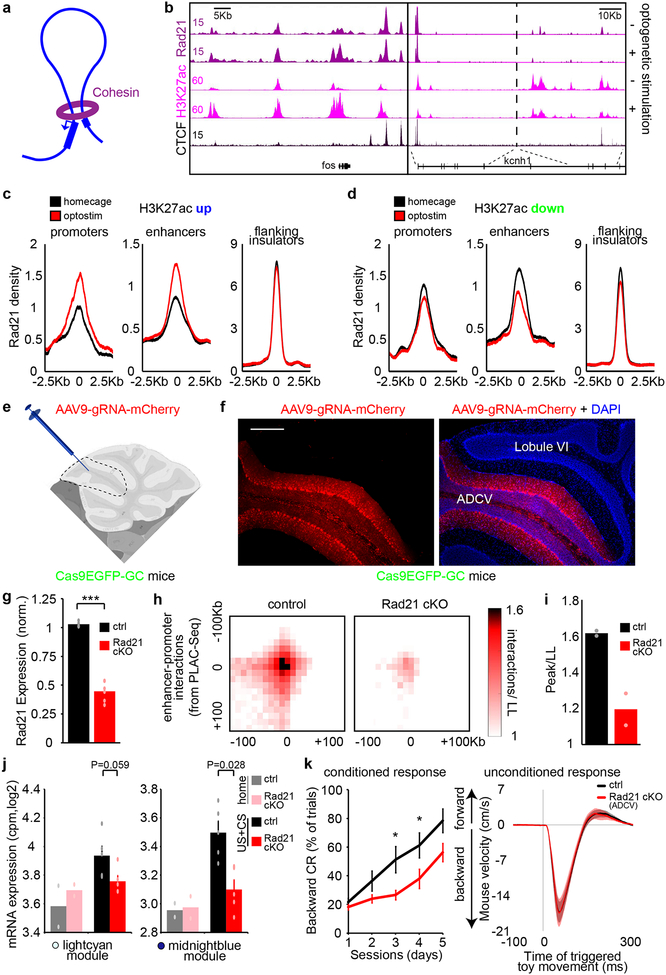
We next characterized mechanisms underlying activity-dependent chromatin architecture remodeling in vivo and its role in motor learning. The protein complex Cohesin is required in loop formation20 (Fig. 5a), but its role in the brain has remained largely unexplored. The occupancy of the core Cohesin subunit Rad21 at enhancers and promoters correlated with changes in H3K27 acetylation enrichment in the ADCV upon optostimulation (Fig. 5b–d). We employed a conditional CRISPR approach to induce knockout of Rad21 in ADCV granule neurons in adult mice (Fig. 5e–g and Extended Data Fig. 10k), bypassing developmental effects of Cohesin inactivation21. Strikingly, Rad21 knockout significantly reduced enhancer-promoter interactions in the ADCV of mice undergoing delay tactile startle learning (Fig. 5h, i). Rad21 knockout attenuated induction of the midnightblue gene module in the ADCV upon delay tactile startle conditioning (Fig. 5j and Extended Data Fig. 10l). Accordingly, Rad21 knockout in ADCV granule neurons significantly impaired acquisition of the conditioned startle response in mice (Fig 5k). Collectively, these results suggest that Cohesin-dependent reorganization of chromatin architecture and activation of transcription plays a critical role in associative motor learning in mice.
Fig. 5. The core Cohesin subunit Rad21 is required for activity-dependent transcription and motor learning in mice.
(a) Cohesin is a chromatin architectural protein that regulates enhancer-promoter interactions. (b) UCSC genome browser tracks at the fos or kcnh1 locus. (c, d) Profiles of Rad21 density at promoters (left), enhancers (middle) or flanking CTCF-bound insulators (right) of genes with increased H3K27ac (c) or reduced H3K27ac (d) upon optostimulation of granule neurons. (e, f) Schematic of AAV delivery approach to knockout Rad21 in ADCV granule neurons (e); an mCherry labeled cerebellum from adult mice expressing Cas9 in granule neurons (f, n=25 mice). Scale bar: 200 μm. (g) Conditional CRISPR knockout of Rad21 in ADCV granule neurons in adult mice significantly downregulated Rad21 mRNA levels in the ADCV, normalized to levels in lobule IX (***P=4.7×10⁻⁶, two-tailed t-test, n=4,6 mice for ctrl,Rad21cKO). (h, i) Aggregate peak analysis17 of enhancer-promoter interactions identified using MAPS analyses of PLAC-Seq data. HiC interactions are normalized to the mean interactions in the lower-left (LL) corner. Heatmaps of the 200Kb surrounding region (h) and barplots of the peak 10Kb bin normalized to the LL bins (i) upon conditional CRISPR knockout of Rad21 in ADCV granule neurons (n=2 biological replicates). (j) The ADCV of conditional CRISPR Rad21 knockout or control mice undergoing delay tactile startle conditioning or the homecage control condition was dissected and subjected to RNA-Seq analyses (Mann-Whitney-Wilcoxon test, n=2,2,5,5 mice for home-ctrl,home-Rad21cKO,US+CS-ctrl,US+CS-Rad21cKO). (k) Performance of conditional CRISPR Rad21 knockout or control animals in delay tactile startle conditioning (*P=0.025,0.040 for day3,day4, two-way repeated measures ANOVA with Sidak’s post-hoc test, n=10,11 mice for ctrl,Rad21cKO). In all panels, data show mean and shading or error bars denote standard error.
In this study, we define how sensory experience transduced via a granule neuron pathway triggers dynamic remodeling of chromatin architecture and neural circuit activity in the ADCV of the adult mouse brain to orchestrate motor learning. Our study provides novel insights into the chromatin mechanisms engaged by sensory experience that induce neural code transformations in mice. Furthermore, the finding of activity-dependent chromatin reorganization specifically in granule neurons highlights the key role of granule neurons per se in learning and memory.
Methods
Animals
Rodents were purchased or maintained under pathogen-free conditions. All animal experiments were done according to protocols approved by the Animal Studies Committee of Washington University School of Medicine in accordance with the National Institutes of Health guidelines. GABA(A)Rα6-Cre mice have been described10. Math1-Cre, Pcp2-Cre, lsl-GCaMP6f (Ai95), lsl-ChR2(H134R)-YFP (Ai32), lsl-ArchT-EGFP (Ai40), and lsl-Cas9-EGFP mice were purchased from Jackson laboratory11–13,22. Ai40 mice were bred with GABA(A)Rα6-Cre driver mice to generate Ai40-GC mice. Ai32 mice were bred with Math1-Cre or Pcp2-Cre driver mice to generate Ai32-GC or Ai32-PC mice, respectively. Ai95 mice were bred with GABA(A)Rα6-Cre driver mice to generate Ai95-GC mice. Lsl-Cas9-EGFP mice were bred with GABA(A)Rα6-Cre driver mice to generate Cas9EGFP-GC mice. Both male and female mice were used. All mice were allocated into sex-matched, littermate-matched experimental groups. Investigators were not blinded to allocation during experiments and outcome assessment.
Antibodies
Antibodies to histone H3K4me3 (Abcam ab8580), histone H3K27ac (Abcam ab4729), histone H2A.z (Abcam ab4174), histone H3K27me3 (Abcam ab6002), CTCF (Millipore 07–729), Rad21 (Abcam ab992), Calbindin (Millipore AB1778), GFP (Abcam ab13970), and DsRed (Clontech 632496) were purchased.
Surgeries
For all surgeries, mouse pups (P11) or adults (5–7 week-old) were anesthetized with isoflurane (5% induction, 1–2% maintenance) or ketamine/xylazine (100/10 mg/kg intraperitoneal). Dexamethasone (2 mg/kg intramuscular), carprofen (5 mg/kg subcutaneous), and buprenorphine-SR (0.5–1.0 mg/kg subcutaneous) were administrated to minimize swelling of the brain and inflammation and to provide analgesia before the surgery. During surgery, lidocaine/epinephrine solution was applied to reduce bleeding and to provide local analgesia. After surgery, saline solution (37C, 0.3–0.5 ml subcutaneous) and carprofen (5 mg/kg subcutaneous) were given to replenish the animal’s fluids and to minimize inflammation, respectively. The head was shaved from the frontal bone to the occipital bone and eye ointment was applied. The surgical area was sterilized by wiping the skin with three alternating swipes of 70% ethanol and betadine.
For headplate implantation, the scalp overlaying the skull was removed. Under a surgical microscope, the fascia was removed, the skull surface was dried, and a custom head plate as described5 was placed over the skull bregma and secured with a screw using Metabond cement (Parkell).
For cranial window implantation, a 3 mm cranial window was created over the region of interest of the cerebellum using a Microtorque controller and drill (Ram Products). A drop of saline solution was applied over the dura and a 3 mm glass cranial window consisting of a 5 mm coverslip cured to two 3 mm coverslips was implanted on top of the dura as described23. The coverslip stack was secured in place using cyanoacrylate and dental cement (Ortho-Jet powder, Lang) mixed with carbon (484164, Sigma). A custom metal ring for in vivo imaging was positioned over and attached to the cranial window.
For cannula implantation, the animal was placed in a stereotaxic device (Stoelting). A 0.8 mm hole in the skull over the anterior cerebellum was drilled and a guide cannula projecting 1.0 mm below skull surface (PlasticsOne) or a mono fiber-optic cannula projecting 0.5 mm below skull surface (0.22 NA, 200μm core, Doric Lenses) was stereotaxically implanted. The cannula was secured to the skull using Metabond cement (Parkell).
For viral delivery in mice, a 0.8 mm hole in the skull was drilled over the anterior cerebellum. AAV9-FLEx-GCaMP6f was delivered to the boundary between ADCV and lobule VI in P11 Pcp2-Cre mouse pups. AAV9-gRNA-mCherry was delivered to the ADCV of 4–7 week-old Cas9EGFP-GC mice. A fine glass pipette connected to a microinjector system (Nanoinject II, Drummond) and mounted in the stereotaxic frame (Stoelting) was used for injections. 1 μl of AAV9-FLEx-GCaMP6f was injected 0.5–0.7 mm below the dura surface in the cerebellum over 3 minutes. 0.5 μl of AAV9-gRNA-mCherry was injected at three different depths (0.2–0.4–0.7 mm) below the dura surface. Rad21 gRNA target sequence: ATGCTTCATTACAGTCTGCG. The scalp was sutured and sealed with tissue glue (Vetbond).
Delay Tactile Startle Conditioning
For delay tactile startle conditioning, 6–8 week-old littermate mice were used. At least 5 days following recovery from surgery, head-fixed mice were habituated on a cylindrical treadmill for a 30-minute session. One to three days later, mice were tested with delay tactile startle conditioning in a dark enclosure and noise restricted room. Mice learned to elicit a startle (backward) movement in response to an initially neutral conditioned stimulus (CS; blue LED, Sparkfun) that was paired with a startle-eliciting unconditioned stimulus (US, 20 ms tactile stimulus on the nose by a rat or fox plush toy (Amazon) that was secured on a motorized wheel (Sparkfun); CS-US inter-stimulus interval, 150 to 300 ms). 80 trials of CS and US pairing were performed each day for five to ten days, and the mouse locomotion was tracked using a rotary encoder coupled to the cylindrical treadmill. Trials were triggered using an Arduino Due board, and rotary encoder signals were recorded with a Digidata 1440A Digitizer (Molecular Devices), High-speed Data Acquisition (DI-2108, Dataq Instruments), or Prairie View Imaging system (Bruker) synchronized to the visual and tactile stimuli. Mouse velocity and direction of movement were calculated based on changes in angular position and diameter of the treadmill. A backward startle movement during the ISI period was defined as a conditioned response (CR). The threshold for detecting mouse movements was set to any detectable turn in the rotary encoder (resolution: 1024 pulse per rotation). The percentage of trials during each session containing CRs was used as the index of motor learning. In Fig. 1, CRs were calculated from all trials, while in Fig. 2, plots were separated into CR+ and CR- trials. An ISI of 150 ms triggered the fastest acquisition of CRs in mice (~80% at day 5), and was therefore used for the majority of behavioral experiments (Fig. 1c–f, 1i, 1k, 3a–f, and 5k).
For pharmacological inactivation, 6–8 week-old mice received daily 1 μl injections of muscimol (1 mM, Cayman Chemical) as previously described24 or saline using a Hamilton syringe (23g/0.5”/style 3) connected to an internal cannula that protrudes 0.3 mm beyond the tip of the guide cannula. Mice were subjected to delay tactile startle conditioning one hour after injection. A dummy cannula was inserted between injections. One day after the last session, 1 μl of fluorescent muscimol (1 mM, BODIPY TMR-X muscimol conjugate, Thermofisher Scientific) was injected through the guide cannula to identify the targeted area24.
For biochemical analyses, 6–8 week-old mice were subjected to 40 minutes of delay tactile startle conditioning, 40 minutes of free wheel locomotion, 1 hour of forced rotarod locomotion, or homecage condition and the cerebellum was microdissected and subjected to RNA-Seq analyses.
For CRISPR mouse genetics, mice were subjected to delay tactile startle conditioning four weeks after viral injection.
DigiGait analysis
Gait dynamics were evaluated in 9–12 week-old mice using the DigiGait imaging system (mouse Specifics Inc, MA, USA) one hour after delivery of 1 μl muscimol (1 mM) or the saline control vehicle into the ADCV. Mice were placed on a motorized transparent treadmill moving at a constant speed of 20 cm/s and required to run. Approximately 5 seconds of digital video of paw placement was collected to provide adequate number of sequential strides for quantification of several gait variables as stride, stance, and swing.
Immunohistochemistry
Mice were fixed with 4% PFA and 4% sucrose and labeled with the relevant antibodies. Images were taken using a NIKON eclipse TE2000 epifluorescence microscope using a digital CCD camera (DIAGNOSTIC instruments).
Optogenetic stimulation or silencing
For optogenetic stimulation (optostimulation) or silencing of granule neurons in the cerebellum, 6–8 week-old Ai32-GC or Ai40-GC mice were used. Mice implanted with a fiber optic cannula were stimulated with a 473nm or 532nm DPSS laser (Shanghai Laser & Optics Century) coupled to an acousto-optic modulator (Quanta Tech). Ai32-GC mice were photoactivated with a 100 ms optogenetic stimulus composed of a 50 Hz train of 10 ms pulses and using 1 to 72 mW of laser power at the tip of the fiber. Ai40-GC mice were photoinhibited with a 250 ms optogenetic stimulus using ~60 mW laser power. For optogenetically-triggered delay tactile startle conditioning, mice were subjected to 80 trials of paired optostimulation (CS) and tactile stimulation (US). In Ai32-GC mice, low laser power (1 to 4 mW) was used during motor learning to avoid optogenetic-evoked movements in naive mice. An ISI of 50 ms was used to prevent the optogenetic stimulus from acting as a visual CS.
For optostimulation of Purkinje cells, 7–12 week-old Ai32-PC mice were used. Mice implanted with a fiber optic cannula were photoactivated with a single 10 ms pulse to match complex spike duration25, using ~20 mW of laser power at the tip of the fiber.
For biochemical analyses, ADCV of Ai32-GC mice subjected to 40 minutes (80–100 trials) of optostimulation was microdissected and subjected to RNA-Seq, ChIP-Seq, Hi-C, or PLAC-Seq analyses. For pulse-chase experiments, mice were subjected to 10 minutes (40 trials) of optostimulation and returned to their homecage for an additional 10, 50, or 140 minutes. ADCV was microdissected and subjected to RNA-Seq analyses.
Electrophysiology
Acute 250 μm sagittal slices were prepared from the cerebellum of 4 week-old Ai32-GC mice as described with modifications26. 20 μM picrotoxin was added to the bath artificial cerebrospinal fluid recording solution to block inhibitory currents. Electrophysiological signals were acquired with a Multiclamp 700B amplifier, digitized at 10 kHz with a Digidata 1440A D-A converter, and Bessel filtered at 2 kHz. Whole-cell current-clamp recordings in granule neurons were obtained with recording electrodes (5–8 MΩ) filled with intracellular solution containing 125 mM K-gluconate, 15 mM KCl, 10 mM HEPES, 0.5 mM EGTA, 2 mM MgCl2, 2 mM Na-ATP, and 0.5 mM Na-GTP. Granule neurons were optostimulated through a 20x objective using 100 ms stimuli, each composed of 50 Hz trains of 10 ms pulses of 470 nm light (Sutter Lambda DG-4 high speed wavelength switcher with 300W Xenon lamp, 0.9 mW after the objective) and granule neuron responses were recorded.
Two-photon calcium imaging
Calcium imaging was performed on a Bruker multiphoton system equipped with Ti:Sapphire lasers (MaiTai HP or eHP DeepSee, Spectra-Physics), 10x or 20x water immersion objective (NA 0.3 or 1.0, respectively; Olympus, Center Valley, PA, USA), and multi-alkali PMTs (Hamamatsu, R3896). Images were acquired at 25 Hz (4 μs dwell time) with the laser tuned to 920 nm. Laser power (20–100 mW after the objective) was controlled with Pockels cells (Conoptics). 6–8 week-old head-fixed mice were subjected to delay tactile startle conditioning using a UV LED (SuperBrightLEDs, 380nm to avoid spectral overlap with GCaMP6f) and motorized plush toy tactile stimulus, and the rotary encoder signal was synchronized to the image acquisition. A black balloon was fitted over the microscope objective and metal ring above the mouse cranial window to block LED light from entering the objective. To visualize granule neuron calcium signals, Ai95-GC mice were used. To visualize Purkinje cell calcium signals, Pcp2-Cre mice were injected with AAV9-FLEx-GCaMP6f (Penn Vector Core)27. The identity of granule cell somas was confirmed by their morphology (~5–10 μm somas) and location beneath the molecular and Purkinje cell layers. Purkinje cell dendrites were confirmed by their superficial localization in the molecular layer, widespread climbing fiber-driven activation, and firing patterns (~1 Hz). A typical imaging window was 200 × 100 pixels (2.29 μm per pixel, granule neurons; 4.62 μm per pixel, Purkinje cell dendrites) and 1–3 fields of view were imaged for each mouse. An average of 20 granule neuron somas and 69 Purkinje cell dendrites was acquired for each lobule in each mouse. Each field of view was imaged for ten trials of delay tactile startle conditioning (1 second trial duration, randomized 15–30 seconds inter-trial interval), and for Purkinje cell dendrites an additional 60 seconds of imaging was performed as mice were freely locomoting on the treadmill. The Prairie View imaging software (Bruker) and Arduino Due board were used to synchronize image acquisition with trials. An ISI of 300 ms (i.e. the equivalent of 7 imaged frames) was used to distinguish the CS- and US- evoked calcium signals in delay tactile startle conditioning.
Calcium imaging analyses
Calcium imaging analyses were performed using custom MATLAB scripts. Images were subjected to registration using whole-frame cross-correlation and auto cell-segmentation using principal component analysis and spatio-temporal independent component analysis28,29. For each neuron, fluorescence signals were background subtracted using the bottom 20th percentile, normalized to the maximum response across the entire recording, and then averaged across ten trials of delay tactile startle conditioning. The population responsivity was calculated using the average normalized neuronal response per field of view. To calculate the percentage of CS-responsive neurons, neurons were considered active if the normalized neuronal response during the CS-US inter-stimulus interval subtracted by the response during the pre-CS baseline period was greater than 0.2.
Anatomic reference atlas
Sagittal and coronal reference atlases of the cerebellum were obtained from the Allen Mouse Brain Atlas30.
Statistics
Statistical analyses for behavior and qPCR analyses were done using GraphPad Prism 6.0, Microsoft Excel, or R. Normality of data was assessed using Shapiro-Wilk test. For experiments in which only two groups were analyzed, the t-test was used for normal distributions. For two groups with non-normal distributions, the Mann-Whitney-Wilcoxon test (unpaired data) or Wilcoxon signed rank test (paired data) was used. Comparisons within multiple groups were done by analysis of variance (ANOVA) followed by post-hoc testing, including Dunnett’s method to compare every mean with a control mean, Sidak method for selected sets of means to compare when independence can be assumed, and Bonferroni method for selected sets of means to compare when independence cannot be assumed.
For delay tactile startle conditioning, the last session of the conditioning paradigm was used for statistical comparisons, except in Fig. 5k, where all sessions were considered.
RNA-Seq
Total RNA was extracted from cerebellum, ADCV, or lobule VI of 6–8 week-old mice using Trizol (Thermo Fisher Scientific) according to the manufacturer’s instructions. ~100 ng of RNA was treated with NEBNext rRNA Depletion Kit (New England Biolabs).
For chromatin or nucleocytoplasmic fractionation, tissues were homogenized in lysis buffer (50 mM Tris-HCl pH 8.0, 150 mM NaCl, 1% Triton-X, RNaseOUT (Thermo Fisher Scientific)) using a syringe and incubated on ice for 10 minutes. After spinning down, the RNA in the supernatant (nucleocytoplasmic fraction) was extracted with Trizol LS (Thermo Fisher Scientific). RNA in the pellet (chromatin fraction) was extracted with Trizol (Thermo Fisher Scientific). ~100 ng of RNA from the nucleocytoplasmic fraction and 10 ng of RNA from the chromatin fraction were treated with NEBNext rRNA Depletion Kit (New England Biolabs).
RNA-Seq was performed using libraries prepared with NEBNext Ultra™ Directional RNA Library Prep Kit for Illumina (New England Biolabs) and sequenced on the Illumina NextSeq 500 platform to obtain 36bp paired-end reads. Two to four biological RNA-Seq replicates were performed in all experiments.
ChIP-Seq
ChIP-Seq assays were performed as described with modifications5,26. ADCV microdissected from two 6–8 week-old mice was fixed with 1.1% formaldehyde solution and pooled for each condition. Immunoprecipitation was performed in RIPA buffer (10 mM Tris-HCl pH 8.0, 140 mM NaCl, 0.1% SDS, 1% Triton-X, 0.1% DOC, 1 mM EDTA, 0.5 mM EGTA) using the indicated antibodies with dynabeads protein G (Thermo Fisher Scientific). ChIP-Seq was performed using libraries prepared with the NEBNext Ultra™ II DNA Library Prep Kit for Illumina (New England Biolabs) as per the manufacturer’s instructions and sequenced on the Illumina NextSeq 500 platform to obtain 36bp paired-end reads. Two to four biological ChIP-Seq replicates were performed in all experiments.
DHS sequencing
DHS assays were performed as described with modifications31. The cerebellum was dissected and homogenized with the nuclei isolation buffer (20 mM MOPS, 40 mM NaCl, 90 mM KCl, 2 mM EDTA, 0.5 mM EGTA, 0.5 mM spermidine, 0.2 mM spermine). Lysate was filtered with 70 μm nylon filter, mixed with 2 M sucrose (final 1.74 M) and spun down with ultracentrifugation at 23,000 rpm for 1 hour using SW40T rotor (Beckman). The number of isolated nuclei was counted and nuclei were treated with 20 U of DNase I (5×10⁶ of nuclei/0.5 ml) for 3 minutes at 37C with the reaction buffer (60 mM CaCl2, 750 mM NaCl). The reaction was stopped by adding stop buffer (50 mM Tris-HCl, 100 mM NaCl, 0.1% SDS, 100 mK EDTA, 1 mM spermidine, 0.3 mM spermine) containing proteinase K (50 mg/ml) and incubated at 55C for 1 hour. Solutions were treated with RNase A at 37C for 30 minutes and gently mixed with phenol/chloroform solution. After spinning down, supernatants were fractionated with a sucrose cushion containing 10, 20, 30 and 40% (w/v) of sucrose using ultracentrifugation at 25,000 rpm for 24 hours (SW40T rotor). Fractions containing DNA fragments smaller than 500bp were purified by PCR purification kit (QIAGEN) and subjected to library preparation and sequencing on the Illumina HiSeq 2000 platform to obtain 50bp single-end reads (Genome Technology Access Center at Washington University). Two biological replicates of DHS were performed.
PLAC-Seq and Hi-C
PLAC-Seq or Hi-C assays were performed as described with modifications17,18. ADCV microdissected from two or three 6–8 week-old mice was pooled for each condition. Tissues were homogenized with 1.1% formaldehyde solution and incubated for 15 minutes at room temperature. After adding glycine solution (final 125 mM glycine) to stop the reaction, the pellet was washed with PBS and stored at −80C. Crosslinked tissues were thawed on ice and lysed in cold lysis buffer (10 mM Tris-HCl pH 8.0, 10 mM NaCl, 0.2% Triton-X with proteinase inhibitor) for 15 minutes, followed by washing with lysis buffer. The pellet was resuspended in 0.5% SDS and incubated at 62C for 10 minutes to permeabilize nuclei. Permeabilization was quenched by adding Triton X-100. The nuclei were treated with MboI (New England Biolabs) for two hours, followed by biotin fill-in reaction using biotin-14-dATP (Thermo Fisher Scientific) with Klenow (New England Biolabs). Proximity ligation was performed at room temperature overnight using T4 ligase (New England Biolabs). To remove biotin from non-ligated ends, nuclei were treated with T4 DNA polymerase (New England Biolabs) in the presence of dGTP at 12C for 2 hours. Nuclei were spun down at 2,500 g for 5 minutes and the supernatant was discarded. The nuclei were resuspended in nuclei lysis buffer (10 mM Tris-HCl pH 8.0, 140 mM NaCl, 1 mM EDTA, 0.5 mM EGTA, 1% Triton X-100, 1% SDS, 0.1% sodium deoxycholate) with proteinase inhibitors. Nuclei were sonicated (Bioruptor II Type 24) until the size of DNA fragments was ~500bp. After sonication, lysates were spun down at 14,000 rpm for 10 minutes and the supernatant was collected.
For Hi-C, lysates were directly used for biotin immunoprecipitation. For PLAC-Seq, lysates were mixed with Protein G Sepharose beads (Thermo Fisher Scientific) and rotated at 4C to pre-clear. Lysates were mixed with 2 μg of H3K4me3 antibody overnight at 4C. 0.5% BSA-blocked Protein G Sepharose beads were added to lysates and rotated for 1 hour at 4C. The beads were washed with RIPA buffer (10 mM Tris-HCl pH 8.0, 140 mM NaCl, 1 mM EDTA, 0.5 mM EGTA, 1% Triton X-100, 0.1% SDS, 0.1% sodium deoxycholate) three times, high-salt RIPA buffer (10 mM Tris-HCl pH 8.0, 500 mM NaCl, 1 mM EDTA, 0.5 mM EGTA, 1% Triton X-100, 0.1% SDS, 0.1% sodium deoxycholate) three times, and TE buffer (10 mM Tris-HCl pH 8.0, 1 mM EDTA) twice. Beads were eluted with elution buffer (10 mM Tris-HCl pH 8.0, 350 mM NaCl, 0.1 mM EDTA, 1% SDS) at 65C. Eluate was treated with 2 μg Rnase A for 1 hour at 37C, followed by 20 μg proteinase K overnight at 65C. DNA fragments were purified using phenol/chloroform/isoamyl alcohol extraction followed by the PCR purification kit (Qiagen). Biotin pull-down of ligated DNA was performed as described17 using MyOne Streptavidin T1 beads (Thermo Fisher Scientific).
PLAC-Seq or Hi-C was performed using libraries prepared with the NEBNext Ultra™ II DNA Library Prep Kit for Illumina (New England Biolabs) with modifications and sequenced on the Illumina NextSeq 500 platform to obtain 36bp paired-end reads. Two to three biological PLAC-Seq or Hi-C replicates were performed in all experiments.
Bioinformatics analyses
For RNA-Seq analyses, sequenced reads were aligned to the mm10 reference genome with HISAT2 using the public server at usegalaxy.org and normalized by library size. Gene and exon/intron annotations were derived using GENCODE version M11. In total RNA-Seq, for genes spanning more than 10Kb, the read density of the first intron was used as an estimate of nascent RNA expression. For genes shorter than 10Kb, read density spanning the entire gene was calculated. For chromatin or nucleocytoplasmic fractionated RNA, read density of the entire gene was calculated. Differential gene expression using pair-wise negative binomial tests with EdgeR32 on the public server at bioinf-galaxian.erasmusmc.nl/galaxy and the false discovery rate (FDR) were calculated for all genes.
WGCNA analyses were performed as described with modifications using the R package for WGCNA14. A signed gene correlation matrix with a soft thresholding of power 12 was used to derive the adjacency matrix. The topological overlap measure was calculated from the adjacency matrix and subjected to average linkage hierarchical clustering. Modules were obtained by hybrid dynamic tree-cutting, with a minimum module size of 50 genes and a minimum height for merging modules of 0.25. The correlation coefficient and correlation FDR of the first principal component of the module gene expression profile (eigengene) and the locomotor behavior or stimulus paradigm were calculated to identify trait-correlated modules.
Cell type enrichment of cerebellar genes was computed using translating ribosomal affinity profiling (TRAP) followed by microarray or RNA-Seq data15,16. The log2 read density for an individual gene in a cell type was subtracted by the mean log2 read density in all other cell types. The mean cell type enrichment of all module genes followed by normalization to the bottom ranked module was used to derive the cell type module enrichment.
Gene ontology analyses of modules were performed using DAVID Bioinformatics Resources 6.833 with a background of all module-assigned genes.
The interaction index of gene modules upon inhibition or activation of the granule neuron CS pathway was calculated using the ratio of log2 fold change of gene expression in muscimol-saline (muscimol) or optostimulation-homecage (optostim) conditions to the log2 fold change of gene expression in freewheel-homecage (freewheel) conditions. The optostim versus freewheel interaction index was subtracted by 1 to center the baseline.
The median of module gene expression in conditional CRISPR Rad21 knockout or control mice was calculated, since gene expression distribution was non-normal.
ChIP-Seq or DHS reads were aligned to the mm10 reference genome with Bowtie2 using the public server at usegalaxy.org and normalized by library size. Peak calling was performed using MACS234. An input control was used for ChIP-Seq peak calling. H3K27ac peaks >2Kb distal to H3K4me3-bound TSSs were considered as enhancers. To calculate the average profile at promoters or enhancers, H3K4me3-bound TSSs or H3K27ac-bound enhancer centers were aligned and the read density was calculated as a function of the distance to the TSS or enhancer center. The standard error of the mean was calculated using two to four biological replicates of the ChIP-Seq condition. Differential ChIP-Seq signals (diffBind) using pair-wise negative binomial tests with EdgeR and the FDR were also calculated.
uaRNAs were identified using windows spanning 0 to 2Kb upstream of TSSs and located on the antisense strand. Windows overlapping with neighboring genes oriented on same strand as the uaRNA were excluded. eRNAs were identified using bidirectional windows originating from DHS peak centers that overlapped with H3K27ac-bound enhancers and spanning 2Kb upstream on the Crick (−) strand or 2Kb downstream on the Watson (+) strand. Windows overlapping with neighboring genes or transcriptional termination sequences oriented on the same strand as the eRNA were excluded.
Transcription factor motif analyses were performed using Homer35 to identify known motifs located at DHS peaks overlapping with H3K27ac-bound enhancers or H3K4me3-bound TSSs. For the lightcyan, midnightblue, and brown modules, DHS peaks overlapping with differential H3K27ac binding (diffBind) upon optostimulation and within 200Kb of H3K4me3-bound TSSs of module genes were considered.
For PLAC-Seq analyses, the MAPS pipeline with modifications19 was applied to normalize PLAC-Seq reads and identify long-range chromatin interactions. Specifically, bwa mem36 was used to map the raw paired-end reads to the reference genome mm10. Only uniquely mapped reads were kept and split into intra-chromosomal reads and inter-chromosomal reads. Intra-chromosomal reads were further split into short-range reads (<=1Kb) and long-range reads (>1Kb). The short-range reads measure the efficiency of protein immunoprecipitation, while the long-range reads measure the strength of long-range chromatin interactions.
To identify intra-chromosomal chromatin interactions in PLAC-Seq analyses, each chromosome was first divided into 10Kb bins. H3K4me3 ChIP-Seq peaks called by MACS2 were used as the 1D anchor, and 10Kb bins overlapping with H3K4me3 ChIP-Seq peaks were defined as the anchor bin. 10Kb bin pairs were further defined as “NOT”, “XOR”, and “AND” set, depending on whether none, one, and two bins are the anchor bin. Only 10Kb bin pairs in the “XOR” and “AND” set with raw count>=1 were analyzed, since the PLAC-Seq experiment is designed to measure chromatin interactions mediated by H3K4me3. Only bin pairs for which 1D distance between two bins is between 20Kb and 1Mb were used to identify long-range chromatin interactions, since the majority of raw count frequency beyond 1Mb was extremely sparse. The raw contact frequency between two 10Kb bins in the “XOR” and “AND” set were then modeled as zero-truncated Poisson distribution, where the mean of the zero-truncated Poisson distribution depended on 1D genomic distance, enzyme cutting frequency, GC content, mappability, and protein immunoprecipitation efficiency measured by short-range reads. The zero-truncated Poisson regression model was fitted to obtain the expected contact frequency, and the ratio between observed and expected contact frequency was used as the normalized contact frequency. The P-value for each 10Kb bin pair was also calculated and then converted into FDR. Each 10Kb bin pair was defined as a significant interaction if the raw contact frequency>=12, the normalized contact frequency>=2 and the FDR<0.01. Significant interactions were further grouped together into interaction clusters if two interactions were within 10Kb. The significant interactions were defined as “singletons” if none of their neighbor bin pairs was significant. A more stringent FDR threshold (FDR<1e-4) was further used on identified singletons to reduce false positives.
To identify inter-chromosomal chromatin interactions in PLAC-Seq analyses, 100Kb bin pairs between two different chromosomes were considered, and a similar zero-truncated Poisson regression model was applied to obtain the expected contact frequency, P-value, and FDR. Compared to the zero-truncated Poisson regression model used in the intra-chromosomal interaction detection, the only difference is that the 1D genomic distance was not included as a regression coefficient.
To identify features of long-range chromatin interactions in PLAC-Seq analyses, 10Kb bins in the XOR set that represent interactions between promoters and non-promoters were used. Each target bin was extended to upstream or downstream 500Kb (i.e., 50 10Kb bins), and the number of 10Kb bins that overlapped with CTCF-bound insulators, gene bodies, intergenic enhancers, and intragenic enhancers was calculated. The same calculation for control bins, whose 1D distance to anchor bins were matched to the 1D distance between target and anchor bins, was performed. The enrichment score was defined as the ratio between the number of features in the target bin and the number of features in the control bin.
For PLAC-Seq analyses of multi-enhancer genes, activated promoters with a log2 fold change>0.585 in H3K27ac levels upon optostimuation granule neurons were considered. The 1D genomic distance of the most distal enhancer to the gene promoter was set as 1 and defined as the normalized genomic distance. Multi-enhancers located at normalized genomic distances greater than 0.67 were considered distal enhancers, while multi-enhancers located at normalized genomic distances less than 0.67 were considered proximal enhancers.
For Hi-C analyses, reads were aligned to the mm10 reference genome with Bowtie2 and HiC-Pro as described37. Uniquely mapped paired-end reads were assigned to MboI restriction fragments and valid pairs were filtered for PCR duplicates. Interaction and Pearson correlation matrices were visualized using Juicebox38. Loop domains were called using HiCCUPS17 at 5Kb and 10Kb resolutions and merged. A/B compartment strength was derived from the eigenvector (λ) of the Hi-C correlation matrix17 using 100Kb bins. Genomic loci enriched in the active histone modification H3K27ac and de-enriched in the repressive histone modification H3K9me339 were assigned a positive λ and denoted as the active A compartment, while genomic loci with a negative λ were denoted as the repressive B compartment. For inter-chromosomal interactions in Hi-C, observed/expected ratios of square root vanilla coverage40 normalized interaction counts in 100Kb bins were obtained using Juicer and defined as the normalized interaction frequency. The sum of the normalized interaction frequency between groups of genomic loci in 100Kb bins harboring increased or decreased H3K27ac was calculated. Finally, the mean log2 fold change in the summed interaction frequencies between optostimulated and homecage conditions and the standard error of the mean across 3 Hi-C biological replicates were derived.
Frequently interacting regions (FIREs) were identified in Hi-C analyses as described41. 40Kb bin resolution Hi-C raw contact matrices were created and for each 40Kb bin, the total number of intra-chromosomal interactions between 15Kb and 200Kb was calculated and normalized by enzyme cutting frequency, GC content, and mappability score via HiCNormCis41. The normalized total intra-chromosomal interaction is defined as the FIRE score. FIRE scores were converted into Z-scores and P-values, and 40Kb bins with the highest FIRE scores (P-value < 0.05) were defined as FIRE bins. Control bins were randomly selected from 5% of the 40Kb bins. Each FIRE bin was extended to upstream or downstream 2Mb (i.e., 50 40Kb bins), and the number of 40Kb bins overlapping with CTCF-bound insulators, gene bodies, intergenic enhancers, intragenic enhancers, and promoters was calculated. The same calculation was performed for control bins, and the enrichment score was defined as the ratio between the number of features in the target bin and the number of features in the control bin.
To identify enhancer-promoter interactions for aggregate peak analyses using HiC, the intra-chromosomal interaction list from MAPS analyses of H3K4me3 PLAC-Seq was used. Common interactions between conditions were filtered to exclude interaction pairs that overlapped with CTCF ChIP-Seq peaks harboring convergently oriented CTCF motifs and anchors that overlapped with domain boundaries identified using Arrowhead17,42. The interaction list was further filtered to include interaction pairs that overlapped with H3K27ac ChIP-Seq peaks. Aggregate peak analysis17 was performed on the final list of enhancer-promoter interactions.
DNA FISH analyses
DNA FISH assays were performed as described with modifications43. ADCV was microdissected from 6–8 week-old mice and two biological replicates were performed for each condition. Tissue was homogenized with 4% formaldehyde solution and incubated for 10 minutes at room temperature. After adding 100 mM Tris solution pH 8.0 to stop the reaction, the pellet was washed with PBS and stored at −80C. Crosslinked tissue was thawed on ice and lysed in cold lysis buffer (10 mM Tris-HCl pH 8.0, 10 mM NaCl, 0.2% Triton-X with proteinase inhibitor) for 15 minutes, followed by washing with PBS. The pellet was resuspended in PBS and attached to Poly-L-Lysine solution (Sigma) coated glass plates by centrifugation at 300 g for 3 minutes. Cells were permeabilized in buffer containing 0.1% saponin and 0.1% Triton X-100 in PBS for 10 minutes at RT, incubated 20 minutes at RT with 20% glycerol with PBS and freeze-thawed in liquid nitrogen three times. Then, cells were denatured with 0.1 M HCl for 30 minutes at RT and permeabilized in 0.5% saponin and 0.5% Triton X-100 in PBS for 30 minutes at RT. For hybridization, nuclear DNA was denatured by incubating glass plates with buffer containing 2x SSC and 70% formamide for 2.5 minutes at 73C, followed by incubation with 2x SSC and 50% formamide for 1 minutes. All probes were made from BAC clones (BACPAC Resources Center) RP24–272L10 (distal nr4a3 enhancers), RP24–350O8 (nr4a3 gene), and RP23–286O20 (gapdh gene) by nick translation with chemical coupling using an Alexa Fluor succinimidyl ester (Alexa555 for distal nr4a3 enhancers and gapdh gene; Alexa647 for nr4a3 gene) (Thermo Fisher Scientific). The hybridization solution contained ~30 ng of each labeled probe, 6 mg of mouse Cot-1 DNA, and 10 mg of sheared salmon-sperm DNA in hybridization buffer (10% dextran sulfate, 50% formamide, 10% denhalt solution). The probes were denatured at 73C for 5 minutes before use. Denatured cells and probes were sealed and incubated in a hybridization oven at 37C for overnight. On the next day, coverslips were removed and washed once in 2x SSC, 50% formamide solution for 15 minutes at 37C and three times in 2x SSC for 5 minutes at 37C with gentle agitation. Cells were washed once with PBS and stained with Hoechst dye. After washing with PBS, cells were mounted with VectaShield antifade mounting medium (VECTOR laboratories). Images were acquired on a confocal laser scanning microscope (Olympus FV10i) using a 60x objective lens (NA 1.35). A stack of seven 1 μm thick optical sections was acquired for each field of view in the UV, red, and far-red channels. For each cell, FISH signals were subjected to automated identification using custom macros in ImageJ. In the red and far-red channels, the centroid of FISH signals was detected using auto local thresholding and the Euclidian distance to nearest alternate FISH probe was calculated.
Extended Data
Extended Data Fig. 1. Pharmacological inactivation of the ADCV and lobule VI in delay tactile startle conditioning.
(a) Mice were subjected to tactile stimulation of the tail using an air puff (n=3 mice). (b) The delay tactile startle conditioning paradigm as in Fig. 1c–e using a 300 ms inter-stimulus interval (ISI) (left) and the percentage of trials with a conditioned response (CR) (right, day1 vs day7, P=1.8×10⁻⁵, two-tailed t-test, n=5 mice). (c, d) Cannula placement in the ADCV for drug delivery (c). Top: sagittal view, bottom: coronal view. Black or red/pink crosses indicate sites of saline or muscimol injections, respectively. Muscimol conjugated with the fluorophore BODIPY TMR-X injected one day after the last day of delay tactile startle conditioning was used to identify the location of the cannula tip. A representative injection site is shown (d, n=38 mice). (e) Mice injected with saline or muscimol in the ADCV were tested on the DigiGait system (n=5 mice). (f, g) Cannula placement in lobule VI for drug delivery (f). The percentage of conditioned responses during delay tactile startle conditioning (g, top) and unconditioned responses (g, bottom) upon muscimol-dependent neuronal inactivation in lobule VI (n=8 mice). In all panels, data show mean and shading or error bars denote standard error.
Extended Data Fig. 2. Optogenetic inactivation and stimulation of the ADCV and lobule VI in delay tactile startle conditioning.
(a) Day 5 backward conditioned responses of control mice subjected to delay tactile startle conditioning and optical stimulation in the ADCV as in Fig. 1i (Ai40 ctrl +ADCV laser, n=9 mice), Ai40-GC mice subjected to delay tactile startle conditioning in the absence of optical stimulation (Ai40-GC +no laser, n=6 mice), or Ai40-GC mice subjected to delay tactile startle conditioning and optogenetic silencing of lobule VI during the CS (Ai40-GC +L. VI laser, n=7 mice). (b) Acute sagittal cerebellar slices were prepared from mice expressing channelrhodopsin in granule neurons (Ai32-GC mice). Granule neuron action potentials were recorded in response to 100 ms optogenetic stimuli each composed of a 50 Hz train of 10 ms pulses (blue squares). A representative membrane potential trace for a granule neuron (left, n=2 neurons) and the relationship between the intensity of optostimulation of granule neurons and action potential firing (right, n=4 neurons). (c) Mice expressing channelrhodopsin in granule neurons (Ai32-GC mice) were subjected to optostimulation of the granule neuron pathway in the ADCV as the CS in the absence of the US (n=3 mice). (d) Control mice were subjected to optical stimulation in the ADCV as the CS together with the US (n=3 mice). (e) Mice expressing channelrhodopsin in granule neurons (Ai32-GC mice) were subjected to three days of delay tactile startle conditioning using optostimulation of lobule VI as the CS (backward conditioned responses in naïve vs day3, P=6.1×10⁻¹¹, two-tailed t-test, n=6 mice). In all panels, data show mean and error bars denote standard error.
Extended Data Fig. 3. In vivo imaging of granule neuron coding during delay tactile startle conditioning.
(a) Sagittal sections from the cerebellum of mice expressing GCaMP6f in granule neurons (Ai95-GC) were subjected to immunohistochemistry using the GFP and Calbindin antibodies and the DNA dye Bisbenzimide (Hoechst) (n=2 mice). Scale bar: 200 μm, 10x magnification (top); 50 μm, 40x magnification (bottom). Molecular layer: ML, Purkinje cell layer: PCL, and internal granule layer: IGL. (b) In vivo two-photon calcium imaging of Ai95-GC mice subjected to delay tactile startle conditioning, followed by image registration and auto cell-segmentation. In a representative imaging session, the average mouse locomotion during ten training trials (top), segmented granule neuron somas (middle, left) and their calcium responses (middle, right), and population granule neuron responsivity (bottom) (n=6 mice). (c) Locomotion of Ai95-GC mice during delay tactile startle conditioning on day 1 and after training for 6–9 days (n=6 mice). (d) The percentage of granule neurons that are active in the ADCV during the CS period in tactile startle conditioning (*P=0.031,***P=7.3×10⁻⁵, one-way ANOVA with Dunnett’s post-hoc test, n=5,4,4 mice for day1,day6–9CR+,day6–9CR-). (e) Population responsivity of granule neurons in lobule VI during the CS period in tactile startle conditioning (**P<0.01,***P<0.001, two-way repeated measures ANOVA with Dunnett’s post-hoc test, n=5 mice). In all panels, data show mean and shading or error bars denote standard error
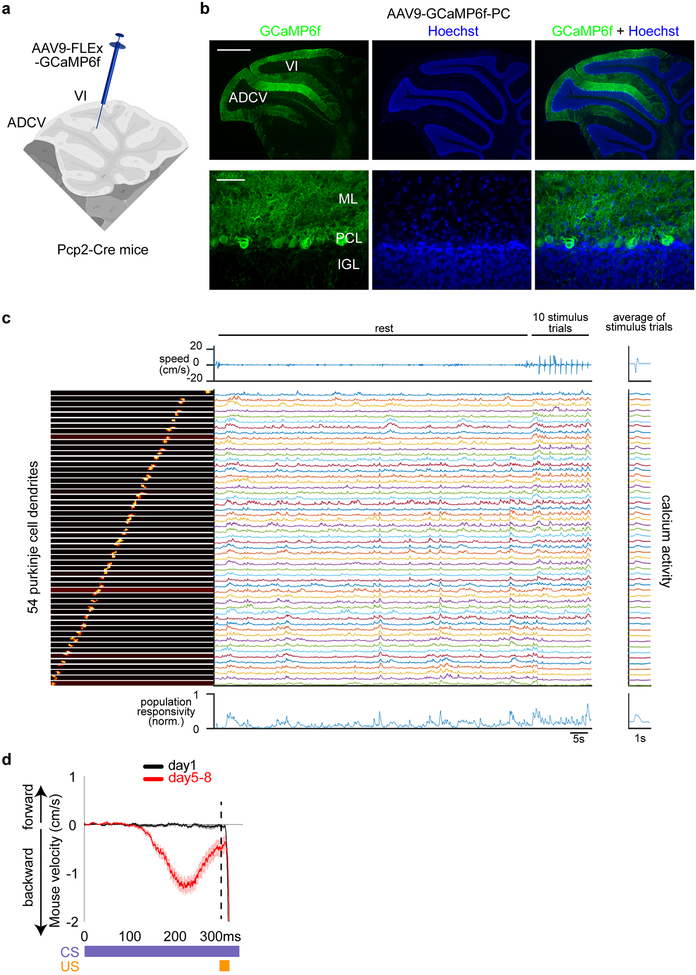
Extended Data Fig. 4. In vivo imaging of Purkinje cell dendrite coding during delay tactile startle conditioning.
(a, b) The AAV delivery approach to label Purkinje cells in the ADCV and lobule VI (a). Sagittal sections from the cerebellum of Pcp2-Cre mice injected with AAV9-FLEx-GCaMP6f (AAV9-GCaMP6f-PC) were subjected to immunohistochemistry using the GFP antibody and Hoechst (b, n=2 mice). Scale bars: 500 μm, 4x magnification (top); 50 μm, 40x magnification (bottom). (c) In vivo two-photon calcium imaging of AAV9-GCaMP6f-PC mice subjected to 60 seconds of free wheel locomotion and 10 trials of delay tactile startle conditioning with randomized inter-trial intervals. In a representative imaging session, Purkinje cell dendrite calcium responses were analyzed as in Extended Data Fig. 3b (n=10 mice). (d) Locomotion of AAV9-GCaMP6f-PC mice during delay tactile startle conditioning on day 1 and after training for 5–8 days (n=10 mice). Data show mean and shading denotes standard error
Extended Data Fig. 5. Identification of cell type-enriched and sensorimotor experience-dependent gene modules in the cerebellum in mice.
(a) Gene modules identified in Fig. 3b were intersected with cerebellar cell type-specific TRAP-Seq data and analyzed as in Fig. 3c. (b) Heatmaps of gene module expression induced by sensorimotor stimulation as in Fig. 3a (n=52 samples, log2 mean centered). (c) Comparison of the log2 fold change in gene expression induced by free wheel locomotion compared to homecage control and the log2 fold change in gene expression upon treatment with the GABA(A) receptor agonist muscimol compared to saline control during free wheel locomotion in the ADCV of mice. Genes in the lightcyan module induced by locomotion that were restored to homecage control expression levels upon silencing of the ADCV cortical activity with muscimol (reversal) fall on the dotted line. (d) Sensorimotor stimulation-dependent gene modules analyzed as in (c). (e) The average velocity of mice subjected to delay tactile startle conditioning (US+CS) or control (US) condition during inter-trial intervals (n=4 mice). (f, g) Gene expression in the ADCV or lobule VI of mice subjected to delay tactile startle conditioning (US+CS) or control (US) condition (n=4 mice). In all panels, data show mean and error bars denote standard error
Extended Data Fig. 6. Optostimulation of granule neurons potentiates CS pathway-regulated gene modules.
(a) UCSC genome browser tracks of chromatin-bound (Chrom-Seq) and nucleocytoplasmic (NucCyto-Seq) RNA at the fosl2 locus upon optostimulation of granule neurons in the ADCV in mice. The chromatin-bound fraction contained immature unspliced RNA and the nucleocytoplasmic fraction contained spliced mature RNA. (b-d) Comparisons of the log2 fold change in chromatin-bound RNA and the log2 fold change in nucleocytoplasmic RNA upon optostimulation of granule neurons together with the log2 fold change in total RNA upon sensorimotor stimulation in the ADCV in mice (n=4,4,18) mice for chromatin, nucleocytoplasmic, total RNA). Data show mean ± standard error. (e) Pulse chase analyses were performed by optogenetically stimulating granule neurons in the ADCV for 10 minutes and returning mice to their homecage for 10, 50, or 140 minutes. The ADCV of optostimulated or unstimulated control mice was then subjected to RNA-Seq using the chromatin-bound (nascent) or nucleocytoplasmic (mature) fractions. (f-i) Time course of chromatin-bound (nascent) or nucleocytoplasmic (mature) RNA expression following optostimulation of granule neurons as in (e) (n=2 mice).
Extended Data Fig. 7. Optostimulation of the CS pathway regulates uaRNA and eRNA expression.
(a, b) Heatmaps of significantly differentially expressed (DE) uaRNA and eRNA from Chrom-Seq or NucCyto-Seq (two-sided P-value from negative binomial distribution with Benjamini-Hochberg post-hoc test, n=4 mice, false discovery rate (FDR) < 0.05, log2 mean centered). (c) Comparison of the log2 fold change in mRNA expression and the log2 fold change in uaRNA and eRNA expression at lightcyan, midnightblue, and brown gene modules upon optostimulation of granule neurons (n=83,67,342 transcript-uaRNA pairs and n=66,63,366 transcript-eRNA pairs for lightcyan, midnightblue, brown). The Pearson correlation coefficient (corr) is shown.
Extended Data Fig. 8. Optostimulation of the CS pathway regulates histone modification and histone variant abundance at gene promoters.
and enhancers (a-c) Comparison of the log2 fold change in gene expression and the log2 fold change in H3K27ac (a), H2A.z (b), or H3K4me3 (c) read density at the TSSs of granule neuron-enriched gene modules upon optostimulation of granule neurons in the ADCV in mice (n=85,355 transcripts for midnightblue, brown). The Pearson correlation coefficient (corr) is shown. (d) The profile of the histone marks H3K27ac, H2A.z, H3K4me3, and H3K27me3 surrounding the TSSs of genes whose expression was upregulated (left, mRNA fold change>1, log2), not changed (middle, −0.05<mRNA fold change<0.05, log2), or downregulated (right, mRNA fold change<−1, log2) upon optostimulation of granule neurons (n=2,3,2,2 biological replicates for H3K27ac,H2A.z,H3K4me3,H3K27me3). (e, f) Comparison of the log2 fold change in mRNA or eRNA and the log2 fold change in H3K27ac (top) or H2A.z (bottom) levels at the enhancers of granule neuron-enriched CS-regulated gene modules (e, n=266,256,1510 enhancers for lightcyan, midnightblue, brown). The Pearson correlation coefficient (corr) is shown. The profile of H3K27ac and H2A.z surrounding enhancers with eRNA levels that were upregulated (left, mRNA fold change>1, log2), not changed (middle, −0.05<mRNA fold change<0.05, log2), or downregulated (right, mRNA fold change<−1, log2) upon optostimulation of granule neurons (f, n=2,3 biological replicates for H3K27ac,H2A.z). In all panels, data show mean.
Extended Data Fig. 9. Transcription factors enriched at CS pathway regulated genes.
(a) Transcription factor binding motifs enriched at enhancers or promoters with upregulated (fold change>1 or >0.585, log2) or downregulated (fold change<−1 or <−0.585, log2) H3K27ac levels upon optostimulation of granule neurons (n=1379,419 enhancers for FC>1,FC<−1; n=290,166 promoters for FC>0.585,FC<−0.585). (b) Transcription factor binding motifs enriched at enhancers or promoters of granule neuron CS pathway activated gene modules (n=364,288,1139 enhancers and n=37,38,69 promoters for lightcyan, midnightblue, brown). In all panels, Fisher’s exact test with Benjamini post-hoc test. NS indicates no significant motifs identified.
Extended Data Fig. 10. Chromatin architecture in the cerebellum.
(a) Features of genomic loci interacting with promoters in the adult cerebellum. MAPS analyses of PLAC-Seq data identified promoter-centric interactions enriched for regulatory regions of the genome marked by occupancy of CTCF or H3K27ac. (b, c) PLAC-Seq analyses of the number of home-specific and opto-specific interactions (b, P=4.7×10⁻⁵, Chi-square test, n=2 biological replicates) or changes in interaction frequency (c, **P=0.0045,***P=0.00026, two-sided Wilcoxon signed rank test, n=83,49 enhancer-promoter pairs for FC>0.585,FC<−0.585) between promoters and enhancers harboring upregulated (blue, fold change>0.585 or >1, log2) or downregulated (green, fold change<−0.585, log2) H3K27ac levels upon optostimulation of granule neurons. Box plots show median, quartiles (box) and range (whiskers). (d) Features of frequently interacting regions (FIREs) in the adult cerebellum. (e) The number of home-specific and opto-specific FIREs within 200Kb of TSSs harboring upregulated (blue, fold change>0.585 or >1, log2) or downregulated (green, fold change<−0.585, log2) H3K27ac levels upon optostimulation of granule neurons (P=8.8×10⁻⁷, Chi-square test, n=3 biological replicates). (f) The profile of H3K27ac surrounding the distal (left) or proximal (right) enhancers of genes indicated in Fig. 4d (n=2 biological replicates). Data show mean. (g, h) A representative image of a granule neuron labeled with DNA FISH probes targeting the nr4a3 (green) or gapdh (red) gene together with Hoechst (g, n=416 nuclei). The dotted line indicates the nucleus. The co-localization of the nr4a3 and gapdh genes upon optostimulation (h, n=2 mice). Data show mean. (i) Comparison of the change in compartment strength (λ) and the change in H3K27ac levels in 100Kb bins along chromosomes upon optostimulation of granule neurons (n=24046 bins). The Pearson correlation coefficient (corr) is shown. (j) PLAC-Seq analyses of inter-chromosomal normalized interaction frequency between genomic loci at 100Kb resolution harboring upregulated (blue, fold change>0.585, log2) or downregulated (green, fold change<−0.585, log2) H3K27ac levels as in Fig. 4j. (k) Sagittal sections from the cerebellum of Cas9EGFP-GC mice infected with AAV9-gRNA-mCherry as in Fig. 5f and subjected to immunohistochemistry using the GFP and DsRed antibodies and DAPI (n=4 mice). Scale bar: 100 μm. (l) The ADCV of conditional CRISPR Rad21 knockout or control mice analyzed as in Fig. 5j (n=2,2,5,5 mice for home-ctrl,home-Rad21cKO,US+CS-ctrl,US+CS-Rad21cKO). Data show mean and error bars denote standard error.
Supplementary Material
Acknowledgements
We thank members of the Bonni laboratory for helpful discussions and critical reading of the manuscript, Yoshiko Tanabe for genotyping, and Dr. Masafumi Muratani and Tsukuba i-Laboratory for sequencing. Supported by NIH grants NS041021 (A.B.) and U54DK107977 (M.H.), the Mathers Foundation (A.B.), Program to Disseminate Tenure Tracking System by MEXT (T.Y.) and JSPS KAKENHI Grant-in-Aid for Young Scientists 17H04981 (T.Y).
Footnotes
Data Availability
ChIP-Seq, RNA-seq, DHS, HiC, and PLAC-Seq data are available in the Gene Expression Omnibus (GEO) database under the reference number GSE127995.
The authors declare no conflicts of interest.
References
- 1.West AE & Greenberg ME Neuronal activity-regulated gene transcription in synapse development and cognitive function. Cold Spring Harb Perspect Biol 3, (2011). [DOI] [PMC free article] [PubMed] [Google Scholar]
- 2.Watson LA & Tsai LH In the loop: how chromatin topology links genome structure to function in mechanisms underlying learning and memory. Curr Opin Neurobiol 43, 48–55, (2017). [DOI] [PMC free article] [PubMed] [Google Scholar]
- 3.Rajarajan P, Gil SE, Brennand KJ & Akbarian S Spatial genome organization and cognition. Nat Rev Neurosci 17, 681–691, (2016). [DOI] [PMC free article] [PubMed] [Google Scholar]
- 4.Kandel ER, Dudai Y & Mayford MR The molecular and systems biology of memory. Cell 157, 163–186, (2014). [DOI] [PubMed] [Google Scholar]
- 5.Yang Y et al. Chromatin remodeling inactivates activity genes and regulates neural coding. Science 353, 300–305, (2016). [DOI] [PMC free article] [PubMed] [Google Scholar]
- 6.Maze I et al. Critical Role of Histone Turnover in Neuronal Transcription and Plasticity. Neuron 87, 77–94, (2015). [DOI] [PMC free article] [PubMed] [Google Scholar]
- 7.Kim TK et al. Widespread transcription at neuronal activity-regulated enhancers. Nature 465, 182–187, (2010). [DOI] [PMC free article] [PubMed] [Google Scholar]
- 8.Zovkic IB, Paulukaitis BS, Day JJ, Etikala DM & Sweatt JD Histone H2A.Z subunit exchange controls consolidation of recent and remote memory. Nature 515, 582–586, (2014). [DOI] [PMC free article] [PubMed] [Google Scholar]
- 9.Yeomans JS, Li L, Scott BW & Frankland PW Tactile, acoustic and vestibular systems sum to elicit the startle reflex. Neurosci Biobehav Rev 26, 1–11, (2002). [DOI] [PubMed] [Google Scholar]
- 10.Funfschilling U & Reichardt LF Cre-mediated recombination in rhombic lip derivatives. Genesis 33, 160–169, (2002). [DOI] [PMC free article] [PubMed] [Google Scholar]
- 11.Madisen L et al. Transgenic mice for intersectional targeting of neural sensors and effectors with high specificity and performance. Neuron 85, 942–958, (2015). [DOI] [PMC free article] [PubMed] [Google Scholar]
- 12.Pan N, Jahan I, Lee JE & Fritzsch B Defects in the cerebella of conditional Neurod1 null mice correlate with effective Tg(Atoh1-cre) recombination and granule cell requirements for Neurod1 for differentiation. Cell Tissue Res 337, 407–428, (2009). [DOI] [PMC free article] [PubMed] [Google Scholar]
- 13.Madisen L et al. A toolbox of Cre-dependent optogenetic transgenic mice for light-induced activation and silencing. Nat Neurosci 15, 793–802, (2012). [DOI] [PMC free article] [PubMed] [Google Scholar]
- 14.Langfelder P & Horvath S WGCNA: an R package for weighted correlation network analysis. BMC Bioinformatics 9, 559, (2008). [DOI] [PMC free article] [PubMed] [Google Scholar]
- 15.Doyle JP et al. Application of a translational profiling approach for the comparative analysis of CNS cell types. Cell 135, 749–762, (2008). [DOI] [PMC free article] [PubMed] [Google Scholar]
- 16.Mellen M, Ayata P, Dewell S, Kriaucionis S & Heintz N MeCP2 binds to 5hmC enriched within active genes and accessible chromatin in the nervous system. Cell 151, 1417–1430, (2012). [DOI] [PMC free article] [PubMed] [Google Scholar]
- 17.Rao SS et al. A 3D map of the human genome at kilobase resolution reveals principles of chromatin looping. Cell 159, 1665–1680, (2014). [DOI] [PMC free article] [PubMed] [Google Scholar]
- 18.Fang R et al. Mapping of long-range chromatin interactions by proximity ligation-assisted ChIP-seq. Cell Res 26, 1345–1348, (2016). [DOI] [PMC free article] [PubMed] [Google Scholar]
- 19.Juric I et al. MAPS: model-based analysis of long-range chromatin interactions from PLAC-seq and HiChIP experiments. Preprint at https://www.biorxiv.org/content/early/2018/2009/2008/411835, (2018). [DOI] [PMC free article] [PubMed]
- 20.Kagey MH et al. Mediator and cohesin connect gene expression and chromatin architecture. Nature 467, 430–435, (2010). [DOI] [PMC free article] [PubMed] [Google Scholar]
- 21.Singh VP & Gerton JL Cohesin and human disease: lessons from mouse models. Curr Opin Cell Biol 37, 9–17, (2015). [DOI] [PubMed] [Google Scholar]
- 22.Barski JJ, Dethleffsen K & Meyer M Cre recombinase expression in cerebellar Purkinje cells. Genesis 28, 93–98, (2000). [PubMed] [Google Scholar]
- 23.Andermann ML, Kerlin AM, Roumis DK, Glickfeld LL & Reid RC Functional specialization of mouse higher visual cortical areas. Neuron 72, 1025–1039, (2011). [DOI] [PMC free article] [PubMed] [Google Scholar]
- 24.Heiney SA, Wohl MP, Chettih SN, Ruffolo LI & Medina JF Cerebellar-dependent expression of motor learning during eyeblink conditioning in head-fixed mice. J Neurosci 34, 14845–14853, (2014). [DOI] [PMC free article] [PubMed] [Google Scholar]
- 25.Yang Y & Lisberger SG Purkinje-cell plasticity and cerebellar motor learning are graded by complex-spike duration. Nature 510, 529–532, (2014). [DOI] [PMC free article] [PubMed] [Google Scholar]
- 26.Yamada T et al. Promoter decommissioning by the NuRD chromatin remodeling complex triggers synaptic connectivity in the mammalian brain. Neuron 83, 122–134, (2014). [DOI] [PMC free article] [PubMed] [Google Scholar]
- 27.Chen TW et al. Ultrasensitive fluorescent proteins for imaging neuronal activity. Nature 499, 295–300, (2013). [DOI] [PMC free article] [PubMed] [Google Scholar]
- 28.Miri A, Daie K, Burdine RD, Aksay E & Tank DW Regression-based identification of behavior-encoding neurons during large-scale optical imaging of neural activity at cellular resolution. Journal of neurophysiology 105, 964–980, (2011). [DOI] [PMC free article] [PubMed] [Google Scholar]
- 29.Mukamel EA, Nimmerjahn A & Schnitzer MJ Automated analysis of cellular signals from large-scale calcium imaging data. Neuron 63, 747–760, (2009). [DOI] [PMC free article] [PubMed] [Google Scholar]
- 30.Lein ES et al. Genome-wide atlas of gene expression in the adult mouse brain. Nature 445, 168–176, (2007). [DOI] [PubMed] [Google Scholar]
- 31.Ling G & Waxman DJ DNase I digestion of isolated nulcei for genome-wide mapping of DNase hypersensitivity sites in chromatin. Methods Mol Biol 977, 21–33, (2013). [DOI] [PMC free article] [PubMed] [Google Scholar]
- 32.Robinson MD, McCarthy DJ & Smyth GK edgeR: a Bioconductor package for differential expression analysis of digital gene expression data. Bioinformatics 26, 139–140, (2010). [DOI] [PMC free article] [PubMed] [Google Scholar]
- 33.Dennis G Jr. et al. DAVID: Database for Annotation, Visualization, and Integrated Discovery. Genome Biol 4, P3, (2003). [PubMed] [Google Scholar]
- 34.Zhang Y et al. Model-based analysis of ChIP-Seq (MACS). Genome Biol 9, R137, (2008). [DOI] [PMC free article] [PubMed] [Google Scholar]
- 35.Heinz S et al. Simple combinations of lineage-determining transcription factors prime cis-regulatory elements required for macrophage and B cell identities. Mol Cell 38, 576–589, (2010). [DOI] [PMC free article] [PubMed] [Google Scholar]
- 36.Li H Aligning sequence reads, clone sequences and assembly contigs with BWA-MEM. Preprint at https://arxiv.org/abs/1303.3997, (2013).
- 37.Servant N et al. HiC-Pro: an optimized and flexible pipeline for Hi-C data processing. Genome Biol 16, 259, (2015). [DOI] [PMC free article] [PubMed] [Google Scholar]
- 38.Durand NC et al. Juicer Provides a One-Click System for Analyzing Loop-Resolution Hi-C Experiments. Cell Syst 3, 95–98, (2016). [DOI] [PMC free article] [PubMed] [Google Scholar]
- 39.Mellen M, Ayata P & Heintz N 5-hydroxymethylcytosine accumulation in postmitotic neurons results in functional demethylation of expressed genes. Proc Natl Acad Sci U S A 114, E7812–E7821, (2017). [DOI] [PMC free article] [PubMed] [Google Scholar]
- 40.Mumbach MR et al. HiChIP: efficient and sensitive analysis of protein-directed genome architecture. Nat Methods 13, 919–922, (2016). [DOI] [PMC free article] [PubMed] [Google Scholar]
- 41.Schmitt AD et al. A Compendium of Chromatin Contact Maps Reveals Spatially Active Regions in the Human Genome. Cell Rep 17, 2042–2059, (2016). [DOI] [PMC free article] [PubMed] [Google Scholar]
- 42.Kim TH et al. Analysis of the vertebrate insulator protein CTCF-binding sites in the human genome. Cell 128, 1231–1245, (2007). [DOI] [PMC free article] [PubMed] [Google Scholar]
- 43.Bolland DJ, King MR, Reik W, Corcoran AE & Krueger C Robust 3D DNA FISH using directly labeled probes. J Vis Exp, (2013). [DOI] [PMC free article] [PubMed] [Google Scholar]
Associated Data
This section collects any data citations, data availability statements, or supplementary materials included in this article.


