

Abstract
Gene therapy represents a promising treatment for the Alzheimer׳s disease (AD). However, gene delivery specific to brain lesions through systemic administration remains big challenge. In our previous work, we have developed an siRNA nanocomplex able to be specifically delivered to the amyloid plaques through surface modification with both CGN peptide for the blood–brain barrier (BBB) penetration and QSH peptide for β-amyloid binding. But, whether the as-designed nanocomplex could indeed improve the gene accumulation in the impaired neuron cells and ameliorate AD-associated symptoms remains further study. Herein, we prepared the nanocomplexes with an siRNA against β-site amyloid precursor protein-cleaving enzyme 1 (BACE1), the rate-limiting enzyme of Aβ production, as the therapeutic siRNA of AD. The nanocomplexes exhibited high distribution in the Aβ deposits-enriched hippocampus, especially in the neurons near the amyloid plaques after intravenous administration. In APP/PS1 transgenic mice, the nanocomplexes down-regulated BACE1 in both mRNA and protein levels, as well as Aβ and amyloid plaques to the level of wild-type mice. Moreover, the nanocomplexes significantly increased the level of synaptophysin and rescued memory loss of the AD transgenic mice without hematological or histological toxicity. Taken together, this work presented direct evidences that the design of precise gene delivery to the AD lesions markedly improves the therapeutic outcome.
KEY WORDS: siRNA delivery, Neurons, Amyloid plaques, BACE1 gene, Alzheimer׳s disease
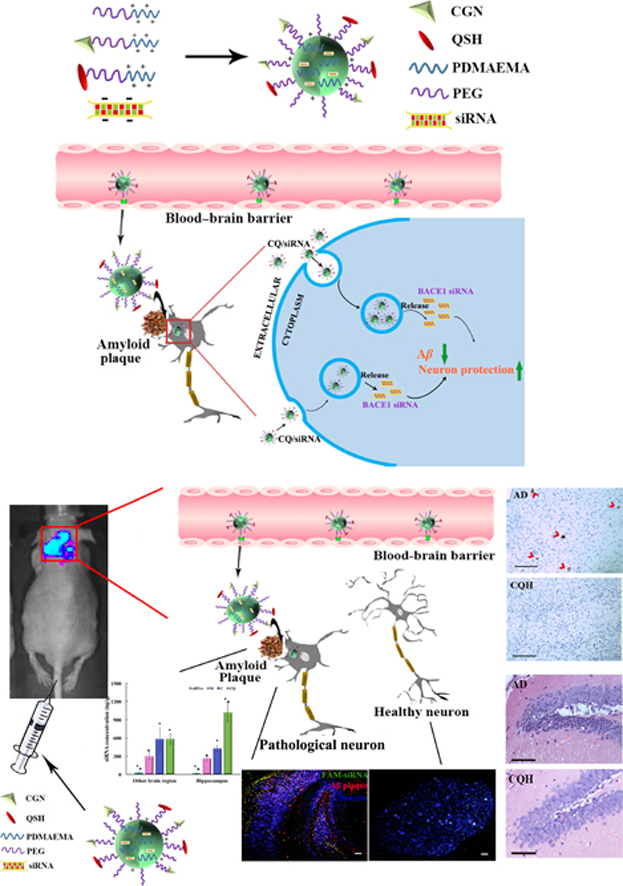
Graphical abstract
In this study, the nanocomplexes were prepared with an siRNA against β-site amyloid precursor protein-cleaving enzyme 1 (BACE1), the rate-limiting enzyme of Aβ production, as the therapeutic siRNA of Alzheimer's disease (AD).
1. Introduction
Alzheimer׳s disease (AD) is a progressive neurodegenerative disease which has no cure today1., 2., 3.. Pathologically, the brains of the AD patients are characterized by plaques composed of mis-folded β-amyloid peptide (Aβ). Increase of production, accumulation and aggregation of the Aβ is associated with perturbations of synaptic function and neural network activity, leading to cognitive deficits and neurodegeneration4., 5.. Therefore, reduction of the amyloid plaques by prevention of Aβ formation, blockade of Aβ aggregation, and/or acceleration of its clearance are the therapeutic strategies to treat AD6., 7..
Gene therapy has exhibited great potential for treating AD8., 9.. Current strategies of AD gene therapy involve direct introduction of a therapeutic gene into the brain using viral vectors, such as adeno-associated viruses and lentiviruses10., 11.. These approaches meet several challenges of clinical translation such as the invasive administration methods, risk of immune or inflammatory reactions12, as well as minimally parenchymal diffusion around the needle site following intraparenchymal administration13, or only ipsilateral distribution in the ependymal surface after intraventricular injection14. Therefore, it is imperative to develop non-viral vectors that can efficiently deliver gene to brain through systemic injection.
Due to the presence of the blood–brain barrier (BBB), current non-viral vectors are less effective to be delivered into the brain, even to the lesion, through systemic administration. In order to overcome these barriers, we have developed the gene carriers composed of cationic polymers, PEGylated poly(2-(N,N-dimethylamino) ethyl methacrylate) (PEG-PDMAEMA), surface-modified with both BBB targeting ligand (CGN peptide) and Aβ-targeting ligand (QSH peptide). The nanocomplexes actively crossed the BBB, and further specifically accumulated the amyloid plaques15. However, whether the nanocomplexes further reach the neurons near the amyloid plaques for gene regulation, as well as provide cognitive benefits in the AD transgenic mice remains to be investigated.
Herein, we prepared the nanocomplexes with an siRNA against β-site amyloid precursor protein-cleaving enzyme 1 (BACE1), the rate-limiting enzyme of Aβ production, as the therapeutic siRNA of AD through the self-assembly process (Fig. 1). We found that the nanocomplexes were mainly distributed in the neurons near the amyloid plaques. Administration of the nanocomplexes to a double transgenic (APPswe+PSEN1dE9, APP/PS1) mouse model significantly decreased Aβ production, reduced the impaired neurons, and reversed the cognitive decline.
Figure 1.

Schematic illustration of the designed nanocomplexes consisting of PEG-PDMAEMA for siRNA condensation, CGN peptide for blood–brain barrier (BBB) penetration and the QSH peptide for Aβ binding. Following intravenous injection, the delivery vehicles can be actively transported through the BBB into brain, accumulated in the amyloid plaques, further specifically endocytosed by the neuron near the amyloid plaques for gene transfection.
2. Methods and materials
2.1. Materials
The negative control (NC) siRNA (sense: UUCUCCGAACGUGUCACGUTT, antisense: ACGUGACACGUUCGGAGAATT), BACE1-siRNA (sense: GCUUUGUGGAGAUGGUGGATT, antisense: UCCACCAUCUCCACAAAGCTT), FAM-labeled siRNA and Cy3-labeled siRNA were synthesized by Genepharma Co., Ltd. (Shanghai, China). Aβ1–42 was obtained from the Chinese Peptide Company (Hangzhou, China). Series S Sensor Chip CM5 was purchased from GE Healthcare (Milwaukee, WI, USA). Trizol RNAiso plus, PrimeScript RT Master Mix kit and SYBR Premix Ex Taq II kit were ordered from Takara (Japan). Anti-BACE1 antibody (ab2077), anti-MAP2 antibody (clone AP20), and Alexa Fluor 647-labeled goat anti-rabbit lgG were purchased from Abcam (Cambridge, MA, USA). Anti-Alzheimer precursor protein A4 antibody (clone 22C11) and anti-APP-C99 antibody (clone mC99(70–80)) were obtained by Millipore (Frederick, MD, USA). Anti-Aβ1–42 primary antibody was purchased from Covance (Princeton, NJ, USA). Anti-synaptophysin1 antibody was purchased from the Bioss Company (Shanghai, China). HRP-conjugated goat anti-rabbit IgG and HRP-conjugated goat anti-mouse IgG were ordered from Abbkine (Waltham, MA, USA). Cy3-conjugated goat anti-mouse IgG was obtained from Sigma (St. Louis, MO, USA). Human/rat β-amyloid (40/42) ELISA kit was purchased from Wako (Richmond, VA, USA). The brain capillary endothelial cells (bEnd.3) and mouse neuroblastoma N2a cells (Neuro-2a) were obtained from the Chinese Academy of Sciences Cell Bank (Shanghai, China).
ICR mice (18–22 g, male) were obtained from Shanghai Sino-British Sippr/BK Lab Animal Ltd. (Shanghai, China). 3×Tg-AD mice (PS1M146V/APPSwe/tauP301L, 18 months of age), male, donated by Dr. Suzhen Dong, School of Life Sciences, East China Normal University (Shanghai, China). APP/PS1 double transgenic mice, male, B6C3-Tg (APPswe, PSEN1dE9) 85Dbo/J, were obtained from the Model Animal Research Center of Nanjing University (Nanjing, China). All animals were maintained under standard housing conditions. The animal studies were conducted in accordance with the protocols approved by institutional animal care and use committee (IACUC), School of Pharmacy, Fudan University, Shanghai, China.
2.2. Preparation and characterization of the nanocomplexes
The dual-targeting hybrid nanocomplexes (CQ/siRNA) were prepared as described previously15. Briefly, MPEG-PDMAEMA, CGN-PEG-PDMAEMA and QSH-PEG-PDMAEMA was dissolved in diethyl pyrocarbonate-treated water, respectively, followed by mixture at a ratio of 1:2:1 (v/v/v). Afterwards, the siRNA solution was added to the mixture at a N/P ratio of 10:1. Following vortex for 30 s and incubation for 20 min at room temperature, the nanocomplexes formed. The nanocomplexes containing MPEG-PDMAEMA only (M/siRNA), 50% CGN-PEG-PDMAEMA with 50% MPEG-PDMAEMA (C/siRNA), or 25% QSH-PEG-PDMAEMA with 75% MPEG-PDMAEMA (Q/siRNA) were used as controls.
The particle size and zeta potential of the nanocomplexes were determined using the dynamic light scattering technique (DLS) on a Zetasizer Nano ZS (Malvern Instruments, Ltd., UK). The morphology was observed using an atomic force microscope (AFM, Veeco, USA).
2.3. Stability test of the nanocomplexes in the blood and brain tissues
The stability of the nanocomplexes in the whole blood and brain tissues was determined using an aggregation assay16. FAM-siRNA-loaded nanocomplexes were added to the whole blood or the brain homogenate (brain:DEPC water = 1:3) at a final siRNA concentration of 3 μg/mL. Polyethylenimine (PEI 25 kD)/FAM-siRNA served as a positive control. The complexes added to PBS at the same concentration served as a negative control. The samples were incubated at 37 °C for 1 h followed by centrifugation at 5000 rpm (Eppendorf 5418 R, Germany) for 10 min. Then, 100 µL of supernatant from each sample was transferred to a black 96-well plate with clear bottom. The fluorescence was measured on a microplate reader (Synergy TM2, BIOTEK Instruments, Inc., USA) with excitation at 480 nm and emission at 520 nm (5 nm of bandwith for both excitation and emission measurements).
2.4. Surface plasmon resonance (SPR) analysis
SPR analysis was performed on a Biacore T200 instrument (GE Healthcare, USA). Aβ1–42 peptide was immobilized on sensor chip CM5 using amine-coupling chemistry17. Briefly, after surface activation with 0.2 mol/L ethyl(dimethylaminopropyl) carbodiimide (EDC) and 0.05 mol/L N-hydroxysuccinimide (NHS), the Aβ1–42 solution (100 μg/mL in acetate buffer pH4.0) was injected for 5 min at 30 μL/min, and then the remaining activated groups on chip was blocked with ethanolamine. The upstream parallel flow cell, which was immobilized with the PEI solution (470 μg/mL in acetate buffer pH 5.5) after activation with EDC/NHS and blocked by 1 mol/L of ethanolamine, was used as the reference channel. Series concentration of C/siRNA, Q/siRNA or CQ/siRNA complexes diluted with EP buffer (pH 7.4) was injected into the system for 180 s at a flow rate of 30 μL/min. After each injection, the chip surface was handled with 50 mmol/L of NaOH for 8 min before the regeneration. The kinetic constants of binding were obtained using a 1:1 Langmuir binding model via BIA evaluation software.
2.5. Evaluation of BBB penetration in vitro
2.5.1. Mechanistic study of cellular uptake
bEnd.3 cells were seeded at a density of 5×10⁴ cells/well on 24-well plates and cultured for 24 h. After a 15-min equilibration in DMEM, cells were treated with endocytosis inhibitors (chlorpromazine, monensin, brefeldin A (BFA), filipin, NaN3, genistein or colchicine) at an appropriate concentration as previously reported18. After 0.5 h, the M/siRNA, C/siRNA, Q/siRNA and CQ/siRNA complexes were added to the cells and incubated for another hour, respectively. Afterwards, the cells were washed three times with PBS. The fluorescence was measured via flow cytometry. Cells treated without inhibitors served as positive control and denoted as 100% of uptake.
2.5.2. Transport across the BBB monolayer
bEnd.3 cells were seeded at a density of 5×10⁴ cells/cm2 onto polycarbonate 24-well Transwell filters with a 0.4 μm mean pore size and 0.33 cm2 surface area (Millipore, USA). After culture for 14 days, the cell monolayer integrity was monitored using an epithelial voltohmmeter (MILLICELL®-ERS, Millipore, USA) to measure the transendothelial electrical resistance (TEER). Only cell monolayers with TEER above 300 Ω·cm2 were selected for the following experiment19.
Briefly, the monolayers were balanced with pre-warmed DMEM and 0.5 mL of DMEM was added to the basolateral compartments. DMEM (0.5 mL), containing M/FAM-siRNA, C/FAM-siRNA, Q/FAM-siRNA or CQ/FAM-siRNA complexes, was added to the apical compartments at a siRNA final concentration of 80 µg/mL per well and incubated at 37 °C. After 5, 10, 30, 60, 120, 240, 360 or 480 min, 100 μL of samples were taken from the basal compartments and the volume was replaced with equal fresh DMEM. The fluorescence of the samples was measured on a microplate reader (Synergy TM2, BIOTEK Instruments, Inc., USA).
In a parallel experiment, at 1 h after treatments the insert filters were washed 3 times with PBS and fixed with 4% paraformaldehyde for 20 min, followed by staining with 10 μg/mL of Hoechst 33342 for 10 min. Subsequently, the membrane of each insert filter was gently cut with scissors, and examined under a confocal microscope (Zeiss 710, Carl Zeiss, Germany). The penetration depth of the complexes across the BBB models was determined by z-axis scanning with the confocal microscope.
2.6. Internalization of neuronal cells
The Neuro-2a cells were seeded into a glass bottom cell culture dish (NEST, China) at a density of 5×10⁴ cells/well to 70% confluence, and incubated with CQ/Cy3-siRNA complexes (N/P=10) containing 0.5 μg of the siRNA at 37 °C for 3 h. Cells were washed with cold PBS three times, and then fixed with 4% formaldehyde solution, stained with Hoechst 33342. Confocal images were obtained by confocal laser scanning microscopy (Leica TCS SP5, Germany) under 20× objective lens.
2.7. Targeting to the neuron nearby amyloid plaques
3 × Tg-AD transgenic mice were injected with CQ/FAM-siRNA nanocomplexes via tail vein at a dose of 60 μg of siRNA per mouse. One hour later, the mice were anesthetized and sacrificed after heart perfusion with saline and 4% paraformaldehyde. The brains were obtained and immersed in 4% paraformaldehyde for 48 h, dehydrated in 15% and 30% phosphate-buffered sucrose solution subsequently. Embedded in Tissue-Tek O.C.T compound (Sakura Finetek, USA), the tissues were cryosectioned (10 μm) coronally in cerebrum and cerebellum, respectively. The slides were blocked with 10% normal goat serum for 1 h at 37 °C, and subsequently incubated with a mixture of rabbit polyclonal anti-MAP2 primary antibody (1:200 dilution) and mouse monoclonal anti-Aβ1–42 primary antibody (1:100 dilution) for 1 h at 37 °C. After washed 3 times with PBS, the sections were then incubated for 1 h at 37 °C in a mixture of Cy3-labeled sheep anti-mouse IgG (1:100 dilution) and Alexa Fluor 647-labeled goat anti-rabbit lgG (1:100 dilution). The sections were further stained with Hoechst 33342 for 10 min, and visualized under the confocal microscope.
2.8. Pharmacokinetics of the nanocomplexes
The AD mouse model was established as previously described20. Aβ1–42 was dissolved in saline (1 mg/mL) and incubated at 37 °C for 7 days to form the aggregation. ICR mice were anesthetized and fixed in a stereotaxic apparatus. Each mouse was slowly injected in the bilateral hippocampus (±1.8 mm lateral to the midline, 2.3 mm posterior to the bregma and 2.0 mm ventral to the skull surface) with Aβ1–42 aggregation (5 μL) in 5 min. The needle was then slowly withdrawn after remaining in place for 3 min.
After one week, Cy3-siRNA alone, or Cy3-siRNA-loaded nanocomplexes was i.v. injected into the mice at a dose of 1.6 mg siRNA/kg (n = 5). Then, about 100 μL of blood was collected into tubes containing heparin at 2, 5, 15, 30, 60 or 90 min from the retro-orbital plexus of the mouse eye using glass capillaries. The blood samples were centrifuged (5000 rpm, 5 min, 4 °C) and stored at –20 °C until analysis. Then, the mice were sacrificed after heart perfusion with saline. Major organs (lungs, liver, spleen, kidneys, and brain) were harvested, and stored at –80 °C. Each brain was subdivided into hippocampus and other brain regions.
To determine the siRNA accumulation in the blood or organs, 30 μL of plasma or tissue homogenate (tissue:PBS=1:5) was transferred to a black 96-well plate followed by addition with 60 μL of DEPC water. The signal of Cy3-siRNA in plasma or each tissue was detected by a microplate reader (Synergy TM2, BIOTEK Instruments, Inc., USA) at λex=550 nm and λem=570 nm, and the fluorescence of untreated sample was subtracted. Then the amount of Cy3-siRNA was calculated according to the standard curve21.
All the concentration data were normalized based on dose and weight. An average concentration of triplicate was used for data analysis. Pharmacokinetic parameters were calculated by non-compartment analysis using the WinNonlin software (Mountain View, CA, USA)22.
2.9. Spatial learning and memory retention
APP/PS1 double transgenic mice (7–8 months old) were randomly divided into 9 groups (n = 9): the AD control group (AD), the CQ/NC-siRNA group (NC, 80 µg siRNA/mouse), the M/BACE1-siRNA group (M, 80 µg siRNA/mouse), the Q/BACE1-siRNA group (Q, 80 µg siRNA/mouse), the C/BACE1-siRNA middle-dose (CM, 50 µg siRNA/mouse) and high-dose (CH, 80 µg siRNA/mouse) group, the CQ/BACE1-siRNA low-dose (CQL, 30 µg siRNA/mouse), middle-dose (CQM, 50 µg siRNA/mouse) and high-dose (CQH, 80 µg siRNA/mouse) group. Wild-type littermates served as controls. Each group was intravenously administered with the preparations or saline every 5 days. Behavioral testing was performed 2 days after 4 times of the administration (Supporting Information Fig. S1).
Spatial learning and memory retention of AD mice were determined by the Morris water maze (MWM) test. The apparatus consisted of a 1.2 m-diameter, 50 cm-deep circular tank, filled with white painted water maintained at 22±1 °C. The location of the 9 cm-diameter white platform was in the southeast quadrant (this position remained constant throughout testing) and 1.5 cm beneath the surface of the water. Several visual cues were fixed at distinct positions around the pool.
During the orientation navigation experiment, each mouse was given four consecutive trials per day for 6 days. The mice began each trial in one of four randomly alternated starting points, facing the wall of the pool, to search the invisible platform. The time that it took the mice to find the platform was recorded, with a cutoff time of 60 s. Mice failed to find the platform within 60 s were guided to the platform by the researcher and kept there for 20 s, and the escape latency was recorded as 60 s.
Short-term retention of the spatial training was assessed in probe trial conducted 1 h after the last acquisition trial. The platform was removed, and the mice were free to swim in the tank for 60 s. The behavioral data were acquired and analyzed using a computerized video tracking system.
2.10. Quantification of BACE1 mRNA using real-time PCR
Animals (n = 6) in each group were anesthetized and transcardially perfused with saline after the behavioral assessment. Brains were rapidly removed and cut sagittally. Total RNA from hemi-brains was extracted utilizing Trizol RNAiso plus and reverse-transcribed into cDNA using a PrimeScript RT Master Mix kit. PCR amplification reactions were performed using a Bio-Rad iQ iCycler detection system with the SYBR green detection method. The expression of the specific BACE1 transcripts was normalized against the expression of β-actin. The specific primer (Invitrogen, USA) sequences used in this study were as follows23: BACE1: F, GCTGCAGTCAAGTCCATCAA; R, ATTGCTGAGGAAGGATGGTG; and β-actin: F, CCACACCCCGCCAGTTC; R, GACCCATACCCACCATCACACC.
2.11. Western blotting analysis
Previously obtained brain tissues (80–90 mg) were homogenized in RIPA lysis buffer and centrifuged at 12,000 rpm, 4 °C for 15 min. Protein concentration of the supernatant was determined by the Bradford assay. Equal amounts of protein from each sample were subjected to SDS-polyacrylamide gel electrophoresis at a constant voltage (80 V) and subsequently transferred to a PVDF membrane (pore size of 0.2 mm, Millipore) at 290 mA for 1.5 h. After blocked in Tris-buffered saline containing 5% (w/v) bovine serum albumin for 1.5 h at room temperature, membranes were incubated in the following primary antibodies, respectively: anti-BACE1 antibody (1:5000 dilution), anti-Alzheimer precursor protein A4 antibody (1:2000 dilution), anti-APP-C99 antibody (1:2000 dilution), anti-synaptophysin1 antibody (1:500). Then, the membranes were washed in TBST buffer 3 times and then incubated for 1 h with the appropriate HRP-conjugated secondary antibody (1:2000 dilution). Followed by another 30 min wash, blots were developed using Immobilon Western ECL reagent (Millipore, USA). β-Actin was used for standardization of the samples.
2.12. ELISA of Aβ1–40 and Aβ1–42
Soluble Aβ1–40 and Aβ1–42 were extracted as described by Oddo et al.24, with modifications for the ELISA kit. Previously obtained brain tissues (~100 mg) were homogenized in 1 mL of RIPA buffer supplemented with 100× protease inhibitor cocktail (Sigma). The resulting homogenate was centrifuged at 10,000 rpm for 20 min. Soluble Aβ1–40 and Aβ1–42 in the supernatant were measured using human/rat β-amyloid (40/42) ELISA kit according to its standard protocol.
2.13. Immunofluorescence and immunohistochemistry of the plaques
Mice in each group (n=3) were sacrificed after the MWM experiment. For immunofluorescence, the brains were frozen sectioned and plaques were stained using the same method as described in Section 2.7, except that the primary antibody was anti-Aβ1–16 antibody (1:200 dilution), the second antibody was Cy3-labeled sheep anti-mouse IgG (1:200 dilution).
For immunohistochemistry, mouse hemi-brains were fixed in 4% paraformaldehyde overnight, embedded in paraffin, and cut into 6 μm sections. Sections were deparaffinized, rehydrated, and heated in citrate buffer (pH 6.0) to 95 °C to assist in antigen retrieval. After being blocked with a solution containing 5% BSA, 5% goat serum and 0.1% NaN3, the sections were incubated with anti-Aβ1–16 antibody (1:200 dilution) at 37 °C for 1 h, followed by HRP-conjugated instead of Cy3-labeled (1:1000 dilution) for another 1 h. Then, plaques were visualized using the DAB reagent and analyzed using ImageJ (NIH, USA).
2.14. Histology
Mouse brains sections in each group were stained with Hematoxylin and eosin (H&E) using routine protocols. The hippocampal areas were examined under a Leica optical microscope (Leica, Germany).
2.15. In vivo biocompatibility
The AD mice in each group (n=6) were sacrificed after the behavior test. Blood samples were collected and determined using automatic blood cell counter (MEK-722K, Nihon Konden, Japan) and automatic biochemical analyzer (Olympus AU 640, Olympus Optical, Japan). The hematological and biochemical parameters examined in this study included the white blood cell (WBC) count, red blood cell (RBC) count, platelet (PLT) count, neutrophils (NEUT) count, lymphocytes (LYMPH) count, mononuclear macrophages (MONO) count, and alanine aminotransferase (ALT) levels, aspartate aminotransferase (AST) levels, alkaline phosphatase (ALP) levels, total bilirubin (BILT) levels, blood urea nitrogen (BUN) levels and creatinine (CREA) levels. Organs including heart, liver, spleen, lung and kidney were harvested for H&E staining.
2.16. Statistical analysis
Except specific notification, all the data are presented as the mean ± standard deviation (SD). One-way ANOVA, followed by Dunnett post hoc analysis was used for multi-group comparison. Student׳s t-test was used for two-group comparison. The level of statistical significance was set at P < 0.05.
3. Results and discussion
3.1. Characterization of the nanocomplexes
The nanocomplexes loading siRNAs against BACE1 were approximately 70 nm in diameter with zeta potential of around +8 mV (Supporting Information Table S1). The preparations appeared to be compacted structure and a kind of analogous spherical shape (Fig. 2A). The prepared mono and dual targeting nanocomplexes did not show significant difference in the morphology, size distribution or zeta potential.
Figure 2.

Characterization of the preparations. (A) Atomic force micrographs of the M/siRNA, C/siRNA, Q/siRNA or CQ/siRNA complexes. (B) Whole blood aggregation assay of nanocomplexes loading FAM-siRNA following incubation with FBS at 37 °C for 1 h. Following centrifugation, the percentage of the supernatant fluorescence represented the FBS-stabilized nanocomplexes. Data are presented as mean±SD (n=6); *P<0.05, compared with the CQ/siRNA complexes. (C) Concentration-dependent binding of C/siRNA, Q/siRNA or CQ/siRNA complexes to Aβ1–42. The binding affinity was evaluated by surface plasmon resonance (SPR) analysis. The kinetic constants of binding were obtained using a 1:1 Langmuir binding model via the BIA evaluation software.
3.2. Stability of the complexes in the blood and brain tissues
For the stability test, the FAM-labeled nanocomplexes were incubated in mouse blood followed by centrifugation. Compared with PEI/FAM-siRNA which remained only 64.41±3.03% in plasma supernatant, the four formulations had no aggregations or interaction with red blood cells (Fig. 2B). The lack of interaction between the positively charged complexes and negatively charged blood cells is most likely due to the presence of the hydrophilic PEG shell. Its shielding greatly reduces the zeta potential of the nanocomplex (CQ +8 mV vs. PEI +37 mV). These results demonstrated that the CQ/siRNA nanocomplexes did not aggregate in the blood after the injection. Similarly, following incubation with brain homogenate at 37 °C for 1 h, more than 90% of the complexes still remained (Supporting Information Fig. S2), exhibiting good stability in brain tissues.
3.3. Nanocomplexes bind to Aβ1–42
To reach the sites of AD lesions efficiently, nanocomplexes that possess highly specific affinity with Aβ plaque are desired25. It has been reported that QSH peptide could bind Aβ1–42 with a dissociation constant in the submicromolar range26. However, whether its binding to Aβ1–42 still remained in high affinity after conjugation with the nanocomplexes needed to be confirmed. In this study, we conducted an SPR analysis to investigate the binding affinity of the nanocomplexes to Aβ1–42. Aβ1–42 was immobilized onto the flow cell of a CM5 chip via the amide bond. The reference flow cell was pre-blocked with PEI polymer to prevent the non-specific binding between the cationic polymers (PEG-PDMAEMA) and the flow cell. The binding and dissociation constant of the nanocomplexes (Supporting Information Table S2) were kinetically analyzed using a 1:1 Langmuir binding model to obtain the values of the binding affinity constant (KD). As shown in Fig. 2C, the KD value of Q/siRNA was 1.42 nmol/L, which was 30 times less than that of C/siRNA (42.2 nmol/L), indicating that the nanocomplex modified with QSH exhibited a stronger Aβ-binding capacity. The KD value of CQ/siRNA was similar to that of Q/siRNA, suggesting that the modification of CGN did not affect the binding of QSH to Aβ1–42. Therefore, CQ/siRNA is likely to increase gene accumulation in the AD lesions after systemic delivery.
3.4. Ability of brain penetration in vitro
3.4.1. Mechanism of cellular uptake
A series of uptake inhibitors was used to elucidate the cellular uptake pathway of the four complexes in mouse brain capillary endothelial cell line bEnd.3. The process of cellular uptake of the complexes generally involved several basic mechanisms, caveolae-mediated endocytosis, clathrin-mediated endocytosis, micropinocytosis, clathrin and caveolae-independent endocytosis. Among them, caveolae-mediated endocytosis is the endocytic pathway able to avoid transferring the nanocarriers to lysosomes and to achieve the transcellular transport27. As shown in Fig. 3A, the fluorescence signal of C/siRNA or CQ/siRNA decreased dramatically (below 50%) in the presence of the caveolae inhibitor filipin and lipid rafts inhibitor genistein, indicating the involvement of caveolae-mediated endocytosis. The internalization of CQ/siRNA complexes was also partially dependent on clathrin-mediated endocytosis rather than micropinocytosis, since chlorpromazine (clathrin-mediated endocytosis inhibitor) instead of colchicine (a microfilament inhibitor), markedly inhibited the uptake of the complexes. It was most likely that the particle size of CQ/siRNA complexes was less than 100 nm. Micrometer-sized particles are generally known to be internalized by cells via micropinocytosis28. In addition, the internalization of CQ/siRNA complex was energy-dependent (NaN3). Golgi apparatus (BFA) and lysosomes (monensin) participated as well.
Figure 3.

Ability of brain penetration in vitro. (A) Cellular uptake of M/FAM-siRNA (M), C/FAM-siRNA (C), Q/FAM-siRNA (Q) and CQ/FAM-siRNA (CQ) by bEnd.3 cells for 1 h in presence of chlorpromazine, monensin, filipin, genistein, brefeldin A (BFA), colchicine and NaN3, respectively. Control, cellular uptake of each nanocomplex in absence of the inhibitor was set as 100%. Data are presented as mean±SD (n=3); *P < 0.05, compared with the control. (B) Confocal micrographs of the penetration depth of the FAM-labeled nanocomplexes through the in vitro BBB model. Images were scanned from the apical side (top) to the basolateral side (bottom) of the monolayer. Bar, 10 μm. (C) Cumulative transport of the FAM-labeled nanocomplexes across bEnd.3 monolayers. Data are presented as mean±SD (n=3).
3.4.2. Transportation across the BBB monolayer
We next investigated the ability of the FAM-labeled siRNA nanocomplexes across the BBB monolayer. Both quantitative and qualitative (Fig. 3B and C) analysis demonstrated that C/siRNA or CQ/siRNA displayed better penetration ability (2.1–2.6-fold) than M/siRNA or Q/siRNA. The enhanced BBB penetration of C/siRNA or CQ/siRNA nanocomplexes was attributed to the CGN peptide, indicating that CGN had high brain targeting and facilitated the penetration of nanoparticles into brain in vivo.
3.5. Accumulation of the nanocomplexes in the neurons near the amyloid plaques
BACE1 is the major β-secretase in vivo29 and its levels are the highest in central neurons30. To achieve effective BACE1 silencing in the target cells, CQ/siRNA nanocomplexes are required to enter the neurons near the amyloid plaques. Therefore, we firstly tested the internalization of the CQ complexes by neuron cells Neuro-2a. Confocal microscopy observation showed that the CQ complexes were able to be internalized into neurons with strong red fluorescence around the nuclei after 3-h incubation (Fig. 4A).
Figure 4.

Cellular internalization and accumulation of the nanocomplexes in the neurons near the amyloid plaques. (A) Neuro-2a cells were observed using confocal microscopy after incubated with CQ/siRNA nanocomplexes for 3 h at 37 °C. Red, Cy3-labeled nanocomplexes; blue, nuclei stained by Hoechst 33342. Bar, 200 μm. Representative confocal micrographs of distribution of the CQ/FAM-siRNA nanocomplexes in the hippocampus (B) and cerebellum (C) of 3× Tg-AD mice at 1 h following i.v. administration (10×). (D) A representative region of hippocampus (20×). The images below were the enlarged regions of the white boxes in the image above. Green, FAM-labeled nanocomplexes. Red, amyloid plaque stained with anti-Aβ1–42 antibody. Blue, neurons stained with anti-MAP2 antibody; purple, nuclei stained with Hoechst 33342. Bar, 200 µm.
Next, we performed a fluorescence observation of the mouse hippocampus and cerebellum after the i.v. injection of CQ/siRNA complexes to 3×Tg-AD mice. As shown in Fig. 4B–D, the Aβ plaques stained in red were apparent in the CA1 and dentate gyrus subfields of the hippocampus in the mice compared with the cerebellum region. The CQ complexes containing FAM-labeled siRNA (CQ/FAM-siRNA) mainly concentrated on the neurons (blue) surrounding the amyloid plaque. Our previous study had demonstrated that CQ/siRNA crossed the BBB in an intact form15. This was beneficial to further target the amyloid plaques mediated by QSH on the surface of the complexes. It is recognized that amyloid plaques, mainly deposit in the cerebral cortex and hippocampus, are around neurons31., 32.. Therefore, as the results shown, when the nanocomplexes were distributed in the hippocampus, CQ/siRNA would preferentially concentrate in Aβ-associated neurons, which could increase gene accumulation in the AD lesion to produce a better therapeutic effect.
3.6. In vivo distribution of nanocomplexes in AD model mice
To examine the circulation of nanocomplexes in the blood, Cy3-siRNA alone or M/Cy3-siRNA, C/Cy3-siRNA or CQ/Cy3-siRNA were intravenously injected to ICR mice. The amounts of Cy3-siRNA in the blood were analyzed by measurement of fluorescence intensity. As shown in Fig. 5A, naked siRNA was completely cleared at 30 min post-injection, suggesting naked siRNA was vulnerable to degradation in the blood. The clearance of the three complexes in the blood was slower than that of naked siRNA, and their blood AUC0–90min was about twice that of the naked siRNA. There were no significant differences in the pharmacokinetic parameters among the three complexes (Table 1).
Figure 5.

Pharmacokinetics of the naked siRNA or nanocomplexes. (A) Concentration vs. time curves of Cy3-siRNA in the blood. Mice were i.v. injected with naked Cy3-siRNA (siRNA), M/Cy3-siRNA (M), C/Cy3-siRNA (C), and CQ/Cy3-siRNA (CQ) at a dose of 1.6 mg/kg. Data are presented as mean±SD (n=5). The distribution of naked Cy3-siRNA and the three complexes in major organs (B) and brain (C) at 90 min after intravenous injection. Data are presented as mean±SD (n=5). *P<0.05, compared with the M/siRNA group; ▲P<0.05, compared with the C/siRNA group.
Table 1.
Pharmacokinetic parameters of naked siRNA, M/siRNA, C/siRNA, and CQ/siRNA.
| siRNA | M/siRNA | C/siRNA | CQ/siRNA | |
|---|---|---|---|---|
| AUC0–90 (min ng/mL) | 59,078±6092 | 12,2765±4344* | 121531±2256* | 119470±7470* |
| T1/2 (min) | 5.3±0.5 | 14.6±0.2* | 15.3±1.1* | 14.7±1.1* |
| MRT (min) | 5.2±0.6 | 15.6±0.6* | 15.1±0.6* | 14.5±2.2* |
| Vz (mL) | 3.96±0.62 | 5.35±0.28* | 5.16±0.10* | 5.30±0.42* |
| CL (mL/min) | 0.52±0.05 | 0.25±0.02* | 0.24±0.02* | 0.26±0.01* |
Data are presented as mean±SD (n=5).
AUC, area under time concentration curve; MRT, mean residence time; Vz, apparent volume of distribution; CL, clearance.
P < 0.05, compared with siRNA group.
Following intravenous administration, the nanocomplexes were mainly distributed in liver, kidney or spleen (Fig. 5B). There was no significant difference in the concentration of the three nanocomplexes in these organs (P>0.05), indicating that the modification of CGN/QSH did not affect the distribution of the nanocomplexes in major organs.
To quantify the amount of CQ/siRNA to deliver specifically to the AD lesions, AD mouse model was constructed by injecting Aβ1–42 in the bilateral hippocampus. The concentration of the naked Cy3-siRNA in each brain tissue was very low, while the nanocomplexes had significantly higher brain accumulation (Fig. 5C). Ninety minutes after the injection, the concentrations of C/siRNA and CQ/siRNA (1.9% ID/g-brain) were 1.95 times higher than that of M/siRNA in the brain area without hippocampal. In the hippocampus, the highest uptake of Cy3-siRNA was achieved in the CQ/siRNA-treated group (1018 ng/g, equal to 3.18% ID/g-hippocampus), which was 2.39 and 3.92 times as high as that of C/siRNA (426 ng/g) and M/siRNA (260 ng/g), respectively. This result was consistent with the higher Aβ42 affinity of the QSH-conjugated nanocomplexes identified by SPR analysis, suggesting that QSH modification can direct the nanocomplexes to AD lesions—amyloid plaques.
3.7. Inhibition of Aβ production in vivo
As the rate-limiting enzyme of the amyloidogenic processing of amyloid precursor protein (APP), BACE1 is one of the prime targets for AD therapies, with several inhibitors currently undergoing clinical trials33., 34., 35.. BACE1 is largely produced through the translation of the BACE1 mRNA, which cleaves APP to sAPPβ and a membrane-bound C-terminal fragment called C99. C99 is further cleaved by the γ-secretase to generate Aβ36. In order to test that CQ/siRNA could relieve the Aβ burden through the silence of BACE1 gene, we measured the BACE1 mRNA levels, the protein levels of BACE1, sAPPβ, C99, Aβ1–40 and Aβ1–42 (Fig. 6). Compared with the wild group, all the biochemical indexes in APP/PS1 mice were remarkably higher. Treatment with CQ/NC-siRNA had no influence on these biomarkers, suggesting no off-target effect. The M/siRNA or Q/siRNA treatment group exhibited limited amelioration, which might be attributed to their poor brain penetration (Fig. 3B–C). Further, the C/siRNA or CQ/siRNA groups reduced the expression of these biomarkers in a dose-dependent manner. Notably, the soluble Aβ1–42 levels in the CQL group (30 μg siRNA/mouse) were similar to those in the CH group (80 μg siRNA/mouse), indicating the superior effect of the dual-targeting complexes on in vivo gene knock-down. Furthermore, after treatment with high-dose of CQ/siRNA, these biomarkers were reduced to the same level as those in wild-type control. These results revealed that CQ/siRNA efficiently inhibited the expression of BACE1 and its downstream pathway.
Figure 6.

Inhibition of brain Aβ production in vivo. APP/PS1 double transgenic mice (7–8 months) were i.v. administered with the preparations or saline every 5 days. Wild-type littermates were used as controls (Wild). Real-time PCR analysis of BACE1 mRNA (A), Western blotting analysis of BACE1, sAPPβ, synaptophysin (SYAP) and C99 (B), as well as ELISA analysis of Aβ40 (C) and Aβ42 (D) of brain of mice following the above treatment. Data are presented as mean±SD (n=6). *P<0.05, compared with the AD group.
3.8. Relief of amyloid plaque burden in vivo
We next measured the amyloid plaques of the AD transgenic mice following the nanocomplexes treatment. As shown in Fig. 7, without treatment the AD transgenic mice developed detectable plaques in the cortex. Compared with AD group, the CQ/NC-siRNA group (NC) or the M/siRNA-treated group did not exhibit obvious pathologic changes. Whereas, the percentage of brain area occupied by amyloid plaques were reduced 54.93–95.49% in the C/siRNA or CQ/siRNA groups. Specifically, mice treated with CQH/siRNA exhibited few plaques in the brain. Similar phenomena have also been observed in the hippocampus (Supporting Information Fig. S3). These results in line with the above biomarker test proved that the CQ/siRNA nanocomplexes inhibit the progression of amyloid plaque formation through silencing the BACE1 gene. On the other hand, Thakker et al.37 had demonstrated that chronically administered BACE1 inhibitor could activate microglia, increase amyloid clearance by phagocytosing brain Aβ. Accordingly, CQ/siRNA treatment reduced Aβ production, when combined with enhanced amyloid clearance, thus effectively relieved the amyloid plaque burden in APP/PS1 mice.
Figure 7.

Reduction of amyloid plaques deposits in cortex region. Representative images were obtained from APP/PS1 double transgenic mice (7–8 months) treated with preparations or saline for every 5 days. Wild-type littermates were used as controls (Wild). Immunochemistry using anti-Aβ1–16 primary antibody revealed β-amyloid deposits (arrows). Cell nuclei were counterstained in blue. Bar, 200 µm. Semi-quantification of the percentage of amyloid plaques normalized with respect to the image field area was conducted by using Image J software. All quantification data was obtained from 4–6 brain sections. Data are presented as mean±SD. *P<0.05, compared with the AD group.
3.9. Neuroprotective ability of the formulation
Synaptic dysfunction and failure that compromises the neuronal network׳s functional capacity in the AD brain leads to the cognitive deficits38. Loss of synapse proteins, such as the presynaptic marker synaptophysin, is a feature of synaptic dysfunction39., 40.. Fig. 6B showed that the AD transgenic mice exhibited low synaptophysin level compared with wild-type. The CQ/NC-siRNA or M/siRNA had little to no improvement. Q/siRNA, C/siRNA or CQ/siRNA treatment prevented the loss of synaptophysin in the brains of the transgenic mice. Mice treated with CQ/siRNA at all doses had an excellent ability to increase the synaptophysin level.
H&E staining demonstrated marked neuronal damage, including neuronal loss, cell shrinkage and nuclear condensation in AD transgenic mice treated with saline, CQ/NC-siRNA, M/siRNA or Q/siRNA (representative images in Fig. 8). In C/siRNA treated groups, the loss of nerve cells was relieved, but cell shrinkage was observed. By contrast, following treatment with CQ/siRNA the remission effect on neuron damage was more obvious. In particular, in the groups treated with medium or high doses of CQ/siRNA, neurons were neatly arranged in complete shape and uniform color (light blue-purple), indicating that CQ/siRNA protected neurons from being impaired.
Figure 8.

Neuroprotective effect of the nanocomplexes. Representative images of H&E staining of the hippocampus regions from the APP/PS1 transgenic mice treated with the preparations or saline. Wild-type littermates served as controls (Wild). Images in lower row of each group were the enlarged regions of the red boxes in the upper images. The neuronal damage was characterized by neuronal loss, cell shrinkage, nuclear condensation and fragmentation (Cells were deeply stained with dark blue-purple). Bar, 50 μm.
3.10. Improvement of cognitive performance in APP/PS1 mice
To test the cognitive performance in APP/PS1 mice, we used APPswe+PSEN1dE9 bigenic mouse in 7–8 months of age. Spatial retention deficits occur in the brain of this strain since 7-month-old41, which mimics spatial learning deficits in patients with mild cognitive impairment42.
The escape latency of each group in the orientation navigation experiment was shown as Fig. 9A. During the six-day training process, AD transgenic mice treated with CQ/NC-siRNA, M/siRNA or Q/siRNA showed no or slightly improved spatial learning and memory in terms of escape latency (P>0.05 for NC (80), M (80) group vs. AD group on all training days; P<0.05 for Q(80) group vs AD group only on day 6). By contrast, mice administered with C/siRNA or CQ/siRNA were able to learn the MWM task, because the average escape latency for these groups on the fifth or sixth days were significantly shorter than that of AD transgenic mice, especially in CQ/siRNA groups. Notably, CQ/siRNA at the low dose had a similar efficiency with the C/siRNA treatment at the high dose. The CQH treatment group even had a shorter latency than wild-type mice.
Figure 9.

Improvement of cognitive performance in APP/PS1 mice treated with nanocomplexes. (A) Time courses of spatial learning and memory acquisition by the Morris water maze (MWM) test. The mice (7–8 months) were i.v. administered with the preparations or saline every 5 days for 4 times and trained in the MWM. Wild-type littermates were used as controls (Wild). Each mouse performed four training trials per day for 6 consecutive days. The latencies in seconds for each animal to reach a platform hidden under opaque water per day were averaged. (B) Percentage of distance in a virtual target zones (10 [Zone I] and 15 [Zone II] cm in radius, centered on the former platform location) during the 60-s test. Memory retention was assessed in probe trials conducted 1 h after the last training trials. Data are presented as mean±SEM (n=9). *P<0.05, compared with the AD group. ▼P<0.05, compared with the Wild group.
To determine the effect of the complexes treatment on short-term spatial memory retention, the platform was removed and spatial bias for the previous platform location in the MWM was analyzed in probe trials conducted at 1 h after the last training trial. Several measures such as the percentage of distance around the former platform, swimming trace, the number of previous platform crossing and percent time in a virtual quadrant43, were used to evaluate the performance of APP/PS1 mice in the probe test. As shown in Fig. 8B, Zone I represented the region <10 cm apart from the platform, while Zone II represented the region <15 cm apart from it44. The percentage of distance in Zone I and Zone II of wild-type mice were around 10% and 20%, respectively, while those of AD transgenic mice were <5% and <10%, respectively. CQ/NC-siRNA, M/siRNA, Q/siRNA or C/siRNA treatment at the medium dose had no significant effect on the index. However, C/siRNA at the high dose or CQ/siRNA could prevent loss of short-term memory retention in the APP/PS1 mice. CQ/siRNA exhibited a superior improvement to C/siRNA. Mice treated with high dose of CQ/siRNA showed similar percentage of distance in Zone I or Zone II with the wild-type controls. The same results were observed in the swimming trace (Supporting Information Fig. S4A), times of crossing (Fig. S4B) and retention time measures (Fig. S4C).
Collectively, the above results supported that CQ/siRNA therapy effectively protected neurons and prevented AD-associated cognitive decline.
3.11. Biocompatibility of the nanocomplexes
Since AD therapy requires long-term and repeated treatment, the in vivo biocompatibility of the CQ/siRNA complexes was critical for the safety evaluation. Treatment with the CQ/siRNA (80 μg/mice, i.v.) for 4 times did not induce alterations to tissues of major organs in morphology (Fig. 10), or to hematology (Supporting Information Table S3). None of the treated animals presented significant alterations to hepatic enzyme function or kidney function investigated (Supporting Information Table S4), revealing that all complexes had good biocompatibility under the tested conditions.
Figure 10.

In vivo biocompatibility of APP/PS1 mice treated with nanocomplexes. H&E staining of heart, liver, spleen, lung, or kidney of AD mice following treatment with M/siRNA (M), C/siRNA (C), Q/siRNA (Q) and CQ/siRNA (CQ) at the dose of 80 µg/mice for 4 times, respectively. Wild-type mice were used as controls. Bar, 100 µm.
4. Conclusions
Our findings confirmed that the CQ/siRNA complexes penetrate the BBB and specifically deliver siRNA to the neurons near the amyloid plaques. The complexes did not only reduce the production of plaques, but also slowed down the neurodegeneration process, thus promoting the cognitive performance of AD transgenic mice. In addition, CQ/siRNA even at the dose of 80 μg/mice did not cause organ pathological changes, exhibiting good biocompatibility. Collectively, the CQ/siRNA nanocomplexes demonstrated improved siRNA therapeutics for AD treatment.
Acknowledgments
This work was supported by the National Natural Science Foundation of China (Nos. 81473150 and 81273461), Major Program of National Natural Science Foundation of China (No. 81690263) and the National Basic Research Program of China (No. 2013CB932500).
Footnotes
Peer review under responsibility of Institute of Materia Medica, Chinese Academy of Medical Sciences and Chinese Pharmaceutical Association.
Supplementary data associated with this article can be found in the online version at https://doi.org/10.1016/j.apsb.2018.12.010.
Contributor Information
Wei Lu, Email: wlu@fudan.edu.cn.
Qizhi Zhang, Email: qzzhang@fudan.edu.cn.
Appendix A. Supplementary material
Supplementary material
.
References
- 1.Prince M., Wimo A., Guerchet M., Ali G., Wu Y., Prina M. Alzheimer׳s Disease International; London: 2015. World Alzheimer report 2015. The global impact of dementia. An analysis of prevalence, incidence, cost and trends. Available form: 〈https://www.alz.co.uk/research/WorldAlzheimerReport2015.pdf〉. [Google Scholar]
- 2.Wortmann M. Dementia: a global health priority-highlights from an ADI and world health organization report. Alzheimers Res Ther. 2012;4:40. doi: 10.1186/alzrt143. [DOI] [PMC free article] [PubMed] [Google Scholar]
- 3.Peng Y., Li P.P., Li L., Zhang Y., Hou W.Z., Cui D.D., Li J., Wang L., Wang Q.L., Wang X.L. Progress of clinical trials in Alzheimer׳s disease drugs. Acta Pharm Sin. 2016;51:1185–1195. [PubMed] [Google Scholar]
- 4.Lacor P.N., Buniel M.C., Furlow P.W., Clemente A.S., Velasco P.T., Wood M. Aβ oligomer-induced aberrations in synapse composition, shape, and density provide a molecular basis for loss of connectivity in Alzheimer׳s disease. J Neurosci. 2007;27:796–807. doi: 10.1523/JNEUROSCI.3501-06.2007. [DOI] [PMC free article] [PubMed] [Google Scholar]
- 5.Palop J.J., Mucke L. Amyloid-β-induced neuronal dysfunction in Alzheimer׳s disease: from synapses toward neural networks. Nat Neurosci. 2010;13:812–818. doi: 10.1038/nn.2583. [DOI] [PMC free article] [PubMed] [Google Scholar]
- 6.Karran E., Mercken M., De Strooper B. The amyloid cascade hypothesis for Alzheimer׳s disease: an appraisal for the development of therapeutics. Nat Rev Drug Discov. 2011;10:698–712. doi: 10.1038/nrd3505. [DOI] [PubMed] [Google Scholar]
- 7.Balducci C., Mancini S., Minniti S., La Vitola P., Zotti M., Sancini G. Multifunctional liposomes reduce brain β-amyloid burden and ameliorate memory impairment in Alzheimer׳s disease mouse models. J Neurosci. 2014;34:14022–14031. doi: 10.1523/JNEUROSCI.0284-14.2014. [DOI] [PMC free article] [PubMed] [Google Scholar]
- 8.Choong C.J., Baba K., Mochizuki H. Gene therapy for neurological disorders. Expert Opin Biol Ther. 2016;16:143–159. doi: 10.1517/14712598.2016.1114096. [DOI] [PubMed] [Google Scholar]
- 9.O׳Connor D.M., Boulis N.M. Gene therapy for neurodegenerative diseases. Trends Mol Med. 2015;21:504–512. doi: 10.1016/j.molmed.2015.06.001. [DOI] [PubMed] [Google Scholar]
- 10.Carty N., Nash K.R., Brownlow M., Cruite D., Wilcock D., Selenica M.L. Intracranial injection of AAV expressing NEP but not IDE reduces amyloid pathology in APP+PS1 transgenic mice. PLoS One. 2013;8:e59626. doi: 10.1371/journal.pone.0059626. [DOI] [PMC free article] [PubMed] [Google Scholar]
- 11.Pérez-González R., Alvira-Botero M.X., Robayo O., Antequera D., Garzón M., Martín-Moreno A.M. Leptin gene therapy attenuates neuronal damages evoked by amyloid-β and rescues memory deficits in APP/PS1 mice. Gene Ther. 2014;21:298–308. doi: 10.1038/gt.2013.85. [DOI] [PubMed] [Google Scholar]
- 12.Wilson J.M. Lessons learned from the gene therapy trial for ornithine transcarbamylase deficiency. Mol Genet Metab. 2009;96:151–157. doi: 10.1016/j.ymgme.2008.12.016. [DOI] [PubMed] [Google Scholar]
- 13.Castanotto D., Rossi J.J. The promises and pitfalls of RNA-interference-based therapeutics. Nature. 2009;457:426–433. doi: 10.1038/nature07758. [DOI] [PMC free article] [PubMed] [Google Scholar]
- 14.Alam M.I., Beg S., Samad A., Baboota S., Kohli K., Ali J. Strategy for effective brain drug delivery. Eur J Pharm Sci. 2010;40:385–403. doi: 10.1016/j.ejps.2010.05.003. [DOI] [PubMed] [Google Scholar]
- 15.Zheng X., Pang X., Yang P., Wan X., Wei Y., Guo Q. A hybrid siRNA delivery complex for enhanced brain penetration and precise amyloid plaque targeting in Alzheimer׳s disease mice. Acta Biomater. 2017;49:388–401. doi: 10.1016/j.actbio.2016.11.029. [DOI] [PubMed] [Google Scholar]
- 16.Miteva M., Kirkbride K.C., Kilchrist K.V., Werfel T.A., Li H., Nelson C.E. Tuning PEGylation of mixed micelles to overcome intracellular and systemic siRNA delivery barriers. Biomaterials. 2015;38:97–107. doi: 10.1016/j.biomaterials.2014.10.036. [DOI] [PMC free article] [PubMed] [Google Scholar]
- 17.Song Q., Huang M., Yao L., Wang X., Gu X., Chen J. Lipoprotein-based nanoparticles rescue the memory loss of mice with Alzheimer׳s disease by accelerating the clearance of amyloid-β. ACS Nano. 2014;8:2345–2359. doi: 10.1021/nn4058215. [DOI] [PubMed] [Google Scholar]
- 18.Zheng X., Zhang C., Guo Q., Wan X., Shao X., Liu Q. Dual-functional nanoparticles for precise drug delivery to Alzheimer׳s disease lesions: targeting mechanisms, pharmacodynamics and safety. Int J Pharm. 2017;525:237–248. doi: 10.1016/j.ijpharm.2017.04.033. [DOI] [PubMed] [Google Scholar]
- 19.Guarnieri D., Falanga A., Muscetti O., Tarallo R., Fusco S., Galdiero M. Shuttle-mediated nanoparticle delivery to the blood–brain barrier. Small. 2013;9:853–862. doi: 10.1002/smll.201201870. [DOI] [PubMed] [Google Scholar]
- 20.Zhang C., Wan X., Zheng X., Shao X., Liu Q., Zhang Q. Dual-functional nanoparticles targeting amyloid plaques in the brains of Alzheimer׳s disease mice. Biomaterials. 2014;35:456–465. doi: 10.1016/j.biomaterials.2013.09.063. [DOI] [PubMed] [Google Scholar]
- 21.Aldrian G., Vaissière A., Konate K., Seisel Q., Vivès E., Fernandez F. PEGylation rate influences peptide-based nanoparticles mediated siRNA delivery in vitro and in vivo. J Control Release. 2017;256:79–91. doi: 10.1016/j.jconrel.2017.04.012. [DOI] [PubMed] [Google Scholar]
- 22.Heatherington A.C., Vicini P., Golde H. A pharmacokinetic/pharmacodynamic comparison of SAAM II and PC/WinNonlin modeling software. J Pharm Sci. 1998;87:1255–1263. doi: 10.1021/js9603562. [DOI] [PubMed] [Google Scholar]
- 23.Yu C.J., Liu W., Chen H.Y., Wang L., Zhang Z.R., BACE1 R.N.A. interference improves spatial memory and attenuates Aβ burden in a streptozotocin-induced tau hyperphosphorylated rat model. Cell Biochem Funct. 2014;32:590–596. doi: 10.1002/cbf.3055. [DOI] [PubMed] [Google Scholar]
- 24.Oddo S., Caccamo A., Shepherd J.D., Murphy M.P., Golde T.E., Kayed R. Triple-transgenic model of Alzheimer׳s disease with plaques and tangles: intracellular Aβ and synaptic dysfunction. Neuron. 2003;39:409–421. doi: 10.1016/s0896-6273(03)00434-3. [DOI] [PubMed] [Google Scholar]
- 25.Huang M., Hu M., Song Q., Song H., Huang J., Gu X. GM1-modified lipoprotein-like nanoparticle: multifunctional nanoplatform for the combination therapy of Alzheimer׳s disease. ACS Nano. 2015;9:10801–10816. doi: 10.1021/acsnano.5b03124. [DOI] [PubMed] [Google Scholar]
- 26.Wiesehan K., Buder K., Linke R.P., Patt S., Stoldt M., Unger E. Selection of d-amino-acid peptides that bind to Alzheimer׳s disease amyloid peptide Aβ1-42 by mirror image phage display. Chembiochem. 2003;4:748–753. doi: 10.1002/cbic.200300631. [DOI] [PubMed] [Google Scholar]
- 27.Oh P., Borgström P., Witkiewicz H., Li Y., Borgström B.J., Chrastina A. Live dynamic imaging of caveolae pumping targeted antibody rapidly and specifically across endothelium in the lung. Nat Biotechnol. 2007;25:327–337. doi: 10.1038/nbt1292. [DOI] [PMC free article] [PubMed] [Google Scholar]
- 28.Yameen B., Choi W.I., Vilos C., Swami A., Shi J., Farokhzad O.C. Insight into nanoparticle cellular uptake and intracellular targeting. J Control Release. 2014;190:485–499. doi: 10.1016/j.jconrel.2014.06.038. [DOI] [PMC free article] [PubMed] [Google Scholar]
- 29.Filser S., Ovsepian S.V., Masana M., Blazquez-Llorca L., Brandt Elvang A., Volbracht C. Pharmacological inhibition of BACE1 impairs synaptic plasticity and cognitive functions. Biol Psychiatry. 2015;77:729–739. doi: 10.1016/j.biopsych.2014.10.013. [DOI] [PubMed] [Google Scholar]
- 30.Vassar R. BACE1 inhibitor drugs in clinical trials for Alzheimer׳s disease. Alzheimers Res Ther. 2014;6:89. doi: 10.1186/s13195-014-0089-7. [DOI] [PMC free article] [PubMed] [Google Scholar]
- 31.Hardy J.A., Higgins G.A. Alzheimer׳s disease: the amyloid cascade hypothesis. Science. 1992;256:184–185. doi: 10.1126/science.1566067. [DOI] [PubMed] [Google Scholar]
- 32.Parsons C.G., Rammes G. Preclinical to phase II amyloid beta (Aβ) peptide modulators under investigation for Alzheimer׳s disease. Expert Opin Investig Drugs. 2017;26:579–592. doi: 10.1080/13543784.2017.1313832. [DOI] [PubMed] [Google Scholar]
- 33.Fukushima T., Osada Y., Ishibashi A. Novel BACE1 inhibitor, E2609, lowers Aβ levels in the brain, cerebrospinal fluid and plasma in rats and guinea pigs. Alzheimes Dement. 2012;8:P223–P224. [Google Scholar]
- 34.May P.C., Dean R.A., Lowe S.L., Martenyi F., Sheehan S.M., Boggs L.N. Robust central reduction of amyloid-β in humans with an orally available, non-peptidic β-secretase inhibitor. J Neurosci. 2011;31:16507–16516. doi: 10.1523/JNEUROSCI.3647-11.2011. [DOI] [PMC free article] [PubMed] [Google Scholar]
- 35.Yuan J., Venkatraman S., Zheng Y., McKeever B.M., Dillard L.W., Singh S.B. Structure-based design of β-site APP cleaving enzyme 1 (BACE1) inhibitors for the treatment of Alzheimer׳s disease. J Med Chem. 2013;56:4156–4180. doi: 10.1021/jm301659n. [DOI] [PubMed] [Google Scholar]
- 36.Yan R., Vassar R. Targeting the β secretase BACE1 for Alzheimer׳s disease therapy. Lancet Neurol. 2014;13:319–329. doi: 10.1016/S1474-4422(13)70276-X. [DOI] [PMC free article] [PubMed] [Google Scholar]
- 37.Thakker D.R., Sankaranarayanan S., Weatherspoon M.R., Harrison J., Pierdomenico M., Heisel J.M. Centrally delivered BACE1 inhibitor activates microglia, and reverses amyloid pathology and cognitive deficit in aged Tg2576 Mice. J Neurosci. 2015;35:6931–6936. doi: 10.1523/JNEUROSCI.2262-14.2015. [DOI] [PMC free article] [PubMed] [Google Scholar]
- 38.Coleman P., Federoff H., Kurlan R. A focus on the synapse for neuroprotection in Alzheimer disease and other dementias. Neurology. 2004;63:1155–1162. doi: 10.1212/01.wnl.0000140626.48118.0a. [DOI] [PubMed] [Google Scholar]
- 39.Shao C.Y., Mirra S.S., Sait H.B., Sacktor T.C., Sigurdsson E.M. Postsynaptic degeneration as revealed by PSD-95 reduction occurs after advanced Aβ and tau pathology in transgenic mouse models of Alzheimer׳s disease. Acta Neuropathol. 2011;122:285–292. doi: 10.1007/s00401-011-0843-x. [DOI] [PMC free article] [PubMed] [Google Scholar]
- 40.Tampellini D., Capetillo-Zarate E., Dumont M., Huang Z., Yu F., Lin M.T. Effects of synaptic modulation on β-amyloid, synaptophysin, and memory performance in Alzheimer׳s disease transgenic mice. J Neurosci. 2010;30:14299–14304. doi: 10.1523/JNEUROSCI.3383-10.2010. [DOI] [PMC free article] [PubMed] [Google Scholar]
- 41.Reiserer R.S., Harrison F.E., Syverud D.C., McDonald M.P. Impaired spatial learning in the APPSwe + PSEN1ΔE9 bigenic mouse model of Alzheimer׳s disease. Genes Brain Behav. 2007;6:54–65. doi: 10.1111/j.1601-183X.2006.00221.x. [DOI] [PubMed] [Google Scholar]
- 42.Duyckaerts C., Potier M.C., Delatour B. Alzheimer disease models and human neuropathology: similarities and differences. Acta Neuropathol. 2008;115:5–38. doi: 10.1007/s00401-007-0312-8. [DOI] [PMC free article] [PubMed] [Google Scholar]
- 43.Maei H.R., Zaslavsky K., Teixeira C.M., Frankland P.W. What is the most sensitive measure of water maze probe test performance? Front Integr Neurosci. 2009;3:4. doi: 10.3389/neuro.07.004.2009. [DOI] [PMC free article] [PubMed] [Google Scholar]
- 44.de Hoz L., Martin S.J., Morris R.G. Forgetting, reminding, and remembering: the retrieval of lost spatial memory. PLoS Biol. 2004;2:e225. doi: 10.1371/journal.pbio.0020225. [DOI] [PMC free article] [PubMed] [Google Scholar]
Associated Data
This section collects any data citations, data availability statements, or supplementary materials included in this article.
Supplementary Materials
Supplementary material