

ABSTRACT
Background
Neonatal gastrointestinal (GI) bacterial community structure may be related to bacterial communities of the mother, including those of her milk. However, very little is known about the diversity in and relationships among complex bacterial communities in mother-infant dyads.
Objective
Our primary objective was to assess whether microbiomes of milk are associated with those of oral and fecal samples of healthy lactating women and their infants.
Methods
Samples were collected 9 times from day 2 to 6 mo postpartum from 21 healthy lactating women and their infants. Milk was collected via complete breast expression, oral samples via swabs, and fecal samples from tissue (mothers) and diapers (infants). Microbiomes were characterized using high-throughput sequencing of the 16S ribosomal RNA (rRNA) gene. Alpha and beta diversity indices were used to compare microbiomes across time and sample types. Membership and composition of microbiomes were analyzed using nonmetric multidimensional scaling and canonical correlation analysis (CCA). The contribution of various bacterial communities of the mother-infant dyad to both milk and infant fecal bacterial communities were estimated using SourceTracker2.
Results
Bacterial community structures were relatively unique to each sample type. The most abundant genus in milk and maternal and infant oral samples was Streptococcus (47.1% ± 2.3%, 53.9% ± 1.3%, and 69.1% ± 1.8%, respectively), whereas Bacteroides were predominant in maternal and infant fecal microbiomes (22.9% ± 1.3% and 21.4% ± 2.4%, respectively). The milk microbiome was more similar to the infant oral microbiome than the infant fecal microbiome. However, CCA suggested strong associations between the complex microbial communities of milk and those of all other sample types collected.
Conclusions
These findings suggest complex microbial interactions between breastfeeding mothers and their infants and support the hypothesis that variation in the milk microbiome may influence the infant GI microbiome.
Keywords: microbiota, microbiome, human milk, breastmilk, feces, oral, maternal, infant
Introduction
High-throughput sequencing has unveiled distinct and complex consortia of microbial communities in and on the human body (e.g., 1–4), and their compositions are associated with health and disease states (5). As a mother and her breastfed infant form a unique epi-holobiont (6), their microbiomes likely interact to also influence maternal and infant health (7–14). Thus, understanding how these microbiomes are structured, maintained, and relate to each other is important.
Several studies have compared the microbiomes from various sites in the mother-infant dyad (15–28). These studies, along with the Human Microbiome Project and other studies (1–4), have reported distinct bacterial communities in and on different body sites, although some similarities also exist. For instance, milk, and infant oral and maternal oral samples are often predominately comprised of Streptococcus (21–23). Differences in bacterial diversity across some but not all niches have also been reported (20, 23, 27), as have changes over time. For example, the microbiomes of infant feces (16, 22, 27) and milk (20, 21, 29) vary across time, whereas maternal fecal (21, 30) and oral (21) bacterial communities appear to remain relatively stable. Although many of these studies have begun to elucidate the potential relationships among mother-infant microbiomes, a rigorous comparison of the microbiomes of milk, maternal oral and fecal samples, and infant oral and fecal samples collected from the same mother-infant dyads across several time points in the first 6 mo postpartum has yet to be conducted.
To help close this knowledge gap, we studied mother-infant dyads between birth and 6 mo postpartum. Samples included milk, oral swabs, and feces from mothers; and oral swabs and feces from their infants. Our goals were to: 1) characterize bacterial diversity in the various sample types over time, 2) assess the dissimilarity/similarity of the bacterial communities among the sample types over time, and 3) assess multivariate relations among bacterial communities of the different sample types. Our overarching a priori hypothesis was that the milk microbiome would be more similar to that of infant feces than the other biological niches investigated. It is noteworthy that the composition of maternal fecal and milk microbiomes from this study have been described previously (29, 30).
Methods
Subjects and study design
This study was carried out as a prospective, longitudinal investigation of 21 healthy, breastfeeding women recruited in their third trimester of pregnancy from the Pullman, WA/Moscow, ID, area. Samples and data were collected on 2, 5, and 10 d (±1 d), and 1, 2, 3, 4, 5, and 6 mo (±1 d) postpartum between June 2011 and April 2012. Mothers needed to be ≥18 y old and planning to breastfeed for ≥6 mo to participate. Nonexclusive breastfeeding was not a reason for exclusion, although most infants (n = 11) were exclusively fed the milk of their mother until they were 3 mo of age. Most other infants (n = 10) were predominantly fed the milk of their mother but occasionally received fluids such as water, glucose-water, and other liquids during the first 3 mo.
Sample collection
Methods used to collect maternal feces and milk have been described elsewhere (29, 30). Briefly, milk was collected from the same breast at each sampling time point using sterile collection kits and electric pumps, placed on ice, and transported to the laboratory where it was aliquoted and frozen at −80°C until processing. Oral samples were obtained by swabbing the dorsum of the tongue and the interior cheek surfaces using a sterile viscose-tipped swab (Sarstedt; #80.625). Oral samples were capped, stored on ice, and transported to the laboratory where swabs were either stored directly at −80°C or cut with scissors cleaned with 70% ethanol in water and transferred to tubes containing 0.5 mL sterile Tris-EDTA buffer (TE; 10 mM Tris-HCl, 1 mM EDTA, pH 8) and stored at −80°C.
Infant fecal samples were collected from a soiled diaper or from the infant's skin. In most cases, feces were immediately transferred into a sterile tube using a sterile viscose-tipped swab. In a few circumstances, caregivers froze the entire soiled diaper. If collected at home by the caregiver, samples were stored in a home freezer until they could be retrieved by study personnel (typically within 1 d). Samples collected at a university site were immediately stored at −80°C; those collected at a home or hospital site were kept on ice until they could be frozen at −80°C.
Extraction of DNA
Extraction of DNA from maternal feces and milk has been described elsewhere (29, 30). For oral samples, if not already done prior to freezing, ends of the swabs were cut and transferred to sterile tubes containing 0.5 mL TE as described above. Swab tips were vortexed (30 sec), the liquid transferred to a new sterile tube, centrifuged (13,000 × g for 10 min at 4°C), the supernatant decanted, and the remaining pellet resuspended in sterile 0.5 mL TE50 (10 mM Tris-HCl, 50 mM EDTA, pH 8.0). Samples were subjected to enzymatic and physical lysis as described previously (29), and DNA was extracted using the QIAamp DNA Mini Kit (Qiagen Cat. 51,304) following the manufacturer's protocol. TE50 (0.5 mL) was used as a negative control. Extracted DNA was eluted in 50 µL of nuclease-free water (Invitrogen Cat. AM9937) and stored at −80°C until further analysis.
In most cases, DNA was extracted from infant feces by first cutting the tip of the swab and transferring it to a sterile tube with 0.5 mL TE50 as described above. When whole diapers were frozen, a soiled portion was cut and used. Soiled diaper pieces or swab tips containing feces were vigorously vortexed, the liquid transferred to a new tube, and processed using the QIAamp DNA Stool Mini Kit (Qiagen Cat. 51,504) following the manufacturer's protocol.
Amplification and sequencing of bacterial DNA
To prepare all samples for sequencing, we used a dual-barcoded, 2-step PCR to amplify the V1-V3 hypervariable region of the bacterial 16S ribosomal RNA (rRNA) gene. Descriptions of the primers used have been reported previously (29). All PCR procedures and reactions were conducted in a dedicated PCR hood. Negative DNA extraction controls were implemented for each set of extractions. If amplification bands were observed in these controls, extractions and/or the PCR were repeated as required.
Bacterial DNA from maternal and infant feces was amplified as described previously (30), and from milk as described by Williams and colleagues (29). The first PCR for all oral samples was conducted as described previously (29). Products from the first PCR were evaluated for quality and underwent a second PCR as described (30) with the addition of 360 GC Enhancer (ThermoFisher Scientific, Carlsbad, CA; 1.0 µL/20 µL reaction volume) and the following conditions: 94°C for 5 min; then 94°C for 30 sec, 60°C for 45 sec, and 72°C for 1.5 min for 20 cycles with a 0.5°C step-down in the annealing temp for each cycle, then 94°C for 30 sec, 50°C for 45 sec, and 72°C for 1.5 min for 10 cycles; and a final extension step of 72°C for 5 min. Samples were held at 4°C in the thermocycler until being stored at −20°C. The quality of second PCR amplicons was evaluated using a QIAxcel DNA screening cartridge (Qiagen), and DNA quantified using the Quant-iT Picogreen double stranded DNA (dsDNA) Assay Kit (Invitrogen) or Qubit dsDNA HS Assay Kit (Invitrogen).
An appropriate volume of each amplicon (containing 50 ng DNA) was pooled to create a composite sample with processing and sequencing as described previously (29). Raw DNA sequence reads were demultiplexed and processed using the custom python application dbcAmplicons (29, 31).
Longitudinal characterization and statistical analyses of microbiomes
Individual-based rarefaction and accumulation curves were generated using the rarecurve and specaccum functions, respectively, in the vegan package (v2.4.6) in R (32, 33). Individual-based rarefaction curves and accumulation curves (not shown) suggested that the threshold for sequencing and sampling depths varied across sample types and taxonomic levels, but that we could confidently analyze data classified at the phylum level with at least 2,000 sequences and ∼50 samples. However, because we were interested in comparing our data to other previously published data (at the genus level) and generating hypotheses for future investigations with more sequencing depth, we also examined bacterial community structures at the genus level. As there was considerable variation in total sequencing read counts for each sample and across sample types, read counts were rarefied at 2,000 reads/sample prior to calculation of various indices and conducting multivariate analyses using the rrarefy function in the vegan package in R. Following rarefication, sequence read counts for each taxon were converted to relative abundance values by taking the sum of read count per taxa per sample and dividing by 2,000. Relative abundances were summarized by sample type and time postpartum.
Diversity metrics and statistical analyses
Alpha diversity, describing “within” sample diversity (34, 35), was assessed at the genus level using richness, Simpson evenness, Pielou's J, and Shannon's diversity metrics which were calculated using the vegan package in R. Richness reflects the number of different taxa observed in a sample; Simpson and Pielou's J evenness reflect how evenly distributed the abundances of the taxa are in the community (2 evenness measures were chosen as Simpson evenness is sensitive to changes in dominance); Shannon's diversity combines richness and evenness and is sensitive to changes in abundances of the rare groups (36). Statistical analyses of diversity indices were performed in SAS version 9.3 (SAS Institute Inc.) using a generalized linear mixed model (GLMM) with time postpartum, sample type (e.g., infant feces, milk), and the time by sample type interaction. GLMM models assumed a Poisson response distribution, with participant as a random effect and an autoregressive repeated-measure structure across sampling time. When the interaction was significant, the effects of time within each sample type were assessed individually. Probability (P) values were adjusted for multiple comparisons using a Bonferroni correction. Significance for the specified responses was declared at P ≤ 0.05.
Beta diversity (“between” sample diversity) was examined using principal coordinates analysis (PCoA) using Hellinger-transformed data and nonmetric dimensional scaling (NMDS) using the Bray–Curtis dissimilarity matrix. PCoA and NMDS are both ordination techniques that visualize the similarity or dissimilarity of various bacterial communities (37). Analysis of similarity (ANOSIM; 38) and adonis (39) functions in the vegan package in R were utilized to statistically test for differences in microbial community composition among sample types. Bray–Curtis dissimilarity distance matrices were utilized in both tests, and analyses for both were conducted with 999 permutations.
To further investigate relations among bacterial communities of different sample types, we conducted canonical correlation analyses (CCAs; 40) among pairs of sample types using the relative abundances of the most abundant taxa in each sample type based on the rarefied count data. CCA allows exploration of relations between 2 multivariate sets of variables—in this case, complex microbiomes. CCA strives to identify linear combinations within one set of variables that maximizes the correlations with a linear combination within a second set of variables. CCA was utilized to expand our analyses from only exploring univariate relations between individual taxa. CCAs were computed using PROC CANCORR in SAS v9.3.
Additionally, SourceTracker2 (version 2.0.1; 41) was utilized to estimate 1) the contribution of maternal oral, milk, and fecal (proxy for gastrointestinal [GI]), and also infant oral bacteria to the bacterial composition of the infant fecal microbiome, and 2) the contribution of maternal fecal, oral, and infant oral bacteria to the milk microbiome. For both estimations, rarefied sequence count data were used.
Relative abundance values listed represent means ± SEM. Diversity values listed represent least square means ± SEM.
Results
Subject description and sample disposition
Information related to basic anthropometrics and reproductive history for all subjects at enrollment is listed in Table 1 and has been described previously (30). On average, women were 30 ± 4 y old, weighed 64 ± 7 kg prior to pregnancy, and had 1.8 ± 1.0 children. Most samples were collected from both mother and infant at each time point, but we were unable to obtain all samples due to subject unavailability, subject noncompliance, or mishandling of the sample by study personnel. Ultimately, 181 infant fecal, 184 infant oral, 167 maternal fecal, 183 maternal oral, and 168 milk samples were obtained.
TABLE 1.
Selected anthropometric and descriptive variables of the 21 lactating women participating in this study1
| Age, y | 30 ± 4 |
| Height, cm | 166 ± 9 |
| Prepregnancy wt, kg | 64 ± 7 |
| Postpartum wt, kg | 71 ± 9 |
| Postpartum BMI, kg/m2 | 26.0 ± 4 |
| Delivery mode | |
| Vaginal, n | 16 |
| Cesarean, n | 5 |
| Delivery location | |
| Hospital, n | 19 |
| Home, n | 2 |
| Parity, n | 1.8 ± 1 |
| Female infants, % | 38 |
| Exclusively breastfed at 3 mo, % | 52 |
Values are means ± SD or unit of measure as indicated; a total of 21 women and their infants were studied.
Sequencing summary
In total, 911 samples (some being duplicates) were sequenced yielding a total of 18,534,383 sequencing reads (range: 2 to 154,386 reads; mean ± SEM: 20,345 ± 590 reads) following demultiplexing and sequence read processing, 1,022 taxa were identified. After removing duplicates and samples with <2,000 reads, 791 samples (149 infant feces, 151 infant oral, 162 maternal feces, 182 maternal oral, and 147 milk) were used in the analyses (Table 2). Sequences were classified at phylum, class, order, family, and genus levels using the Ribosomal Database Project (RDP) classifier (42) and the RDP database (43). The classification of a sequence at a particular level had to meet a bootstrap confidence threshold of at least 0.50 to be classified at that taxonomic level. Although most sequences could be classified to the genus level with this threshold, some could not. For instance, 1.2% of the sequence reads in infant oral samples were identified as being in the Lactobacillales order (the 6th most abundant taxon in this sample type), but the sequences in this Lactobacillales group did not meet the bootstrap confidence threshold for lower levels and thus, were not classified with a genus taxonomic name. In this case and others like it, we decided to include Lactobacillales in the analyses to prevent the loss of information from sequences on taxa that were present in the community but could not be identified at a lower taxonomic level. After classification, the taxa in the genus-level grouping were filtered by removing taxon with a sum <40 reads total over all of the samples, a mean of <2 reads/taxon, and were present in <21 samples, resulting in a total of 366 taxa across the 5 different sample types. Due to variability in the mean number of reads among the various sample types, sample read counts were also rarefied to 2,000 reads/sample.
TABLE 2.
Number and type of samples analyzed at each time point from the mothers and infants included in this analysis
| Day 2 | Day 5 | Day 10 | 1 mo | 2 mo | 3 mo | 4 mo | 5 mo | 6 mo | Total | |
|---|---|---|---|---|---|---|---|---|---|---|
| Infant feces | 14 | 16 | 19 | 17 | 18 | 16 | 18 | 18 | 13 | 149 |
| Infant oral | 17 | 15 | 17 | 18 | 17 | 17 | 19 | 16 | 15 | 151 |
| Maternal feces | 15 | 19 | 19 | 19 | 19 | 20 | 17 | 17 | 17 | 162 |
| Milk | 10 | 18 | 15 | 20 | 18 | 17 | 17 | 16 | 16 | 147 |
| Maternal oral | 20 | 21 | 21 | 21 | 20 | 20 | 20 | 20 | 19 | 182 |
| Total | 76 | 89 | 91 | 95 | 92 | 90 | 91 | 87 | 80 | 791 |
Alpha and beta diversity
A sample type by time interaction was evident (P < 0.005) for each of the diversity indices. As such, we examined the effect of time on diversity indices within each sample type and the effect of sample type across time (Table 3). However, after adjusting for multiple comparisons, few changes across time were noted. Microbial richness decreased from day 2 to day 10 in infant feces. The Simpson evenness index decreased in infant oral samples from day 2 and day 10 to 4 and 5 mo indicating that the relative abundances of the taxon within this community became less evenly distributed (see Figure 1C). With respect to Shannon diversity, the only difference observed was an increase between day 2 and 5 mo in the maternal oral swabs, indicating the bacterial communities in the mothers’ oral samples were more diverse and the membership more evenly distributed later in the postpartum period. When comparing diversity across sample types, maternal feces had greater richness (P < 0.0001) than infant feces and oral samples. The Shannon diversity of maternal feces was also greater (P < 0.008) than most sample types at each time point.
TABLE 3.
Alpha bacterial diversity metrics (richness, Simpson evenness, Pielou's J, and Shannon diversity) during the first 6 mo postpartum in infant feces, infant oral, maternal feces, maternal oral, and milk samples1
| Time postpartum | |||||||||
|---|---|---|---|---|---|---|---|---|---|
| Day 2 | Day 5 | Day 10 | 1 mo | 2 mo | 3 mo | 4 mo | 5 mo | 6 mo | |
| Richness | |||||||||
| Infant feces | 42 ± 3a | 29 ± 3ab | 26 ± 2b | 27 ± 2ab | 29 ± 2ab | 30 ± 3ab | 34 ± 3ab | 33 ± 3ab | 34 ± 3ab |
| Infant oral | 23 ± 2 | 23 ± 2 | 21 ± 2 | 20 ± 2 | 22 ± 2 | 24 ± 2 | 28 ± 2 | 28 ± 3 | 29 ± 3 |
| Maternal feces | 64 ± 4 | 65 ± 4 | 66 ± 4 | 68 ± 4 | 65 ± 4 | 63 ± 3 | 65 ± 4 | 67 ± 4 | 64 ± 4 |
| Maternal oral | 42 ± 3 | 50 ± 3 | 47 ± 3 | 56 ± 3 | 49 ± 3 | 48 ± 3 | 50 ± 3 | 57 ± 3 | 51 ± 3 |
| Milk | 49 ± 4 | 46 ± 3 | 50 ± 4 | 44 ± 3 | 51 ± 3 | 47 ± 3 | 47 ± 3 | 59 ± 4 | 52 ± 3 |
| Simpson evenness | |||||||||
| Infant feces | 0.09 ± 0.01 | 0.10 ± 0.01 | 0.11 ± 0.01 | 0.11 ± 0.01 | 0.11 ± 0.01 | 0.10 ± 0.01 | 0.09 ± 0.01 | 0.10 ± 0.01 | 0.12 ± 0.01 |
| Infant oral | 0.11 ± 0.01a | 0.10 ± 0.01ab | 0.11 ± 0.01a | 0.10 ± 0.01ab | 0.07 ± 0.01ab | 0.07 ± 0.01ab | 0.06 ± 0.01b | 0.06 ± 0.01b | 0.07 ± 0.01ab |
| Maternal feces | 0.12 ± 0.01 | 0.11 ± 0.01 | 0.10 ± 0.01 | 0.12 ± 0.01 | 0.12 ± 0.01 | 0.12 ± 0.01 | 0.10 ± 0.01 | 0.12 ± 0.01 | 0.12 ± 0.01 |
| Maternal oral | 0.05 ± 0.01 | 0.06 ± 0.01 | 0.06 ± 0.01 | 0.07 ± 0.01 | 0.07 ± 0.01 | 0.08 ± 0.01 | 0.07 ± 0.01 | 0.08 ± 0.01 | 0.07 ± 0.01 |
| Milk | 0.08 ± 0.01 | 0.07 ± 0.01 | 0.06 ± 0.01 | 0.06 ± 0.01 | 0.05 ± 0.01 | 0.04 ± 0.01 | 0.04 ± 0.01 | 0.04 ± 0.01 | 0.07 ± 0.01 |
| Pielou's J | |||||||||
| Infant feces | 0.36 ± 0.03 | 0.36 ± 0.03 | 0.38 ± 0.02 | 0.43 ± 0.03 | 0.43 ± 0.03 | 0.42 ± 0.03 | 0.41 ± 0.03 | 0.45 ± 0.03 | 0.49 ± 0.03 |
| Infant oral | 0.32 ± 0.02 | 0.34 ± 0.03 | 0.33 ± 0.02 | 0.25 ± 0.02 | 0.24 ± 0.02 | 0.26 ± 0.02 | 0.30 ± 0.02 | 0.28 ± 0.02 | 0.33 ± 0.03 |
| Maternal feces | 0.63 ± 0.03 | 0.60 ± 0.03 | 0.59 ± 0.03 | 0.63 ± 0.03 | 0.63 ± 0.03 | 0.62 ± 0.03 | 0.61 ± 0.03 | 0.64 ± 0.03 | 0.62 ± 0.03 |
| Maternal oral | 0.37 ± 0.02 | 0.43 ± 0.03 | 0.40 ± 0.02 | 0.49 ± 0.03 | 0.45 ± 0.03 | 0.46 ± 0.03 | 0.46 ± 0.03 | 0.50 ± 0.03 | 0.46 ± 0.03 |
| Milk | 0.43 ± 0.03 | 0.42 ± 0.03 | 0.39 ± 0.03 | 0.34 ± 0.02 | 0.35 ± 0.02 | 0.31 ± 0.02 | 0.30 ± 0.02 | 0.38 ± 0.03 | 0.42 ± 0.03 |
| Shannon diversity | |||||||||
| Infant feces | 1.4 ± 0.1 | 1.2 ± 0.1 | 1.2 ± 0.1 | 1.4 ± 0.1 | 1.5 ± 0.1 | 1.5 ± 0.1 | 1.4 ± 0.1 | 1.6 ± 0.1 | 1.7 ± 0.1 |
| Infant oral | 1.0 ± 0.1 | 1.1 ± 0.1 | 1.0 ± 0.1 | 0.8 ± 0.1 | 0.7 ± 0.1 | 0.8 ± 0.1 | 1.0 ± 0.1 | 0.9 ± 0.1 | 1.1 ± 0.1 |
| Maternal feces | 2.6 ± 0.2 | 2.5 ± 0.1 | 2.5 ± 0.1 | 2.6 ± 0.1 | 2.6 ± 0.1 | 2.6 ± 0.1 | 2.5 ± 0.1 | 2.7 ± 0.2 | 2.6 ± 0.1 |
| Maternal oral | 1.4 ± 0.1b | 1.7 ± 0.1ab | 1.5 ± 0.1ab | 2.0 ± 0.1ab | 1.7 ± 0.1ab | 1.8 ± 0.1ab | 1.8 ± 0.1ab | 2.0 ± 0.1a | 1.8 ± 0.1ab |
| Milk | 1.7 ± 0.2 | 1.6 ± 0.1 | 1.5 ± 0.1 | 1.3 ± 0.1 | 1.4 ± 0.1 | 1.2 ± 0.1 | 1.2 ± 0.1 | 1.5 ± 0.1 | 1.7 ± 0.1 |
Values are least square means ± SEM; infant feces, n = 149; infant oral, n = 151; maternal feces, n = 162; maternal oral, n = 182; milk, n = 147. Values within a row not sharing a common superscript differ (P < 0.05). Diversity indices were calculated using the rarefied genus-level count data. Richness: higher number, more taxa present; Simpson evenness: higher number, community is more evenly distributed; Pielou's J: higher number, community is more evenly distributed; Shannon diversity: higher number, higher diversity.
FIGURE 1.

Relative abundances of (A) the top 10 taxa at the genus level for each sample type; and relative abundances across time for (B) infant fecal genus-level taxa; (C) infant oral genus-level taxa; (D) milk genus-level taxa; (E) maternal oral genus-level taxa; (F) maternal fecal genus-level taxa. The taxa represented in 1B-1F represent each sample type's most abundant taxa and correspond to taxa in Table 5.
Characterization of the most abundant bacterial taxa
Average relative abundances of the 4 most abundant phyla are presented in Table 4. Infant oral, maternal oral, and milk microbial communities were predominated by Firmicutes; maternal feces by Firmicutes and Bacteroidetes; and infant feces was characterized by a relatively even distribution of Firmicutes, Bacteroidetes, and Proteobacteria. The average relative abundances of the taxa identified at the genus level (or lowest level of classification) and constituting 1 of the 10 most abundant taxa in at least one time point for that sample type are listed in Table 5 and graphically represented in Figure 1A–E. Relative abundances for the 20 most abundant taxa classified at the genus level or lowest level of classification in each sample type are provided in Supplemental Table 1. Although each sample type had a unique bacterial community composition, there were several noteworthy similarities. For example, infant and maternal oral swabs were both predominated by Streptococcus (69.1% ± 1.8% and 53.9% ± 1.3%, respectively); whereas the most abundant genus in infant and maternal feces was Bacteroides (21.4% ± 2.4% and 22.9% ± 1.3%, respectively). The 5 most abundant genera in both milk and infant oral samples were Streptococcus, Staphylococcus, Gemella, Rothia, and Veillonella. With the exception of Staphylococcus, these genera were also the most abundant in maternal oral samples.
TABLE 4.
Overall relative abundances (%) of the 4 most abundant phyla averaged across all time points for infant feces and oral samples, maternal feces, oral, and milk samples1
| Sample type | Phyla | Relative abundance (%) |
|---|---|---|
| Infant feces | Firmicutes | 39.3 ± 2.6 |
| Proteobacteria | 27.6 ± 2.1 | |
| Bacteroidetes | 26.4 ± 2.1 | |
| Actinobacteria | 6.1 ± 0.9 | |
| Infant oral | Firmicutes | 89.3 ± 1.4 |
| Actinobacteria | 6.6 ± 1.0 | |
| Bacteroidetes | 2.1 ± 0.5 | |
| Proteobacteria | 1.8 ± 0.6 | |
| Maternal feces | Firmicutes | 52.3 ± 1.1 |
| Bacteroidetes | 41.7 ± 1.1 | |
| Proteobacteria | 3.3 ± 0.3 | |
| Actinobacteria | 1.2 ± 0.2 | |
| Maternal oral | Firmicutes | 71.2 ± 1.1 |
| Proteobacteria | 9.9 ± 0.6 | |
| Bacteroidetes | 8.3 ± 0.6 | |
| Actinobacteria | 8.0 ± 0.5 | |
| Milk | Firmicutes | 86.9 ± 1.2 |
| Actinobacteria | 6.8 ± 0.8 | |
| Proteobacteria | 4.2 ± 0.8 | |
| Bacteroidetes | 1.8 ± 0.3 |
Values are means ± SEM; infant feces, n = 149; infant oral, n = 151; maternal feces, n = 162; maternal oral, n = 182; milk, n = 147.
TABLE 5.
Mean relative abundances of the aggregated list of top 10 most abundant genera (or next highest characterizable taxa) from each timepoint in infant feces, infant oral, maternal feces, maternal oral, and milk samples from 2 d to 6 mo postpartum1
| Infant feces | % | Infant oral | % | Maternal feces | % | Maternal oral | % | Milk | % |
|---|---|---|---|---|---|---|---|---|---|
| Bacteroides | 21.4 ± 2.4 | Streptococcus | 69.1 ± 1.8 | Bacteroides | 22.9 ± 1.3 | Streptococcus | 53.9 ± 1.3 | Streptococcus | 47.1 ± 2.3 |
| Escherichia/Shigella | 16.0 ± 2.0 | Gemella | 9.5 ± 1.3 | Faecalibacterium | 8.8 ± 0.6 | Rothia | 6.3 ± 0.5 | Staphylococcus | 24.1 ± 2.2 |
| Veillonella | 10.5 ± 1.4 | Rothia | 5.7 ± 1.0 | Prevotella | 7.6 ± 1.0 | Gemella | 6.2 ± 0.5 | Gemella | 3.6 ± 0.8 |
| Clostridium sensu stricto | 9.0 ± 1.6 | Staphylococcus | 4.1 ± 0.9 | Lachnospiracea incertae sedis | 7.6 ± 0.4 | Prevotella | 5.8 ± 0.5 | Rothia | 2.6 ± 0.5 |
| Bifidobacterium | 5.4 ± 0.9 | Veillonella | 2.6 ± 0.3 | Lachnospiraceae | 5.5 ± 0.3 | Veillonella | 5.3 ± 0.3 | Veillonella | 2.5 ± 0.3 |
| Streptococcus | 4.6 ± 1.2 | Lactobacillales | 1.2 ± 0.0 | Porphyromonas | 4.2 ± 0.6 | Neisseria | 4.5 ± 0.4 | Lactobacillus | 1.7 ± 0.7 |
| Parabacteroides | 4.0 ± 1.0 | Granulicatella | 1.1 ± 0.2 | Ruminococcaceae | 3.4 ± 0.2 | Granulicatella | 2.7 ± 0.2 | Pseudomonas | 1.7 ± 0.6 |
| Lachnospiracea incertae sedis | 2.8 ± 0.7 | Haemophilus | 0.9 ± 0.4 | Oscillibacter | 3.2 ± 0.3 | Haemophilus | 2.7 ± 0.2 | Lactobacillales | 1.7 ± 0.1 |
| Pseudomonas | 2.7 ± 0.5 | Soonwooa | 0.6 ± 0.3 | Clostridiales | 2.8 ± 0.2 | Fusobacterium | 1.2 ± 0.1 | Propionibacterium | 1.4 ± 0.3 |
| Clostridium XlVa | 1.8 ± 0.6 | Prevotella | 0.5 ± 0.3 | Parabacteroides | 2.3 ± 0.2 | Actinomyces | 1.2 ± 0.1 | Corynebacterium | 1.2 ± 0.3 |
| Enterobacter | 1.7 ± 0.5 | Porphyromonas | 0.5 ± 0.2 | Dialister | 1.7 ± 0.3 | Porphyromonas | 1.0 ± 0.2 | Bacillales | 0.9 ± 0.0 |
| Clostridium XVIII | 1.7 ± 0.5 | Actinomyces | 0.4 ± 0.1 | Blautia | 1.3 ± 0.2 | Lactobacillales | 0.8 ± 0.0 | Bacilli | 0.6 ± 0.0 |
| Klebsiella | 1.6 ± 0.5 | Lactobacillus | 0.4 ± 0.2 | Peptoniphilus | 1.2 ± 0.2 | Schlegelella | 0.6 ± 0.1 | Prevotella | 0.6 ± 0.1 |
| Enterobacteriaceae | 1.5 ± 0.3 | Neisseria | 0.4 ± 0.2 | Campylobacter | 1.2 ± 0.3 | — | — | Actinomyces | 0.5 ± 0.1 |
| Haemophilus | 1.5 ± 0.5 | Bacilli | 0.3 ± 0.0 | Anaerosphaera | 1.1 ± 0.2 | — | — | Granulicatella | 0.5 ± 0.1 |
| Lachnospiraceae | 1.2 ± 0.3 | Bacillales | 0.3 ± 0.0 | Anaerococcus | 1.1 ± 0.2 | — | — | Clostridium sensu stricto | 0.5 ± 0.1 |
| Lactococcus | 0.9 ± 0.4 | Pasteurellaceae | 0.2 ± 0.1 | Lactobacillus | 0.9 ± 0.4 | — | — | Lactococcus | 0.3 ± 0.1 |
| Megasphaera | 0.9 ± 0.4 | Actinomycetales | 0.2 ± 0.0 | — | — | — | — | Neisseria | 0.2 ± 0.2 |
| Akkermansia | 0.6 ± 0.6 | Pilibacter | 0.2 ± 0.0 | — | — | — | — | Comamonas | 0.2 ± 0.1 |
| Prevotella | 0.5 ± 0.3 | Prevotellaceae | 0.2 ± 0.1 | — | — | — | — | Leuconostoc | 0.2 ± 0.1 |
| Leuconostoc | 0.5 ± 0.2 | Flavobacteriaceae | 0.2 ± 0.0 | — | — | — | — | — | — |
| Citrobacter | 0.4 ± 0.3 | Bifidobacterium | 0.1 ± 0.1 | — | — | — | — | — | — |
| Weissella | 0.4 ± 0.2 | — | — | — | — | — | — | — | — |
| Faecalibacterium | 0.3 ± 0.3 | — | — | — | — | — | — | — | — |
Values are means ± SEM; for infant feces, n = 149; infant oral, n = 151; maternal feces, n = 162; maternal oral, n = 182; milk, n = 147.
Relations among complex bacterial memberships over time
NMDS and PCoA analyses revealed similar results; since the amount of variation explained by the first 2 components of the PCoA at the genus level was only ∼21%, only NMDS results are reported here. There was clustering by sample type despite some overlap (Figure 2 and Supplemental Figure 1). Both ANOSIM (R = 0.61; P = 0.001) and adonis (R2 = 0.48; P = 0.001) tests at the genus level indicated an effect of sample type on complex bacterial community membership, supporting the visual clustering observed in the NMDS plots. NMDS plots suggested that milk and infant fecal samples have some similarity in early life but become increasingly different over time. Conversely, milk and infant oral microbiomes appear to become increasingly similar to each other and to the maternal oral microbiome over time.
FIGURE 2.
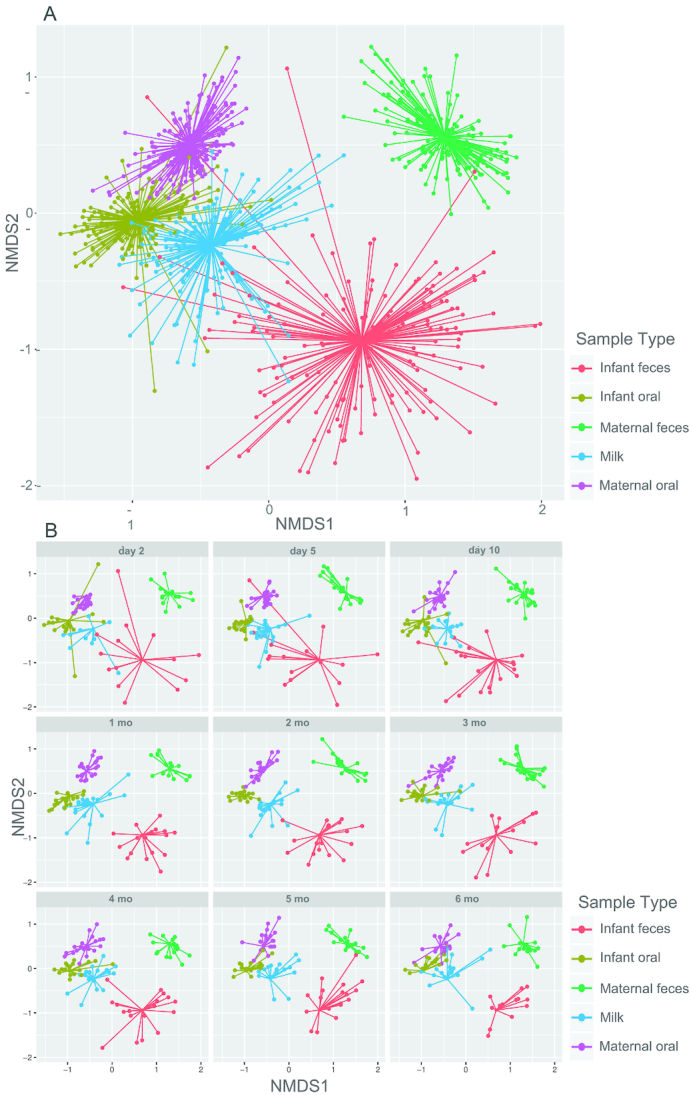
NMDS plots of genus-level (or lowest characterizable level) rarefied sequence read count data from milk, maternal feces, maternal oral swabs, infant feces, and infant oral swabs (A) at all time points combined, and (B) by time postpartum. Each point represents a single sample and is colored by sample type. Segments are drawn connecting each sample to the centroid for the sample type. NMDS, nonmetric multidimensional scaling.
Relations among complex bacterial communities
Relations between bacterial communities of the various sample types were further characterized using CCA. Bacterial taxa for each sample type included in the CCA were chosen in accordance with their inclusion in the 10 most abundant taxa for at least 1 time point in that particular sample type. The taxa used for CCA for each sample type are the same as those presented in Table 5. We initially conducted CCA with all data, but in several cases, with single outliers also removed. To visualize the canonical correlations, the first axis scores from each of the sample types included in the correlation were plotted and are illustrated in Figures 3 and 4. Each panel displays a canonical correlation plot between different sample types. Each point in a plot represents the scores of the linear combinations for a sample pair in the canonical correlation. The line on the plot represents the linear regression of the points displayed on the plot. For example, Figure 3A displays the results obtained from the CCA of the milk bacteria and the infant fecal bacteria and shows that there is a high correlation (canonical correlation = 0.87) between a linear combination of the relative abundances of the milk bacteria and a linear combination of the relative abundances of the infant fecal bacteria. Figure 3B shows the CCA with the outlier removed.
FIGURE 3.

Plots of the first components in each pairwise canonical correlation analysis (with and without outliers when appropriate) between milk and (A, B) infant feces, (C) maternal feces, (D, E) infant oral swabs, and (F) maternal oral swabs. Solid line represents regression line. Each point represents the scores of the linear combinations for a particular sample pair in the canonical correlation.
FIGURE 4.

Plots of the first components in each pairwise canonical correlation analysis (with and without outliers when appropriate) between (A) infant feces and maternal oral swabs, (B) infant feces and maternal feces, (C, D) infant feces and infant oral swabs, (E, F) infant oral swabs and maternal feces, (G) infant oral and maternal oral swabs, and (H) maternal feces and maternal oral swabs. Solid line represents regression line. Each point represents the scores of the linear combinations for a particular sample pair in the canonical correlation.
Most canonical correlations that included all data except 2 (infant oral: maternal oral and milk: maternal oral) had at least 1 significant canonical correlation, all of which were moderate to strong (range: 0.64–0.95; Table 6). Two of the canonical correlations (infant feces: infant oral and infant oral: maternal feces) became nonsignificant when the outliers were removed. Milk and infant oral samples had the greatest number of significant canonical components (7 significant components; canonical correlations from 0.95 to 0.70; P < 0.003). When all data were included, these 7 canonical components together accounted for ∼91% of the data variability, with the first accounting for ∼31%. Even after removing the outlier, the canonical correlation remained strong (0.95 to 0.66), and we have illustrated relations with and without the outlier (Figure 3D and E, respectively) because we believe that it might be a realistic data point. Milk and infant fecal microbiomes were also highly correlated (Figure 3A), with the first axes accounting for ∼29% of the variation (Table 6). As with the relation between milk and infant oral microbiomes, that between milk and infant feces remained strong (canonical correlation = 0.80; Table 6) with the outlier removed (Figure 3A and B). Milk and maternal feces also had a strong canonical correlation of 0.72 (P = 0.0083; Figure 3C); a finding particularly interesting given that their community membership was quite different from each other. The association between infant fecal and maternal fecal bacterial communities was moderately strong (canonical correlation = 0.79, P < 0.0001; Figure 4B), as well as the multivariate relation between maternal fecal and maternal oral bacterial communities (canonical correlation = 0.64, P < 0.0001; Figure 4H). An overview of the canonical correlations is provided as a heatmap in Supplemental Figure 2.
TABLE 6.
Canonical correlation results for the pairwise comparisons among most abundant bacterial genera in infant feces, infant oral, maternal feces, maternal oral, and milk samples1
| Relations | Axis | Canonical correlation | Proportion of variability explained | Cumulative variability explained | P value |
|---|---|---|---|---|---|
| Milk: infant feces (all data) | 1 | 0.87 | 0.29 | 0.29 | < 0.0001 |
| 2 | 0.79 | 0.16 | 0.46 | 0.0045 | |
| Milk: infant feces (no outlier) | 1 | 0.80 | 0.22 | 0.22 | 0.0107 |
| Milk: infant oral (all data) | 1 | 0.95 | 0.31 | 0.31 | < 0.0001 |
| 2 | 0.93 | 0.23 | 0.54 | < 0.0001 | |
| 3 | 0.90 | 0.14 | 0.67 | < 0.0001 | |
| 4 | 0.86 | 0.10 | 0.77 | < 0.0001 | |
| 5 | 0.81 | 0.07 | 0.84 | < 0.0001 | |
| 6 | 0.73 | 0.04 | 0.88 | < 0.0001 | |
| 7 | 0.70 | 0.03 | 0.91 | 0.0026 | |
| Milk: infant oral (no outlier) | 1 | 0.95 | 0.33 | 0.33 | < 0.0001 |
| 2 | 0.93 | 0.23 | 0.55 | < 0.0001 | |
| 3 | 0.88 | 0.13 | 0.68 | < 0.0001 | |
| 4 | 0.83 | 0.08 | 0.76 | < 0.0001 | |
| 5 | 0.76 | 0.05 | 0.82 | < 0.0001 | |
| 6 | 0.75 | 0.05 | 0.87 | < 0.0001 | |
| 7 | 0.66 | 0.03 | 0.90 | 0.0122 | |
| Milk: maternal feces | 1 | 0.72 | 0.22 | 0.22 | 0.0083 |
| Milk: maternal oral | 1 | 0.62 | 0.24 | 0.24 | 0.33 |
| Infant feces: infant oral (all data) | 1 | 0.86 | 0.30 | 0.30 | 0.0043 |
| Infant feces: infant oral (no outlier) | 1 | 0.82 | 0.24 | 0.24 | 0.10 |
| Infant feces: maternal feces | 1 | 0.79 | 0.23 | 0.23 | < 0.0001 |
| 2 | 0.74 | 0.17 | 0.40 | 0.0019 | |
| Infant feces: maternal oral | 1 | 0.72 | 0.27 | 0.27 | 0.0005 |
| Infant oral: maternal feces (all data) | 1 | 0.80 | 0.32 | 0.32 | <0.0001 |
| Infant oral: maternal feces (no outlier) | 1 | 0.67 | 0.19 | 0.19 | 0.15 |
| Infant oral: maternal oral | 1 | 0.65 | 0.25 | 0.25 | 0.18 |
| Maternal feces: maternal oral | 1 | 0.64 | 0.25 | 0.25 | < 0.0001 |
| 2 | 0.56 | 0.16 | 0.41 | < 0.0004 | |
| 3 | 0.55 | 0.16 | 0.57 | 0.0098 |
Milk: infant feces, n = 121 pairs; milk: infant oral, n = 118 pairs; milk: maternal feces, n = 128 pairs; milk: maternal oral, n = 142 pairs; infant feces: infant oral, n = 121 pairs; infant feces: maternal feces, n = 131 pairs; infant feces: maternal oral, n = 144 pairs; infant oral: maternal feces, n = 136 pairs; infant oral: maternal oral, n = 147 pairs; maternal feces: maternal oral, n = 159 pairs.
Potential sources of the bacterial communities in milk and infant feces
Using SourceTracker2 software, we first estimated likely contributions to the infant fecal bacterial communities (sink) using rarefied taxon read counts at the genus level from milk (source), infant oral (source), maternal oral (source), and maternal fecal (as a proxy of the maternal GI bacteria; source). The milk microbiome was estimated to directly contribute ∼4.9% at day 2 and ∼0.3% at month 6 to the infant fecal microbiome (Table 7). Note however, a large percentage (87–98%) was unknown, and it is plausible that the milk contributes to the microbiomes present in the stomach, small intestine, and upper large intestine, which consequently help shape that of the colon and feces. To estimate the potential sources of the milk bacterial communities (sink), infant oral (source), maternal oral (source), and maternal fecal (source) rarefied taxon read counts at the genus level were used. Infant oral bacterial communities were estimated to contribute ∼21% at day 2 and then up to 66% at month 5 (Table 8). Maternal oral bacterial communities contributed 26% at day 2 and then only 2–6% from 1–6 mo postpartum.
TABLE 7.
Relative amounts (% of total) that bacterial communities found in infant oral, maternal feces, maternal oral, and milk may contribute to the bacterial composition of infant feces from day 2 to 6 mo of life1
| d 2 | d 5 | d 10 | 1 mo | 2 mo | 3 mo | 4 mo | 5 mo | 6 mo | |
|---|---|---|---|---|---|---|---|---|---|
| Infant oral | 1.1 ± 0.3 | 1.9 ± 0.5 | 2.0 ± 0.9 | 0.7 ± 0.2 | 0.9 ± 0.6 | 0.5 ± 0.2 | 3.1 ± 2.5 | 0.7 ± 0.3 | 0.2 ± 0.1 |
| Maternal feces | 0.9 ± 0.3 | 0.6 ± 0.2 | 0.5 ± 0.2 | 0.7 ± 0.2 | 0.6 ± 0.1 | 0.6 ± 0.1 | 0.8 ± 0.2 | 2.8 ± 2.0 | 0.7 ± 0.2 |
| Maternal oral | 6.2 ± 3.5 | 8.1 ± 5.6 | 9.1 ± 5.1 | 0.4 ± 0.1 | 0.3 ± 0.1 | 0.3 ± 0.1 | 0.5 ± 0.2 | 0.3 ± 0.1 | 0.2 ± 0.1 |
| Milk | 4.9 ± 3.3 | 1.2 ± 0.3 | 1.1 ± 0.4 | 0.4 ± 0.1 | 0.4 ± 0.1 | 0.4 ± 0.1 | 0.5 ± 0.2 | 0.5 ± 0.1 | 0.3 ± 0.1 |
| Unknown | 87.0 ± 6.8 | 88.2 ± 6.0 | 87.3 ± 6.0 | 97.8 ± 0.4 | 97.9 ± 0.8 | 98.2 ± 0.3 | 95.1 ± 2.8 | 95.7 ± 2.0 | 98.5 ± 0.2 |
Values are means ± SEM; infant feces, n = 149; infant oral, n = 151; maternal feces, n = 162; maternal oral, n = 182; milk, n = 147.
TABLE 8.
Relative amounts (% of total) that bacterial communities found in infant oral, maternal feces, and maternal oral may contribute to the bacterial composition of milk from day 2 to 6 mo of life1
| d 2 | d 5 | d 10 | mo 1 | mo 2 | mo 3 | mo 4 | mo 5 | mo 6 | |
|---|---|---|---|---|---|---|---|---|---|
| Infant oral | 21.1 ± 9.2 | 42.6 ± 7.8 | 39.8 ± 8.5 | 56.7 ± 8.5 | 65.3 ± 7.0 | 65.2 ± 7.9 | 55.8 ± 8.8 | 66.3 ± 7.2 | 50.0 ± 8.3 |
| Maternal feces | 0.3 ± 0.1 | 0.6 ± 0.3 | 0.6 ± 0.2 | 0.6 ± 0.1 | 0.7 ± 0.2 | 0.9 ± 0.4 | 1.2 ± 0.5 | 1.8 ± 0.7 | 1.0 ± 0.4 |
| Maternal oral | 26.0 ± 7.7 | 10.8 ± 3.3 | 15.9 ± 4.8 | 2.1 ± 0.3 | 2.8 ± 0.4 | 2.6 ± 0.3 | 2.8 ± 0.4 | 3.8 ± 0.6 | 6.7 ± 2.4 |
| Unknown | 52.6 ± 9.2 | 46.1 ± 8.8 | 43.6 ± 9.4 | 40.7 ± 8.6 | 31.2 ± 7.1 | 31.3 ± 8.0 | 40.2 ± 9.1 | 28.0 ± 7.2 | 42.3 ± 8.3 |
Values are means ± SEM; infant feces, n = 149; infant oral, n = 151; maternal feces, n = 162; maternal oral, n = 182; milk, n = 147. d, day; mo, month.
Discussion
This study relates and compares the membership and composition of microbiomes from maternal milk, feces, and oral samples, and infant feces and oral samples from the same mother-infant dyad at 9 time points in the first 6 mo postpartum. Samples from the different niches showed distinct clustering at the genus level as has been shown previously for other subsets of mother-infant pairs (21–24). Bacterial communities from each site also reflected those previously reported for maternal oral (21, 24), fecal (2, 24, 26, 44), and milk (20–23, 45). Our results for the infant fecal microbiome generally concurred with previous reports (17, 46). However, we did not observe an increase in alpha diversity over time in the infant fecal microbiome as reported in some previous studies (17, 22) but this may be due to the smaller sample size in our cohort. We also observed a lower relative abundance of Bifidobacterium than other studies (∼5.4% compared with ∼20.2% and ∼30%, respectively; 17, 22). Our results also concur with previous studies on the infant oral microbiome, which was generally predominated by Streptococcus (21, 23, 24, 47, 48) and relatively high proportions of Staphylococcus. This is similar to work performed by Costello and coworkers (16) in which they also observed high relative abundances of Staphylococcus in oral samples collected from a small group of low-birthweight infants. We posit that the high relative abundance of Staphylococcus in the infant's mouth is likely associated with the high proportions of Staphylococcus in milk and on the mother's skin. With the frequent bi-directional interaction between the mammary gland and the infant's mouth during breastfeeding (49), it is not surprising to find similar bacteria in milk and infant oral swabs.
Our data do not support our a priori hypothesis that the milk microbiome would most closely resemble that of infant feces. In fact, we observed that the milk microbiome was more similar to that of infant oral and, as time progressed, became more similar to both infant and maternal oral microbiomes. These results concur with previous studies (21–23) and provide evidence that this trend continues until at least 6 mo. Nonetheless, even though the microbiomes (e.g., types of bacteria present) were different between milk and infant feces, CCA suggests that these two bacterial communities are intimately linked. Similarly, although the bacterial composition of maternal feces was distinct from that in milk, there was a strong canonical correlation between them. This provides evidence that the maternal GI microbial communities and/or factors such as maternal diet may influence the milk microbiota.
There are several important limitations to this study. Although our sample size was larger than that of some others (20, 21), it was smaller than some (22–25, 28) and represented a small geographic area. Previous evidence has indicated that the microbiomes of the GI tract, oral, and milk may differ based on geography, ethnicity, social networks, and/or diet (50–55). Future studies should investigate if and how the microbiomes of maternal-infant dyads in different populations are related to each other. In addition, insufficient statistical power does not allow us to address the influence of other factors such as mode of delivery, maternal intrapartum antibiotic prophylaxis, probiotic usage, and supplemental feedings to the infant. However, these factors need to be examined in light of previous work that suggest they may influence maternal GI (56), infant GI (57–59), infant oral (60), and milk (61–63) microbial compositions. Another limitation is that only one sample for each of the sample types was collected from the mother-infant dyad at each time point. It is unclear as to the extent of day-to-day or even within-day variation that might exist in each of the different sample types, and little data exist describing this variation. Koenig and coworkers (64) conducted a case study focusing on infant feces, in which they performed extensive sampling of the fecal microbiome in one infant from birth through 2.5 y of life. They observed considerable variation in the composition of the fecal microbiome across the span of 2–4 d. However, they also observed a temporal gradient in the community characteristics that would have been captured in our sampling scheme. For milk, we have previously shown that the milk microbiome appears to remain relatively stable across 5 wk during mid-lactation (45), but to our knowledge no study has reported daily or even within-a-day variation of the human milk microbiome. Lazarevic and coworkers (65) investigated the inter- and intra-individual variation in the salivary microbiomes from 5 adults. They concluded that the oral microbiome appeared to be stable over at least 5 d and seemed to remain stable across longer spans of time. This is similar to our findings that there is little to no change in the most abundant taxa in the maternal oral microbiome. There are also methodological limitations that should be considered such as possible biases derived from the slightly different protocols used for DNA extraction and PCR amplification. Bacterial concentrations in milk from “healthy” lactating women are also low (66) and thus, bacterial DNA profiles from milk samples might be more susceptible to “contaminating DNA” (67, 68). It should be noted that we implemented negative controls during DNA extractions and PCR, and found no evidence of contamination; however, we did not sequence the negative controls. Future studies should consider sequencing the negative controls and the appropriate use of these in downstream analyses. Another methodological limitation is that 5 MiSeq runs were conducted over the course of 3 y. Each sample type was sequenced on a different sequencing run on the same machine, but we did not implement any inter-assay sequencing controls; thus, we are unable to adjust for potential batch effects. It is noteworthy that, once all samples were sequenced, data from all runs were processed together using the same software and 16S rRNA database. Different sample types also had different average yields of sequence reads. In order to minimize the bias of having large variation in the sequencing depth between samples and sample types, we rarefied the read counts to a minimum threshold of 2,000 reads. Although we recognize that rarefying results in a loss of information, this approach has been suggested (69) to help lower the false discovery rate when large differences in average library size exist among groups. Another limitation in the study is that bacterial communities were characterized using only the targeted sequencing of the V1-V3 hypervariable region of the 16S rRNA gene. Therefore, we could not discern whether the DNA was from live or dead bacteria and were only able to characterize the majority of the sequence reads to the genus level. The results presented are also compositional in nature. Recently, Gloor and coworkers (70) reviewed the inherent limitations of compositional data and thus, caution must be used in interpreting the data presented here. Future longitudinal studies that both enumerate and classify bacteria to the species- or strain-level as well as determine the viability of the bacteria present will provide greater understanding as to the intricate interactions that may occur between bacterial communities of the mother and her infant. Finally, although our findings suggest that maternal and infant oral microbiomes are interconnected with the milk microbiome, intervention studies will be needed to confirm the directionality of these relations, should they turn out to be causal in nature.
In conclusion, microbial communities of the mother-infant epi-holobiont represent complex, collective microcosms that likely interact to maintain health in both mothers and infants (12, 71–73). The close proximity and interchange that occurs between mothers and their infants, particularly during breastfeeding, possibly influence bacterial communities of both. Understanding these complex cross-biome interactions is important as establishment of these different microbiota in various body habitats potentially has consequences for acute and chronic health of both the mother and infant.
Supplementary Material
Acknowledgments
We thank Dr. Matt Settles, Dan New, and the staff at the University of Idaho Institute for Bioinformatics and Evolutionary Studies Genomics Resources core for their expert guidance and patient work in sequencing.
Written informed consent was obtained in accordance with procedures approved by the Washington State University and the University of Idaho Institutional Review Boards.
The datasets used and/or analyzed during the current study are available from NCBI's Sequence Read Archive (PRJNA503194).
The authors’ contributions were as follows—JEW, MAM, and MKM: designed the research (project conception, development of overall research plan, and study oversight); MAY, SLB, JEW, JMC, KAL, NFB, HKP, and KMS: conducted research (hands-on conduct of the experiments and data collection); JEW, JMC, BS, and WJP: analyzed data and performed statistical analysis; JEW and MKM: wrote the paper; JEW, MAM, and MKM: had primary responsibility for the final content. All authors read and approved the final manuscript.
Notes
Supported by grants from the Bill and Melinda Gates Foundation; the National Institute of General Medical Sciences from the National Institutes of Health, P30 GM103324, and the USDA National Institute of Food and Agriculture (Hatch) through the Idaho Agricultural Experiment Station.
Author disclosures: JEW, JMC, KAL, NFB, SLB, HKP, KMS, MAY, BS, WJP, MAM, and MKM, no conflicts of interest.
Supplemental Table 1 and Supplemental Figures 1 and 2 are available from the “Supplementary data” link in the online posting of the article and from the same link in the online table of contents at https://academic.oup.com/jn/.
Abbreviations used: CCA, canonical correlation analysis; GI, gastrointestinal; GLMM, generalized linear mixed model; NMDS, nonmetric multidimensional scaling; PCoA, principal coordinates analysis; RDP, Ribosomal Database Project; rRNA, ribosomal RNA; TE, Tris-EDTA.
References
- 1. Costello EK, Lauber CL, Hamady M, Nierer N, Gordon JI, Knight R. Bacterial community variation in human body habitats across space and time. Science. 2009;326(5960):1694–7. [DOI] [PMC free article] [PubMed] [Google Scholar]
- 2. Human Microbiome Project Consortium. Structure, function, and diversity of the healthy human microbiome. Nature. 2012;486(7402):207–14. [DOI] [PMC free article] [PubMed] [Google Scholar]
- 3. Zhou Y, Gao H, Mihindukulasuriya KA, La Rosa PS, Wylie KM, Vishnivetskaya T, Podar M, Warner B, Tarr PI, Nelson De et al.. Biogeography of the ecosystems of the healthy human body. Genome Biol. 2013;14(1):R1. [DOI] [PMC free article] [PubMed] [Google Scholar]
- 4. Ding T, Schloss PD. Dynamics and associations of microbial community types across the human body. Nature. 2014;509:357–60. [DOI] [PMC free article] [PubMed] [Google Scholar]
- 5. DeGruttola AK, Low D, Mizoguchi A, Mizoguchi E. Current understanding of dysbiosis in disease in human and animal models. Inflamm Bowel Dis. 2016;22(5):1137–50. [DOI] [PMC free article] [PubMed] [Google Scholar]
- 6. McGuire MK, Meehan CL, Brooker A, Williams JE, Foster JA, McGuire MA. An evolutionary, biosocial perspective on variation in human milk microbes and oligosaccharides: an example of eco-homeorhesis?In: McGuire MK, McGuire MA, Bode L, editors. Prebiotics and Probiotics in Human Milk. United Kingdom: Elsevier Publishing; 2017, pp. 376–84. [Google Scholar]
- 7. Indrio F, Martini S, Francavilla R, Corvaglia L, Cristofori F, Mastrolia SA, Neu J, Rautava S, Spena GR, Raimoni F et al.. Epigenetic matters: the link between early nutrition, microbiome, and long-term health development. Front Pediatri. 2017;5:178. [DOI] [PMC free article] [PubMed] [Google Scholar]
- 8. Milani C, Duranti S, Bottacini F, Casey E, Turroni F, Mahony J, Belzer C, Delgado Palacio S, Arboleya Montes S, Mancabelli L et al.. The first microbial colonizers of the human gut: composition, activities, and health implications of the infant gut microbiota. Microbiol Mol Biol Rev. 2017;81(4). pii: e00036-17. doi:10.1128/MMBR.00036-17. [DOI] [PMC free article] [PubMed] [Google Scholar]
- 9. Thomas S, Izard J, Walsh E, Batich K, Chongsathidkiet P, Clarke G, Sela DA, Muller AJ, Mullin JM, Albert K et al.. The host microbiome regulates and maintains human health: a primer and perspective for non-microbiologists. Cancer Res. 2017;77(8):1783–812. [DOI] [PMC free article] [PubMed] [Google Scholar]
- 10. Dieterich CM, Felice JP, O'Sullivan E, Rasmussen KM. Breastfeeding and health outcomes for the mother-infant dyad. Pediatr Clin North Am. 2013;60(1):31–48. [DOI] [PMC free article] [PubMed] [Google Scholar]
- 11. Neu J. Developmental aspects of maternal-fetal, and infant gut microbiota and implications for long-term health. Matern Health Neonatol Perinatol. 2015;1:6. [DOI] [PMC free article] [PubMed] [Google Scholar]
- 12. Soderborg TK, Borengasser SJ, Barbour LA, Friedman JE. Microbial transmission from mothers with obesity or diabetes to infants: an innovative opportunity to interrupt a vicious cycle. Diabetologia. 2016;59(5):895–906. [DOI] [PMC free article] [PubMed] [Google Scholar]
- 13. Amenyogbe N, Kollmann TR, Ben-Othman R. Early-life host-microbiome interphase: the key frontier for immune development. Front Pediatr. 2017;5:111. [DOI] [PMC free article] [PubMed] [Google Scholar]
- 14. Le Doare K, Holder B, Bassett A, Pannaraj PS. Mother's milk: a purposeful contribution to the development of the infant microbiota and immunity. Front Immunol. 2018;9:361. [DOI] [PMC free article] [PubMed] [Google Scholar]
- 15. Dominguez-Bello MG, Costello EK, Contreras M, Magris M, Hidalgo G, Fierer N, Knight R. Delivery mode shapes the acquisition and structure of the initial microbiota across multiple habitats in newborns. Proc Natl Acad Sci USA. 2010;107(26):11971–5. [DOI] [PMC free article] [PubMed] [Google Scholar]
- 16. Costello EK, Carlisle EM, Bik EM, Morowitz MJ, Relman DA. Microbiome assembly across multiple body sites in low-birthweight infants. MBio. 2013;4(6):e00782–13. [DOI] [PMC free article] [PubMed] [Google Scholar]
- 17. Bäckhed F, Roswall J, Peng Y, Feng Q, Jia H, Kovatcheva-Datchary P, Li Y, Xia Y, Xie H, Zhong H et al.. Dynamics and stabilization of the human gut microbiome during the first year of life. Cell Host Microbe. 2015;17(5):690–703. [DOI] [PubMed] [Google Scholar]
- 18. Milani C, Mancabelli L, Lugli Ga, Duranti S, Turroni F, Ferrario C, Mangifesta M, Viappiani A, Ferretti P, Gorfer V et al.. Exploring vertical transmission of bifidobacteria from mother to child. Appl Environ Microbiol. 2015;81(20):7078–87. [DOI] [PMC free article] [PubMed] [Google Scholar]
- 19. Asnicar F, Manara S, Zolfo M, Truong DT, Scholz M, Armanini F, Ferretti P, Gorfer V, Pedrotti A, Tett A et al.. Studying vertical microbiome transmission from mothers to infants by strain-level metagenomic profiling. mSystems. 2017;2(1):e00164–16. [DOI] [PMC free article] [PubMed] [Google Scholar]
- 20. Murphy K, Curley D, O'Callaghan TF, O'Shea C-A, Dempsey EM, O'Toole PW, Ross RP, Ryan CA, Stanton C. The composition of human milk and infant faecal microbiota over the first three months of life: a pilot study. Scientific Reports. 2017;7:40597–607. [DOI] [PMC free article] [PubMed] [Google Scholar]
- 21. Drell T, Štšepetova J, Simm J, Rull K, Aleksejeva A, Antson A, Tillmann V, Metsis M, Sepp E, Salumets A et al.. The influence of different maternal microbial communities on the development of infant gut and oral microbiota. Sci Rep. 2017;7(1):9940. [DOI] [PMC free article] [PubMed] [Google Scholar]
- 22. Pannaraj PS, Li F, Cerini C, Bender JM, Yang S, Rollie A, Adisetiyo H, Zabih S, Lincez PJ, Bittinger K et al.. Association between breast milk bacterial communities and establishment and development of the infant gut microbiome. JAMA Pediatr. 2017;171(7):647–54. [DOI] [PMC free article] [PubMed] [Google Scholar]
- 23. Biagi E, Quercia S, Aceti A, Beghetti I, Rampelli S, Turroni S, Faldella G, Candela M, Brigidi P, Corvaglia L. The bacterial ecosystem of mother's milk and infant's mouth and gut. Front Microbiol. 2017;8:1214. [DOI] [PMC free article] [PubMed] [Google Scholar]
- 24. Chu DM, Ma J, Prince AL, Antony KM, Seferovic MD, Aagaard KM. Maturation of the infant microbiome community structure and function across multiple body sites and in relation to mode of delivery. Nat Med. 2017;23(3):314–26. [DOI] [PMC free article] [PubMed] [Google Scholar]
- 25. Duranti S, Lugli GA, Mancabelli L, Armanini F, Turroni F, James K, Ferretti P, Gorfer V, Ferrario C, Milani C et al.. Maternal inheritance of bifidobacterial communities and bifidophages in infants through vertical transmission. Microbiome. 2017;5(1):66. [DOI] [PMC free article] [PubMed] [Google Scholar]
- 26. Yassour M, Jason E, Hogstrom LJ, Arthur TD, Tripathi S, Siljander H, Selvenius J, Oikarinen S, Hyöty H, Virtanen SM et al.. Strain-level analysis of mother-to-child bacterial transmission during the first few months of life. Cell Host & Microbe. 2018;24:146–54. [DOI] [PMC free article] [PubMed] [Google Scholar]
- 27. Ferretti P, Pasolli E, Tett A, Asnicar F, Gorfer V, Fedi S, Armanini F, Truong DT, Manara S, Zolfo M et al.. Mother-to-infant microbial transmission from different body sites shapes the developing infant gut microbiome. Cell Host & Microbe. 2018;24:133–45. [DOI] [PMC free article] [PubMed] [Google Scholar]
- 28. Avershina E, Angell IL, Simpson M, Storrø O, Øien T, Johnsen R, Rudi K. Low maternal microbiota sharing across gut, breast milk and vagina, as revealed by 16S rRNA gene and reduced metagenomic sequencing. Genes. 2018;9:231. [DOI] [PMC free article] [PubMed] [Google Scholar]
- 29. Williams JE, Carrothers JM, Lackey KA, Beatty NF, York MA, Brooker SL, Shafii B, Price WJ, Settles ML, McGuire MA et al.. Human milk microbial community structure is relatively stable and related to variations in macronutrient and micronutrient intakes in healthy lactating women. J Nutr. 2017;147(9):1739–48. [DOI] [PMC free article] [PubMed] [Google Scholar]
- 30. Carrothers JM, York MA, Brooker SL, Lackey KA, Williams JE, Shafii B, Price WJ, Settles ML, McGuire MA, McGuire MK. Fecal microbial community structure is stable over time and related to variation in macronutrient and micronutrient intakes in lactating women. J Nutr. 2015;145(10):2379–88. [DOI] [PMC free article] [PubMed] [Google Scholar]
- 31. Settles Matt. dbcAmplicons: analysis of double barcoded Illumina amplicon data. Version 0.5.9-01122015 [software]; 2015[cited 14/03/2018]. Available from: https://github.com/msettles/dbcAmplicons [Google Scholar]
- 32. Oksanen J, Blanchet FG, Kindt R, Legendre P, Minchin PR, O'Hara RB, Simpson GL, Solymos P, Stevens MHH, Wagner H. vegan: Community Ecology Package. R Package Version 2.0-7; 2013. Available from: http://CRAN.R-project.org/package = vegan. [Google Scholar]
- 33. R Development Core Team. R: A Language and Environment for Statistical Computing. Vienna: R Foundation for Statistical Computing; 2014; Available from: http://www.r-project.org/. [Google Scholar]
- 34. Hurlbert SH. The nonconcept of species diversity: a critique and alternative parameters. Ecology. 1971;52:577–86. [DOI] [PubMed] [Google Scholar]
- 35. Whittaker R. Evolution and measurement of species diversity. Taxon. 1972;21:213–51. [Google Scholar]
- 36. Hill TC, Walsh KA, Harris JA, Moffett BF. Using ecological measures with bacterial communities. FEMS Microbiol Ecol. 2003;43(1):1–11. [DOI] [PubMed] [Google Scholar]
- 37. Ramette A. Multivariate analyses in microbial ecology. FEMS Microbiol Ecol. 2007;62(2):142–60. [DOI] [PMC free article] [PubMed] [Google Scholar]
- 38. Clarke KR. Non-parametric multivariate analyses of changes in community structure. Aust J Ecol. 1993;18:117–43. [Google Scholar]
- 39. Anderson MJ. A new method for non-parametric multivariate analysis of variance. Austral Ecol. 2001;26:32–46. [Google Scholar]
- 40. Paliy O, Shankar V. Application of multivariate statistical techniques in microbial ecology. Mol Ecol. 2016;25(5):1032–57. [DOI] [PMC free article] [PubMed] [Google Scholar]
- 41. Knights D, Kuczynski J, Charlson ES, Zaneveld J, Mozer MC, Collman RG, Bushman FD, Knight R, Kelley ST. Bayesian community-wide culture-independent microbial source tracking. Nat Methods. 2011;8(9):761–3. [DOI] [PMC free article] [PubMed] [Google Scholar]
- 42. Wang Q, Garrity GM, Tiedje JM, Cole JR.. Naïve Bayesian classifier for rapid assignment of rRNA sequences into the new bacterial taxonomy. Appl Environ Microbiol. 2007;73(16):5261–7. [DOI] [PMC free article] [PubMed] [Google Scholar]
- 43. Cole JR, Wang Q, Fish JA, Chai B, McGarrell DM, Sun Y, Brown CT, Porras-Alfaro A, Kuske CR, Tiedje JM. Ribosomal Database Project: data and tools for high throughput rRNA analysis. Nucl Acids Res. 2014;42(Database issue):D633–42. [DOI] [PMC free article] [PubMed] [Google Scholar]
- 44. Jost T, Lacroix C, Braegger C, Chassard C. Stability of the maternal gut microbiota during late pregnancy and early lactation. Curr Microbiol. 2014;68(4):419–27. [DOI] [PubMed] [Google Scholar]
- 45. Hunt KM, Foster JA, Forney LJ, Schütte UM, Beck DL, Abdo Z, Fox LK, Williams JE, McGuire MK, McGuire MA. Characterization of the diversity and temporal stability of bacterial communities in human milk. PLoS One. 2011;6(6):e21313. [DOI] [PMC free article] [PubMed] [Google Scholar]
- 46. Jost T, Lacroix C, Braegger CP, Chassard C. New insights in gut microbiota establishment in healthy breast fed neonates. PLoS One. 2012;7(8):e44595. [DOI] [PMC free article] [PubMed] [Google Scholar]
- 47. Lif Holgerson P, Harnevik L, Hernell O, Tanner ACR, Johansson I. Mode of birth delivery affects oral microbiota in infants. J Dent Res. 2011;90(10):1183–8. [DOI] [PMC free article] [PubMed] [Google Scholar]
- 48. Al-Shehri SS, Sweeney EL, Cowley DM, Liley HG, Ranasinghe PD, Charles BG, Shaw PN, Vagenas D, Duley JA, Knox CL. Deep sequencing of the 16S ribosomal RNA of the neonatal oral microbiome: a comparison of breast-fed and formula-fed infants. Sci Rep. 2016;6:38309. [DOI] [PMC free article] [PubMed] [Google Scholar]
- 49. Ramsay DT, Kent JC, Owens RA, Hartmann PE. Ultrasound imaging of milk ejection in the breast of lactating women. Pediatrics. 2004;113(2):361–7. [DOI] [PubMed] [Google Scholar]
- 50. Gupta VK, Paul S, Dutta C. Geography, ethnicity or subsistence-specific variations in human microbiome composition and diversity. Front Microbiol. 2017;8:1162. [DOI] [PMC free article] [PubMed] [Google Scholar]
- 51. Meehan CL, Lackey KA, Hagen EH, Williams JE, Roulette J, Helfrecht C, McGuire MA, McGuire MK. Social networks, cooperative breeding, and the human milk microbiome. Am J Hum Biol. 2018;30(4):e23131. [DOI] [PubMed] [Google Scholar]
- 52. Goodrich JK, Waters JL, Poole AC, Sutter JL, Koren O, Blekhman R, Beaumont M, Van Treuren W, Knight R, Bell JT et al.. Human genetics shape the gut microbiome. Cell. 2014;159(4):789–99. [DOI] [PMC free article] [PubMed] [Google Scholar]
- 53. Blekhman R, Goodrich JK, Huang K, Sun Q, Bukowski R, Bell JT, Spector TD, Keinan A, Ley RE, Gevers D et al.. Host genetic variation impacts microbiome composition across human body sites. Genome Biol. 2015;16:191. [DOI] [PMC free article] [PubMed] [Google Scholar]
- 54. Davenport ER. Elucidating the role of the host genome in shaping microbiome composition. Gut Microbes. 2016;7(2I):178–84. [DOI] [PMC free article] [PubMed] [Google Scholar]
- 55. Davenport ER, Cusanovich DA, Michelini K, Barreiro LB, Ober C, Gilad Y. Genome-wide association studies of the human gut microbiota. PLoS One. 2015;10(11):e0140301. [DOI] [PMC free article] [PubMed] [Google Scholar]
- 56. Dotterud CK, Avershina E, Sekelja M, Simpson MR, Rudi K, Storrø O, Johnsen R, Øien T. Does maternal perinatal probiotic supplementation alter the intestinal microbiota of mother and child?. J Pediatr Gastroenterol Nutr. 2015;61(2):200–7. [DOI] [PubMed] [Google Scholar]
- 57. Azad MB, Konya T, Persaud RR, Guttman DS, Chari RS, Field CJ, Sears MR, Mandhane PJ, Turvey SE, Subbarao P, Child Study Investigators; et al.; Child Study InvestigatorsImpact of maternal intrapartum antibiotics, method of birth and breastfeeding on gut microbiota during the first year of life: a prospective cohort study. BJOG. 2016;123(6):983–93. [DOI] [PubMed] [Google Scholar]
- 58. Corvaglia L, Tonti G, Martini S, Aceti A, Mazzola G, Aloisio I, Di Gioia D, Faldella G. Influence of intrapartum antibiotic prophylaxis for Group B Streptococcus on gut microbiota in the first month of life. J Pediatr Gastroenterol Nutr. 2016;62(2):304–8. [DOI] [PubMed] [Google Scholar]
- 59. Nogacka A, Salazar N, Suárez M, Milani C, Arboleya S, Solís G, Fernández N, Alaez L, Hernández-Barranco AM, de los Reyes-Gavilán CG et al.. Impact of intrapartum antimicrobial prophylaxis upon the intestinal microbiota and the prevalence of antibiotic resistance genes in vaginally delivered full-term neonates. Microbiome. 2017;5:93. [DOI] [PMC free article] [PubMed] [Google Scholar]
- 60. Boustedt K, Roswell J, Dahlén G, Dahlgren J, Twetman S. Salivary microflora and mode of delivery: a prospective case control study. BMC Oral Health. 2015;15(1):155. [DOI] [PMC free article] [PubMed] [Google Scholar]
- 61. Fernández L, Arroyo R, Espinosa I, Marín M, Jiménez E, Rodríguez JM. Probiotics for human lactational mastitis. Benef Microbes. 2014;5(2):169–83. [DOI] [PubMed] [Google Scholar]
- 62. Jiménez E, Fernández L, Maldonado A, Martín R, Olivares M, Xaus J, Rodríguez JM. Oral administration of Lactobacillus strains isolated from breast milk as an alternative for the treatment of infectious mastitis during lactation. Appl Environ Microbiol. 2008;74(15):4650–5. [DOI] [PMC free article] [PubMed] [Google Scholar]
- 63. Maldonado-Lobón JA, Díaz-López MA, Carputo R, Duarte P, Díaz-Ropero MP, Valero AD, Sañudo A, Sempere L, Ruiz-López MD, Bañuelos O et al.. Lactobacillus fermentum CECT 5716 reduces Staphylococcus load in the breastmilk of lactating mothers suffereing breast pain: a randomized controlled trial. Breastfeed Med. 2015;10(9):425–31. [DOI] [PubMed] [Google Scholar]
- 64. Koenig JE, Spor A, Scalfone N, Fricker AD, Stombaugh J, Knight R, Angenent LT, Ley RE. Succession of microbial consortia in the developing infant gut microbiome. PNAS. 2011;108(Suppl 1):4578–85. [DOI] [PMC free article] [PubMed] [Google Scholar]
- 65. Lazarevic V, Whiteson K, Hernandez D, Francois P, Schrenzel J. Study of inter- and intra-individual variations in the salivary microbiota. BMC Genomics. 2010;11:523. [DOI] [PMC free article] [PubMed] [Google Scholar]
- 66. Boix-Amorós A, Collado MC, Mira A. Relationship between milk microbiota, bacterial load, macronutrients, and human cells during lactation. Front Microbiol. 2016;7:492. [DOI] [PMC free article] [PubMed] [Google Scholar]
- 67. Glassing A, Dowd SE, Galandiuk S, Davis B, Chiodini RJ. Inherent bacterial DNA contamination of extraction and sequencing reagents may affect interpretation of microbiota in low bacterial biomass samples. Gut Pathog. 2016;8:24. [DOI] [PMC free article] [PubMed] [Google Scholar]
- 68. Salter SJ, Cox MJ, Turek EM, Calus ST, Cookson WO, Moffatt MF, Turner P, Parkhill J, Loman NJ, Walker AW. Reagent and laboratory contamination can critically impact sequence-based microbiome analyses. BMC Biol. 2014;12:87. [DOI] [PMC free article] [PubMed] [Google Scholar]
- 69. Weiss S, Xu ZZ, Peddada S, Amir A, Bittinger K, Gonzalez A, Lozupone C, Zaneveld JR, Vázquez-Baeza Y, Birmingham A et al.. Normalization and microbial differential abundance strategies depend upon data characteristics. Microbiome. 2017;5:27. [DOI] [PMC free article] [PubMed] [Google Scholar]
- 70. Gloor GB, Macklaim JM, Pawlowsky-Glahn V, Egozcue JJ. Microbiome datasets are compositional: and this is not optional. Front Microbiol. 2017,; 8:2224. [DOI] [PMC free article] [PubMed] [Google Scholar]
- 71. Dogra S, Sakwinska O, Soh SE, Ngom-Bru C, Brück WM, Berger B, Brüssow H, Karnani N, Lee YS, Yap F et al.. Rate of establishing the gut microbiota in infancy has consequences for future health. Gut Microbes. 2015;6(5):321–5. [DOI] [PMC free article] [PubMed] [Google Scholar]
- 72. Dogra S, Sakwinska O, Soh SE, Ngom-Bru C, Brück WM, Berger B, Brüssow H, Lee YS, Yap F, Chong YSGUSTO Study Group; et al.; GUSTO Study GroupDynamics of infant gut microbiota are influenced by delivery mode and gestational duration and are associated with subsequent adipositiy. MBio. 2015;6(1):e02419–14. [DOI] [PMC free article] [PubMed] [Google Scholar]
- 73. Garcia-Mantrana I, Collado MC. Obesity and overweight: impact on maternal and milk microbiome and their role for infant health and nutrition. Mol Nutr Food Res. 2016;60(8):1865–75. [DOI] [PubMed] [Google Scholar]
Associated Data
This section collects any data citations, data availability statements, or supplementary materials included in this article.