

Abstract
Bottom-up biology is an expanding research field that aims to understand the mechanisms underlying biological processes via in vitro assembly of their essential components in synthetic cells. As encapsulation and controlled manipulation of these elements is a crucial step in the recreation of such cell-like objects, microfluidics is increasingly used for the production of minimal artificial containers such as single-emulsion droplets, double-emulsion droplets, and liposomes. Despite the importance of cell morphology on cellular dynamics, current synthetic-cell studies mainly use spherical containers, and methods to actively shape manipulate these have been lacking. In this paper, we describe a microfluidic platform to deform the shape of artificial cells into a variety of shapes (rods and discs) with adjustable cell-like dimensions below 5 μm, thereby mimicking realistic cell morphologies. To illustrate the potential of our method, we reconstitute three biologically relevant protein systems (FtsZ, microtubules, collagen) inside rod-shaped containers and study the arrangement of the protein networks inside these synthetic containers with physiologically relevant morphologies resembling those found in living cells.
Keywords: microfluidics, lab-on-a-chip, bottom-up biology, synthetic cell, morphology control, droplets, liposomes
Throughout evolution, cells have radiated into a dazzling variety of morphologies, where prokaryotes are found in the shape of, for example, rods, spheres, and spirals,1 archaea can exhibit even triangular or flattened square shapes,2 and eukaryotic cells range from orderly shaped plant cells3 to the extensively branched dendritic cells of the immune system.4 This wide morphological diversity raises questions on the underlying reasons and the interplay between morphology and the myriad of internal cellular processes. The shape and size of a cell are the product of internal molecular processes that drive cellular growth and division and are also guided by external environmental factors such as the surrounding cells or simply the amount of available space. The cellular container shell itself is maintained by cytoskeleton and membrane machineries5−9 that are present in all kingdoms of life.
Unicellular organisms may benefit from specific shapes for a selective advantage,10,11 while for multicellular organisms, the cellular morphology is closely linked to cell–cell interactions and the extracellular matrix (ECM).12,13 Similarly, cells in colonies of unicellular organisms such as biofilms display a morphological variation depending on their function at a particular position and time within the colony lifecycle.14,15 To accommodate such variations in morphology, the processes inside a cell should be robust against variations of the cellular shape. For example, to ensure faithful division, pattern-formation processes should successfully guide the cellular division machinery to the right location, irrespective of the precise shape and size of the cellular boundary.16,17 The mechanisms through which such processes remain robust in varying environments and boundary conditions are a topic of active research.18 Confinement and shape not only influence cellular processes but also have an effect on extracellular structures such as the ECM, the fibrous network located in the space between eukaryotic cells in tissues and prokaryotic cells in biofilms.19,20 The large morphological variety of cells also poses interesting questions from the perspective of polymer physics. Cells contain many polymers, such as cytoskeletal components and the genomic material. The spatial distribution and dynamics of polymers are in general sensitive to the spatial confinement,21−26 and as a result, biopolymers such as actin networks27 and the genome28−30 will re-organize upon morphological perturbation of the cellular container.
Confronted with the imposing complexity and connectivity of cellular processes, researchers are aiming to reconstitute essential cellular systems with a minimal set of components inside controlled confinements.31,32 The nature of the artificial containers used in these endeavors is quite diverse, ranging from liposomes, single-emulsion droplets (water-in-oil droplets, from now on called droplets), to double-emulsion droplets (water-in-oil-in-water droplets, henceforth called double emulsions) and even solid-state microchambers.33,34 With such bottom-up approaches, cytoskeletal components (e.g., actin,35 tubulin,36 MreB,37 FtsZ38), cytokinesis and segregation machinery (e.g., actin-myosin rings,39 mitotic spindles40), cell-free expression systems (e.g., cell extracts,41 PURE system42), pattern formation systems (e.g., the Min system43), and genomes44 can be encapsulated inside such artificial containers (Figure 1, top).
Figure 1.
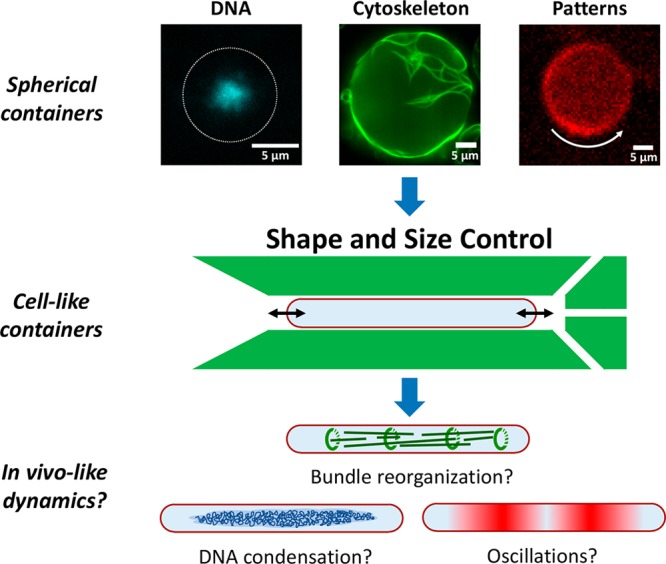
Shape and size control of synthetic cells to explore the influence of confinement and geometry on cellular processes. Most current approaches to bottom-up biology encapsulate purified cellular components inside large, spherical containers. For example, on the top row, three prokaryotic key systems, which in some form are present in all kingdoms of life, are reconstituted in spherical droplets: DNA (E. coli nucleoid, blue), cytoskeletal components (FtsZ, green), and pattern formation systems (Min proteins, red). However, these key systems are, like most processes and structures inside a cell, sensitive to the confinement size and the geometry. Using a microfluidic approach (middle), we manipulate the shape and size of the initially spherical synthetic cells. In this manner, we are able to experimentally access a set of parameters which were hitherto unexplored in the field of bottom-up biology. The method offers the possibility of observing more in vivo-like dynamics for various cellular systems encapsulated inside synthetic cells (bottom).
The shape of the artificial containers is an often-overlooked parameter in mimicking cells. Indeed, thus far, the majority of synthetic cell studies used simple spherical containers with a diameter of 10–50 μm.33 However, most living cells are nonspherical, and while this size range is fitting for eukaryotic cells, it applies much less so for the more abundant bacterial and archaeal cells. In the past two decades, research in bottom-up biology has also been performed in microfabricated chambers that allow for a range of shapes,45−47 but those are obviously nondeformable, preventing the observation of dynamics as a function of changing confinement size. Furthermore, the open-top geometry (“a chamber without a roof”) that was used in some cases45 decreases the ratio between the bulk volume of the protein reservoir and the surface with which these proteins interact, introducing ambiguities in the local protein concentrations that are important for pattern-formation processes.18 There have been some reports on the manipulation of spherical vesicles, but these efforts mainly concentrated on the immobilization of droplets through mechanical trapping48−51 and some elaborated manipulation with dielectrophoresis.52 While Boukellal et al. introduced a method to trap droplets in tubular-shaped confinements,53 these containers were so large (upward of 100 μm) that they were not well applicable for synthetic cell research. Furthermore, methods to split containers on-chip by running them against T- or Y-shaped junctions have been developed both for droplets54 and liposomes,55 offering a tool to obtain containers with half the original volumes. Some osmosis-based size control of spherical droplets and double emulsions was demonstrated recently as well,41,44 but again, the involved size ranges were not well suited for reconstituting bacterial systems in artificial cells.
Here, we introduce a general microfluidic platform to control the shape and size of various deformable containers, from droplets to liposomes, at cell-like scales in the sub-5 μm range (Figure 1, middle). Using this system, we are able to access the same shape and size parameter space as is present in the cells from which the reconstituted components are isolated. Specifically, we are able to shape various artificial cell containers into confinements with dimensions down to almost 1 μm. Furthermore, we demonstrate the ability to precisely and reversibly control the size of these containers. The method offers experimental avenues to unravel the interconnection between cellular processes and the confinement geometry. We provide examples for three biologically relevant protein systems (FtsZ, microtubules, collagen) inside rod-shaped containers. We anticipate that this platform will contribute to closing the gap between the dynamics in artificial cells and the in vivo dynamics of real cells (Figure 1, bottom).
Results and Discussion
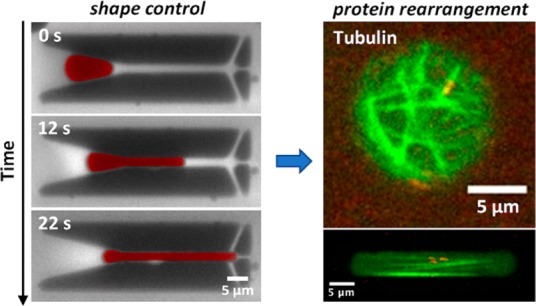
To obtain an efficient system for shaping artificial cells on-chip and impose user-defined dimensions to a variety of initially spherical containers, we designed and fabricated a simple but effective microfluidic chip with an array of local micropatterned structures (“traps”). We first tested the functionality of the design using water-in-oil droplets. Technical details of the experimental procedure, from the droplet production to the device design and operation, are described in Figure S1. Figure 2a shows an example of the shape manipulation process of a droplet that is transformed into a tubular geometry: A spherical droplet gets caught at the trap entrance and subsequently is reshaped into a cylindrical shape. Because of the presence of fluorescent lipids into the oil phase, the trap profile and the droplet are clearly distinguishable as dark regions. Fluid flow through the trap, necessary to catch the droplets, was ensured by including three exit holes that are visible at the end of the structure. The entrance of the traps has a conical funnel shape that narrows down to the predefined trap width, so that a minimal fluid pressure has to be applied to squeeze the droplets inside. Upon entering the trap, the droplet gets deformed and remains fixed in the desired shape. With an array of these traps, it is possible to stably observe tens of such rod-shaped droplets in a single field-of-view (Figure S2a). Aided by the precision provided by cleanroom-based fabrication techniques, we tested the versatility of our trap design over a wide range of confinements and aspect ratios. To mimic small organisms such as Escherichia coli, we mainly focused our efforts on obtaining small containers with diameters below 5 μm, thereby recreating the rod-shaped morphology that many bacteria possess.1 By varying both the width of the traps and the overall height of the device, we obtained rod-shaped droplets of arbitrary lengths and widths ranging from 4.8 μm down to 1.4 μm (Figure 2b and Figure S2b). We determined the trapping efficiency of these designs as the ratio of the number of traps that stably contained a tubular droplet over the total number of traps present in the device: For the design with the largest trap width (4.8 μm, Figure 2b), we found that 98% of the traps (N = 103/105) contained a rod-shaped droplet. Designs with narrower traps have a higher hydrodynamic resistance56 and hence require higher fluid pressures and, as a result, are less straightforward to operate. For the design with the narrowest traps achieved in this work (1.4 μm, Figure 2b), we found that 33% (N = 19/57) of the traps contained a rod-shaped droplet. We also explored the potential of our microfluidics-based approach to deform spherical droplets into flat circular discs (“pancakes”). To do so, we employed multiheight microfluidic devices. Figure 2c shows an example where spherical droplets first travel undeformed within a large channel of 15 μm height. When they encounter narrower channels of 2 μm height, they are forced into the confining channels by the fluid pressure and consequently are deformed into pancake-like containers that mimic the morphology of, for example, certain disc-shaped archaea.2 In addition, the disc-shaped droplets can be immobilized and stored for analysis in an array of microfluidic traps, as shown in Figure S1c.
Figure 2.

Shape control of water-in-oil droplets via microfluidic structures. (a) Droplet loading into a tubular trap: The droplet is captured at the entrance of the trap and progressively squeezed into the confinement, assuming the imposed geometry. RhodPE lipids are dissolved in the oil phase to enhance the contrast between the oil phase, the aqueous phase, and the profile of the trap. (b) The tubular trap design offers the possibility to deform droplets into rod-shaped geometries of different dimensions. To visualize the droplets, Alexa647 fluorescent dye is encapsulated in the aqueous phase. (c) A multiheight microfluidic device is used for the deformation of spherical droplets into thin disc-shaped containers or “pancakes”. As they pass from a 15 μm to a 2 μm high channel, the spherical droplets get consequently squeezed into a disc shape. The figure shows the deformation process of two droplets, marked with a red star and green triangle. The images combine both bright-field and fluorescent signals from the Alexa647 fluorescent dye encapsulated inside the droplets.
Another fascinating aspect of living systems is the capacity of cellular processes to adapt and re-arrange over time as the cell changes during its growth and life cycle. To enable the investigation of such phenomena in vitro, isolated cellular components should be reconstituted into artificial containers with a size that can be controllably changed over time. Using a system inspired by the work of Shim et al.,57 we managed to vary the size of the droplets captured in the traps. Specifically, we assembled a multilayer polydimethylsiloxane (PDMS) device consisting of three parts, see Figure 3a: a thick rectangular piece of PDMS containing a hole (“water chamber”) sitting on top of a thin layer imprinted with microfluidic traps, which in its turn is sealed off at the bottom by a PDMS-covered glass coverslip. By taking advantage of the fact that PDMS is permeable to water, it is possible to induce osmosis between the droplets and the water chamber through the thin PDMS membrane that separates them. Consequently, when the aqueous solution of the droplets has a salt concentration lower or higher compared to the one in the water chamber, water is able to flow across the PDMS membrane to restore isotonicity, leading to, respectively, shrinking or expanding droplets. When forced into a tubular shape, the droplets consequently re-adjusted their volume by shortening or elongating along their main axis inside the traps (Figure 3b, left and right). Immediately after the trapping, for the first 20 min, the length of the droplets changed quickly to reduce the osmolarity difference with the water chamber. As the osmotic balance between the droplets and the water chamber is approached, the size of the droplets tended to stabilize. By contrast, in isotonic conditions, the volume of the droplets remained approximately constant (Figure 3b, middle).
Figure 3.

Size control of water-in-oil droplets via a multilayer microfluidic device. (a) Schematic of the three different layers composing the device. The bottom layer (gray) consists of a PMDS-covered glass coverslip, followed by a second layer (green) of a thin PDMS membrane imprinted with the microfluidic channels and traps design. The design includes two inlet channels, the first one for the droplets and a second one for oil, which cross each other in a large T-junction. After this junction, a single large channel leads to the array of traps to capture and manipulate the droplets. The third layer (blue) is a thicker piece of PDMS containing a water chamber, placed above the array of traps. (b) Water-in-oil droplets contain Alexa647 for visualization and 200 mM KCl. Depending on the relative salt concentration between the water chamber and the droplets, different behaviors are observed over time: In hypotonic conditions (100 mM KCl in water chamber), the droplets expand (left); in isotonic conditions (200 mM KCl in the water chamber), the droplet size remains qualitatively stable (center); and in hypertonic conditions (300 mM KCl in the water chamber), the droplets shrink consistently relative to their original volume (right).
Beyond droplets, we explored size and shape manipulation of containers that are physiologically closer to living cells, namely, double emulsions and liposomes. We used our microfluidic octanol-assisted liposome assembly (OLA) platform to produce double emulsions on-chip (Figure 4a). By dissolving the lipids in oleic acid, the double emulsions undergo a process of partial dewetting,58,59 by which the excess solvent and lipids accumulate in a side pocket. The volume of double emulsions can be varied using an applied osmotic pressure difference due to new buffer fluid that is administered through side channels (Figure 4a). Upon inducing such volume changes, excess material in the side-pocket may act as a reservoir to concurrently re-adjust the surface area (Figure 4b). In other words, as the water flows through the membrane to restore osmotic balance, the surface automatically re-adjusts its area to fit the new volume, using the side pocket as a source or sink for membrane lipids. To check this hypothesis, we produced and immobilized oleic acid double emulsions in an array of traps (Figure 4c). Next, an aqueous solution was flushed via a feeding channel to create an osmotic imbalance between the inner and outer aqueous environment of the double emulsions. In hypertonic conditions, the osmosis process led to a fast reduction of the double emulsion volume (Figure 4d, top), which shrank from an average diameter value d = 12.3 ± 0.1 μm down to d = 7.5 ± 0.1 μm (N = 45). Simultaneously, the membrane surface area re-adjusted to the new volume, with a consequent visible growth of the side pockets. When the original osmotic conditions were restored, the same double emulsions underwent the inverse process (Figure 4d, bottom): The volume expanded back close to the original size (d = 11.1 ± 0.2 μm), with an associated membrane area increase at the cost of the side pocket, showing that the process is largely reversible. Looking at the variation of the double emulsion diameters over time compared to their original size (Figure 4e), the shrinkage and the expansion processes appeared symmetric. The size variation was initially slow and then was followed by a phase of faster size change. As the osmolarity difference between the outer and the inner aqueous phases was re-equilibrated, the size variation slowed down again. The degree by which the double emulsions shrank or expanded under, respectively, hypertonic or hypotonic conditions was quantified by measuring the diameter of each double emulsion after and before each size manipulation. The ratio between these diameters was obtained, and two distinct peaks are observed (Figure 4f). This indicates that specific osmolarity differences lead to specific volume re-adjustments and that the size manipulation is a well-controlled process. These data show that the size of the double emulsions can be tuned through the surrounding osmotic conditions in a reversible manner, providing artificial scaffolds for reconstituting cellular systems into containers of adaptable size.
Figure 4.

Size control of oleic acid double emulsions on-chip. (a) Design of the microfluidic device: Six channels containing an inner aqueous phase, a lipid phase, and an outer aqueous phase cross in a junction where double emulsions are produced. The inner aqueous solution blows a bubble into two streams of DOPC lipids dissolved in oleic acid. The resulting lipid film is pinched-off by the outer aqueous stream, and a double emulsion is formed. An array of traps downstream from the production junction immobilizes the double emulsions, and two additional feeding channels allow further adjustment of the outer aqueous solution forming the environment of the trapped double emulsions. (b) Schematic representation of an oleic acid double emulsion: By inducing an osmotic pressure difference, water is able to flow through the membrane to re-establish osmotic equilibrium. At the same time, the side pocket formed by the excess of lipids and solvent can serve as a reservoir for the surface to expand or shrink as required by the volume change. (c) Fluorescent image showing the production process and the trapping of oleic acid double emulsions on-chip. RhodPE fluorescent lipids allow the visualization of the lipid phase. (d) By inducing an osmotic pressure difference, it is possible to vary the size of double emulsions. Both inner aqueous and outer aqueous solutions initially contain 25 mM sucrose. After a solution containing 200 mM sucrose is flushed through the feeding channel, to re-establish osmotic equilibrium, the double emulsions consequently shrink (top). Afterward, the same batch of double emulsions is re-exposed to the original outer aqueous solution (bottom), so their volume re-expanded. (e) Size variation of double emulsions (N = 10) over time: In hypotonic or hypertonic conditions, the diameter of the double emulsions, respectively, increased or decreased over time. (f) Histogram showing the ratio of the double emulsion (N = 45) diameters measured at the end (df) and at the beginning (di) of both processes. In a hypertonic condition, the double emulsions shrink by an average factor of df/di = 0.61 ± 0.01. When back in hypotonic conditions, we measured a factor df/di = 1.49 ± 0.02.
Encouraged by the ease of the size manipulation of double emulsions, we verified that it is possible to deform them into rod shapes resembling bacterial cells. To do so, we punched a hole at the end of the microfluidic circuit (“collection well”, Figure 5a) and collected double emulsions from the well to transfer them into the device containing the tubular traps. The insertion of double emulsions into the traps is found to be significantly aided by the presence of the side-pocket, since the membrane can dynamically adapt to the new geometry by using material from the side-pocket reservoir to accommodate the changing surface-to-volume ratio. Figure 4c–d shows two examples where we deformed double emulsions into tubular geometries with widths of 4 and 1.3 μm. For the former design, we found that a trapping yield of nearly 100% (Figure 5b) is easily achievable, meaning that essentially all the traps (N = 105 per device) contained a double emulsion after a few minutes. As with droplets, filling smaller traps appeared more difficult as double emulsions occasionally broke as a result of the higher pressure required for the entrapping due to the higher hydrodynamic resistance.56 Given that the deformation of double emulsions worked for the traps with dimensions as small as 1.3 μm, we assumed that it would also be successful for the larger sizes explored with droplets (Figure 2b). Next to double emulsions, we also explored the deformation of liposomes from spherical into other shapes. Since liposomes only tolerate a small areal strain (∼5%) before rupture,60 we induced an external osmotic pressure to create a reduced volume and thus excess surface area,61 which made the liposomes “floppy” and predisposed to accommodate the increase in surface-to-volume ratio upon shape change. When transferred inside the trap device, we observed a fraction of liposomes that successfully deformed into the traps, alongside with liposomes showing various defects (Figure S3a). Possibly, the induced floppiness made the liposomes prone to damage during the transfer process into the trap device, resulting in the observed heterogeneous population. Still, we managed to obtain liposomes comparable in size and shape to E. coli cells (Figure S3b), which is a helpful step toward the proper recreation of artificial minimal cells.
Figure 5.

Shape manipulation of oleic acid double emulsions on-chip. (a) Schematic cross section of the collection well: At the end of the microfluidic circuit, after the production junction, a 4 mm diameter hole is punched. The double emulsions contain 5 mM dextran to make them denser than the environment and consequently sink to the bottom of the well. After sufficient production, double emulsions are pipetted from the well and introduced into a device containing the microfluidic traps. (b) Fluorescent image showing an array of double emulsions captured in tubular traps. Thanks to their side pocket, which serves as a membrane reservoir, double emulsions are easily reshaped, so that almost all traps in the device (N = 105) contained a double emulsion. Fluorescent signal comes from RhodPE lipids in the lipid phase. (c) Zoom-in of single double emulsions in tubular traps of different dimensions: 5 μm diameter (top) and 2 μm diameter (bottom). (d) Fluorescent profiles measured at the midcell cross section of tubular double emulsions. The peaks indicate the location of the membrane and provide a measure of the width of the double emulsion.
To illustrate how our platform can be useful for applications in the synthetic cell field, we encapsulated a variety of fiber-network forming proteins inside nonspherical containers. For these experiments, we chose droplets, due to the ease of their production process. Specifically, we studied three important proteins from diverse biological systems and environments: FtsZ, a key protein necessary for division in almost all bacteria;62 its eukaryotic homologue tubulin, which is a key element of the cytoskeleton in eukaryotic cells; and collagen,63 the most abundant protein in extracellular matrix structures. First, to reconstitute FtsZ bundles on a lipid membrane, a soluble version of ZipA, a protein responsible for anchoring FtsZ to the membrane in Gammaproteobacteria (like E. coli),64 was added to the inner aqueous phase. This soluble version of ZipA, provided with a His-Tag, offers to FtsZ-filaments a way to properly dock to a membrane composed by a mixture of DOPC and DGS-NTA lipids. When such a system was reconstituted in liposomes, FtsZ formed long filamentous bundles on the surface (Figure S4), which arranged in a single ring-like structure as the dimensions of the liposomes approached the sub-5 μm range. To verify whether such a system could also be reconstituted into droplets for subsequent shape-manipulation with our microfluidic platform, we assembled a lipid monolayer at the water–oil interface of droplets by adding the necessary lipids to the oil phase. Similar to what was observed in liposomes, both in spherical (Figure 6a, top) and in rod-shaped droplets (Figure 6a, middle), FtsZ formed long filamentous bundles localized at the droplet surface. The clear presence of bundles on the surface, compared to the lumen, indicates the successful attachment of FtsZ to the lipid monolayer at the interface. Next, we tested whether it is possible to grow microtubules inside the rod-shaped droplets. Tubulin seeds bound to nonhydrolyzable guanosine triphosphate (GMPCPP) were co-encapsulated in the inner aqueous solution, together with tubulin dimers and guanosine triphosphate (GTP) (Figure 6b, middle). As GTP hydrolysis is required for the disassembly of microtubules, the tubulin seeds act as a stable template from which the microtubules can grow. Since the seeds and the tubulin dimers were labeled with different dyes, it was possible to observe long microtubules (green) that were grown from the seeds (red) and spanned the length of the rod-shaped droplet following the prevalent axis of symmetry (Figure 6b, right), contrasting to the situation in spherical droplets (Figure 6a, left), where the microtubules grew without an obvious preferential orientation. This observation is confirmed by a quantitative analysis of the microtubule orientations: In the spherical droplets, microtubules did not show any strong preferential orientation, while in rod-shaped droplets, the measured angles distinctly peaked around 0°, that is, the microtubules were aligned along the droplet main axis (Figure 6b, right). Finally, we applied our method to an in vitro assay for collagen type 1, which is an important component of the extracellular matrix. Figure 6c shows that it is possible to successfully reconstitute collagen type 1 fibers inside rod-shaped droplets. Similar to the microtubules, a quantitative analysis of the fiber orientations (Figure 6c, right) showed that the collagen fibers oriented themselves along the symmetry axis of the cylindrical container, which again is markedly different to what is observed in spherical droplets.
Figure 6.

Impact of container geometry on the organization of various protein bundle networks encapsulated inside rod-shaped droplets. (a) FtsZ filamentous bundles in spherical (top) and rod-shaped (middle) water-in-oil droplets. The FtsZ superstructures visible on the bottom plane of the rod-shaped droplet (middle) adhere to the surface of the droplet, as is also seen on the equatorial plane. A lipid monolayer containing DGS-NTA lipids (dark red) and DOPC (red) is assembled at the water–oil interface. By replacing its transmembrane tail with a His-tag, which can bind to the Ni-tag on the headgroup of DGS-NTA lipids, ZipA functions as a membrane anchor for the FtsZ filaments (bottom). FtsZ is labeled with Alexa488. (b) Microtubules grown in spherical (left) and rod-shaped droplets (middle). As shown both qualitatively in the images and quantitatively by the analysis of the fiber orientations (right), the microtubules inside spherical droplets (N = 10) grow without any strong preferential orientation, whereas in the rod-shaped droplets (N = 10), the network appears to follow the symmetry axis of the droplet. For the reconstitution of microtubules, GMPCPP stabilized seeds (labeled with rhodamine tubulin) serve as templates for the growth of microtubules through the addition of tubulin dimers in solution (bottom). Fluorescent HiLyte 488 tubulin was used to label the microtubules. (c) Collagen fibril reconstituted inside spherical- (left) and rod-shaped droplets (middle). Similar to what is observed for microtubules, the analysis of the fiber orientation (right) shows that the collagen network in spherical droplets (N = 4) remains weakly organized, but inside the rod-shaped droplets (N = 4), it re-arranges to align with the symmetry axis of the droplet. As sketched (middle-bottom), a collagen fibril is formed by the staggering of collagen triple-helix monomers (red) driven by noncovalent interactions, which give rise to a characteristic periodic pattern (blue and light-blue).
Conclusions
In this paper, we presented a method that enables the control of the shape and the size of a range of cell-like containers, a useful research tool within the synthetic cell field. In fact, as is schematically illustrated in Figure 7, our system provides access to a much broader range of morphologies than is currently possible in the synthetic cell field. By pushing the boundaries of both volume and aspect ratio by 1–2 orders of magnitude as compared to previous methods, we bridged the gap between the dimensions of natural cells and artificial containers inside which the isolated cellular components are reconstituted.
Figure 7.
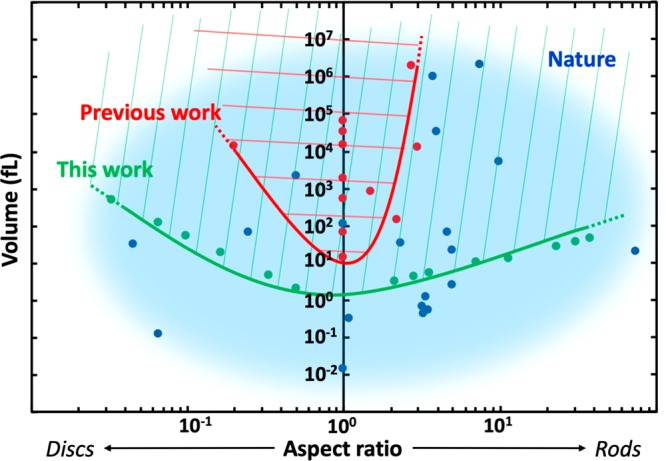
Phase diagram comparing the shape and size of various cells found in nature with the deformable artificial containers used in previous research work and those presented in this paper. Assuming roughly spheroid-like containers and cells, the morphological space is defined by the aspect ratio of the smallest and the largest axis of the containers (x-axis) and the volume (y-axis). The space is divided between rods (right), spheres (y-axis), and discs (left). In blue, an approximate cloud encircles the morphologies adopted by a selected number of living organisms (blue dots, see Table S6). The red dots represent container geometries reported previously in the field (see Table S6), with the red line showing the lower morphological boundaries achieved so far. Similarly, the green line delineates the new lower boundaries achieved within this work. Compared to previous research, we expanded the boundaries of volume and aspect ratio by 1–2 orders of magnitude. This advance enables us to cover a broader range of shapes and sizes, and it bridges the gap between artificial and natural cells.
We showed that droplets, double emulsions, and liposomes can be deformed into a variety of shapes, from tubes of different diameters and lengths, to pancake-shape discs with a high aspect ratio between their height and diameter. Second, through the principle of osmosis, we were able to regulate the volume of such artificial cells. And finally, as a proof-of-concept of the range of possibilities that our approach offers, we encapsulated three different filamentous protein networks inside droplets with a tubular shape. The resulting organization of the protein networks in the tubular containers was markedly different from the situation in spherical droplets, underlining the importance of the container shape and size.
Reconstitution of protein bundles such as microtubules and extracellular matrix collagen inside shaped droplets enables us to study how fibrous networks adapt their conformation depending on the geometry of the confinement. Microtubular orientation is an important feature in eukaryotic cells to establish cell polarity: By elongating from the nucleus toward cell extremities, microtubules drive several polarizing factors toward opposite cell poles. Differently from what is observed in spherical droplets, microtubules encapsulated into rod-shaped droplets appeared aligned along the main symmetry axis of the confinement. The shape and dimensions of the confinement, together with the microtubule alignment, are features that well resemble the conditions found in model eukaryotic cells, such as fission yeast.65 The possibility to control the orientation of cytoskeletal components inside artificial containers thus offers the possibility to reconstitute microtubule-driven polarization in minimal artificial cells. Similar phenomena are observed for the extracellular matrix. In vivo, the ECM is secreted and assembled in the narrow spaces between cells, and collagen matrix fibers therefore adapt their arrangement depending on the imposed geometrical constraints. Our microfluidic platform provides microscopic confinements with dimensions spanning a broad range of aspect ratios, resembling those found in some tissues.66 As in vivo, our results indicate that the geometry of the confinement directly influences the collagen matrix configuration. Similar to what is observed in many tissues, e.g., the cornea or the tendon,67,68 we can induce the collagen fibers to align along a prevalent symmetry axis. Being able to recreate the orientation of the collagen fibers in the extracellular matrix is of fundamental importance, since the network architecture determines the tissue response to mechanical deformations. Thus, we anticipate that the possibility provided by our method to control the collagen network arrangement via the morphology of the container will allow to more closely mimic the architecture and mechanical response of living tissues.
Moreover, since our platform uses deformable containers, it provides the opportunity to observe how protein networks and other biopolymers re-arrange dynamically in response to evolving boundaries and gradual changes in crowding and salt concentrations. The reversibility of the volume change of double emulsions (Figure 4) makes it possible to study whether changes in the protein network configuration are reversible or display some form of hysteresis. Given the range of sizes that can be enforced upon vesicles, our approach also allows to study the influence of the confinement surface curvature on the alignment and positioning of membrane-bound proteins, which is key for many proteins involved in membrane remodeling.
We believe that our approach to shape and size control can be broadly applied. The ability to tune the container volume will, for example, aid the study of how the crowding environment impacts the dynamics of various cellular processes. The approach also allows to explore the relation between membrane curvature and the spatial arrangement of lipids domains and membrane proteins.69 Finally, similar to recent in vivo studies of shape-sculpted bacteria,16,17,29,30,70 the platform offers the chance to investigate pattern formation and chromosome dynamics as a function of confinement geometry.
Methods
Microfabrication
Microfluidic devices were fabricated in a cleanroom with the following protocol. A layer of hexamethyldisilazane (HMDS, BASF SE) was deposited on a 4-in. silicon wafer by spin-coating at 1000 rpm for 1 min. The wafer was baked at 200 °C for 2 min. Subsequently, a layer of NEB22a negative e-beam resist (Sumitomo Chemical) was spin-coated at 1000 rpm for 1 min and baked at 110 °C for 3 min. Correct adhesion of the NEB22a onto the silicon surface is ensured by the first HMDS layer. The designs were written on the coated wafer using electron beam lithography (EBPG-5000+, Raith GmbH, dose: 16 μC cm–2, acceleration voltage: 100 kV, aperture: 400 μm). Post-exposure baking of wafer was performed at 105 °C for 3 min. The patterns were then developed by submerging the wafer in MF322 (Dow Chemical Company) for 1 min, then in diluted MF322 (distilled water:MF322 = 1:10) for 30 s, and finally rinsing in distilled water for 30 s. Bosch process deep reactive-ion etching was used to dry etch the structures into the silicon wafer, with an inductive coupled plasma reactive-ion etcher (Adixen AMS 100 I-speeder). During the process, the pressure was kept at about 0.04 mbar, the temperature of the wafer was kept at 10 °C, while the plasma temperature was 200 °C. The sample holder was held at 200 mm from the plasma source. The etching step involved 200 sccm SF6 for 7 s with the ICP power set to 2000 W without a bias on the wafer itself. The passivation step was done with 80 sccm C4F8 for 3 s with the ICP power set to 2000 W and the bias power on the wafer alternate with a low frequency: 80 W, for 10 ms, and 0 W for 90 ms. Total etching time depended on the desired final height of the device (etching depths for the wafers containing tubular traps used in each figure are listed in Table S5). Finally, the excess of resist was removed from the wafer by exposure to oxygen plasma for 10 min. In the case of multiheight devices (Figure 2b), the parts of the device with bigger height were patterned on the wafer after the small channels through optical lithography, being careful to properly align the two structures. To do so, silicon wafer was spin-coated with a SU-8 2000 negative resist (Microchem), then soft baked for 3 min at 95 °C, exposed with 140 mJ cm–2 dose, and then baked at 4 min 95 °C. Development of the structured followed as described. Silanization of the wafer was done with (tridecafluoro-1,1,2,2-tetrahydrooctyl) trichlorosilane (ABCR GmbH & Co.) overnight in a vacuum desiccator to enhance hydrophobicity of the surface and facilitate subsequent peeling-off of the PDMS.
Soft Lithography
Single-layer PDMS devices were cured and assembled following the procedure previously described.71 Multilayer devices for control of water-in-oil droplets size were produced by the assembly of three different layers obtained from three different wafers. A thin layer of PDMS was spin-coated on the device-wafer using a spin-coater (POLOS) at 200 rpm for 5 s and 300 rpm for 20 s (acceleration 100 rpm/s). The second wafer (silanized and without any patterned structures) was used to prepare glass coverslips with a thin PDMS coating. This was achieved by firmly pressing down the coverslips on the wafer through the uncured PDMS, so that a thin PDMS layer was formed beneath them. The third wafer (silanized and without any patterned structures) was used to produce a ∼5 mm-thick PDMS slab. All of the wafers were baked for 4 h at 80 °C. The coverslips and the PDMS slab were removed from the plain wafers. The slab was cut into separate pieces (approximately 1 cm × 2 cm), and a 4 mm hole was punched in each of them to create a water chamber using a rapid core punch (World Precision Instruments, 4 mm diameter). Both the PDMS-covered device-wafer and the water chambers were cleaned with isopropanol, blow-dried with nitrogen, and then activated by exposing them to oxygen plasma (Plasmatic System, Inc.) for about 10 s. Each water chamber was then bonded to the device-wafer, taking care that the water chamber was aligned with the part of the device containing the microfluidic traps. The device-wafer with bonded water chambers was then baked for 20 min at 80 °C. Subsequently, the thin PDMS layer with bonded water chambers on top was peeled off from the device-wafer. The devices were cut to size with scissors, and inlet and exit holes were punched into the devices using a rapid core punch (World Precision Instruments, 0.75 mm diameter). Both PDMS coverslips and devices were cleaned with isopropanol and bonded by the oxygen plasma procedure described above. After bonding, devices were left overnight at 80 °C to enhance the device hydrophobicity. For the experiment shown in Figure 6a, the channels walls were treated by flushing RainX for 2 min immediately after bonding, in order to further enhance surface hydrophobicity. The solutions were introduced into the devices via tubing (Tygon Microbore Tubing, 0.2 mm inner diameter) fitted with home-built metal connectors using pressure-driven microfluidic pumps (Fluigent, controlled by Fluigent MAESFLO software).
Image Acquisition and Processing
Wide-field microscopy measurements were performed using an Olympus IX-81 inverted microscope combined with epifluorescence illumination and appropriate filter sets. Images were acquired and recorded using an Olympus 60× PlanApo (NA 1.45, oil) objective and a Zyla 4.2 PLUS CMOS camera (Andor Technology). The microscope was operated through Micromanager software (version 1.4.14). Confocal microscopy of fluorescent collagen fibers was performed using an inverted Olympus IX81 combined with an Andor Revolution illumination system and a Yokogawa CSU X1 detection system. Images were acquired with a 60× UPlanFLN (NA 1.25, oil) objective and recorded with an EM-CCD Andor iXon X3 DU897 camera. Confocal microscopy of tubulin was performed at 30 °C using Nikon Ti-E microscope (Nikon, Japan) equipped with a Nikon plan Apo 100× 1.45 NA oil immersion objective and an Evolve 512 EMCCD camera (Roper Scientific, Germany). Images of collagen in spherical droplets were captured with an inverted Eclipse Ti Nikon microscope in combination with a Nikon 100× objective (NA 1.49, oil). The resulting images (Figures 1 and 6c) were obtained by a z-stack projection over a depth of 20 μm (0.2 μm step size). Images were analyzed and background appropriately subtracted using Fiji (ImageJ).
Lipid Solutions
All lipids were purchased from Avanti Polar lipids, Inc. in chloroform solutions. For water-in-oil droplets, lipids were mixed according to the required ratios and dried in a glass tube by desiccating for at least 1 h. The resulting dried film was then resuspended in mineral oil (light oil bioXtra, Sigma-Aldrich) at the desired concentration and sonicated for 30 min at room temperature. For production of double emulsion and liposomes, lipids were mixed in the desired ratios, dried for at least 1 h, and then resuspended in chloroform or ethanol at a concentration of 100 mg mL–1.
Double Emulsions
Three solutions were used to produce double emulsions on-chip: a lipid-containing solution, an inner aqueous solution, and an outer aqueous solution. The lipid-containing solution was composed of 2 mg mL–1 lipids (99.9 mol % DOPC + 0.1 mol % Liss Rhod PE) dissolved in oleic acid. In all of the experiments involving double emulsions, both inner and outer aqueous and the feeding channel solutions contained 5% v/v pluronic surfactant (poloxamer 188, Sigma-Aldrich) and 15% v/v glycerol. For the experiments shown in Figure 4, the inner aqueous and outer aqueous contained an additional 25 mM sucrose and 5 mM MgCl2. The solution flushed through the feeding channel to induce an osmotic pressure difference contained an additional 200 mM sucrose. To make the double emulsion denser than the surrounding solution and thereby facilitate their extraction from the device (Figure 5), an additional 5 mM dextran was added to the inner aqueous solution and osmotically balanced by 5 mM of glucose in the outer aqueous solution.
Liposomes
Liposomes were produced using OLA, an on-chip microfluidic method that results in unilamellar liposomes.71 All liposomes in Figure S3 were made with the lipid-carrying organic phase containing 2 mg ml–1 lipids (99.9 mol % DOPC + 0.1 mol % Liss Rhod PE) dissolved in 1-octanol. The inner aqueous phase consisted of 15% v/v glycerol (Figure S3a–b), 5 μM Alexa-647 (Figure S3a), 5 mM PEG-8000 (Figure S3a), 100 mM sucrose (Figure S3b), and 5 μM 72-bases long ssDNA (Figure S3b); the outer aqueous phase was a solution of 5% v/v pluronic surfactant poloxamer 188 (Figure S3a–b), 15% v/v glycerol (Figure S3a–b), 5 mM PEG-8000 (Figure S3a), 100 mM sucrose (Figure S3b); the collection well contained 20 μL (added upon the liposomes reaching the collection well) of 15% v/v glycerol (Figure S3a–b), 5 mM PEG-8000 (Figure S3a), and 100 mM glucose (Figure S3b). After sufficient production (thousands of liposomes in the collection well), liposomes were carefully harvested from the collection well by pipetting out 15 μL of the solution. The liposomes were then pumped into the microfluidic device containing the trap design. For Figure S2a, before being pumped into the device containing the traps, the liposomes were mixed with another solution in order to bring the outside environment to a concentration of 8 mM PEG-8000 and 15% v/v glycerol and to induce an osmotic pressure difference.
Water-in-Oil Droplets
Water-in-oil droplets were produced with two different protocols: droplets in Figure 1a containing nucleoids, and droplets in Figures 2a and 6b were produced on-chip via a standard cross-junction method, where the aqueous stream gets pinched into droplets by the continuous oil stream. The droplets produced were then trapped downstream from the junction on the same device. All of the droplets showed in the other figures were produced by pipetting up and down a few microliters (2–5 μL) of aqueous solutions into 100 μL of oil solution. The shear forces provided by the pipetting broke the droplets into smaller ones. In Figure 2a, to enhance the contrast with the microfluidic traps, fluorescent lipids were added to the oil solution (0.1 mol % Liss Rhod PE) together with 1% v/v SPAN 80 surfactant. For the experiments shown in Figures 2 and 3, the oil solution contained 5% v/v SPAN 80 surfactant. The inner aqueous solution of the droplets shown in Figures 2 and 3 contained 5 μM Alexa 647 fluorescent dye. Additionally, droplets shown in Figure 3 contained 200 mM KCl, while the water chamber contained 100, 200, and 300 mM KCl water solution to, respectively, create hypotonic, isotonic, and hypertonic environments for the droplets.
Min Proteins in Droplets
Min protein oscillations in spherical droplets (Figure 1a) were observed in water-in-oil droplets containing the following inner aqueous: 0.8 μM MinD, 0.2 μM MinD-Cy3, 0.8 μM MinE, 0.2 μM MinE-Cy5, 5 mM ATP, 4 mM phosphoenolpyruvate, 0.01 mg mL–1 of pyruvate kinase, 25 mM Tris-HCl (pH 7.5), 150 mM KCL, and 5 mM MgCl2. Min proteins were isolated and labeled as described previously.72 For these experiments, 2 mg mL–1 of lipids (66.6 mol % DOPC + 33.3 mol % DOPG + 0.1 mol % Liss Rhod PE) were dissolved in mineral oil as described above.
FtsZ in Droplets
The inner aqueous solution for experiments involving FtsZ in water-in-oil droplets contained 12 μM FtsZ, 6 μM ZipA, 2 mM guanosine triphosphate (GTP), 180 mM KCl, 25 mM Tris-HCl (pH 7.4), 5 mM MgCl2, and 15% v/v glycerol. The oil phase contained 25 mg mL–1 of lipids (89.9 mol % DOPC+10 mol % DGS-NTA(Ni) + 0.1 mol % Liss Rhod-PE) for spherical droplets (Figure 1), while the same composition at a lower concentration (1 mg mL–1) was used for tubular droplets (Figure 6a). Proteins were isolated and labeled as described previously.73
Nucleoids in Droplets
The nucleoid isolation protocol is based on Cunha et al.74 The BN2179 strain containing Ori1/Ter3 labels and HUmYpet (AB1157, Ori1::lacOx240-hygR, Ter3::tetOx240-accC1 ΔgalK::tetR-mCerulean frt, ΔleuB::lacI-mCherry frt) was used for the experiments.30 Cells were grown in LB medium for 65 h. One mL of culture was spun down at 10000g for 2.5 min and resuspended in 475 μL of ice cold sucrose buffer, containing 0.58 M sucrose, 10 mM NaPi buffer (pH 7.0–7.4, Na2HPO4/NaH2PO4), 10 mM EDTA, and 100 mM NaCl. Immediately after this cold shock, 25 μL of lysozyme solution (1 mg mL–1 in ultrapure water) was added, and the cell suspension was briefly vortexed and incubated at room temperature for 15 min, resulting in spheroplasts. To lyse the spheroplasts and obtain isolated nucleoids, 20 μL of the spheroplast suspension was slowly added, using a cut pipet tip, to 1 mL of a solution containing 10 mM NaPi (pH 7.4) and 100 ng mL–1 DAPI, after which the Eppendorf was inverted once. This nucleoid suspension was used as the aqueous phase for microfluidically produced water-in-oil droplets of 10 μm diameter. The oil phase was HFE-7500 (Novec Engineering Fluids) with 0.1% v/v Picosurf-1 surfactant (Dolomite Microfluidics). The droplets were immobilized for observation using an array of traps that was placed downstream of the production junction.
Tubulin in Droplets
The aqueous solution contained MRB80 buffer (80 mM PIPES, 4 mM MgCl2, 1 mM EGTA, pH 6.8) with 39 μM unlabeled tubulin, 1 μM labeled tubulin (HiLyte 488), 3 mM GTP, 50 mM KCl, 4 mM DTT, 2 mg mL–1 of bovine serum albumin, 1 mg mL–1 of glucose oxidase, 0.5 mg mL–1 of catalase, and 50 mM glucose. The oil phase contained 1 mg mL–1 of lipids (90% DOPS + 10% PEG2000-PE) in mineral oil with 2% v/v SPAN 80. To nucleate microtubules in droplets, short microtubules (labeled with 12% Hilyte 561 tubulin) of an approximate length of 1 μM were added, stabilized with guanylyl-(α,β)-methylene-diphosphonate (GMPCPP), into the aqueous solution.
Collagen in Droplets
To obtain collagen networks in spherical confinement, telopeptide collagen (TeloCol, CellSystems, supplied at 3.1 mg mL–1 in 0.01 M HCl) was brought to a neutral pH with the addition of NaOH (Sigma-Aldrich) in phosphate buffered saline (PBS, Sigma-Aldrich), to obtain a final collagen concentration of 1 mg mL–1 for the spherical droplets and 2 mg mL–1 for the droplets in the tubular confinement. The collagen-binding protein CNA35 fluorescently labeled with EGFP (a kind gift from Maarten Merkx, AddGene) was added to collagen in a molar ratio 20:1 to allow for collagen network visualization. The oil phase contained 2% v/v SPAN 80 surfactant in mineral oil (Sigma-Aldrich). The collagen was allowed to polymerize for at least 90 min at room temperature before visualization. For imaging the spherical droplets, the water-in-oil solution was placed between two coverslips (Menzel Microscope Coverslips 24 mm × 60 mm, #1, Thermo Scientific) separated by a silicone chamber (Grace Bio-Laboratories CultureWell chambered coverglass, Sigma-Aldrich).
Data Analysis
The width of the droplets in Figure 2 was obtained from the fluorescent profiles measured at the middle of the tubular droplet across its width (see Figure S2b) of 10 individual droplets per type of trap. For each droplet, the width was obtained from the full width at half-maximum of its profile, and these values were then averaged to obtain, for each type of trap, a measure of the width. Errors were omitted since the standard error-of-the-mean value (<100 nm) was smaller than the optical resolution of our microscope. The size change of the double emulsions in Figure 4 was measured every 12 frames (12 s) in the 3 min time lapse, for both the shrinking process (hypertonic condition) and the expansion process (hypotonic condition). Using Fiji (ImageJ), a circle was manually fitted to the outer contour of the double emulsion, excluding the side pocket. The errors quoted in Figure 4 are the standard error-of-the-mean.
In Figure 6, the values of tubulin and collagen bundle orientations were obtained using Fiji (OrientationJ plugin) after the background was appropriately subtracted. In Figure 7, we calculated the aspect ratio and volumes of the artificial cell containers and natural cells, of which the smallest and largest dimensions are listed in Table S6 as obtained from literature (for dots denoted as “Previous Work” and “Nature”) or as measured in our experiments (for dots labeled as “This Work”). We approximated the cell shapes as spheroids characterized by longest and shortest semiaxes a and c. Discs correspond to oblate spheroids with c < a, while rods are equivalent to prolate spheroids with c > a. The aspect ratio in Figure 7 is defined as c/a. The volume of a spheroid is calculated as V = (4π/3)a2c.
Acknowledgments
We want to thank J. Kerssemakers and K. Vendel for useful discussions, E. van der Sluis for purifying FtsZ, and S. Pud, M. Last, A. Japaridze, S. Faes, and L. van Buren for help with the experiments. The OrientationJ plugin was written by D. Sage (EPFL, Lausanne). This work was supported by ERC Advanced Grant SynDiv (no. 669598) to C.D. and by The Netherlands Organization for Scientific Research (NWO/OCW), as part of the NanoFront and BaSyC programs. The work of R.M. and M.D. is supported by Sinergia grant 160728 from the Swiss National Science Foundation (SNF). The work of F.B. and G.H.K. is part of the Industrial Partnership Programme Hybrid Soft Materials that is carried out under an agreement between Unilever Research and Development B.V. and The Netherlands Organization for Scientific Research (NWO).
Supporting Information Available
The Supporting Information is available free of charge on the ACS Publications website at DOI: 10.1021/acsnano.9b00220.
Figures S1–S4 and Tables S5 and S6 (PDF)
Author Contributions
§ These authors contributed equally.
The authors declare no competing financial interest.
Supplementary Material
References
- Randich A. M.; Brun Y. V. Molecular Mechanisms for the Evolution of Bacterial Morphologies and Growth Modes. Front. Microbiol. 2015, 6, 580. 10.3389/fmicb.2015.00580. [DOI] [PMC free article] [PubMed] [Google Scholar]
- Bisson-Filho A. W.; Zheng J.; Garner E. Archaeal Imaging: Leading the Hunt for New Discoveries. Mol. Biol. Cell 2018, 29, 1675–1681. 10.1091/mbc.E17-10-0603. [DOI] [PMC free article] [PubMed] [Google Scholar]
- Ivakov A.; Persson S. Plant Cell Shape: Modulators and Measurements. Front. Plant Sci. 2013, 4, 439. 10.3389/fpls.2013.00439. [DOI] [PMC free article] [PubMed] [Google Scholar]
- Steinman R. M.; Cohn Z. A. Identification of a Novel Cell Type in Peripheral Lymphoid Organs of Mice. J. Exp. Med. 1973, 137, 1142–1162. 10.1084/jem.137.5.1142. [DOI] [PMC free article] [PubMed] [Google Scholar]
- Margolin W. Sculpting the Bacterial Cell. Curr. Biol. 2009, 19, R812–R822. 10.1016/j.cub.2009.06.033. [DOI] [PMC free article] [PubMed] [Google Scholar]
- Young K. D. Bacterial Shape. Mol. Microbiol. 2003, 49, 571–580. 10.1046/j.1365-2958.2003.03607.x. [DOI] [PubMed] [Google Scholar]
- Young K. D. The Selective Value of Bacterial Shape. Microbiol. Mol. Biol. Rev. 2006, 70, 660–703. 10.1128/MMBR.00001-06. [DOI] [PMC free article] [PubMed] [Google Scholar]
- Mulla Y.; Aufderhorst-Roberts A.; Koenderink G. H. Shaping up Synthetic Cells. Phys. Biol. 2018, 15, 041001. 10.1088/1478-3975/aab923. [DOI] [PubMed] [Google Scholar]
- Fletcher D. A.; Mullins R. D. Cell Mechanics and the Cytoskeleton. Nature 2010, 463, 485–492. 10.1038/nature08908. [DOI] [PMC free article] [PubMed] [Google Scholar]
- Young K. D. Bacterial Morphology: Why Have Different Shapes?. Curr. Opin. Microbiol. 2007, 10, 596–600. 10.1016/j.mib.2007.09.009. [DOI] [PMC free article] [PubMed] [Google Scholar]
- Justice S. S.; Hunstad D. A.; Cegelski L.; Hultgren S. J. Morphological Plasticity as a Bacterial Survival Strategy. Nat. Rev. Microbiol. 2008, 6, 162–168. 10.1038/nrmicro1820. [DOI] [PubMed] [Google Scholar]
- Chen C. S.; Mrksich M.; Huang S.; Whitesides G. M.; Ingber D. E. Geometric Control of Cell Life and Death. Science 1997, 276, 1425–1428. 10.1126/science.276.5317.1425. [DOI] [PubMed] [Google Scholar]
- Mogilner A.; Keren K. The Shape of Motile Cells. Curr. Biol. 2009, 19, R762–R771. 10.1016/j.cub.2009.06.053. [DOI] [PMC free article] [PubMed] [Google Scholar]
- Smith W. P. J.; Davit Y.; Osborne J. M.; Kim W.; Foster K. R.; Pitt-Francis J. M. Cell Morphology Drives Spatial Patterning in Microbial Communities. Proc. Natl. Acad. Sci. U. S. A. 2017, 114, E280–E286. 10.1073/pnas.1613007114. [DOI] [PMC free article] [PubMed] [Google Scholar]
- Yang D. C.; Blair K. M.; Salama N. R. Staying in Shape: The Impact of Cell Shape on Bacterial Survival in Diverse Environments. Microbiol. Mol. Biol. Rev. 2016, 80, 187–203. 10.1128/MMBR.00031-15. [DOI] [PMC free article] [PubMed] [Google Scholar]
- Wu F.; van Schie B. G. C.; Keymer J. E.; Dekker C. Symmetry and Scale Orient Min Protein Patterns in Shaped Bacterial Sculptures. Nat. Nanotechnol. 2015, 10, 719–726. 10.1038/nnano.2015.126. [DOI] [PMC free article] [PubMed] [Google Scholar]
- Mannik J.; Wu F.; Hol F. J. H.; Bisicchia P.; Sherratt D. J.; Keymer J. E.; Dekker C. Robustness and Accuracy of Cell Division in Escherichia Coli in Diverse Cell Shapes. Proc. Natl. Acad. Sci. U. S. A. 2012, 109, 6957–6962. 10.1073/pnas.1120854109. [DOI] [PMC free article] [PubMed] [Google Scholar]
- Frey E.; Halatek J.; Kretschmer S.; Schwille P.. Protein Pattern Formation. In Physics of Biological Membranes; Bassereau P., Sens P., Eds.; Springer International Publishing: Cham, 2018; Vol. 113, pp 229–260. [Google Scholar]
- Vos B. E.; Liebrand L. C.; Vahabi M.; Biebricher A.; Wuite G. J. L.; Peterman E. J. G.; Kurniawan N. A.; MacKintosh F. C.; Koenderink G. H. Programming the Mechanics of Cohesive Fiber Networks by Compression. Soft Matter 2017, 13, 8886–8893. 10.1039/C7SM01393K. [DOI] [PubMed] [Google Scholar]
- Dragoš A.; Kovács Á. T. The Peculiar Functions of the Bacterial Extracellular Matrix. Trends Microbiol. 2017, 25, 257–266. 10.1016/j.tim.2016.12.010. [DOI] [PubMed] [Google Scholar]
- Govindan B. S.; Spillman W. B. Steady States of a Microtubule Assembly in a Confined Geometry. Phys. Rev. E 2004, 70, 032901. 10.1103/PhysRevE.70.032901. [DOI] [PubMed] [Google Scholar]
- Zelinski B.; Müller N.; Kierfeld J. Dynamics and Length Distribution of Microtubules under Force and Confinement. Phys. Rev. E 2012, 86, 041918. 10.1103/PhysRevE.86.041918. [DOI] [PubMed] [Google Scholar]
- Lagomarsino M. C.; Tanase C.; Vos J. W.; Emons A. M. C.; Mulder B. M.; Dogterom M. Microtubule Organization in Three-Dimensional Confined Geometries: Evaluating the Role of Elasticity Through a Combined In Vitro and Modeling Approach. Biophys. J. 2007, 92, 1046–1057. 10.1529/biophysj.105.076893. [DOI] [PMC free article] [PubMed] [Google Scholar]
- Junier I.; Boccard F.; Espéli O. Polymer Modeling of the E. Coli Genome Reveals the Involvement of Locus Positioning and Macrodomain Structuring for the Control of Chromosome Conformation and Segregation. Nucleic Acids Res. 2014, 42, 1461–1473. 10.1093/nar/gkt1005. [DOI] [PMC free article] [PubMed] [Google Scholar]
- Marenduzzo D.; Micheletti C.; Orlandini E. Biopolymer Organization upon Confinement. J. Phys.: Condens. Matter 2010, 22, 283102. 10.1088/0953-8984/22/28/283102. [DOI] [PubMed] [Google Scholar]
- Jun S.; Mulder B. Entropy-Driven Spatial Organization of Highly Confined Polymers: Lessons for the Bacterial Chromosome. Proc. Natl. Acad. Sci. U. S. A. 2006, 103, 12388–12393. 10.1073/pnas.0605305103. [DOI] [PMC free article] [PubMed] [Google Scholar]
- Olson M. F.; Sahai E. The Actin Cytoskeleton in Cancer Cell Motility. Clin. Exp. Metastasis 2009, 26, 273–287. 10.1007/s10585-008-9174-2. [DOI] [PubMed] [Google Scholar]
- McGregor A. L.; Hsia C.-R.; Lammerding J. Squish and Squeeze — the Nucleus as a Physical Barrier during Migration in Confined Environments. Curr. Opin. Cell Biol. 2016, 40, 32–40. 10.1016/j.ceb.2016.01.011. [DOI] [PMC free article] [PubMed] [Google Scholar]
- Wu F.; Swain P.; Kuijpers L.; Zheng X.; Felter K.; Guurink M.; Chaudhuri D.; Mulder B.; Dekker C.. Cell Boundary Confinement Sets the Size and Position of the E. Coli Chromosome. Curr. Biol. 2019, in press. [DOI] [PMC free article] [PubMed] [Google Scholar]
- Wu F.; Japaridze A.; Zheng X.; Kerssemakers J. W. J.; Dekker C.. Direct Imaging of the Circular Chromosome of a Live Bacterium. Nat. Commun. 2018, in press. [DOI] [PMC free article] [PubMed] [Google Scholar]
- Schwille P. Jump-Starting Life? Fundamental Aspects of Synthetic Biology. J. Cell Biol. 2015, 210, 687–690. 10.1083/jcb.201506125. [DOI] [PMC free article] [PubMed] [Google Scholar]
- Szostak J. W.; Bartel D. P.; Luisi P. L. Synthesizing Life. Nature 2001, 409, 387–390. 10.1038/35053176. [DOI] [PubMed] [Google Scholar]
- Spoelstra W. K.; Deshpande S.; Dekker C. Tailoring the Appearance: What Will Synthetic Cells Look Like?. Curr. Opin. Biotechnol. 2018, 51, 47–56. 10.1016/j.copbio.2017.11.005. [DOI] [PubMed] [Google Scholar]
- Buddingh’ B. C.; van Hest J. C. M. Artificial Cells: Synthetic Compartments with Life-like Functionality and Adaptivity. Acc. Chem. Res. 2017, 50, 769–777. 10.1021/acs.accounts.6b00512. [DOI] [PMC free article] [PubMed] [Google Scholar]
- Alvarado J.; Mulder B. M.; Koenderink G. H. Alignment of Nematic and Bundled Semiflexible Polymers in Cell-Sized Confinement. Soft Matter 2014, 10, 2354–2364. 10.1039/C3SM52421C. [DOI] [PubMed] [Google Scholar]
- Sanchez T.; Chen D. T. N.; Decamp S. J.; Heymann M.; Dogic Z. Spontaneous Motion in Hierarchically Assembled Active Matter. Nature 2012, 491, 431–434. 10.1038/nature11591. [DOI] [PMC free article] [PubMed] [Google Scholar]
- Chanasakulniyom M.; Martino C.; Paterson D.; Horsfall L.; Rosser S.; Cooper J. M. Expression of Membrane-Associated Proteins within Single Emulsion Cell Facsimiles. Analyst 2012, 137, 2939. 10.1039/c2an35047e. [DOI] [PubMed] [Google Scholar]
- Mellouli S.; Monterroso B.; Vutukuri H. R.; Brinke E. Te; Chokkalingam V.; Rivas G.; Huck W. T. S. Self-Organization of the Bacterial Cell-Division Protein FtsZ in Confined Environments. Soft Matter 2013, 9, 10493–10500. 10.1039/c3sm51163d. [DOI] [Google Scholar]
- Miyazaki M.; Chiba M.; Eguchi H.; Ohki T.; Ishiwata S. Cell-Sized Spherical Confinement Induces the Spontaneous Formation of Contractile Actomyosin Rings in Vitro. Nat. Cell Biol. 2015, 17, 480–489. 10.1038/ncb3142. [DOI] [PubMed] [Google Scholar]
- Good M. C.; Vahey M. D.; Skandarajah A.; Fletcher D. A.; Heald R. Cytoplasmic Volume Modulates Spindle Size during Embryogenesis. Science 2013, 342, 856–860. 10.1126/science.1243147. [DOI] [PMC free article] [PubMed] [Google Scholar]
- Sokolova E.; Spruijt E.; Hansen M. M. K.; Dubuc E.; Groen J.; Chokkalingam V.; Piruska A.; Heus H. A.; Huck W. T. S. Enhanced Transcription Rates in Membrane-Free Protocells Formed by Coacervation of Cell Lysate. Proc. Natl. Acad. Sci. U. S. A. 2013, 110, 11692–11697. 10.1073/pnas.1222321110. [DOI] [PMC free article] [PubMed] [Google Scholar]
- Van Nies P.; Westerlaken I.; Blanken D.; Salas M.; Mencía M.; Danelon C. Self-Replication of DNA by Its Encoded Proteins in Liposome-Based Synthetic Cells. Nat. Commun. 2018, 9, 1583. 10.1038/s41467-018-03926-1. [DOI] [PMC free article] [PubMed] [Google Scholar]
- Zieske K.; Chwastek G.; Schwille P. Protein Patterns and Oscillations on Lipid Monolayers and in Microdroplets. Angew. Chem., Int. Ed. 2016, 55, 13455–13459. 10.1002/anie.201606069. [DOI] [PMC free article] [PubMed] [Google Scholar]
- Deng N.-N.; Vibhute M. A.; Zheng L.; Zhao H.; Yelleswarapu M.; Huck W. T. S. Macromolecularly Crowded Protocells from Reversibly Shrinking Monodisperse Liposomes. J. Am. Chem. Soc. 2018, 140, 7399–7402. 10.1021/jacs.8b03123. [DOI] [PMC free article] [PubMed] [Google Scholar]
- Zieske K.; Schwille P. Reconstitution of Pole-to-Pole Oscillations of Min Proteins in Microengineered Polydimethylsiloxane Compartments. Angew. Chem., Int. Ed. 2013, 52, 459–462. 10.1002/anie.201207078. [DOI] [PubMed] [Google Scholar]
- Holy T. E.; Dogterom M.; Yurke B.; Leibler S. Assembly and Positioning of Microtubule Asters in Microfabricated Chambers. Proc. Natl. Acad. Sci. U. S. A. 1997, 94, 6228–6231. 10.1073/pnas.94.12.6228. [DOI] [PMC free article] [PubMed] [Google Scholar]
- Deshpande S.; Pfohl T. Real-Time Dynamics of Emerging Actin Networks in Cell-Mimicking Compartments. PLoS One 2015, 10, e0116521 10.1371/journal.pone.0116521. [DOI] [PMC free article] [PubMed] [Google Scholar]
- Huebner A.; Bratton D.; Whyte G.; Yang M.; Demello A. J.; Abell C.; Hollfelder F. Static Microdroplet Arrays: A Microfluidic Device for Droplet Trapping, Incubation and Release for Enzymatic and Cell-Based Assays. Lab Chip 2009, 9, 692–698. 10.1039/B813709A. [DOI] [PubMed] [Google Scholar]
- Wang W.; Yang C.; Li C. M. On-Demand Microfluidic Droplet Trapping and Fusion for on-Chip Static Droplet Assays. Lab Chip 2009, 9, 1504–1506. 10.1039/b903468d. [DOI] [PubMed] [Google Scholar]
- Shi W.; Qin J.; Ye N.; Lin B. Droplet-Based Microfluidic System for Individual Caenorhabditis Elegans Assay. Lab Chip 2008, 8, 1432. 10.1039/b808753a. [DOI] [PubMed] [Google Scholar]
- Yu L.; Chen M. C. W.; Cheung K. C. Droplet-Based Microfluidic System for Multicellular Tumor Spheroid Formation and Anticancer Drug Testing. Lab Chip 2010, 10, 2424. 10.1039/c004590j. [DOI] [PubMed] [Google Scholar]
- Hunt T. P.; Issadore D.; Westervelt R. M. Integrated Circuit/Microfluidic Chip to Programmably Trap and Move Cells and Droplets with Dielectrophoresis. Lab Chip 2008, 8, 81–87. 10.1039/B710928H. [DOI] [PubMed] [Google Scholar]
- Boukellal H.; Selimović Š.; Jia Y.; Cristobal G.; Fraden S.; Selimović E.; Jia Y.; Cristobal G.; Fraden S. Simple, Robust Storage of Drops and Fluids in a Microfluidic Device. Lab Chip 2009, 9, 331–338. 10.1039/B808579J. [DOI] [PubMed] [Google Scholar]
- Christopher G. F.; Bergstein J.; End N. B.; Poon M.; Nguyen C.; Anna S. L. Coalescence and Splitting of Confined Droplets at Microfluidic Junctions. Lab Chip 2009, 9, 1102. 10.1039/b813062k. [DOI] [PubMed] [Google Scholar]
- Deshpande S.; Spoelstra W. K.; van Doorn M.; Kerssemakers J.; Dekker C. Mechanical Division of Cell-Sized Liposomes. ACS Nano 2018, 12, 2560–2568. 10.1021/acsnano.7b08411. [DOI] [PMC free article] [PubMed] [Google Scholar]
- McGrath J.; Jimenez M.; Bridle H. Deterministic Lateral Displacement for Particle Separation: A Review. Lab Chip 2014, 14, 4139–4158. 10.1039/C4LC00939H. [DOI] [PubMed] [Google Scholar]
- Shim J.; Cristobal G.; Link D. R.; Thorsen T.; Jia Y.; Piattelli K.; Fraden S. Control and Measurement of the Phase Behavior of Aqueous Solutions Using Microfluidics. J. Am. Chem. Soc. 2007, 129, 8825–8835. 10.1021/ja071820f. [DOI] [PMC free article] [PubMed] [Google Scholar]
- Shum H. C.; Lee D.; Yoon I.; Kodger T.; Weitz D. A. Double Emulsion Templated Monodisperse Phospholipid Vesicles. Langmuir 2008, 24, 7651–7653. 10.1021/la801833a. [DOI] [PubMed] [Google Scholar]
- Shum H. C.; Santanach-Carreras E.; Kim J. W.; Ehrlicher A.; Bibette J.; Weitz D. A. Dewetting-Induced Membrane Formation by Adhesion of Amphiphile-Laden Interfaces. J. Am. Chem. Soc. 2011, 133, 4420–4426. 10.1021/ja108673h. [DOI] [PMC free article] [PubMed] [Google Scholar]
- Hallett F. R.; Marsh J.; Nickel B. G.; Wood J. M. Mechanical Properties of Vesicles. II. A Model for Osmotic Swelling and Lysis. Biophys. J. 1993, 64, 435–442. 10.1016/S0006-3495(93)81384-5. [DOI] [PMC free article] [PubMed] [Google Scholar]
- Seifert U.; Berndl K.; Lipowsky R. Shape Transformations of Vesicles: Phase Diagram for Spontaneous- Curvature and Bilayer-Coupling Models. Phys. Rev. A: At., Mol., Opt. Phys. 1991, 44, 1182–1202. 10.1103/PhysRevA.44.1182. [DOI] [PubMed] [Google Scholar]
- Bi E.; Lutkenhaus J. FtsZ Ring Structure Associated with Division in Escherichia Coli. Nature 1991, 354, 161–164. 10.1038/354161a0. [DOI] [PubMed] [Google Scholar]
- Ramachandran G. N.; Kartha G. Structure of Collagen. Nature 1954, 174, 269–270. 10.1038/174269c0. [DOI] [PubMed] [Google Scholar]
- den Blaauwen T.; Hamoen L. W.; Levin P. A. The Divisome at 25: The Road Ahead. Curr. Opin. Microbiol. 2017, 36, 85–94. 10.1016/j.mib.2017.01.007. [DOI] [PMC free article] [PubMed] [Google Scholar]
- Chang F.; Martin S. G. Shaping Fission Yeast with Microtubules. Cold Spring Harbor Perspect. Biol. 2009, 1, a001347–a001347. 10.1101/cshperspect.a001347. [DOI] [PMC free article] [PubMed] [Google Scholar]
- Tønnesen J.; Inavalli V. V. G. K.; Nägerl U. V. Super-Resolution Imaging of the Extracellular Space in Living Brain Tissue. Cell 2018, 172, 1108–1121. 10.1016/j.cell.2018.02.007. [DOI] [PubMed] [Google Scholar]
- Provenzano P. P.; Vanderby R. Collagen Fibril Morphology and Organization: Implications for Force Transmission in Ligament and Tendon. Matrix Biol. 2006, 25, 71–84. 10.1016/j.matbio.2005.09.005. [DOI] [PubMed] [Google Scholar]
- Gutsmann T.; Fantner G. E.; Venturoni M.; Ekani-Nkodo A.; Thompson J. B.; Kindt J. H.; Morse D. E.; Fygenson D. K.; Hansma P. K. Evidence That Collagen Fibrils in Tendons Are Inhomogeneously Structured in a Tubelike Manner. Biophys. J. 2003, 84, 2593–2598. 10.1016/S0006-3495(03)75064-4. [DOI] [PMC free article] [PubMed] [Google Scholar]
- McMahon H. T.; Gallop J. L. Membrane Curvature and Mechanisms of Dynamic Cell Membrane Remodelling. Nature 2005, 438, 590–596. 10.1038/nature04396. [DOI] [PubMed] [Google Scholar]
- Söderström B.; Badrutdinov A.; Chan H.; Skoglund U. Cell Shape-Independent FtsZ Dynamics in Synthetically Remodeled Bacterial Cells. Nat. Commun. 2018, 9, 4323. 10.1038/s41467-018-06887-7. [DOI] [PMC free article] [PubMed] [Google Scholar]
- Deshpande S.; Caspi Y.; Meijering A. E. C.; Dekker C. Octanol-Assisted Liposome Assembly on Chip. Nat. Commun. 2016, 7, 10447. 10.1038/ncomms10447. [DOI] [PMC free article] [PubMed] [Google Scholar]
- Caspi Y.; Dekker C. Mapping out Min Protein Patterns in Fully Confined Fluidic Chambers. eLife 2016, 5, e19271. 10.7554/eLife.19271. [DOI] [PMC free article] [PubMed] [Google Scholar]
- Fanalista F.; Deshpande S.; Lau A.; Pawlik G.; Dekker C. FtsZ-Induced Shape Transformation of Coacervates. Adv. Biosyst. 2018, 2, 1800136. 10.1002/adbi.201800136. [DOI] [Google Scholar]
- Cunha S.; Woldringh C. L.; Odijk T. Polymer-Mediated Compaction and Internal Dynamics of Isolated Escherichia Coli Nucleoids. J. Struct. Biol. 2001, 136, 53–66. 10.1006/jsbi.2001.4420. [DOI] [PubMed] [Google Scholar]
Associated Data
This section collects any data citations, data availability statements, or supplementary materials included in this article.