Abstract
Ammonium transporters (AMTs), which include AMT1 and AMT2 subfamilies, have been identified and partially characterized in many plants. In this study, two AMT2-type genes from Brassica campestris, namely BcAMT2 and BcAMT2like, were identified and characterized. BcAMT2 and BcAMT2like are 2666 bp and 2952 bp, encode proteins of 490 and 489 amino acids, respectively, and contain five exons and four introns. Transient expression of these proteins labelled with green fluorescence protein in onion epidermal cells indicated that both are located on the plasma membrane. When expressing BcAMT2 or BcAMT2like, the mutant yeast strain 31019b could grow on medium containing 2 mM ammonium as the only nitrogen source when expressing BcAMT2 or BcAMT2like, indicating that both are functional AMT genes. Quantitative PCR results showed that BcAMT2 and BcAMT2like were expressed in all tissues, but they displayed different expression patterns in the reproductive stages. BcAMT2s transcript levels in leaves were positively correlated with ammonium concentration and external pH. Moreover, the expression BcAMT2s responded to diurnal change. Furthermore, the uncharged form of ammonium, i.e., ammonia, might also be transported by BcAMT2s. These results provide new insights into the molecular mechanisms underlying ammonium absorption and transportation by the AMT2 subfamily in B. campestris.
Keywords: ammonium transporter, Brassica campestris, functional characterization, gene expression, nitrogen regime
Introduction
Ammonium, as a major inorganic nitrogen (N) source for plants, plays important roles in their growth and development. It triggers multiple physiological and morphological responses (Liu and von Wirén 2017). Mild ammonium increases resistance against pathogen infection by enhancing the H2O2 burst in leaves (Fernández-Crespo et al. 2015), improves drought tolerance by enhancing drought-induced abscisic acid accumulation (Ding et al. 2016), and increases phosphorus (Jing et al. 2012; Zeng et al. 2012) and iron (Zou et al. 2001) uptake involved in proton release and rhizosphere acidification. In addition, ammonium changes root system architecture by inhibiting root elongation and by stimulating lateral root branching and root hair growth (Bloom et al. 2003; Lima et al. 2010; Yang et al. 2011). Thus, ammonium is a preferable N source (Gazzarrini et al. 1999; Hachiya and Sakakibara 2017), especially under the predicted rise in carbon dioxide concentration (Hachiya and Sakakibara 2017). However, excessive ammonium is toxic to plants (Hao et al. 2016). Accordingly, a strictly regulated ammonium uptake system must exist, including abundant ammonium transporters and effective mechanisms regulating their activity (Song et al. 2011).
Membrane transportation and distribution of ammonium are mediated by ammonium transporters (AMTs) of the ammonium transporter/methylamine permease/rhesus family, which has been found in all domains of life (McDonald et al. 2012). The ammonium transport mediated by members of this family provides sufficient N for optimal growth in plants and microorganisms. Molecular and biophysical studies have suggested that there are two transport systems for ammonium uptake, the high-affinity and the low-affinity transport system, which are responsible for the biphasic influx of ammonium. The former system takes up ammonium at low external concentrations (micromolar level) (Camañes et al. 2009; Gazzarrini et al. 1999; Yuan et al. 2007), while the latter assures the maintenance of a large ammonium influx at high external concentrations (millimolar level) (von Wirén et al. 2000a). Working together, these two systems ensure the optimization of ammonium uptake from the soil by the roots.
According to their phylogenetic relationships, plant AMTs can be clustered into two subfamilies: AMT1 and AMT2 (Loqué and von Wirén, 2004; McDonald et al. 2012). Members of both subfamilies differ in several characteristics (Giehl et al. 2017; Li et al. 2016; McDonald et al. 2012; Neuhäuser et al. 2009; von Wittgenstein et al. 2014). First, gene structure and protein characteristics are more complex in AMT2 than in AMT1, as AMT2-type genes contain several introns (Castro-Rodríguez et al. 2016), whereas AMT1-type genes include no introns (Becker et al. 2002; von Wirén et al. 2000b; Yuan et al. 2007), except for AMT1;2 from Lotus japonicus (Salvemini et al. 2001). Phylogenetic analyses revealed that AMT2 is more closely related to the AMT of prokaryotes than to plant AMT1s (Loqué and von Wirén 2004; McDonald et al. 2012). In addition, there is only 20 to 25% identity among AMT2 families, while plant AMT1s share 65 to 95% identity (Pantoja 2012). Second, in addition to mediating ammonium transport, AMT2;1 mediates electroneutral ammonia transport (Guether et al. 2009; Neuhäuser et al. 2009; Sohlenkamp et al. 2002). Thus, theoretically, AMT2;1 transports ammonium from the cytosol into the apoplast more efficiently than AMT1-type transporters (Giehl et al. 2017). Third, AMT1-type subfamily members play important roles in high-affinity ammonium uptake in the micromolar range (McDonald et al. 2012; Song et al. 2017; Yuan et al. 2007), while AMT2 subfamily members have a limited contribution to low-affinity ammonium in the millimolar range (Giehl et al. 2017). The ammonium transport capacity of AMT2;1 appears to increase with pH (Neuhäuser et al. 2009; Sohlenkamp et al. 2002). Finally, AMT2 subfamily members mainly translocate ammonium from root to shoot in Arabidopsis thaliana (Giehl et al. 2017). Although AMT2;1 in Arabidopsis is a functional ammonium transporter (Neuhäuser et al. 2009; Sohlenkamp et al. 2002), members of the AMT2 subfamily from different species typically exhibit different characteristics and appear to have different physiological roles and transport mechanisms (Li et al. 2016). Therefore, the isolation, expression analysis, and functional analysis of new AMT2 subfamily members would be beneficial for gaining an understanding of the physiological roles of AMT2-type genes in plant growth.
Flowering Chinese cabbage (Brassica campestris L. ssp. chinensis var. utilis Tsen et Lee), a prominent vegetable in South China, has the largest growing area and yield in several locations. The flower stalk, the edible organ of flowering Chinese cabbage, is crisp and nutrient-rich (Song et al. 2012). In a previous study, we found that fertilizers containing both nitrate and ammonium were more beneficial to flowering Chinese cabbage qualities than those with a single N source (Song et al. 2012). Nitrate may stimulate ammonium loading into the xylem and/or its assimilation through the enhanced amino acid biosynthesis (Hachiya and Sakakibara 2017). In A. thaliana, ammonium is imported into the cytosol by AtAMT1;1 and AtAMT2;1, which are expressed in the leaves, or via other pathways through diffusion or by unknown transporters/channels (Ludewig et al. 2007). In addition, AMT2;1 plays an important role in root-to-shoot translocation of ammonium in Arabidopsis (Giehl et al. 2017). However, there is no information regarding ammonium transport systems and AMT2 subfamily roles in B. campestris. Therefore, research on ammonium transport systems in B. campestris is very important for gaining an understanding of the regulation of ammonium uptake by the roots. In the present study, two AMT2-type genes were isolated from B. campestris and their expression patterns were analysed to provide information on the AMT family and discuss the possible roles of these two AMT2s in this species.
Materials and methods
Plant materials and culture conditions
The present study examined the flowering Chinese cabbage variety “Youlv 501” (Guangzhou Academy of Agriculture Sciences, Guangdong province, China). Experiments were carried out in a greenhouse (25 to 30°C, natural light). Seeds were surface-sterilized in 2.5% NaClO for 10 min, washed with distilled water, and sown in plug trays filled with perlite. Plug seedlings were grown until the third true leaf was fully expanded. Then, 16 uniform seedlings were transplanted to a plastic box (60 cm long×40 cm wide×15 cm high) filled with 24 l of modified Hoagland solution (4.0 mM NaNO3, 1.0 mM KH2PO4, 2.0 mM KCl, 1.0 mM MgSO4, 0.5 mM CaCl2, 0.1 mM Fe-EDTA, 50 µM H3BO3, 12 µM MnSO4, 1 µM ZnCl2, 1 µM CuSO4, and 0.2 µM Na2MoO4). The nutrient solution was completely replaced every four days and its pH was adjusted to 5.8 every two days. An air pump was installed at 15 min h−1 to maintain good air circulation. Roots, stems, leaves and other organs were randomly selected and harvested separately at the following growth stages: roots (R), hypocotyls (H), and cotyledons (C) were harvested at cotyledon stage (stage 1); roots (R), stem (S), and leaves (L) were harvested at the three-leaf stage (stage 2) and six-leaf stage (stage 3); roots (R), stem (S), leaves (L), and flower buds (B) were harvested at the stalk-growth stage (stage 4); roots (R), stem (S), leaves (L), flowers (F), and pods (P) were harvested at the flowering stage (stage 5). All samples were randomly selected four plants per biological replicate and harvested separately during the several growth stages.
After 10 to 15 days in nutrient solution, the seedlings were used in experiments. For N-starvation and N-resupply treatments, seedlings were washed in deionized water and transferred to N-free modified Hoagland solution containing 4 mM NaCl instead of 4 mM NaNO3 for 72 h. After this period, the nutrient solution was replaced with a solution containing 4 mM NH4Cl as the only N source. Roots and leaves were harvested at 0, 24, 48, and 72 h during the N-deficiency treatment and at 2, 4, and 8 h during the N-resupply treatment. For different pH treatments, seedlings were transferred to a modified Hoagland solution, where 4 mM NH4Cl replaced 4 mM NaNO3, and pH values were adjusted to 4.8, 5.8, and 6.8 with 2 M HCl or NaOH. After three days, roots and leaves were harvested. For the high-ammonium treatment, seedlings were kept in a 10 mM NH4Cl solution, and roots and leaves were harvested at 0, 24, 48, and 72 h. For the circadian rhythm study, seedlings were cultured in a greenhouse (25 to 30°C, natural light), and then transferred to a growth incubator at 25°C, 70% relative humidity, 150 µmol m−2 s−1 light intensity, and a 12/12-h light/dark period (light, 7:00 to 19:00; dark 19:00 to 7:00). After three days, leaves and roots were first sampled at 3:00 to 24:00 and then every 3 h. All samples were immediately frozen in liquid nitrogen and stored at −80°C for quantitative real-time PCR (qPCR).
BcAMT2s gene cloning and bioinformatics analysis
Based on AMT2 and AMT2like sequences of B. rapa (retrieved from GenBank, under accessions no. XM_009145156.2, XM_009143483.2, respectively) specific primers were designed for each gene (Table 1). Total RNA was extracted from leaves and roots of B. campestris using the Plant RNAiso Plus Kit (TaKaRa, Kyoto, Japan), and was reverse transcribed using the PrimeScript™ 1st Strand cDNA Synthesis Kit (TaKaRa). Genomic DNA was extracted from leaves using the plant genomic DNA kit (Tiangen Biotechnology, Beijing, China). Full-length sequences of the ORFs of the BcAMT2s were amplified by PCR using cDNA of B. campestris as template, and the products were ligated into the pYES2 vector (Waryong Biotechnology, Beijing, China) and sequenced. The corresponding genomic sequences were obtained in a similar way, using genomic DNA as the PCR template.
Table 1. Primers used in the experiments.
| Primer name | Sequence (5′–3′) | Usage |
|---|---|---|
| AMT2 | F: CAGTGTGCTGGAATTCATGGCCGGCGCTTACGATGCGA | Cloning BcAMT2 and BcAMT2like into pYES2 vector using EcoRI and XbaI sites |
| R: TGCGGCCCTCTAGATTATAAAACAATAGTGACACCTC | ||
| AMT2like | F: CAGTGTGCTGGAATTCATGGCCGGAGCTTACGGTGCA | |
| R: TGCGGCCCTCTAGATTATAAAACAATGGTAACACCTC | ||
| pB2 | F:CACGGGGGACTCTAGAATGGCCGGCGCTTACGATGCGA | Cloning BcAMT2 and BcAMT2like into pBI121 vector using XbaI and SmaI sites |
| R: TCCTTTACCCATCCCGGGTAAAACAATAGTGACACCTC | ||
| pB2like | F: CACGGGGGACTCTAGAATGGCCGGAGCTTACGGTGCA | |
| R: TCCTTTACCCATCCCGGGTAAAACAATGGTAACACCTC | ||
| qAMT2 | F: CTGTCTGGAATGTAGTGTCG | qPCR |
| R: TCTCCATCTCCCCAAAGAGC | ||
| qAMT2like | F: AGCTTGGGATTGGAGATGACG | qPCR |
| R: ATGCCTTGTGGCATCGAAC | ||
| β-actin | F: GTGACAATGGAACTGGAATGG | qPCR |
| R: AGACGGAGGATAGCGTGAGG | ||
| GAPDH | F: CAGGTTTGGAATTGTCGAGG | qPCR |
| R: GAGCTGTGGAAGCACCTTTC |
According to the deduced amino acid sequence, the following protein characteristics were predicted using online tools: protein physicochemical properties (ProtParam, http://web.expasy.org/protparam/), PROSITE motifs (ScanProsite, http://prosite.expasy.org/scanprosite/), transmembrane motifs (Protter, http://wlab.ethz.ch/protter/), and subcellular localization (http://www.softberry.com). Multiple sequence alignment of 38 AMT proteins from A. thaliana, B. rapa, B. campestris, Oryza sativa, P. trichocarpa, and Escherichia coli, and phylogenetic analysis based on an unrooted, maximum likelihood-based phylogenetic tree were conducted using CLUSTALW in MEGA (6.0) (Tamura et al. 2013). Exons/introns in cDNA and genomic sequences were visualized in GSDS (2.0) (http://gsds.cbi.pku.edu.cn/) (Hu et al. 2015). Conserved domains defining the AMT subfamilies were generated using WEBLOGO (http://weblogo.berkeley.edu/logo.cgi/) (Crooks et al. 2004).
Sub-cellular location
Primers pB2 and pB2like (Table 1) were used to amplify the coding sequences of BcAMT2 and BcAMT2like. The amplicons were ligated into the pBI121-GFP vector (kindly provided by Dr. Guibing Hu, South China Agricultural University, China), which harbours the CaMV 35S promoter and GFP, at the XbaI and SmaI sites, and the fusion constructs were transformed into onion epidermal cells by the Agrobacterium tumefaciens (EHA105; Weidi Biotechnology, Shanghai, China) infiltration method (Zhang et al. 2013). After two days of incubation, the fluorescence levels of the fusion proteins were examined under a positive fluorescence microscope (Axio Imager D2; Zeiss, Dresden, Germany) under 480 nm excitation and 525 nm emission wavelengths.
qPCR
Total RNA was extracted from samples using the Plant RNAiso Plus Kit (TaKaRa), and was reverse transcribed using the PrimeScript™ RT reagent Kit with gDNA Eraser (TaKaRa). qPCR was performed in a LightCycler 480 Real-Time PCR System (Roche, Basel, Switzerland), using SYBR Premix Ex Taq (TaKaRa) and the primer pairs listed in Table 1. The genes encoding glyceraldehyde-3-phosphate dehydrogenase and β-actin were used as internal control genes. The PCR mixture (10 µl total volume) contained 5 µl 2×SYBR Premix Ex Taq, 0.4 µl each primer (10 µM), 2 µl 10-fold diluted cDNA, and 2.2 µl ddH2O. The PCR program was initiated at 95°C for 30 s, followed by 45 cycles of 95°C for 5 s and 60°C for 30 s, and completed with a melting curve analysis (65 to 95°C, at increments of 0.5°C), which was conducted to confirm primer specificity. No-template (blank) controls were included in every reaction batch. Three biological replicates were used to calculate relative gene expression as previously described (Livak and Schmittgen 2001).
Yeast growth and complementation
Yeast expression vectors were constructed by cloning the BcAMT2 and BcAMT2like ORFs into the EcoRI and XbaI sites of the pYES2 vector (Waryong Biotechnology), respectively. The yeast mutant strain 31019b (Δmep1, Δmep2, Δmep3, and ura3), which was kindly provided by Dr. Bruno André (Université Libre de Bruxelles, Belgium), is unable to grow on medium containing an ammonium concentration lower than 5 mM as the only N source (Marini et al. 1997; Yuan et al. 2007). Recombinant or empty (pYES2) plasmids were transformed into 31019b yeast cells using LiAcO (Yuan et al. 2007). Transformed cells were plated on synthetic dropout medium lacking uracil (FunGenome Company, Beijing, China) for the identification of positive clones. Positive clones were pre-cultured in liquid yeast nitrogen base medium without amino acids, and ammonium sulphate was supplemented until the optical density at 600 nm reached 1.0. Growth complementation assays were performed on solid yeast nitrogen base medium at pH 5.8 containing 2% galactose and a single N source (1 mM arginine or 2 mM NH4Cl). Overnight cultures were serially diluted by factors of 10, and 3 µl of pre-cultured yeast cell suspensions at each dilution were spotted on yeast nitrogen base medium. Growth was evaluated after three days of incubation at 30°C.
Statistical analysis
Data from three independent experiments were analysed by one-way analysis of variance using SigmaPlot (11.1) (Jandel Scientific software, San Rafael, CA, USA), and differences were compared using Duncan’s test considering p<0.05 as the significance threshold.
Results
Gene isolation and sequence analysis
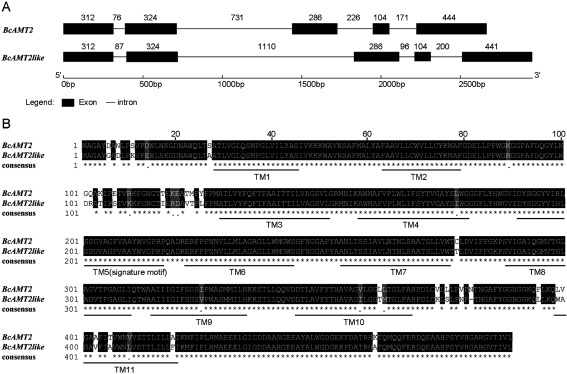
Two AMT2-type homologous genes, namely BcAMT2 and BcAMT2like (accession no. MF966941 and MF966942), were isolated from genomic DNA of B. campestris. Although both genes had the same number of introns and exons, the lengths thereof differed (Figure 1A). The complete open reading frame (ORF) of BcAMT2 comprised 1470 nucleotides and encoded a 52.63 kD polypeptide of 490 amino acids. The DNA sequence of BcAMT2 was composed of 2666 nucleotides (accession no. MF966943) and it included five exons of 104 to 444 bp and four introns of 76 to 731 bp (Figure 1A). BcAMT2like encoded a 52.53 kD polypeptide of 489 amino acids, and it contained 2952 nucleotides distributed in five exons separated by four introns (accession no. MF966944) (Figure 1A).
Figure 1. Genomic structure and multiple alignment of the ammonium transporters (AMT) BcAMT2 and BcAMT2like isolated from Brassica campestris. A: Gene structure analysis was carried out in GSDS (gene structure display server, http://gsds.cbi.pku.edu.cn/). Numbers above exons (boxes) and introns (lines) indicate the number of nucleotides. B: Multiple alignment was performed in MEGA 6.0. Transmembrane domains (TM) and AMT signature motifs were predicted by Protter (http://wlab.ethz.ch/protter/) and ExPaSy (http://expasy.org/tools/scanprosite/), respectively. Identical residues are indicated by asterisks, different residues are indicated as a gap, semi conservative mutations are shown as points, predicted TM and signature motifs are outlined by thick lines.
At the amino acid level, the similarity of BcAMT2 and BcAMT2like was 93% (Figure 1B). Based on their predicted structures, both BcAMT2 and BcAMT2like are located on the plasma membrane and have 11 transmembrane (TM) domains (Figure 1B), an extracellular N-terminus, and a cytosolic C-terminus. The predicted signature motif of both BcAMT2 and BcAMT2like is 191DYSGGYVIHLSSGVAGFVAAYWVGPR216, but the proteins differ in one, three, and five amino acid residues in TM 9th, 10th, and 11th, respectively (Figure 1B).
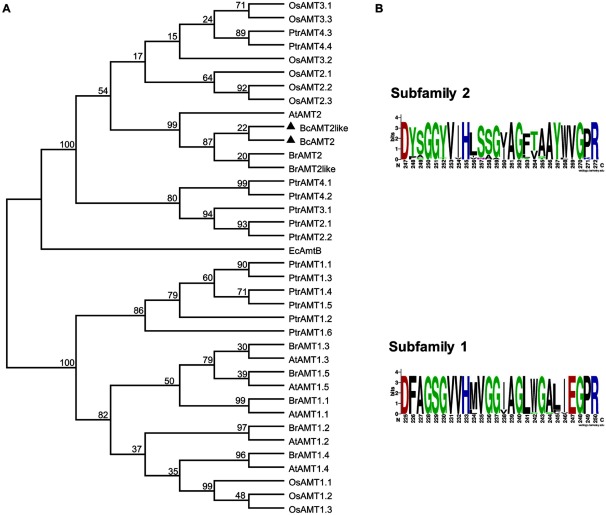
Phylogenetic analysis based on multiple sequence alignment of 38 AMT proteins from six species, as retrieved from GenBank or obtained in the present study, showed that AMTs were divided into two subfamilies (Figure 2A). Both BcAMT2 and BcAMT2like, which were grouped within the AMT2 subfamily, were closely related to EcamtB from Escherichia coli and most related to BrAMT2 from B. rapa, and were classified into the same cluster as AtAMT2 from A. thaliana. However, PtrAMT2s from Populus trichocarpa were classified into a different cluster (Figure 2A).
Figure 2. Phylogenetic analysis and conserved domains of ammonium transporters (AMTs). A: Unrooted, maximum likelihood-based phylogenetic tree of AMT family proteins generated in MEGA 6.0 software, using ClustalW for the alignment and 1000 bootstrap replicates. AtAMT1;1–1;5 and AtAMT2 from A. thaliana (accessions no. NM_117425.2, NM_105152.3, NM_113336.3, NM_119012, NM_113335, and NM_129385.5); BrAMT1.1–BrAMT1;5, BrAMT2, and BrAMT2like from B. rapa (XM_009126366.2, XM_009113156.1, XM_009104274.2, XM_009131146.2, XM_009137637.1, XM_009145156.2, and XM_009143483.2); OsAMT1;1–1;3, OsAMT2;1–2;3, OsAMT3;1–3;3 from O. sativa (NM_001059815.1, NM_001053990.1, NM_001053991.1, XM_009378133.2, XM_015787532.1, XM_015766098.1, XM_015766529.1, NM_001058371.2, and NM_001053632.1); PtrAMT1;1–1;5, PtrAMT2;1, PtrAMT2;2, PtrAMT3;1, PtrAMT4;1–T4;4 from P. trichocarpa (XM_002314482.2, XM_002325754.1, XM_002311667.2, XM_002303068.1, XM_002301801.1, XM_002314070.2, XM_002309115.1, XM_002323564.1, XM_002300186.2, XM_002302048.2, XM_002324235.2, XM_002306767.2, and XM_002319034.2); EcAmtB from E. coli (NP_286193); BcAMT2 and BcAMT2like from B. campestris are displayed with a black triangle. B: Conserved domains defining the AMT subfamilies generated using WEBLOGO (http://weblogo.berkeley.edu/logo.cgi/).
Each subfamily was defined by a conserved domain: in the AMT1 subfamily, this domain spanned residues D225 to R250 while in AMT2 subfamily, it spanned D247 to R272 (Figure 2B, Crooks et al. 2004).
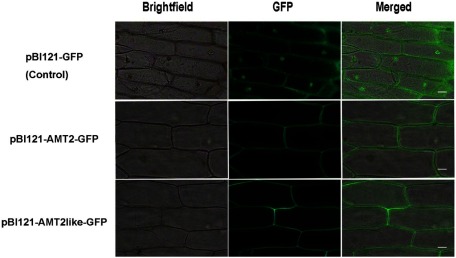
The observation of fluorescence in onion cells transiently transfected with recombinant plasmids including full-length sequences of BcAMT2 and BcAMT2like fused with green fluorescent protein (GFP) confirmed that both proteins were located within the plasma membrane (Figure 3).
Figure 3. Subcellular localization of pBI121-GFP, pBI121-BcAMT2-GFP, and pBI121-BcAMT2like-GFP fusion proteins in onion epidermal cells. Bright field: image obtained by bright field microscopy; GFP: green fluorescence derived from GFP imaged by fluorescence microscopy; Merged: overlay of the two images. Scale bar: 50 µm.
Functional expression of BcAMT2 and BcAMT2like in yeast
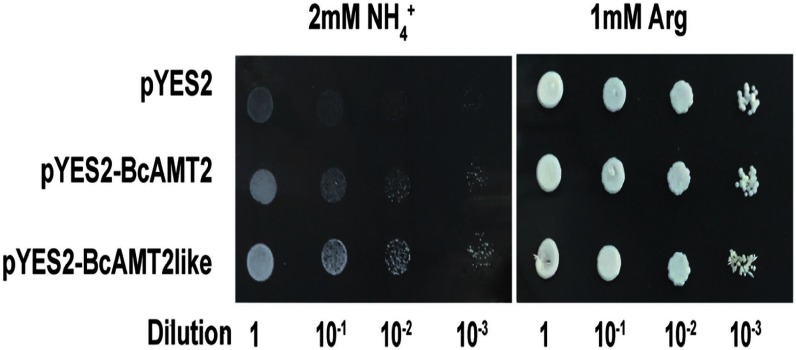
Recombinant yeast strains harbouring pYES2-BcAMT2 or pYES2-BcAMT2like or the empty vector (pYES2) grew normally on solid medium containing 1 mM arginine, suggesting that vector construction and yeast-cell growth abilities were adequate (Figure 4). Recombinant strains harbouring pYES2-BcAMT2 and pYES2-BcAMT2like grew normally on solid medium with 2 mM ammonium as the only N source, while negative control cells transformed with empty pYES2 could hardly grow or did not grow at all (Figure 4). These results indicated that BcAMT2 and BcAMT2like encode functional AMTs.
Figure 4. Functional complementation of yeast mutant 31019b cells by BcAMT2 and BcAMT2like. pYES2: empty vector was used as the negative control. pYES2-BcAMT2 and pYES2-BcAMT2like: BcAMT2 and BcAMT2like ORFs cloned into pYES2 vector. Yeast cell suspensions were adapted to an optical density at 600 nm of 1.0 (dilution 1). Then, they were serially diluted by factors of 10, and 3 µl of the yeast cell suspensions at each dilution were spotted on yeast nitrogen base medium. Growth was evaluated after three days of incubation at 30°C.
Expression patterns of BcAMT2s in different tissues and developmental stages
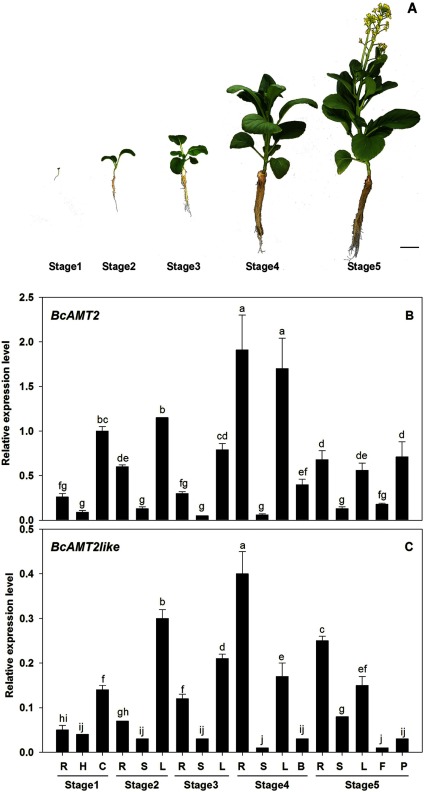
To further characterize the AMT2 subfamily in B. campestris, the expression patterns of BcAMT2 and BcAMT2like in different organs and developmental stages were investigated. As shown in Figure 5, BcAMT2 was constitutively expressed throughout the growth period and in all tested organs, showing the highest expression in cotyledons and leaves during vegetative growth and the lowest in stems throughout development (Figure 5B, stages 1 to 3). In addition, the expression level of BcAMT2 in roots and pods gradually increased during the stages of reproductive growth (Figure 5B, stages 4 and 5). Similar trends were observed in BcAMT2like expression levels from the cotyledon stage to stalk-growth stage (Figure 5C, stages 1 to 3), but expression levels in roots and stems significantly increased during reproductive growth stages (Figure 5C, stages 4 and 5). Thus, there was an obvious difference between the expression of BcAMT2 and BcAMT2like during the reproductive growth stage, with high BcAMT2 expression in roots, leaves, flower buds, and pods (Figure 5B) and high BcAMT2like expression in roots, leaves, and stem only (Figure 5C). This indicated that BcAMT2 and BcAMT2like might play different roles during the late development of B. campestris.
Figure 5. BcAMT2 and BcAMT2like expression patterns in different organs of B. campestris during five developmental stages. A: Samples were collected at the cotyledon stage (stage 1), three-leaf stage (stage 2), six-leaf stage (stage 3), stalk-growth stage (stage 4), and flowering stage (stage 5). Scale bar: 5 cm. B, C: Expression levels of BcAMT2 and BcAMT2like in the different stages. Roots (R), hypocotyls (H), cotyledons (C), stem (S), leaves (L), buds (flower bud), flowers (F), and pods (P). The transcript levels of BcAMT2 and BcAMT2like were normalized to the expression of β-actin and glyceraldehyde-3-phosphate dehydrogenase gene. Each value represents the mean±SE (n=3). Different lowercase letters show significant differences at p<0.05.
BcAMT2s transcriptions respond to N regimes, external pH, and circadian cycle
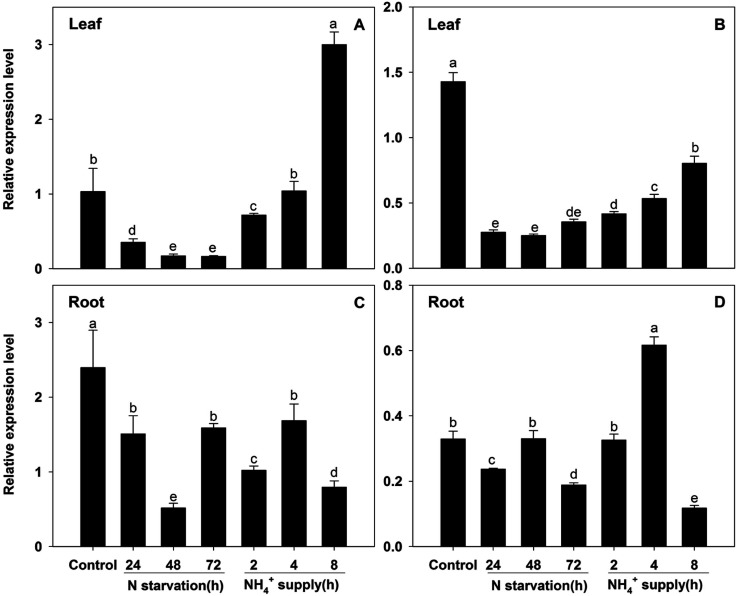
The results of qPCR showed that BcAMT2 and BcAMT2like had similar expression patterns in leaves during N starvation and resupply (Figure 6A, B). With the prolongation of N starvation, the transcription of both genes strongly decreased, with BcAMT2 and BcAMT2like expression being about 15.8% and 24.9% of that under control conditions, respectively. During N resupply, their expression levels increased gradually. In roots, BcAMT2 and BcAMT2like had different expression patterns (Figure 6C, D). The expression of both genes slightly decreased as compared to that under control conditions under N starvation; however, 4 h after N resupply, only BcAMT2like transcripts increased.
Figure 6. BcAMT2 and BcAMT2like expression in B. campestris after different periods of N starvation and ammonium (NH4+) supply. A, B: BcAMT2 and BcAMT2like expression in leaves under N starvation for 72 h, followed by NH4+ supply for 8 h. C, D: BcAMT2 and BcAMT2like expression in roots under the same conditions described for leaves. Each value represents the mean±SE (n=3). Different lowercase letters indicate significant differences at p<0.05.
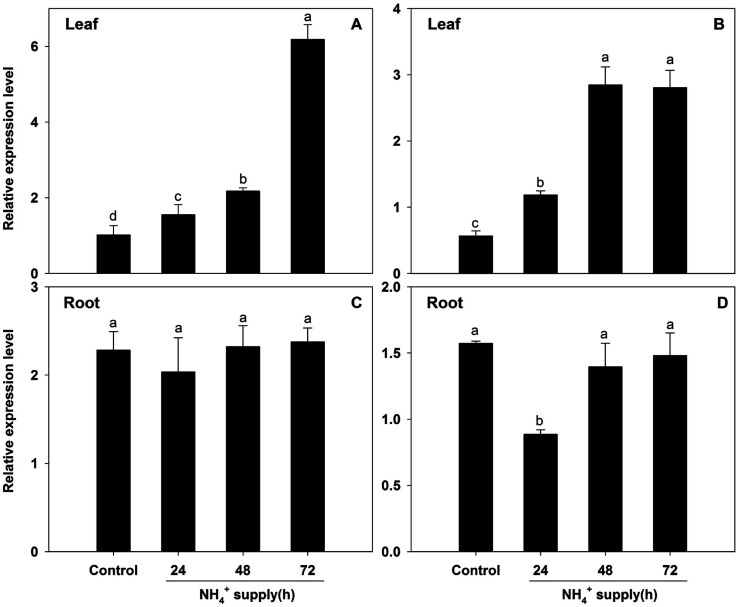
When B. campestris plants were exposed to a high ammonium concentration (10 mM), BcAMT2 and BcAMT2like expression strongly increased in leaves (Figure 7A, B), but not in roots, where levels were nearly unaffected (Figure 7C), except for the decline in BcAMT2like expression at 24 h after ammonium supply (Figure 7D). Given that 10 mM ammonium exceeds the root assimilatory capacity, plants might require enhanced long-distance transport and xylem loading of excess ammonium to prevent the deleterious effects of ammonium accumulation in roots. The observed expression patterns indicated that these two genes might act in root-to-shoot transport and are likely regulated by the levels of ammonium within the plant.
Figure 7. BcAMT2 and BcAMT2like expression in leaves and roots of B. campestris under high NH4+ treatment (10 mM). A, B: BcAMT2 and BcAMT2like expression in leaves treated for the indicated periods; C, D: BcAMT2 and BcAMT2like expression in roots treated for the indicated periods. Each value represents the mean±SE (n=3). Different lowercase letters indicate significant differences at p<0.05.
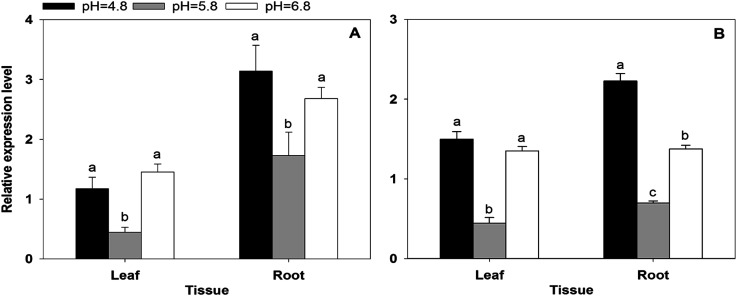
Environmental pH has a significant influence on the balance between ammonium and ammonia, and the expression levels of BcAMT2 and BcAMT2like in B. campestris exhibited strong responses to external pH (Figure 8). When the pH increased from 4.8 to 5.8, transcript levels of BcAMT2 in leaves and roots decreased by 62% and 45% in relation to those in the control treatment, respectively, and returned to the original levels when the pH increased from 5.8 to 6.8 (Figure 8A). Similar results were obtained for BcAMT2like (Figure 8B), suggesting that the responses of both genes to ammonium might be pH-dependent.
Figure 8. BcAMT2 (A) and BcAMT2like (B) expression in leaves and roots of B. campestris at different pH for three days. Each value represents the mean±SE (n=3). Different lowercase letters indicate significant differences at p<0.05.
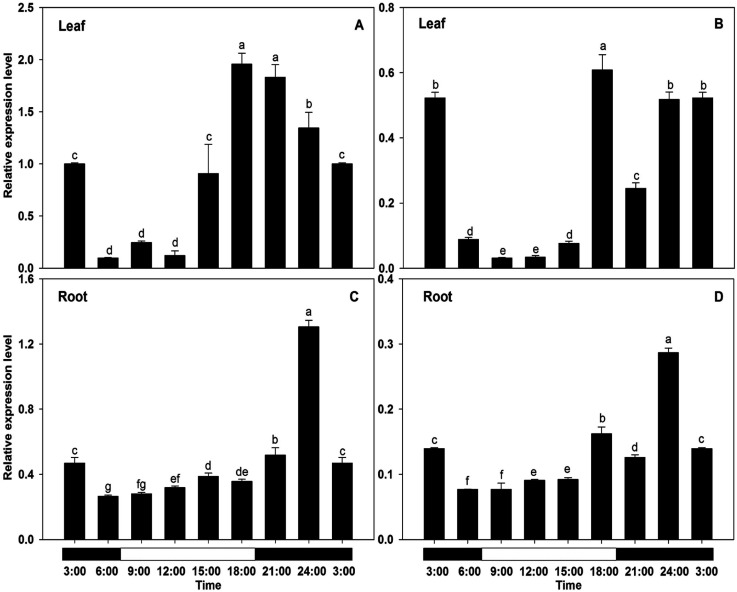
Circadian variations (Figure 9) were detected in the expression of both genes, regardless of the organ examined, with the highest transcript amounts being observed in the afternoon/evening and the lowest in the morning (Figure 9A–D). In detail, BcAMT2 expression in leaves was lowest at 6:00 (only 10% of that observed at 3:00) and highest at 18:00 (about 2-folds that observed at 3:00) (Figure 9A). Similarly, BcAMT2like transcripts reached the highest level at 18:00 and then decreased gradually to reach the lowest level at 9:00 (about 6% of that observed at 3:00) (Figure 9B). In roots, the highest levels of BcAMT2 and BcAMT2like transcripts were observed at 24:00 (about 2.8-fold and 2.1-fold that observed at 3:00, respectively; Figure 9C, D). The expression of both BcAMT2s in response to the circadian rhythm in roots occurred relatively later and for a shorter period than that in leaves.
Figure 9. Effect of the circadian cycle on the expression of BcAMT2 and BcAMT2like in Brassica campestris. A, B: expression of BcAMT2 and BcAMT2like in leaves; C, D: expression of BcAMT2 and BcAMT2like in roots. Each value represents the mean±SE (n=3). Different lowercase letters indicate significant differences at p<0.05.
Discussion
In the present study, analysis of cDNA and genomic DNA sequences of two members of the AMT2 subfamily from B. campestris, namely BcAMT2 and BcAMT2like, revealed that these genes encode polypeptides of 490 and 489 amino acids, respectively, and present 93% similarity at the amino acid level (Figure 1B). In agreement with the two to four introns structure presented by other AMT2 subfamily members (Castro-Rodríguez et al. 2016; Li et al. 2016; Sohlenkamp et al. 2002; Suenaga et al. 2003), BcAMT2 and BcAMT2like contain four introns (Figure 1A). The phylogenetic tree showed that BcAMT2 and BcAMT2like clustered within the AMT2 subfamily and were highly similar to BrAMT2s from B. rapa and AtAMT2 from A. thaliana (Figure 2A). Similar to other plant AMT proteins (Castro-Rodríguez et al. 2016; Thomas et al. 2000; von Wittgenstein et al. 2014), the deduced amino acid sequences of BcAMT2 and BcAMT2like contained 11 TM helices (Figure 1B), one extracellular N-terminus, and one cytosolic C-terminus, and had a potential AMT2 subfamily signature motif (191DYSGGYVIHLSSGVAGFVAAYWVGPR216), located in the fifth transmembrane helix (Figures 1B, 2B). This motif, which is located in the most conserved TM (Saier 1999) can be used to identify additional members of the AMT subfamilies in other plant species (Couturier et al. 2007), and has been shown to affect ammonium transport capabilities of AMTs (Loqué et al. 2009; Wang et al. 2012). Similar to the results obtained for AMTs in other plants (Castro-Rodríguez et al. 2016; Sohlenkamp et al. 2002; Song et al. 2017; Yuan et al. 2009), both pBI121-BcAMT2-GFP and pBI121-BcAMT2like-GFP localized to the plasma membrane. Furthermore, BcAMT2 and BcAMT2like could recover growth of mutant yeast cells when 2 mM ammonium was the only N source (Figure 4).
Different members of the AMT family may have discrete or partially overlapping roles in plants (Couturier et al. 2007; Neuhäuser et al. 2009; Straub et al. 2014). The qPCR analysis showed that BcAMT2 and BcAMT2like were expressed constitutively throughout the plant and in all organs tested (Figure 5). Similar results have been obtained for LjAMT2;1 in L. japonicus (Simon-Rosin et al. 2003) and for PpAMT2;1 and PpAMT2;3 in Pinus pinaster (Castro-Rodríguez et al. 2016). Overall, BcAMT2 and BcAMT2like transcripts had similar expression tendencies from the cotyledon to the stalk-growth stage (Figure 5B, C). While BcAMT2 was highly expressed in roots, leaves, flower buds, and pods (Figure 5B), BcAMT2like was mainly expressed in the vegetative tissues of fully developed plants and showed rather low expression in the reproductive tissues (Figure 5C). AMT2;1 plays an important role in root-to-shoot translocation of ammonium and is partly involved in ammonium uptake, depending on the plant nutritional status (Giehl et al. 2017). Whereas in the vegetative growth stages, both BcAMT2 and BcAMT2like might transport ammonium from root to shoot, in the reproductive stage, BcAMT2 might take up and transport ammonium to leaves, flower buds, and pods, while BcAMT2like might take up and transport ammonium to leaves.
Previous studies have shown that plant AMT genes can respond to various N regimes (Li et al. 2016; Sohlenkamp et al. 2002; Song et al. 2017; Straub et al. 2014). In the current study, BcAMT2 expression was regulated by N starvation, ammonium supply (Figure 6), and high ammonium levels (Figure 7). Thus, BcAMT2s responded to various N regimes, and transcript levels in the leaves of B. campestris were positively correlated with the N concentration supplied to plants (Figures 6, 7). During the 72 h of N starvation, BcAMT2 and BcAMT2like transcript levels in the leaves strongly declined, but under the 4 mM NH4Cl supply following N starvation, they returned to their basal levels (Figure 6A, B). Furthermore, their expression levels in leaves strongly increased under high ammonium treatment (10 mM NH4Cl) (Li et al. 2016; Figure 7A, B). In roots, the transcript levels of BcAMT2s responded differently to N starvation, ammonium supply (Figure 6C, D), and high ammonium levels (Figure 7C, D). Giehl et al. (2017) reported that AtAMT2;1 makes a small but important contribution to ammonium uptake in the millimolar range of substrate. In plants subjected to high ammonium concentration, AMT2;1 mediates a high accumulation ammonium in xylem sap, although no net ammonium influx, which contributes to long-distance translocation from root to shoot. These functions depended on organ-specific expression in response to the plant nutritional status (Couturier et al. 2007; Giehl et al. 2017; Li et al. 2016; Straub et al. 2014).
Owing to ammonia being a weak base, the balance between ammonia and ammonium depends on external pH. As pH increases from 5.5 to 7.0, ammonium concentration decreases by about 1% while that of ammonia increases about 30-fold (Neuhäuser et al. 2009). Thus, profiles of AMT responses to pH might be used to identify the substrate of AMT transportation as ammonia or ammonium (Li et al. 2016; Neuhäuser et al. 2009; Sohlenkamp et al. 2002). Compared with pH 4.8, BcAMT2 and BcAMT2like expression in leaves and roots decreased when plants were subjected to pH 5.8, but increased significantly and returned to the original levels when subjected to pH 6.8. Ammonium transport is thought to be less affected by pH than that of ammonia (Sohlenkamp et al. 2002). Therefore, we hypothesized that the transportation abilities of BcAMT2s depend on external pH. Both ammonium and ammonia might be transported by BcAMT2s in B. campestris, similar to observations in A. thaliana. Although ammonium is the recruited substrate of AtAMT2 (Sohlenkamp et al. 2002), the uncharged form ammonia is also transported (Neuhäuser et al. 2009). A mycorrhiza-specific LjAMT2;2 from L. japonicus can also transport electroneutral ammonia (Guether et al. 2009).
The circadian rhythm has been shown to regulate ammonium uptake in plants (Haydon et al. 2011), and there is substantial evidence indicating that the transcription of ammonium transporters is correlated with diurnal variation (Couturier et al. 2007; Gazzarrini et al. 1999; Li et al. 2016; Ranathunge et al. 2014; Song et al. 2011). In agreement with previous results (Couturier et al. 2007; Gazzarrini et al. 1999), BcAMT2 and BcAMT2like expression were strongly affected by diurnal changes, with the highest transcript levels in leaves being found at the end of the light period (Figure 9A, B), coinciding with the high carbohydrate levels required for ammonium assimilation (Couturier et al. 2007). This suggests that the regulation of transcription of AMT genes might be controlled by carbohydrate availability (Couturier et al. 2007; Gazzarrini et al. 1999; Li et al. 2016). Likewise, BcAMT2s expression in the roots followed the circadian rhythm (Figure 9C, D); however, compared with leaves, the expression of BcAMT2s in response to the circadian rhythm was comparatively delayed and occurred over a shorter period. These diurnal changes in AMT expression and transport activity have been attributed to changes in the concentration of photosynthetic products and their shoot-to-root transport (Camañes et al. 2007). Sugars make a major contribution to the diurnal changes in gene expression (Bläsing et al. 2005; Haydon et al. 2011). However, the effect of light stimulation on AMT expression and ammonium transport activity is independent of the circadian rhythm (Camañes et al. 2007). Therefore, further experiments will be necessary to elucidate the relationship between BcAMT expression and light/dark period.
In addition, ammonium in plant tissues is not only absorbed from the environment, but it is also produced in several metabolic processes, including nitrate reduction, photorespiration, amino acid catabolism, and phenylpropanoid metabolism (Bittsánszky et al. 2015; Liu and von Wirén 2017). Photorespiration in shoots generates a large amount of ammonium in mitochondria, which is transported to chloroplasts for re-assimilation and recycled to maintain N status (D’Apuzzo et al. 2004; Sohlenkamp et al. 2002). In addition, AMT expression is crucial to ensure ammonium recycling during photorespiration (D’Apuzzo et al. 2004; Li et al. 2016). Accordingly, we found that BcAMT2 expression in the leaves increased under high ammonium treatment (Figure 7). Thus, both BcAMT2 and BcAMT2like might participate in ammonium recycling during photorespiration (Li et al. 2016; Sohlenkamp et al. 2002).
BcAMT2 and BcAMT2like had similar responses to N regimen, external pH, high ammonium treatment, and photoperiod, but also displayed specific expression patterns, with BcAMT2 expression generally being higher than that of BcAMT2like. The BcAMT2s from B. campestris and BrAMT2s from B. rapa were located in the same phylogenetic cluster as AtAMT2 from A. thaliana (Figure 2A). However, the AMT2 subfamily in A. thaliana has only one member, while there are two members in B. campestris and B. rapa. Brassica plants have all undergone a whole-genome triplication event (Cheng et al. 2013) that might have originated the three paleo-subgenomes and multiple copies of paralogous genes found in the genomes of B. rapa and B. oleracea (Cheng et al. 2016), as observed for PtrAMT2;1 and PtrAMT2;2 (Couturier et al. 2007). Duplicate genes can potentially diverge in their roles as well as retain different sub-function of the original gene. Thus, the two B. campestris genes examined here might have developed sub-functions during evolution. Nevertheless, further experiments are required to assess the ability of ammonium absorption and/or transportation by BcAMT2 and BcAMT2like under different external pH.
Acknowledgments
This work was supported by the National Natural Science Foundation of China (31401855; http://www.nsfc.gov.cn/) and the China Agriculture Research System (CARS-25-C-04). The authors would also like to thank Dr. Bruno André (Université Libre de Bruxelles, Belgium) for providing the yeast mutant strain 31019b and Dr. Guibing Hu (South China Agricultural University, China) for providing pBI121-GFP vector.
References
- Becker D, Stanke R, Fendrik I, Frommer WB, Vanderleyden J, Kaiser WM, Hedrich R (2002) Expression of the NH4+-transporter gene LeAMT1;2 is induced in tomato roots upon association with N2-fixing bacteria. Planta 215: 424–429 [DOI] [PubMed] [Google Scholar]
- Bittsánszky A, Pilinszky K, Gyulai G, Komives T (2015) Overcoming ammonium toxicity. Plant Sci 231: 184–190 [DOI] [PubMed] [Google Scholar]
- Bläsing OE, Gibon Y, Günther M, Höhne M, Morcuende R, Osuna D, Thimm O, Usadel B, Scheible WR, Stitt M (2005) Sugars and circadian regulation make major contributions to the global regulation of diurnal gene expression in Arabidopsis. Plant Cell 17: 3257–3281 [DOI] [PMC free article] [PubMed] [Google Scholar]
- Bloom AJ, Meyerhoff PA, Taylor AR, Rost TL (2002) Root development and absorption of ammonium and nitrate from the rhizosphere. J Plant Growth Regul 21: 416–431 [Google Scholar]
- Camañes G, Cerezo M, Primo-Millo E, Gojon A, García-Agustín P (2007) Ammonium transport and CitAMT1 expression are regulated by light and sucrose in Citrus plants. J Exp Bot 58: 2811–2825 [DOI] [PubMed] [Google Scholar]
- Camañes G, Cerezo M, Primo-Millo E, Gojon A, García-Agustín P (2009) Ammonium transport and CitAMT1 expression are regulated by N in Citrus plants. Planta 229: 331–342 [DOI] [PubMed] [Google Scholar]
- Castro-Rodríguez V, Assaf-Casals I, Pérez-Tienda J, Fan XR, Avila C, Miller A, Cánovas FM (2016) Deciphering the molecular basis of ammonium uptake and transport in maritime pine. Plant Cell Environ 39: 1669–1682 [DOI] [PubMed] [Google Scholar]
- Cheng F, Mandáková T, Wu J, Xie Q, Lysak MA, Wang XW (2013) Deciphering the diploid ancestral genome of the mesohexaploid Brassica rapa. Plant Cell 25: 1541–1554 [DOI] [PMC free article] [PubMed] [Google Scholar]
- Cheng F, Sun RF, Hou XL, Zheng HK, Zhang FL, Zhang YY, Liu B, Liang JL, Zhuang M, Liu YX, et al. (2016) Subgenome parallel selection is associated with morphotype diversification and convergent crop domestication in Brassica rapa and Brassica oleracea. Nat Genet 48: 1218–1224 [DOI] [PubMed] [Google Scholar]
- Couturier J, Montanini B, Martin F, Brun A, Blaudez D, Chalot M (2007) The expanded family of ammonium transporters in the perennial poplar plant. New Phytol 174: 137–150 [DOI] [PubMed] [Google Scholar]
- Crooks GE, Hon G, Chandonia J, Brenner SE (2004) WebLogo: A Sequence Logo Generator. Genome Res 14: 1188–1190 [DOI] [PMC free article] [PubMed] [Google Scholar]
- D’Apuzzo E, Rogato A, Simon-Rosin U, El Alaoui H, Barbulova A, Betti M, Dimou M, Katinakis P, Marquez A, Marini AM, et al. (2004) Characterization of three functional high-affinity ammonium transporters in Lotus japonicus with differential transcriptional regulation spatial expression. Plant Physiol 134: 1763–1774 [DOI] [PMC free article] [PubMed] [Google Scholar]
- Ding L, Li YR, Wang Y, Gao LM, Wang M, Chaumont F, Shen QR, Guo SW (2016) Root ABA accumulation enhances rice seedling drought tolerance under ammonium supply: Interaction with aquaporins. Front Plant Sci 7: 1206. [DOI] [PMC free article] [PubMed] [Google Scholar]
- Fernández-Crespo E, Scalschi L, Llorens E, García-Agustín P, Camañes G (2015) NH4+ protects tomato plants against Pseudomonas syringae by activation of systemic acquired acclimation. J Exp Bot 66: 6777–6790 [DOI] [PMC free article] [PubMed] [Google Scholar]
- Gazzarrini S, Lejay L, Gojon A, Ninnemann O, Frommer WB, vonWirén N (1999) Three functional transporters for constitutive, diurnally regulated, and starvation-induced uptake of ammonium into Arabidopsis roots. Plant Cell 11: 937–947 [DOI] [PMC free article] [PubMed] [Google Scholar]
- Giehl RFH, Laginha AM, Duan FY, Rentsch D, Yuan LX, von Wirén N (2017) A critical role of AMT2;1 in root-to-shoot translocation of ammonium in Arabidopsis. Mol Plant 10: 1449–1460 [DOI] [PubMed] [Google Scholar]
- Guether M, Neuhauser B, Balestrini R, Dynowski M, Ludewig U, Bonfante P (2009) A mycorrhizal-specific ammonium transporter from Lotus Japonicus acquires nitrogen released by Arbuscular Mycorrhizal Fungi. Plant Physiol 150: 73–83 [DOI] [PMC free article] [PubMed] [Google Scholar]
- Hachiya T, Sakakibara H (2017) Interactions between nitrate and ammonium in their uptake, allocation, assimilation, and signaling in plants. J Exp Bot 68: 2501–2512 [DOI] [PubMed] [Google Scholar]
- Hao DL, Yang SY, Huang YN, Su YH (2016) Identification of structural elements involved in fine-tuning of the transport activity of the rice ammonium transporter OsAMT1;3. Plant Physiol Biochem 108: 99–108 [DOI] [PubMed] [Google Scholar]
- Haydon MJ, Bell LJ, Webb AAR (2011) Interactions between plant circadian clocks and solute transport. J Exp Bot 62: 2333–2348 [DOI] [PubMed] [Google Scholar]
- Hu B, Jin JP, Guo AY, Zhang H, Luo JC, Gao G (2015) GSDS 2.0: An upgraded gene feature visualization server. Bioinformatics 31: 1296–1297 [DOI] [PMC free article] [PubMed] [Google Scholar]
- Jing J, Zhang F, Rengel Z, Shen J (2012) Localized fertilization with P plus N elicits an ammonium-dependent enhancement of maize root growth and nutrient uptake. Field Crop Res 133: 176–185 [Google Scholar]
- Li H, Cong Y, Chang YH, Lin J (2016) Two AMT2-type ammonium transporters from pyrus betulaefolia demonstrate distinct expression characteristics. Plant Mol Biol Rep 34: 707–719 [Google Scholar]
- Lima JE, Kojima S, Takahashi H, von Wirén N (2010) Ammonium triggers lateral root branching in Arabidopsis in an ammonium transporter1;3-dependent manner. Plant Cell 22: 3621–3633 [DOI] [PMC free article] [PubMed] [Google Scholar]
- Liu Y, von Wirén N (2017) Ammonium as a signal for physiological and morphological responses in plants. J Exp Bot 68: 2581–2592 [DOI] [PubMed] [Google Scholar]
- Livak KJ, Schmittgen TD (2001) Analysis of relative gene expression data using real-time quantitative PCR and the 2−ΔΔCt method. Methods 25: 402–408 [DOI] [PubMed] [Google Scholar]
- Loqué D, Mora SI, Andrade SL, Pantoja O, Frommer WB (2009) Pore mutations in ammonium transporter AMT1 with increased electrogenic ammonium transport activity. J Biol Chem 284: 24988–24995 [DOI] [PMC free article] [PubMed] [Google Scholar]
- Loqué D, von Wirén N (2004) Regulatory levels for the transport of ammonium in plant roots. J Exp Bot 55: 1293–1305 [DOI] [PubMed] [Google Scholar]
- Ludewig U, Neuhäuser B, Dynowski M (2007) Molecular mechanisms of ammonium transport and accumulation in plants. FEBS Lett 581: 2301–2308 [DOI] [PubMed] [Google Scholar]
- Marini AM, Soussi-Boudekou S, Vissers S, Andre B (1997) A family of ammonium transporters in Saccharomyces cerevisiae. Mol Cell Biol 17: 4282–4293 [DOI] [PMC free article] [PubMed] [Google Scholar]
- McDonald TR, Dietrich FS, Lutzoni F (2012) Multiple horizontal gene transfers of ammonium transporters/ammonia permeases from prokaryotes to eukaryotes: Toward a new functional and evolutionary classification. Mol Biol Evol 29: 51–60 [DOI] [PMC free article] [PubMed] [Google Scholar]
- Neuhäuser B, Dynowski M, Ludewig U (2009) Channel-like NH3 flux by ammonium transporter AtAMT2. FEBS Lett 583: 2833–2838 [DOI] [PubMed] [Google Scholar]
- Pantoja O (2012) High affinity ammonium transporters: Molecular mechanism of action. Front Plant Sci 3: 34. [DOI] [PMC free article] [PubMed] [Google Scholar]
- Ranathunge K, El-kereamy A, Gidda S, Bi YM, Rothstein SJ (2014) AMT1;1 transgenic rice plants with enhanced NH4+ permeability show superior growth and higher yield under optimal and suboptimal NH4+ conditions. J Exp Bot 65: 965–979 [DOI] [PMC free article] [PubMed] [Google Scholar]
- Saier MH Jr (1999) Genome archeology leading to the characterization and classification of transport proteins. Curr Opin Microbiol 2: 555–561 [DOI] [PubMed] [Google Scholar]
- Salvemini F, Marini AM, Riccio A, Patriarca EJ, Chiurazzi M (2001) Functional characterization of an ammonium transporter gene from Lotus japonicus. Gene 270: 237–243 [DOI] [PubMed] [Google Scholar]
- Simon-Rosin U, Wood C, Udvardi MK (2003) Molecular and cellular characterisation of LjAMT2;1, an ammonium transporter from the model legume Lotus japonicus. Plant Mol Biol 51: 99–108 [DOI] [PubMed] [Google Scholar]
- Sohlenkamp C, Wood CC, Roeb GW, Udvardi MK (2002) Characterization of Arabidopsis AtAMT2, a high–affinity ammonium transporter of the plasma membrane. Plant Physiol 130: 1788–1796 [DOI] [PMC free article] [PubMed] [Google Scholar]
- Song SW, He ZH, Huang XM, Zhong LH, Liu HC, Sun GW, Chen RY (2017) Cloning and characterization of the ammonium transporter genes BaAMT1;1 and BaAMT1;3 from Chinese kale. Hortic Environ Biote 58: 178–186 [Google Scholar]
- Song SW, Yi LY, Liu HC, Sun GW, Chen RY (2012) Effect of ammonium and nitrate ratio on nutritional quality of flowering Chinese cabbage. Appl Mech Mater 142: 188–192 [Google Scholar]
- Song T, Gao Q, Xu Z, Song RT (2011) The cloning and characterization of two ammonium transporters in the salt-resistant green alga, Dunaliella viridis. Mol Biol Rep 38: 4797–4804 [DOI] [PubMed] [Google Scholar]
- Straub D, Ludewig U, Neuhäuser B (2014) A nitrogen-dependent switch in the high affinity ammonium transport in Medicago truncatula. Plant Mol Biol 86: 485–494 [DOI] [PubMed] [Google Scholar]
- Suenaga A, Moriya K, Sonoda Y, Ikeda A, von Wirén N, Hayakawa T, Yamaguchi J, Yamaya T (2003) Constitutive expression of a novel type ammonium transporter OsAMT2 in rice plants. Plant Cell Physiol 44: 206–211 [DOI] [PubMed] [Google Scholar]
- Tamura K, Stecher G, Peterson D, Filipski A, Kumar S (2013) MEGA6: Molecular evolutionary genetics analysis version 6.0. Mol Biol Evol 30: 2725–2729 [DOI] [PMC free article] [PubMed] [Google Scholar]
- Thomas GH, Mullins JG, Merrick M (2000) Membrane topology of the Mep/Amt family of ammonium transporters. Mol Microbiol 37: 331–344 [DOI] [PubMed] [Google Scholar]
- von Wirén N, Gazzarrini S, Gojon A, Frommer WB (2000a) The molecular physiology of ammonium uptake and retrieval. Curr Opin Plant Biol 3: 254–261 [PubMed] [Google Scholar]
- von Wirén N, Lauter FR, Ninnemann O, Gillissen B, Walch-Liu P, Engels C, Jost W, Frommer WB (2000b) Differential regulation of three functional ammonium transporter genes by nitrogen in root hairs and by light in leaves of tomato. Plant J 21: 167–175 [DOI] [PubMed] [Google Scholar]
- von Wittgenstein NJ, Le CH, Hawkins BJ, Ehlting J (2014) Evolutionary classification of ammonium, nitrate, and peptide transporters in land plants. BMC Evol Biol 14: 11. [DOI] [PMC free article] [PubMed] [Google Scholar]
- Wang S, Orabi EA, Baday S, Berneche S, Lamoureux G (2012) Ammonium transporters achieve charge transfer by fragmenting their substrate. J Am Chem Soc 134: 10419–10427 [DOI] [PubMed] [Google Scholar]
- Yang N, Zhu CH, Gan LJ, Ng D, Xia K (2011) Ammonium-stimulated root hair branching is enhanced by methyl jasmonate and suppressed by ethylene in Arabidopsis thaliana. J Plant Biol 54: 92–100 [Google Scholar]
- Yuan LX, Graff L, Loqué D, Kojima S, Tsuchiya YN, Takahashi H, von Wiren N (2009) AtAMT1;4, a pollen-specific high-affinity ammonium transporter of the plasma membrane in Arabidopsis. Plant Cell Physiol 50: 13–25 [DOI] [PMC free article] [PubMed] [Google Scholar]
- Yuan LX, Loqué D, Kojima S, Rauch S, Ishiyama K, Inoue E, Takahashi H, von Wirén N (2007) The organization of high-affinity ammonium uptake in Arabidopsis roots depends on the spatial arrangement and biochemical properties of AMT1-type transporters. Plant Cell 19: 2636–2652 [DOI] [PMC free article] [PubMed] [Google Scholar]
- Zeng HQ, Liu G, Kinoshita T, Zhang RP, Zhu YY, Shen QR, Xu GH (2012) Stimulation of phosphorus uptake by ammonium nutrition involves plasma membrane H+-ATPase in rice roots. Plant Soil 357: 205–214 [Google Scholar]
- Zhang R, Zhu J, Cao HZ, An YR, Huang JJ, Chen XH, Mohammed N, Afrin S, Luo ZY (2013) Molecular cloning and expression analysis of PDR1-like gene in ginseng subjected to salt and cold stresses or hormonal treatment. Plant Physiol Biochem 71: 203–211 [DOI] [PubMed] [Google Scholar]
- Zou C, Shen J, Zhang F, Guo S, Rengel Z, Tang C (2001) Impact of nitrogen form on iron uptake and distribution in maize seedlings in solution culture. Plant Soil 235: 143–149 [Google Scholar]


