Abstract
Regulation of cell proliferation is necessary for immune responses, tissue repair, and upkeep of organ function to maintain human health1. When proliferating cells complete mitosis, a fraction of newly born daughter cells immediately enter the next cell cycle, while the remaining cells in the same population exit to a transient or persistent quiescent state2. Whether this choice between two cell-cycle pathways is due to natural variability in mitogen signalling or other underlying causes is unknown. Here we show that human cells make this fundamental cell-cycle entry or exit decision based on competing memories of variable mitogen and stress signals. Rather than erasing their signalling history at cell-cycle checkpoints before mitosis, mother cells transmit DNA damage-induced p53 protein and mitogen-induced cyclin D1 (CCND1) mRNA to newly born daughter cells. After mitosis, the transferred CCND1 mRNA and p53 protein induce variable expression of cyclin D1 and the CDK inhibitor p21 that almost exclusively determines cell-cycle commitment in daughter cells. We find that stoichiometric inhibition of cyclin D1-CDK4 activity by p21 controls the retinoblastoma (Rb) and E2F transcription program in an ultrasensitive manner. Thus, daughter cells control the proliferation-quiescence decision by converting the memories of variable mitogen and stress signals into a competition between cyclin D1 and p21 expression. We propose a cell-cycle control principle based on natural variation, memory and competition that maximizes the health of growing cell populations.
We investigated how cells decide between different cell-cycle paths by using a stably transduced live-cell reporter of CDK2 activity in non-transformed human mammary epithelial MCF10A cells2. After mitosis, newly born daughter cells either increase CDK2 activity for continued proliferation (CDK2inc), or decrease CDK2 activity, entering a persistent (CDK2low) or transient (CDK2delay) quiescent state (G0) (Fig. 1a). Selection of the CDK2 path is regulated by mitogen/RAS/ MEK/ERK signalling in mother cells2,3, activation of the cyclin D-CDK4 complex4, and induction of E2F transcription factors5 (Fig. 1b). Here, we explore whether and how natural variability in signalling regulates the selection of different CDK2 paths.
Figure 1 |. Variation in mitogen/ERK signalling in mother cells partially predicts the CDK2 path selection in daughter cells.
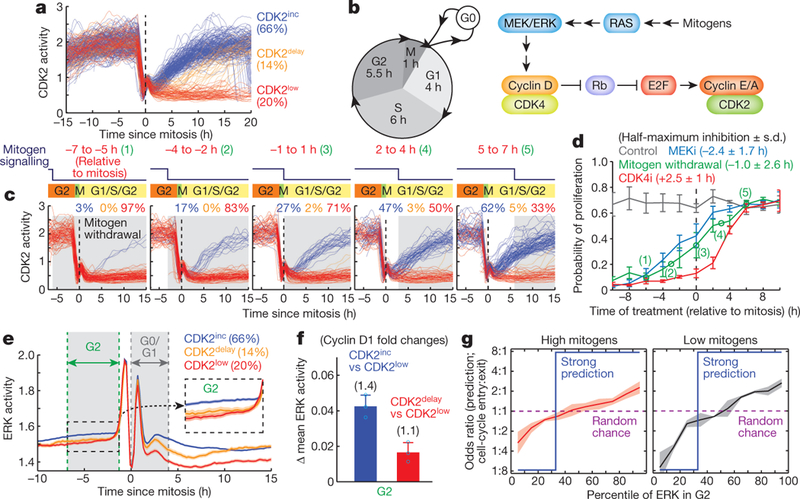
a, Single-cell CDK2 activity traces aligned to the end of mitosis (anaphase) showing three distinguishable CDK2 activity paths in daughter cells (CDK2inc, CDK2low or CDK2delay). b, Left, schematic with approximate cell-cycle timing in MCF10A cells. Right, core mediators of the mitogen signalling pathway that regulate cell proliferation in MCF10A cells. CDK4 depicts CDK4 and CDK6. c, Examples of CDK2 activity traces aligned to the end of mitosis. Each panel shows different time windows relative to mitosis when mitogens were withdrawn (marked in grey) in d. d, Probability of proliferation (defined as CDK2 activity > 1, 10 h after mitosis) represented as a function of time when inhibitors of MEK (MEKi; 100 nM PD0325901) or of CDK4 (CDK4i; 1 μM palbociclib) were added or when mitogens were removed, relative to mitosis. Data are mean ± s.e.m. (n = 5 biological replicates). e, Alignment of averaged ERK activity traces to the time of mitosis after sorting cells according to their respective CDK2 paths. Data are mean ± 95% confidence intervals (n = 2,896 cells). f, ERK activity differences in G2 between cells on different CDK2 paths in daughter cells. Data are mean ± s.d. (n = 3 biological replicates). g, Odds ratio analysis showing the percentile of ERK activity in G2 partially predicting CDK2 path selection in daughter cells (high mitogens: full growth media; low mitogens: 1% serum, 2 μg ml−1 EGF). Data are mean ± s.d. (n = 3 biological replicates).
To determine when different steps in the mitogen signalling pathway are needed for daughter cells to enter the next cell cycle, we tested three points in the pathway by either removing mitogens or applying inhibitors of MEK (PD0325901) or CDK4 (palbociclib) in asynchronously cycling cells. When aligning cells in silico by the time of pathway inhibition relative to the end of mitosis, we confirmed that mitogens and MEK had to be inhibited in mother cells to effectively suppress cell-cycle entry in daughter cells2,3 (Fig. 1c, d). By contrast, inhibition of CDK4 suppressed cell-cycle entry until 2.5 h after mitosis (Fig. 1d). By transiently removing mitogens for 5 h, we further found that a transient loss in mitogen signalling during G2 or G0/G1 phases suppressed the CDK2inc or CDK2delay paths, respectively (Extended Data Fig. 1). Taken together, these data suggest that a mediator connects mitogen/MEK/ ERK to CDK4 both across mitosis to regulate CDK2inc cells and during G0 of daughter cells to regulate CDK2delay cells.
To test whether variable ERK activity in G2 directs daughter cells to the CDK2inc or CDK2low path, we established MCF10A cells stably expressing ERK6 and CDK2 reporters (Supplementary Video 1). Control experiments confirmed that the signal measured by the ERK reporter reflects ERK activity throughout the cell cycle, except for a peak at the onset of mitosis that is not sensitive to MEK inhibition7 (Extended Data Fig. 2). We also note that inhibition of a peak of ERK activity after mitosis did not prevent cell-cycle entry for most CDK2inc cells (Extended Data Fig. 3a). When we classified and averaged ERK activity based on the CDK2 paths of daughter cells, ERK activity during the G2 phase of mother cells was indeed higher in CDK2inc cells than in CDK2delay or CDK2low cells (Fig. 1e and Extended Data Fig. 3b, c). A calibration in Extended Data Fig. 2e showed that the mean ERK signal difference in G2 between CDK2inc and CDK2low cells corresponded to a 1.4-fold difference in levels of cyclin D1 (Fig. 1f for G2 and Extended Data Fig. 3d for G0/G1). Together with the delay between MEK and CDK4 requirement (Fig. 1d), these data suggest that naturally higher ERK signalling in mother cells may increase cyclin D-CDK4 activity in daughters to promote the CDK2inc path. However, when we tested how ERK activity in G2 predicts the CDK2 paths of daughter cells using an odds ratio analysis, we found that ERK activity is only partially predictive for the CDK2 path selection (Fig. 1g, left). As a reference, a blue line depicts an accurate prediction of the bifurcation in CDK2 activity (Extended Data Fig. 3e, see Methods). The partial prediction is probably not a result of noise, since odds ratios were higher for lower concentrations of mitogen stimuli (Fig. 1g, right and Extended Data Fig. 3f) or times closer to mitosis (Extended Data Fig. 3g). Thus, additional variables probably regulate CDK2 path selection.
We considered whether such an additional regulatory mechanism might be the DNA damage/p53 signalling pathway8,9, since DNA damage is known to occur naturally during DNA replication10 and high levels ofp53-regulated p21 are correlated with cells exiting the cell cycle2. To determine whether p53 and p21 signals in mother cells are correlated with the CDK2 paths of daughter cells, we used live-cell analysis of MCF7 cells that had p53 and p21 tagged with different fluorescent proteins at their endogenous loci11. Although MCF7 is a breast cancer cell line, it has intact CDK4-dependent cell-cycle regulation12. Notably, when we averaged time courses of p53 and p21 expression based on the CDK2 paths of daughter cells, both protein expression levels were higher before mitosis in cells on the CDK2low and CDK2delay paths compared to the CDK2inc path (Fig. 2a, b and Extended Data Fig. 4a). This suggests that p53 signalling in mother cells, along with ERK signalling, is contributing to the cell-cycle decision by daughter cells.
Figure 2 |. DNA damage and p53 signalling in mother cells controls the CDK2inc path selection in daughter cells.
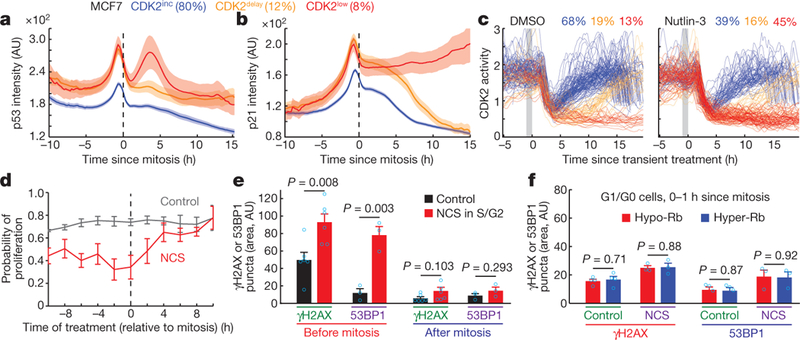
a, b, Alignment of averaged p53 (a) and p21 (b) intensity traces to the time of mitosis after sorting cells according to their respective CDK2 paths. Data are mean ± 95% confidence intervals (n = 1,559 cells). AU, arbitrary units. c, CDK2 activity traces of cells exposed to 1 h application of p53 activators (10μM nutlin-3) 2–3 h before mitosis (marked in grey). d, Probability of proliferation (CDK2 activity > 1, 10 h after mitosis) as a function of time when the 20 min NCS (200 ng ml−1) pulse was applied relative to mitosis. Data are mean ± s.e.m. (n = 3 biological replicates). e, Bar graph of nuclear γH2AX and 53BP1 puncta area. Cells were imaged for 16–20 h after a 20-min vehicle or NCS (200 ng ml−1) pulse in S/G2 phase before being stained with γH2AX or 53BP1. Cells were selected before mitosis or during a 2 h time window after mitosis. Data are mean ± s.e.m. (γH2AX; n = 6, 53BP1; n = 3 biological replicates). f, Bar graph of nuclear γH2AX and nuclear 53BP1 puncta area within 1 h after mitosis in G0/G1 cells. See Extended Data Fig. 5i for cell gating. Data are mean ± s.e.m. (control; n = 4, NCS; n = 3 biological replicates). P values were calculated by unpaired two-tailed t-tests (e, f).
We next tested in MCF10A cells whether p53 has a causal role in CDK2 path selection by knockout and short interfering RNA (siRNA) knockdown of p53, and observed an increase in the number of daughter cells taking the CDK2inc path (Extended Data Fig. 4b, c). Conversely, direct activation of p53 signalling in mother cells by transient incubation with nutlin-3 or tenovin-6 for 1 h triggered a marked reduction in the CDK2inc path in daughter cells (Fig. 2c and Extended Data Fig. 4d). This p53-mediated suppression of the CDK2lnc path was absent in p21 knockout (CDKN1A−/−) cells (Extended Data Fig. 4e). We further induced exogenous DNA double-stranded breaks in S or G2 phase using a 20-min pulse of neocarzinostatin (NCS), and confirmed that added DNA damage leads to a checkpoint-mediated delay that increases the duration of the S/G2/M phase13 (Extended Data Fig. 4f). Notably, the added DNA damage in mother cells also suppressed the CDK2inc path in daughter cells (Fig. 2d and Extended Data Fig. 4g). Taken together, these experiments argue for a causal link from DNA damage and p53 signalling in mother cells to CDK2 path selection in daughter cells.
We next asked whether residual DNA damage in daughter cells14 suppresses the CDK2inc path as previously proposed15,16. We measured phosphorylated histone H2AX (γH2AX) and 53BP1 puncta as markers for DNA damage (Extended Data Fig. 5a–d) and pursued several lines of investigation to test this hypothesis. By fixing cells at the end of live-cell experiments and mapping each fixed cell back to its own live-cell trace, we detected γH2AX puncta primarily before mitosis but not in the G0/G1 phase of daughter cells that had passed through mitosis (Fig. 2e). In addition, a pulse of NCS in mother cells significantly increased both γH2AX and 53BP1 puncta before but not after mitosis (Fig. 2e). To compare γH2AX signals between CDK2inc and CDK2low cells, we classified daughter cells by CDK2 paths starting 2 h after mitosis (Extended Data Fig. 5e). The time course of γH2AX signals showed similarly low levels of y H2AX for both CDK2 paths, with an expected increase in γH2AX puncta in CDK2inc cells during the S phase (Extended Data Fig. 5f). To further classify cells immediately after mitosis, we used a marker that distinguished hypo- and hyper-phosphorylated Rb protein (hypo- and hyper-Rb; Ser807/811), corresponding to active and inactive E2F transcription (Extended Data Fig. 5g, h). Both γH2AX and 53BP1 puncta between hypo- and hyper-Rb cells were not significantly different in G0/G1 phase at different times after mitosis, even in cells that received an NCS pulse in mother cells (Fig. 2f and Extended Data Fig. 5i, j). Moreover, inhibition of the DNA damage sensors ATR (ATM- and Rad3-related), ATM (ataxia-telangiectasia mutated) or DNA-PK (DNA-dependent protein kinase) in early G0/G1 did not result in an increase in CDK2inc path selection (Extended Data Fig. 6a). Finally, kinetic measurements of p21 in G0/G1 of MCF7 cells in response to an NCS pulse showed a 3 h delay between the pulse and the resulting increase in p21 (Extended Data Fig. 6b), further arguing against a direct role of residual DNA damage after mitosis in acutely regulating the expression of p21 and regulating CDK2inc path selection. Taken together, these experiments suggest that a DNA damage signalling response rather than DNA damage itself persists through mitosis to suppress CDK4, Rb-E2F and the CDK2inc path.
The convergence of p53 and ERK signalling onto the same cell-fate decision raised the intriguing question of whether mitogen and stress signalling compete directly. To test this hypothesis, we measured CDK2 activity in MCF10A cells after titration of mitogen and DNA damage stimuli. Titration of NCS pulses and of mitogen levels had opposing and graded effects on cell-cycle entry in daughter cells (Fig. 3a, b). Notably, higher mitogen levels reversed the effect of an NCS pulse in mother cells on the CDK2 paths of daughter cells (Fig. 3c). We observed a similar compensatory effect against a G2-phase NCS pulse when we incubated cells with different mitogen levels only in mother cells (Fig. 3d and Extended Data Fig. 7a). Thus, mitogen and DNA damage-mediated p53 signalling in G2 compete to control the Cdk2inc and Cdk2low paths of daughter cells.
Figure 3 |. DNA damage-induced p53 activation and mitogen/ERK signalling in mother cells directly compete to control CDK2inc path selection.
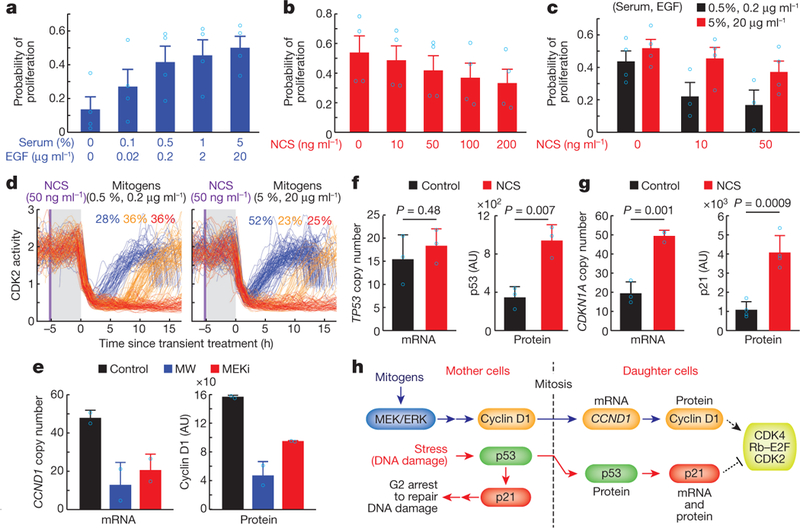
a-c, Probability of proliferation (CDK2 activity > 1, 10 h after mitosis). Cells were exposed to different concentrations of mitogens and NCS (20-min pulse in mother cells), as indicated. Data are mean ± s.e.m. (n = 4 biological replicates). d, CDK2 activity traces of cells exposed to a 20-min NCS pulse (marked in purple) followed by a 5-h incubation of different concentration of mitogens (marked in grey) and subsequent replacement with full growth media. Cells undergoing mitosis within 1 h after the replacement of full growth media were selected. e, CCND1 mRNA (left) and nuclear cyclin D1 protein (right) levels in response to mitogen withdrawal (MW) and MEK inhibition. Data are mean ± s.d. (n = 2 biological replicates). f, g, TP53 mRNA (f, left) and p53 nuclear protein (f, right) levels and CDKN1A mRNA (g, left) and nuclear p21 protein (g, right) levels in response to a 20-min NCS pulse (200 ng ml−1) in mother cells. Data are mean ± s.d. (p53 mRNA and protein; n = 3, CDKN1A mRNA; n = 3, p21 protein; n = 4 biological replicates). P values were calculated by unpaired two-tailed t-tests. h, Proposed model of mitogen and stress signal transduction from mother to daughter cells.
To investigate the competition mechanism, we used live-cell imaging to select daughter cells in which mitogen signalling was inhibited for 5 h during the late G2 and M phases of mother cells, and then performed immunostaining or RNA fluorescence in siiu hybridization (FISH) in the G0/G1 phase of daughter cells to measure protein or mRNA levels, respectively (Extended Data Fig. 7b). Consistent with a separation of the two pathways, we found that mitogen withdrawal and MEK inhibition reduced levels of hyper-Rb as well as cyclin D1 mRNA (CCND1) and protein without altering p21 mRNA (CDKN1A) or protein levels in daughter cells (Fig. 3e and Extended Data Fig. 7c–e). Since cyclin D1 protein is short-lived and the half-life of CCND1 mRNA is over 3 h (Extended Data Fig. 7f, g), this suggests that CCND1 mRNA is a likely mediator of the long-lasting effect of mitogen signalling in mother cells that regulates the CDK2inc path of daughter cells. To investigate which mediator may transmit DNA damage signals, we applied an NCS pulse in mother cells and observed a reduction in levels of hyper-Rb as well as increased levels of p53 protein and p21 mRNA (CDKN1A) and protein, while we observed no change in p53 (TP53) and CCND1 mRNA levels in daughter cells (Fig. 3f, g and Extended Data Fig. 8a-d). We further found that p53 protein probably mediates the transmission of DNA damage signalling in mother cells to daughter cells, as the half-life of p21 (CDKN1A) mRNA and protein was short (approximately 1 h) and the half-life of p53 protein was greatly increased to over 7 h when cells experienced DNA damage17 (Extended Data Fig. 8e–g). Using siRNA knockdown and the dihydrofolate reductase (DHFR) and trimethoprim (TMP) protein stabilization system18 to reduce and increase protein expression levels, respectively, we also directly confirmed that cyclin D1 promotes and p21 inhibits proliferation (Extended Data Fig. 9). Together, these results suggest that variable mitogen and DNA damage signalling in mother cells mediate sustained increases in CCND1 mRNA and p53 protein across mitosis (Fig. 3h) to regulate short-lived cyclin D1 and p21 protein levels, which in turn regulate CDK2inc path selection in daughter cells. Mitogen and stress signalling originating in daughter cells then continue to regulate cyclin D1 and p21 levels and the path selection between CDK2delay and CDK2low during G0 and G1 phases (Fig. 1e and Extended Data Fig. 3d).
We next determined how variable expression levels of cyclin D1 and p21 control the bimodal phosphorylation of Rb and CDK2 path selection. As expected, high levels of p53 and p21 were closely correlated with the CDK2low path (Fig. 4a, b). Contrary to expectations, nuclear cyclin D1 levels were higher in CDK2low than in CDK2inc cells (Fig. 4c). However, p21 has been shown to mediate both the nuclear import19,20 and stabilization21,22 of cyclin D1 protein, suggesting that higher levels of cyclin D1 observed in CDK2low cells might be an indirect effect of high p21 levels. As has been proposed previously21, it could be the relative level of cyclin D1 compared to p21 that controls CDK4 and E2F activation. To test for a potential stoichiometric relationship between cyclin D1 and p21, we calibrated antibodies against cyclin D1 and p21 by constructing an siRNA-resistant cyclin D1-p21 fusion construct that allowed us to normalize the respective two immunofluorescence intensities in cells lacking endogenous cyclin D1 and p21 (Fig. 4d and Methods). We first confirmed that the relative levels of cyclin D1 are higher than that ofp21 in CDK2mc cells (Extended Data Fig. 10a). We then measured levels of cyclin D1 and p21 and determined whether a cell is in the hypo- or hyper-Rb state (Extended Data Fig. 10b, c). Notably, cells in G0/G1 were only hyper-Rb when they had a stoichiometric excess of cyclin D1 over p21 protein, while almost none were hyper-Rb when cyclin D1 levels were lower than that of p21 in MCF10A as well as in HUVEC (endothelial cells), RPE1 (epithelial cells) and HS68 (foreskin fibroblasts) cells (Fig. 4e and Extended Data Fig. 10d). Finally, we confirmed that CDK2inc and CDK2low cells had almost exclusively hyper-Rb and hypo-Rb, respectively (Fig. 4f), arguing that CDK4 activation, Rb-regulated E2F induction, and CDK2 activation represent a closely linked bifurcation in cell fate that is controlled by whether or not the cyclin D1/p21 ratio is greater than 1.
Figure 4 |. Daughter cells decide between continued proliferation and exit to quiescence by ultrasensitive control of cyclin D1 and CDK4 activation by p21-mediated stoichiometric inhibition.
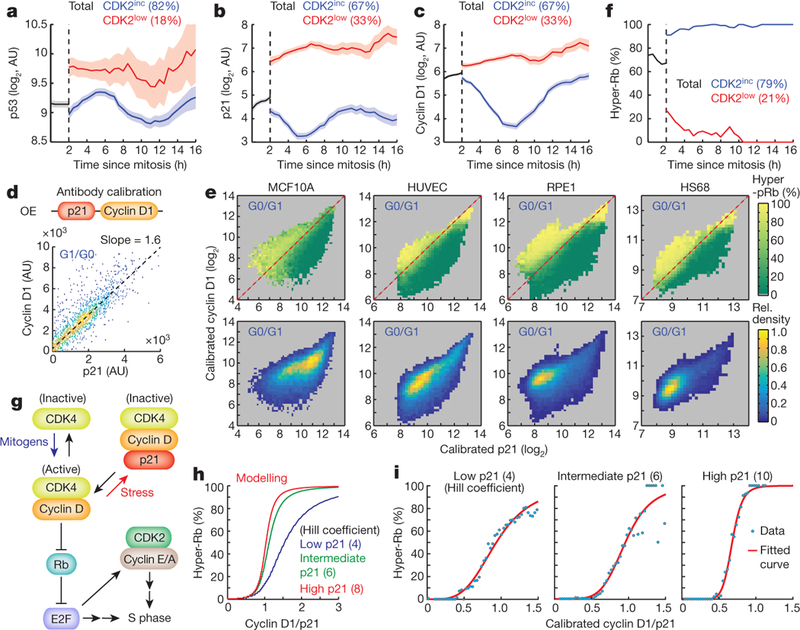
a-c, Time- course analysis comparing CDK2inc and CDK2low cells showing relative concentrations of nuclear p53 (a), nuclear p21 (b), and nuclear cyclin D1 (c) protein as a function of time after mitosis. Data are mean ± 95% confidence intervals (p53, n = 43,212 cells; p21 and cyclin D1, n = 5,670 cells). d, Scatter plot of nuclear cyclin D1 and p21 for antibody calibration. OE indicates overexpression. e, Top, three-dimensional activity analysis, showing the percentage of cells with hyper-Rb (Ser807/S811) at a given concentration of nuclear cyclin D1 versus p21 in MCF10A, HUVEC, RPE1 and HS68 cell lines. Bottom, corresponding cell densities. Red dashed line marks equal absolute concentrations of p21 and cyclin D1. f, Percentage of hyper-Rb (Ser807/S811) as a function of time after mitosis. Data are mean ± 95% confidence intervals (n = 2,387 cells). g, Proposed model of the initiation of CDK4 activation and hyper-Rb when cyclin D1 levels stoichiometrically exceed p21 levels. h, i, Percentage of hyper-Rb at increasing levels of the cyclin D1/p21 ratio, at low, intermediate and high concentrations of the stoichiometric inhibitor p21. Modelling (h) and experimental data (i) in HS68 cells are shown, selecting intermediate (twofold) and high (fivefold) p21 levels relative to the low p21 level, respectively.
We considered that the steep concentration dependence between the cyclin D1/p21 ratio and hyper-Rb might be the result of cyclin D1 binding and activating CDK4, with p21 functioning as a stoichiometric inhibitor that binds cyclin D1-CKD4 complexes and suppresses CDK4 activity (Fig. 4g). Such a stoichiometric inhibition mechanism predicts ultrasensitive activation of CDK4 if p21 has high affinity for cyclin D1-CDK4 complexes23. Our model calculations showed a steep increase in ultrasensitivity when the concentration of p21 is increased (Fig. 4h). Consistent with the model predictions, our experimental data showed strong ultrasensitivity in the stoichiometric regulation of CDK4 by cyclin D1 and p21, with a Hill coefficient that increased from 4 to 10 over a fivefold increase in the level of p21 (Fig. 4i). This is likely to be a general regulatory principle for CDK4 activation as we found the same increased ultrasensitivity with p21 concentration in other cell types (Extended Data Fig. 10e). Thus, E2F induction and CDK2 path selection are controlled by ultrasensitive activation of CDK4 resulting from stress-regulated p21 stoichiometrically inhibiting mitogenregulated cyclin D1-CDK4.
Together, our study argues for a proliferation control system based on (i) natural variation in stress and mitogen signalling in mother cells; (ii) memories of both signals lasting through mitosis to daughter cells; and (iii) molecular competition between stress and mitogen signalling in daughters. This control system selectively promotes proliferation of daughter cells which have experienced lower DNA damage stress and higher mitogen signalling in mother cells. In a situation in which organisms need to generate a fixed number of new cells, for example, during wound healing, a selection mechanism based on relative lower previous stress can maximize the health of newly generated cells. Finally, cancer progression may rely on mutations that reduce this protective molecular competition between cyclin D1 and p21, since many of the upstream regulators of cyclin D1 and p21, such as RAS and p53, respectively, are among the most prominent oncogenes and tumour suppressors in human cancers24.
METHODS
No statistical methods were used to predetermine sample size. The experiments were not randomized and the investigators were not blinded to allocation during experiments and outcome assessment.
Cell culture.
MCF10A cells (ATCC, CRL-10317) were cultured in phenol redfree DMEM/F12 (Invitrogen) supplemented with 5% horse serum, 20 μg ml−1 EGF, 10 μg ml−1 insulin, 0.5 μg ml−1 hydrocortisone, 100 ng ml−1 cholera toxin, 50 U ml−1 penicillin, and 50 μg ml−1 streptomycin. For mitogen withdrawal experiments, cells were washed three times and then incubated with GM-GFS medium (DMEM/F12 supplemented with 0.3% BSA, 0.5 μg ml−1 hydrocortisone, 100 ng ml−1 cholera toxin, 50 U ml−1 penicillin, and 50 μg ml−1 streptomycin). HUVEC cells (Lonza, C2519A) were cultured in EGM2 (Lonza) supplemented with the bullet kit (Lonza). RPE1 cells (ATCC, CRL-4000) were cultured in phenol red-free DMEM/F12 (Invitrogen) supplemented with 10% fetal bovine serum and 0.01 mg ml−1 hygromycin B (Invitrogen). HS68 cells (ATCC, CRL-1635) were cultured in DMEM (Invitrogen) supplemented with 10% fetal bovine serum. MCF7 cells (ATCC, HTB-22) were culture in RPMI-1640 (Invitrogen) supplemented with 10% fetal bovine serum. These cell lines were used without further authentication. All cell lines tested negative for mycoplasma.
Antibodies and reagents.
PD0325901and palbociclib were obtained from Selleckchem. Nutlin-3, tenovin-6, KU-60019, AZ-20, and NU-7441 were from Cayman. Rabbit anti-phospho-Rb (Ser807/811) (8516), rabbit anti-phospho-Rb (Ser807/811) pre-conjugated with Alexa 647 (8974), rabbit anti-p21 (2947), rabbit anti-p53 (2527), rabbit anti-53BP1 (4937) and rabbit anti-phospho-H2AX (9718) were from Cell Signaling Technology. Mouse anti-p21 (556430) was from BD Pharmingen, mouse anti-phospho-H2AX (05–636) was from EMD Millipore, and rabbit anti-cyclin D1 (RM-9104-S0) was from Thermo Scientific. Actinomycin D, cycloheximide and NCS were from Sigma-Aldrich.
Constructs and stable cell lines.
pPBbsr2-EKAR-NLS, pCSII-histone 2B (H2B)-mTurquoise, pCru5-DHFR-mCherry-p21, and pCSII-DHB (amino acids 994–1087)-mVenus or mCherry were described previously2,7. For pLenti-p21-cyclinD1-IRES-mTurquoise, siRNA-resistant p21 and cyclin D1 were synthesized and cloned into -mTurquoise using Gibson cloning. Geminin (amino acids 1–110)25 fused to mCherry was cloned into pLenti-IRES-puro. pCru5-DHFR-mCherry-cyclin D1 was cloned into pCru5-IRES-puro. To generate stable cell lines, construct containing ERK sensor within the piggyback transposon was introduced into cells by FugeneHD (Promega) and integrated using the piggyback transposase26. Lentiviral constructs were introduced into cells by viral transduction.
Odds ratio analysis.
Odds ratios were calculated based on averaged ERK activity measured in G2 phase (−6.5 to −1 h relative to mitosis). Integrated ERK activity during this time window was rank ordered in 10% bins. CDK2 activity was measured 10 h after mitosis for each cell in the 10 groups of cells for each ranked ERK activity bin. The fraction of cells in each of the 10 bins with a CDK2 activity > 1, 10 h after mitosis (mostly CDK2mc cells) was then measured. The fractional parameter (fraction of cells that re-enter the cell cycle for a given relative ERK activity in mother cells) is defined as F(erk); erk is the bin parameter (from 1 to 10).
An odds ratio of 1 is random. The reason for the odds ratio limit of 1:8 and 8:1 in the figure is the high probability that pairs of daughter cells take the same path 91% of the time when pairs of daughters from different mothers take the same path only 56% of the time (Extended Data Fig. 3f). This limits the odds ratio to 8:1 for the prediction by mother cells since daughter cells will occasionally experience variable signals that sets them on different paths.
Immunofluorescence.
Cells were fixed by adding 4% paraformaldehyde at a ratio of 1:1 to culture medium (final 2% paraformaldehyde) for 15 min. Then, cells were washed three times in PBS, followed by incubation in permeabilization/ blocking buffer with 0.1% Triton X-100, 10% FBS, 1% BSA and 0.01% NaN3 for 1 h, and stained overnight at 4 °C with primary antibodies. Primary antibodies were visualized using a secondary antibody conjugated to Alexa Fluor-555, Alexa Fluor-568 and Alexa Fluor-647. For EdU staining, cells were treated with 10 μM EdU for 15 min and fixed and processed according to manufacturer’s instructions (Invitrogen, C10356).
RNA FISH and analysis.
RNA in situ hybridization was carried out using the Affymetrix Quantigene ViewRNA ISH cell assay as specified in the user manual. Custom probes were designed to target E2F1, TP53, CDKN1A and CCND1. In brief, cells were plated in a 96-well glass plate (Cellvis P96–1.5H-N) that was prehybridized with collagen (Advanced BioMatrix, 5005-B) 1:100 in PBS overnight. At the time of fixing, cells were fixed with 4% paraformaldehyde for 15 min and dehydrated overnight using 75% ethanol. After rehydration in PBS for 10 min, the cells were permeabilized with 0.2% Triton X-100 for 15 min at room temperature, and then treated for probe hybridization, amplification, and labelling with Alexa Fluor 555. Cells were then incubated with Hoechst (1:10,000 in PBS) for 10 min, washed three times with PBS, and left in PBS for imaging. For the cases in which immunofluorescence was to be additionally performed, after imaging the FISH signal, cells were incubated with the ViewRNA wash buffer as specified in the user manual to remove the probes and allow for measurement of other fluorophores with a Texas Red filter cube. For RNA FISH measurements, cells were segmented for their whole cell regions by using an area that encompasses the nucleus and reaches out as far as 50 μm outside of the nuclear mask while preventing overlap with neighbouring cells. A mask of FISH puncta was generated by top hat-filtering raw images with a circular kernel of radius 4 μm and thresholding absolute intensity. The RNA puncta parameter represents an average of the number of pixels in whole cell regions.
siRNA transfection.
siRNA was transfected into MCF10A cells using Dharmafect 3 (Thermo Scientific) according to the manufacturer’s instructions. The following siRNAs were used: control (Dharmacon, D-001206–14-05), p53 (Dharmacon, LU-003329–00-0002), p21 (Dharmacon, L-003471–00-0005), cyclin D1 (Dharmacon, M-003210–05-0005), cyclin D2 (Dharmacon, LU-003211–00-0002), and cyclin D3 (Dharmacon, MU-003212–02-0002) siRNA pools at final concentration of 20 nM. 6 h after transfection, cells were washed with full growth medium and then imaging was immediately started. Cells were only considered if they went through one mitosis within the imaging period.
Cyclin D1 and p21 antibody calibration.
After knocking down endogenous cyclin D1 and p21, MCF10A cells stably expressing siRNA-resistant cyclin D1-p21-IRES- mTurquoise were selected using mTurquoise expression for the analysis. Plain MCF10A cells (mTurquoise-negative cells) were used for background subtraction.
Modelling.
We calculated the steepness of CDK4 activation by cyclin D1 assuming that p21 functions as a stoichiometric inhibitor of the cyclin D1-CDK4 complex. Free CDK4, cyclin D1 and p21, are represented as CDK4, cycD and p21. Total CDK4 in the equation is CDK4tot, total cyclin D1 is cycDtot, total p21 is p21tot, active CDK4-cyclin D1 is CDK4_cycD, and inactivated CDK4-cyclin D1-p21 is CDK4_cycD_p21, as shown schematically in Fig. 4g. The calculations are based on equilibrium binding:
| (1) |
The activation step of CDK4 can be described as :
| (2) |
The inactivation step of CDK4 and cyclin D complex can be described as:
| (3) |
| (4) |
Using equation (4), we eliminate the variable ‘CDK4_cycD_p21’ in equation (2) yielding:
| (5) |
Since p21 increased the affinity between cyclin D and CDK4 by about 35 times19, we set K2 to be 35 times smaller than K1. We also assume that the phosphorylation of Rb cooperatively increases with CDK4 activity and used (equation 5) to generate the plots in Fig. 4h (cooperativity of 2 between CDK4_cycD and the triggering of Rb hyperphosphorylation).
Image analysis.
We developed a custom MATLAB pipeline for analysed image data as described below.
Segmentation.
The nuclei of cells were segmented, either by using Hoechst staining for fixed-cell imaging or ERKAR-NLS or H2B-mTurquoise for livecell imaging. For DHB-mVenus measurements, cells were segmented for their cytoplasmic regions by spatially approximating a ring with an inner radius 2 μm outside of the nuclear mask and an outer radius a maximum of 10 μm outside the nuclear mask. Regions within 10 μm of another nucleus were excluded. Regions with pixel intensities indistinguishable from background (discussed below) were also excluded.
Signal measurement.
For each channel, global background subtraction was used to measure all immunofluorescence and fluorescent protein intensities as follows: the nuclear mask was dilated by 50 μm and the background for the image was calculated as the median pixel intensity of all non-masked pixels. DNA content was calculated as integrated nuclear Hoechst intensity. The EdU signal was calculated as the mean nuclear EdU intensity. Nuclear DHB-mVenus immunfluorescence signals were calculated as median nuclear intensity, as the signal was often excluded from the nucleoli. Cytoplasmic DHB-mVenus signals were calculated as the median intensity within the cytoplasmic ring. DHB-mVenus translocation was calculated as the ratio of cytoplasmic signal over the nuclear signal. Throughout this study, CDK2 activity refers to DHB-mVenus translocation. For nuclear γH2AX puncta measurement, a foreground mask of γH2AX puncta was generated by top hat-filtering the raw image with a circular kernel of radius 4 μm and thresholding on absolute intensity. γH2AX puncta was calculated as the number of foreground pixels within a given nucleus region.
Tracking.
The deflection-bridging algorithm was implemented to perform tracking of cells between live-cell frames as well as between the final live-cell frame and subsequent fixed-cell image.
Extended Data
Extended Data Figure 1 |. ERK activity in G2 and G0/G1 regulates CDK2inc and CDK2delay paths, respectively.
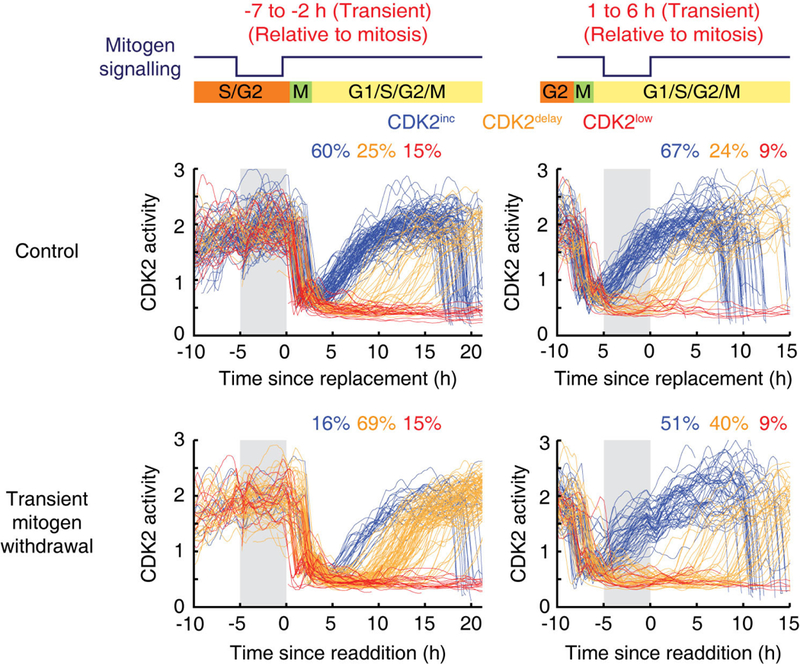
Single-cell CDK2 activity traces. Cells were selected if mitogens were transiently withdrawn for a 5 h period (marked in grey) ending 1–3 h before mitosis for G2 (left) or for a 5 h period starting 0–2 h after mitosis for G1 (right).
Extended Data Figure 2 |. Characterization of ERK sensor and classification of CDK2 paths.
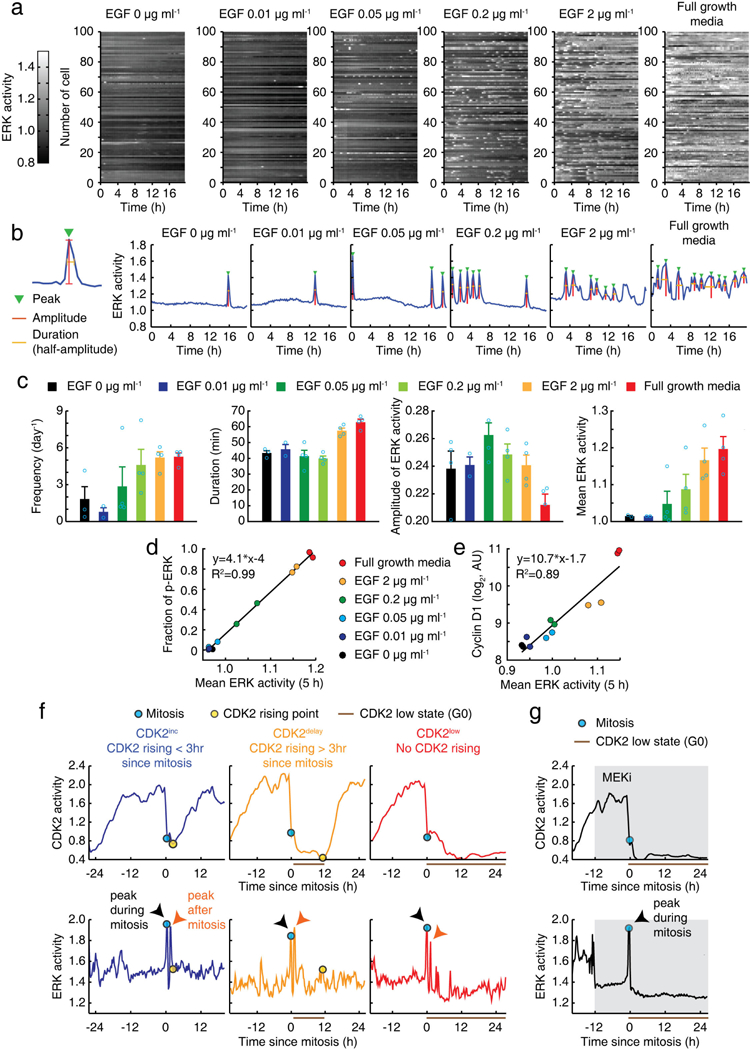
a, Representation of ERK activity time courses at different concentrations of mitogens. b, Examples of single-cell time courses of ERK activity. Automatic detection of indicated features of ERK activity. c, Averaged ERK features shown in b. MCF10A cells expressing ERK sensor were monitored for more than 18 h. Data are mean ± s.e.m. (n = 4 biological replicates). d, e, Correlation between ERK activity, integrated over 5 h, and the fraction of nuclear ERK phosphorylation (d) or the levels of nuclear cyclin D1 protein (e). f, Examples of CDK2 and ERK single-cell traces classified by CDK2 paths. g, Single-cell traces of CDK2 and ERK activity in response to inhibition of MEK (PD0325901; 100 nM) showing that a peak of ERK activation during mitosis was not suppressed by MEK inhibition.
Extended Data Figure 3 |. ERK activity in G2 partially predicts CDK2 paths in daughter cells.
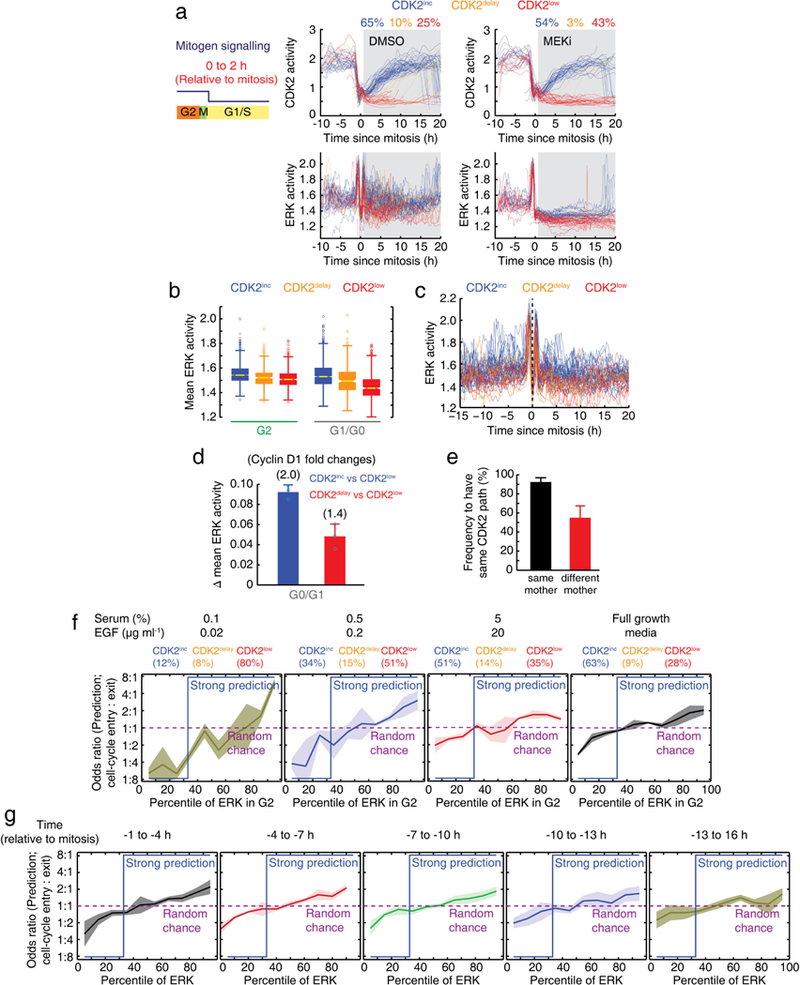
a, Single-cell traces of CDK2 and ERK activities. Mitogens were withdrawn 0–2 h after mitosis. b, Box plot of mean ERK activity during the G2 or G0/G1 phases based on CDK2 classification. The higher ERK activity in CDK2delay cells during G0/G1 compared to CDK2low cells suggests that ERK activity in G0/G1 regulates the delayed entry into the cell cycle. Yellow lines indicate the median, boxes denote the 25th and 75th percentiles, lines denote the total range for each population (n = 2,896 cells). c, Examples ofERK single-cell traces classified by CDK2 paths in daughter cells. d, Bar graph of differences in integrated ERK activity during the G0/G1 phases based on CDK2 classification. Corresponding fold changes in cyclin D1 were calculated based on Extended Data Fig. 2e. Data are mean ± s.d. (n = 3 biological replicates). e, Analysis of the fraction of daughter pairs from the same and different mothers that have the same CDK2 path. Data are mean ± s.d. (n= 24 wells (each well; n >100 cells)). f, g, Odds ratio analysis showing how well the percentile of ERK activity in G2 for varying mitogen availability (f) and temporal proximity to mitosis (g) predicts cell-cycle entry in daughter cells. Strong prediction values are shown in blue, and random chance is marked as a purple dashed line. Data are mean ± s.d. (n = 3 (f) and n = 2 (g) biological replicates).
Extended Data Figure 4 |. p53 signalling in mother cells controls the CDK2inc path in daughter cells through p21.
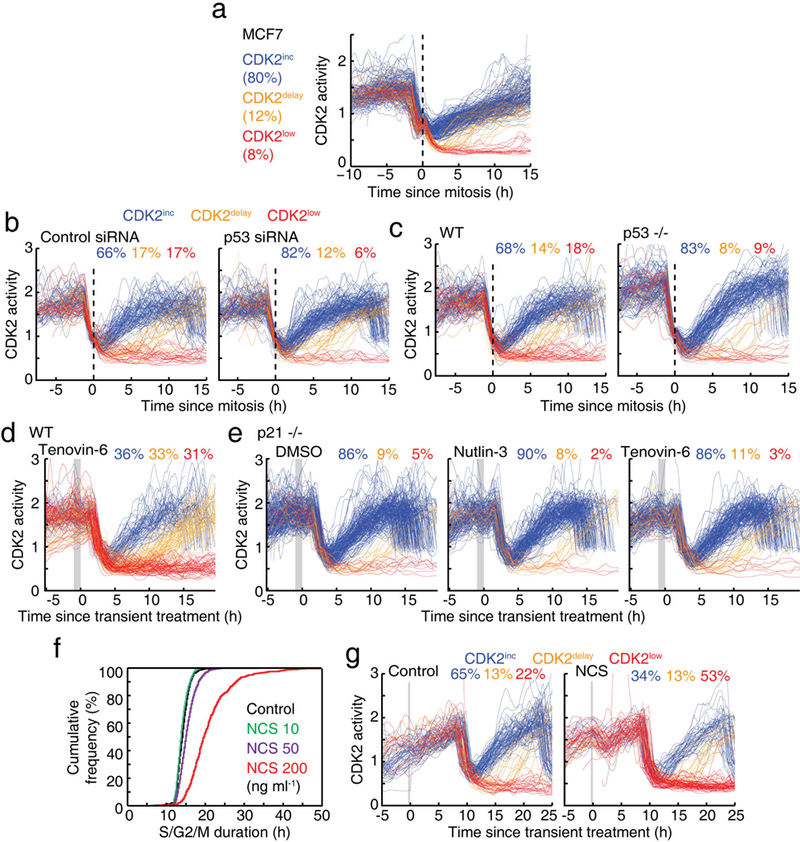
a, Single-cell CDK2 activity traces aligned to the time of mitosis in MCF7 cells. b, c, CDK2 activity traces aligned to the time of mitosis after siRNA knockdown of p53 or control siRNA (b) or in wild-type and p53-knockout (TP53−/−) cell lines (c). d, e, CDK2 activity traces of cells exposed to 1 h application of p53 activator (10 μM nutlin-3, 10 μM tenovin-6) 2–3 h before mitosis (marked in grey) in a wild-type cell line (d) or in a p21-knockout (CDKN1A−/−) cell line (e). f, Cumulative distribution functions of S/G2/M duration (time between geminin rising point and mitosis) as a function of the strength of a 20-min NCS pulse. MCF10A cells expressing the Fucci (geminin) reporter were pre-imaged for 13 h, then treated with the indicated concentration of NCS for 20 min and imaged for a further 48 h. Cells were selected when NCS was applied during S/G2 phase (control, n = 645 cells; 10 ng ml−1 NCS, 786 cells; 50 ng ml−1 NCS, 1,314 cells; 200 ng ml−1 NCS, 471 cells). g, Examples of CDK2 activity traces in response to a 20-min NCS pulse (200 ng ml−1) or a control pulse applied 9–11 h before mitosis in Fig. 2d.
Extended Data Figure 5 |. DNA damage after mitosis does not regulate CDK2inc path selection.
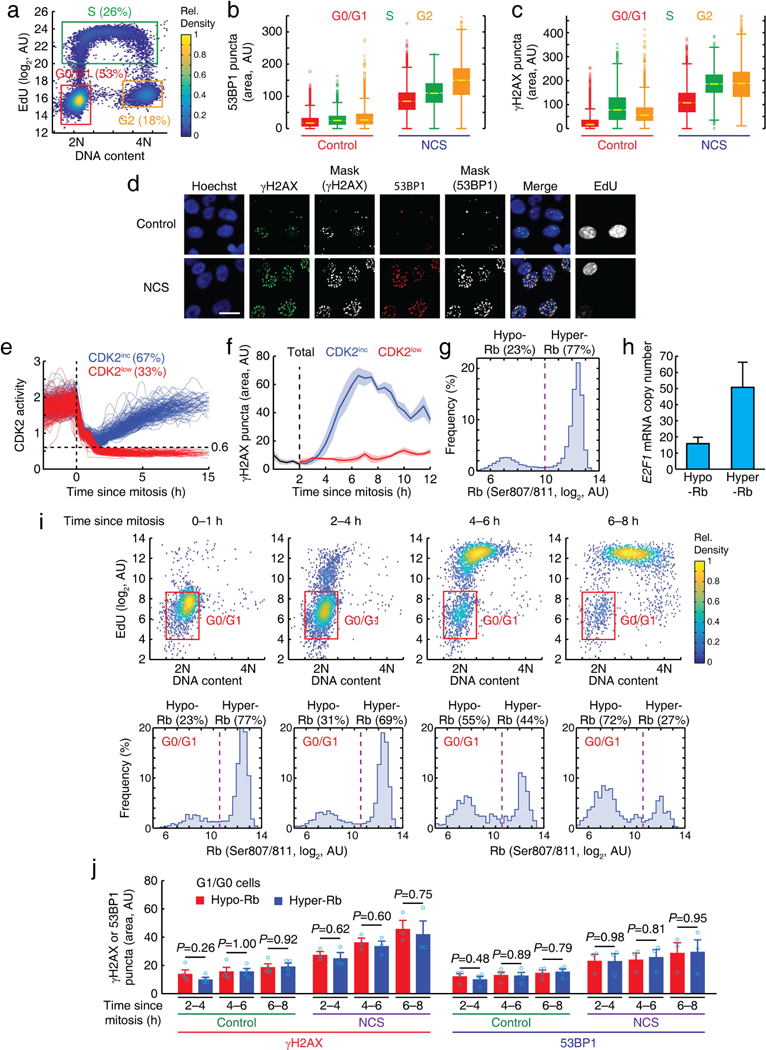
a, An example of cell phase gating using Hoechst and 5-ethynyl-20-deoxyuridine (EdU) staining. b, c, Box plot of nuclear 53BP1 (b) and γH2AX (c) puncta area in different cell-cycle phases with and without addition of a 20-min NCS (200 ng ml−1) pulse 8 h before fixation. Boxes reflect the 25th and 75th percentiles, whiskers denote the total range (53BP1; n > 2,800, γH2AX; n > 3,000 cells for each condition). d, Representative images of γH2AX and 53BP1 staining 8 h after a pulse of NCS (200 ng ml−1) for 20 min. Scale bar, 20 μm. e, Classification of CDK2inc and CDK2low cells after mitosis. f, Plot of nuclear γH2AX puncta area as a function of time relative to mitosis in unperturbed cells. Data are mean ± s.e.m. (n = 4 biological replicates). g, Histogram of nuclear Rb (Ser807/S811) intensity. h, Comparison of the E2F1 mRNA abundance by nuclear Rb (Ser807/S811) status (E2F1 is an E2F target). Data are mean ± s.d. (n = 10wells (each well; n > 500 cells)). i, After selecting cells based on time since mitosis, G0/G1 cells were gated using Hoechst and EdU staining (top), and then cells in G0/G1 were further classified into hypo- or hyper-Rb population (bottom). j, Bar graph of nuclear yH2AX and 53BP1 puncta area. Data are mean ± s.e.m. (control; n = 4, NCS; n = 3 biological replicates). P values were calculated by unpaired two-tailed t-tests.
Extended Data Figure 6 |. Inhibition of the DNA-damage sensing ATM, ATR and DNA-PK kinases in daughter cells does not regulate CDK2inc path selection.
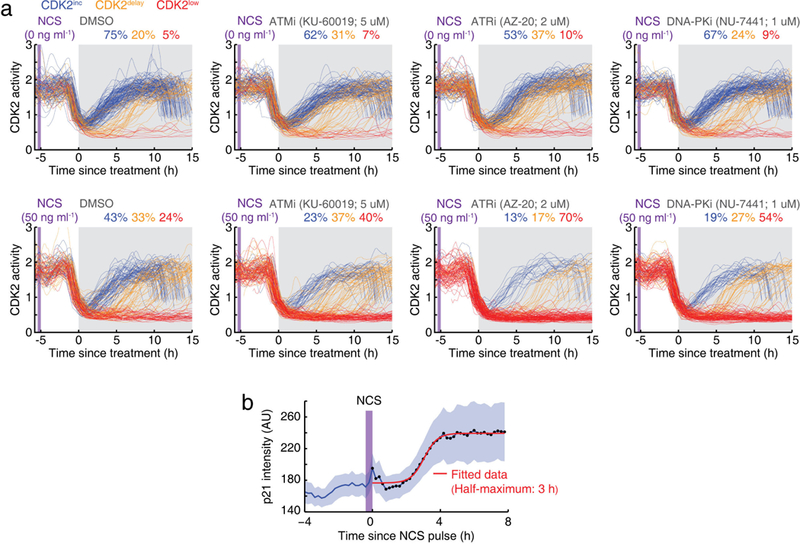
a, CDK2 activity traces of cells exposed to inhibitors of ATM (5 μM KU-60019), ATR (2 μM AZ-20), and DNA-PK (1 μM NU-7441) (marked in grey), starting 5 h after a control pulse or a 20-min NCS pulse (marked in purple). Cells undergoing mitosis within 1 h before drug treatment were selected for analysis. b, Averaged p21 intensity traces in response to a 20-min NCS pulse (200 ng ml−1) in MCF7 cells. Cells were selected for which NCS was applied during a 4-h time window after mitosis. Data are mean ± 95% confidence intervals (n = 79 cells).
Extended Data Figure 7 |. CCND1 mRNA transduces mitogen signalling from mother to daughter cells.
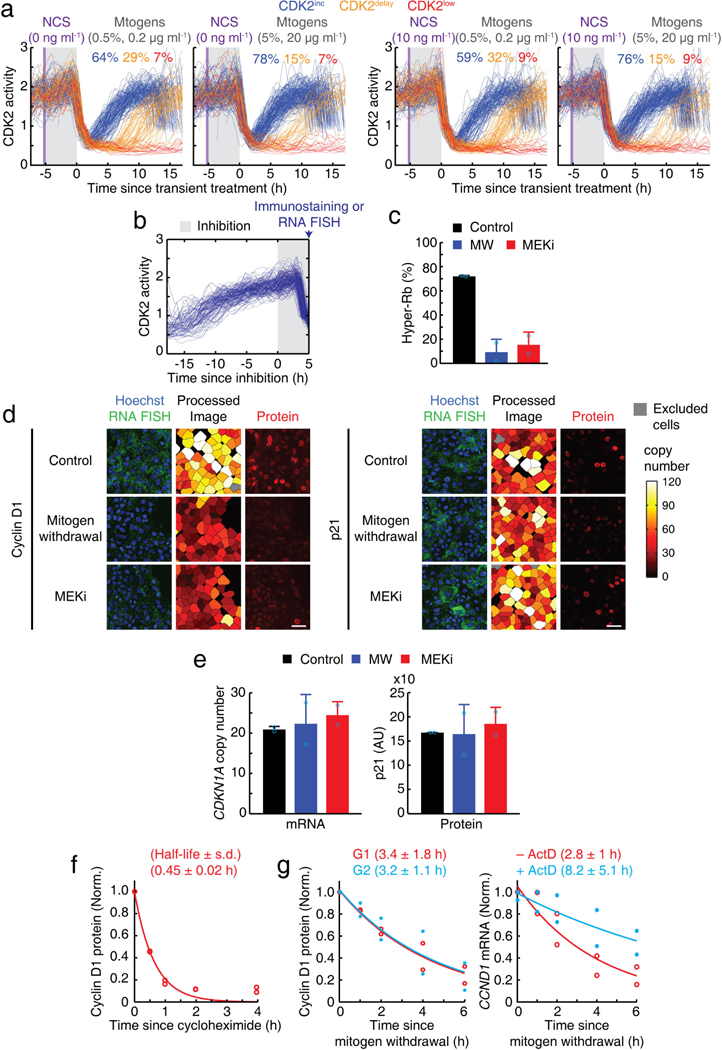
a, Control and additional experiments to Fig. 3d. CDK2 activity traces of cells exposed to a control pulse or a 20-min NCS pulse (10 ng ml−1, marked in purple), followed by a 5-h incubation in different concentrations of mitogens (marked in grey). After the 5-h incubation, cells were replenished with full growth media. Cells undergoing mitosis within 1 h of replacement with full growth media were selected. b, Individual traces of CDK2 activity showing the time window when mitogens were withdrawn or MEK inhibited (100 nM PD0325901) for 5 h until cells were fixed (marked in grey). Cells that were fixed during the first 2 h after mitosis were selected. c, Percentage of hyper-Rb (Ser807/ S811) in response to mitogen withdrawal and MEK inhibition. Data are mean ± s.d. (n = 2 biological replicates). d, Representative images of mRNA and protein levels of cyclin D1 (CCND1) and p21 (CDKN1A) after a 5-h period of mitogen withdrawal or MEK inhibition. Scale bar, 50 μm. e, mRNA and nuclear protein levels of p21 in response to mitogen withdrawal and MEK inhibition. Data are mean ± s.d. (n = 2 biological replicates). f, Expression level of nuclear cyclin D1 protein, normalized by initial level (time 0 h), in response to the translation inhibitor, cycloheximide (10 μg ml−1) (n = 2 biological replicates). g, Cyclin D1 protein (left) and mRNA (CCND1; right) levels, normalized by initial level (time 0 h), after mitogen withdrawal. The half-life of CCND1 mRNA was measured with or without the transcription inhibitor actinomycin D (ActD; 5 μg ml−1) (n = 2 biological replicates).
Extended Data Figure 8 |. p53 protein transduces stress signalling from mother to daughter cells.
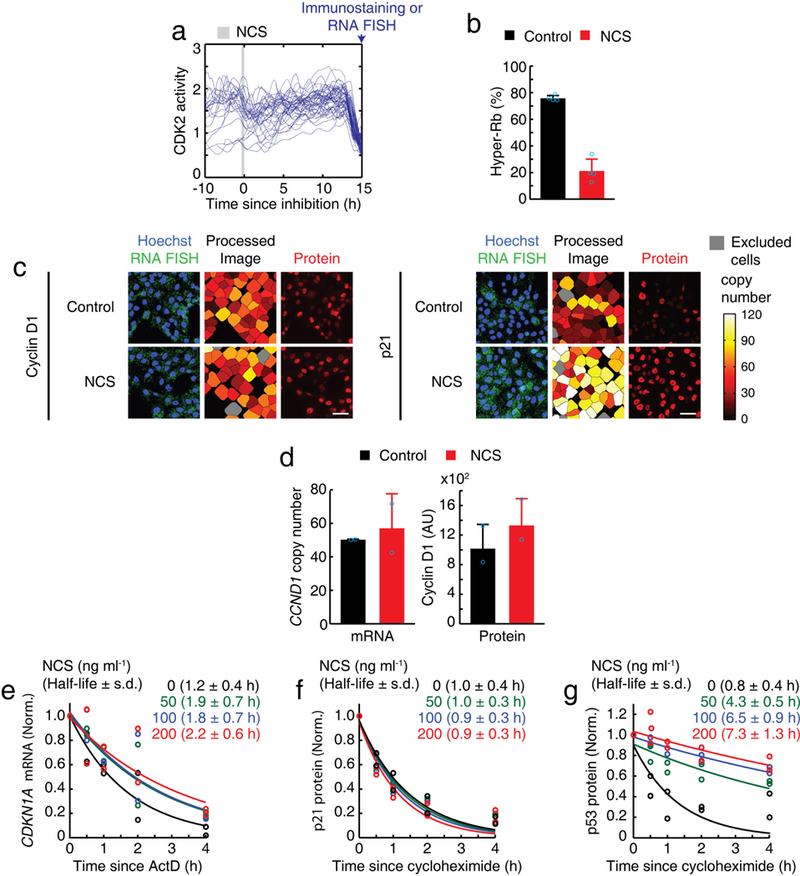
a, Individual traces of CDK2 activity showing the time window when a 20-min NCS pulse (200 ng ml−1) (marked in grey) was applied to mother cells. Cells that were fixed during the first 2 h after mitosis were selected. b, Percentage of hyper-Rb (Ser807/S811). Data are mean ± s.d. (n = 4 biological replicates). c, Representative images of cyclin D1 (CCND1) mRNA and protein levels, and p21 (CDKN1A) mRNA and protein levels after a 20-min pulse of NCS. Scale bar, 50 μm. d, mRNA and nuclear protein levels of cyclin D1 in G1 phase after exposure of mother cells to a 20-min pulse of NCS (200 ng ml−1). Data are mean ± s.d. (n = 2 biological replicates). e-g, Expression levels of nuclear p21 (CDKN1A) mRNA (e) and protein (f), and p53 protein (g), normalized by initial level (time 0 h). Cells were treated with either cycloheximide (10 μg ml−1) or ActD (5 μg ml−1), within 1 h of the application of the 20-min pulse of the indicated concentration of NCS (n = 2 biological replicates).
Extended Data Figure 9 |. Cyclin D and p21 are opposing regulators of CDK2 path selection.
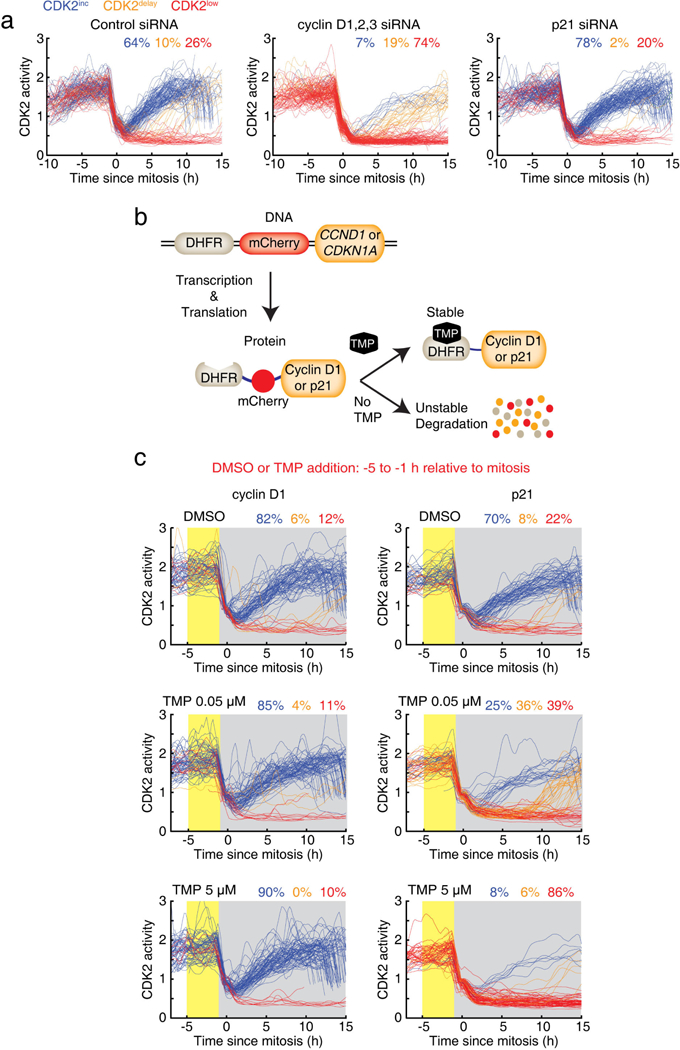
a, Single-cell traces of CDK2 activity after siRNA knockdown of cyclins D1, D2 and D3 (combined), siRNA knockdown of p21, or control siRNA. b, c, Chemical-induced rapid expression of cyclin D1 or p21 controls the CDK2 paths in daughter cells. b, Schematic of chemical-induced DHFR-mCherry-cyclin D1 or DHFR-mCherry-p21 constructs. c, CDK2 activity traces aligned to the time of mitosis. Only cells that were treated with DMSO, 0.05 μM TMP or 5 μM TMP 1–5 h before mitosis (marked in yellow) were selected for plotting. Note that TMP was not washed out (marked in grey).
Extended Data Figure 10 |. Stoichiometric p21-mediated inhibition of cyclin D1-CDK4 is ultrasensitive.
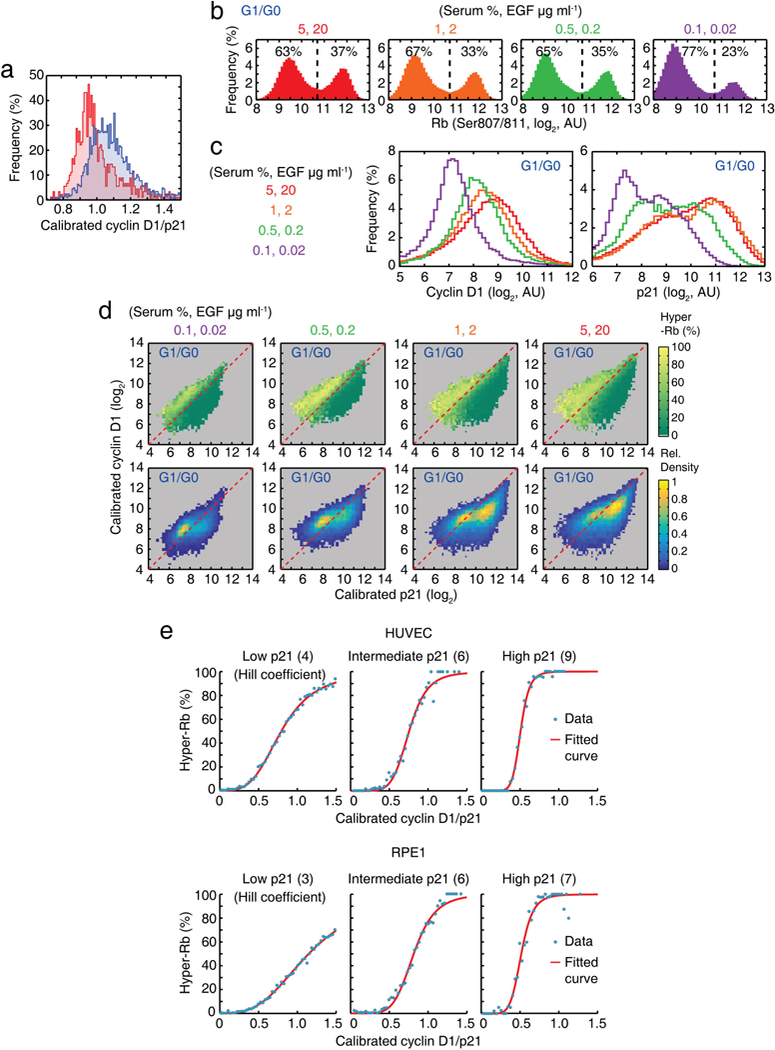
a, Histograms of the calibrated cyclin D1/p21 ratio in CDK2inc and CDK2low cells during a 2–4 h time window after mitosis (CDK2inc; n = 2,162, CDK2low; n = 932 cells). b-d, Histogram of Rb (Ser807/811) (b), histogram of nuclear cyclin D1 and p21 protein (c), and nuclear cyclin D1-p21 map colour-coded by percentage of hyper-Rb (Ser807/811) (d, top) and relative density (d, bottom) after 5 h incubation of the indicated mitogen concentration. e, Percentage of hyper-Rb (Ser807/S811) as a function of the nuclear cyclin D1/p21 ratio at three different fixed concentrations of p21. Intermediate and high p21 levels are twofold and fivefold relative to low p21 level, respectively. The data show a clear increase in ultrasensitivity for higher absolute p21 levels.
Supplementary Material
Acknowledegements
We thank K. Aoki and M. Matsuda for EKAR sensors, J. Stewart-Ornstein and G. Lahav for the p21-and p53-tagged MCF7 cell line, J. Ferrell, K. Cimprich, S. Collins, A. Hayer, S. Cappell, L. Pack, C. Liu, Y. Fan, L. Daigh, A. Jaimovich and S. Spencer for discussions, and the Stanford Shared FACS Facility for cell sorting. This work was supported by the National Research Foundation of Korea (NRF) funded by the Ministry of Education (2013R1A6A3A03025832) and NIGMS R01 grants (GM11837, GM063702 and PGM107615).
Footnotes
Supplementary Information is available in the online version of the paper
Publisher’s note: Springer Nature remains neutral with regard to jurisdictional claims in published maps and institutional affiliations.
Online Content Methods, along with any additional Extended Data display items and Source Data, are available in the online version of the paper; references unique to these sections appear only in the online paper.
Code availability. The code for the image analysis pipeline is available from the corresponding authors upon reasonable request.
Data availability. Source Data are available from the corresponding authors upon reasonable request.
References
- 1.Hsu Y-C, Li L & Fuchs E Transit-amplifying cells orchestrate stem cell activity and tissue regeneration. Cell 157, 935–949 (2014). [DOI] [PMC free article] [PubMed] [Google Scholar]
- 2.Spencer SL et al. The proliferation-quiescence decision is controlled by a bifurcation in CDK2 activity at mitotic exit. Cell 155, 369–383 (2013). [DOI] [PMC free article] [PubMed] [Google Scholar]
- 3.Hitomi M & Stacey DW Cyclin D1 production in cycling cells depends on Ras in a cell-cycle-specific manner. Curr. Biol. 9, 1075–1084 (1999). [DOI] [PubMed] [Google Scholar]
- 4.Weinberg RA The retinoblastoma protein and cell cycle control. Cell 81, 323–330 (1995). [DOI] [PubMed] [Google Scholar]
- 5.laquinta PJ & Lees JA Life and death decisions by the E2F transcription factors. Curr. Opin. Cell Biol. 19, 649–657 (2007). [DOI] [PMC free article] [PubMed] [Google Scholar]
- 6.Komatsu N et al. Development of an optimized backbone of FRET biosensors for kinases and GTPases. Mol. Biol. Cell 22, 4647–4656 (2011). [DOI] [PMC free article] [PubMed] [Google Scholar]
- 7.Aoki K et al. Stochastic ERK activation induced by noise and cell-to-cell propagation regulates cell density-dependent proliferation. Mol. Cell 52, 529–540 (2013). [DOI] [PubMed] [Google Scholar]
- 8.Deng C, Zhang P, Harper JW, Elledge SJ & Leder P Mice lacking p21CIP1/WAF1 undergo normal development, but are defective in G1 checkpoint control. Cell 82, 675–684 (1995). [DOI] [PubMed] [Google Scholar]
- 9.Brugarolas J et al. Radiation-induced cell cycle arrest compromised by p21 deficiency. Nature 377, 552–557 (1995). [DOI] [PubMed] [Google Scholar]
- 10.Branzei D & Foiani M The DNA damage response during DNA replication. Curr. Opin. Cell Biol. 17, 568–575 (2005). [DOI] [PubMed] [Google Scholar]
- 11.Stewart-Ornstein J & Lahav G Dynamics of CDKN1A in single cells defined by an endogenous fluorescent tagging toolkit. Cell Reports 14, 1800–1811 (2016). [DOI] [PMC free article] [PubMed] [Google Scholar]
- 12.Grillo M et al. Validation of cyclin D1/CDK4 as an anticancer drug target in MCF-7 breast cancer cells: effect of regulated overexpression of cyclin D1 and siRNA-mediated inhibition of endogenous cyclin D1 and CDK4 expression. Breast Cancer Res. Treat. 95, 185–194 (2006). [DOI] [PubMed] [Google Scholar]
- 13.Zhou BB & Elledge SJ The DNA damage response: putting checkpoints in perspective. Nature 408, 433–439 (2000). [DOI] [PubMed] [Google Scholar]
- 14.Lukas C et al. 53BP1 nuclear bodies form around DNA lesions generated by mitotic transmission of chromosomes under replication stress. Nat. Cell Biol. 13, 243–253 (2011). [DOI] [PubMed] [Google Scholar]
- 15.Barr AR et al. DNA damage during S-phase mediates the proliferation- quiescence decision in the subsequent G1 via p21 expression. Nat. Commun. 8, 14728 (2017). [DOI] [PMC free article] [PubMed] [Google Scholar]
- 16.Arora M, Moser J, Phadke H, Basha AA & Spencer SL Endogenous replication stress in mother cells leads to quiescence of daughter cells. Cell Reports 19, 1351–1364 (2017). [DOI] [PMC free article] [PubMed] [Google Scholar]
- 17.Maki CG & Howley PM Ubiquitination of p53 and p21 is differentially affected by ionizing and UV radiation. Mol. Cell. Biol. 17, 355–363 (1997). [DOI] [PMC free article] [PubMed] [Google Scholar]
- 18.Iwamoto M, Bjorklund T, Lundberg C, Kirik D & Wandless TJ A general chemical method to regulate protein stability in the mammalian central nervous system. Chem. Biol. 17, 981–988 (2010). [DOI] [PMC free article] [PubMed] [Google Scholar]
- 19.LaBaer J et al. New functional activities for the p21 family of CDK inhibitors. Genes Dev. 11, 847–862 (1997). [DOI] [PubMed] [Google Scholar]
- 20.Alt JR, Gladden AB & Diehl JA p21Cip1 Promotes cyclin D1 nuclear accumulation via direct inhibition of nuclear export. J. Biol. Chem. 277, 8517–23 (2002). [DOI] [PubMed] [Google Scholar]
- 21.Chen JY, Lin JR, Tsai FC & Meyer T Dosage of Dyrk1a shifts cells within a p21-cyclin D1 signaling map to control the decision to enter the cell cycle. Mol. Cell 52, 87–100 (2013). [DOI] [PMC free article] [PubMed] [Google Scholar]
- 22.Sugimoto M et al. Activation of cyclin D1-kinase in murine fibroblasts lacking both p21Cip1 and p27Kip1. Oncogene 21, 8067–74 (2002). [DOI] [PubMed] [Google Scholar]
- 23.Ferrell JE Jr, & Ha SH Ultrasensitivity part II: multisite phosphorylation, stoichiometric inhibitors, and positive feedback. Trends Biochem. Sci. 39, 556–569 (2014). [DOI] [PMC free article] [PubMed] [Google Scholar]
- 24.Hanahan D & Weinberg RA The hallmarks of cancer. Cell 100, 57–70 (2000). [DOI] [PubMed] [Google Scholar]
- 25.Sakaue-Sawano A et al. Visualizing spatiotemporal dynamics of multicellular cell-cycle progression. Cell 132, 487–498 (2008). [DOI] [PubMed] [Google Scholar]
- 26.Yusa K, Rad R, Takeda J & Bradley A Generation of transgene-free induced pluripotent mouse stem cells by the piggyBac transposon. Nat. Methods 6, 363–369 (2009). [DOI] [PMC free article] [PubMed] [Google Scholar]
Associated Data
This section collects any data citations, data availability statements, or supplementary materials included in this article.


