Abstract
SUMMARY – Radiological diagnostic methods have a significant role in the preoperative and postoperative care of patients after kidney transplantation. Improvement and innovations in technology, but also the growing experience of the radiologists who deal with kidney transplant patients as part of the transplant team lead to earlier detection of complications in the postoperative period, which are the leading cause of transplant failure. In this article, we describe, through diagnostic imaging examples, detailed evaluation of all possible complications that can occur after kidney transplantation, with evaluation of different possible diagnostic methods that can be used in the preoperative assessment and postoperative follow up and care of the transplanted patient. The goal of this article is to demonstrate and summarize in detail the possible complications of renal transplantation and how to best diagnostically approach them, with special reference to ultrasound which is the main imaging method for this group of conditions.
Key words: Kidney transplantation, Radiology, Postoperative complications, Radiography, Postoperative care
Renal transplantation is the most effective treatment option in patients with end-stage renal disease. Studies have shown that the 5-year survival after renal transplantation is 70%, as compared to 30% survival in patients receiving dialysis (1). The use of appropriate diagnostic method in preoperative analysis but also in postoperative follow up protocol is necessary for accurate preparation and early diagnosis of complications and workflow efficiency (2). The most important role of diagnostic radiological methods is to identify multiple complications in the posttransplant period (3).
Diagnostic imaging methods used in kidney transplant analysis are:
A. Color Doppler Ultrasound
During the postoperative period, Doppler ultrasonography plays a key role in the assessment of the renal transplant status, as it is a non-ionizing, noninvasive method that can be repeated multiple times and does not require the use of contrast media (4-8).
B. Computed Tomography (CT)
Computed tomography has a place in those cases when ultrasound cannot clearly give a diagnosis, but due to its radiation to the patient should only be reserved for selected complicated cases (9, 10).
C. Magnetic Resonance Imaging (MRI)
Even though without radiation risk, this method should also be reserved for selected cases, mainly due to its lack of accessibility (11, 12).
D. Digital Subtraction Angiography (DSA)
In cases of vascular compromise, mainly arterial stenosis or occlusion, DSA can be a valuable contributor to establishing a definitive diagnosis, and it is usually performed prior to endovascular procedures of balloon dilatation and stenting when necessary (13).
The role of radiology in renal transplantation includes preoperative evaluation of donor kidneys, evaluation of morphology and calcifications of vascular structures of the recipient, analysis of reasons for transplant rejection, and post transplantation complications.
1. Radiological analysis of donor kidneys
It is necessary to evaluate certain important features in a donor kidney to establish if it is appropriate for transplantation, i.e. kidney size, presence of focal cystic or solid lesions, condition of vascular structures and their anatomy (presence of accessory arteries or early bifurcations), collecting system anomalies, or problems or presence of nephrolithiasis. Most of these issues can be visualized with Doppler ultrasound; however, CT angiography is usually necessary for more detailed evaluation of vascular anatomy (14-17).
2. Radiological analysis of recipients
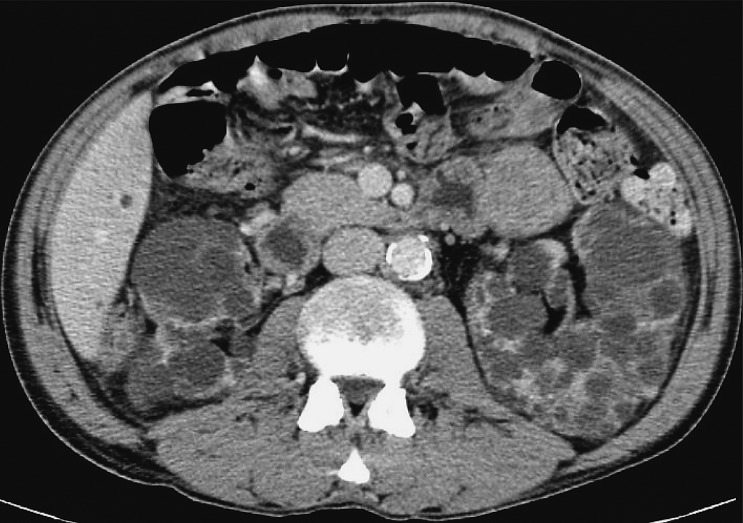
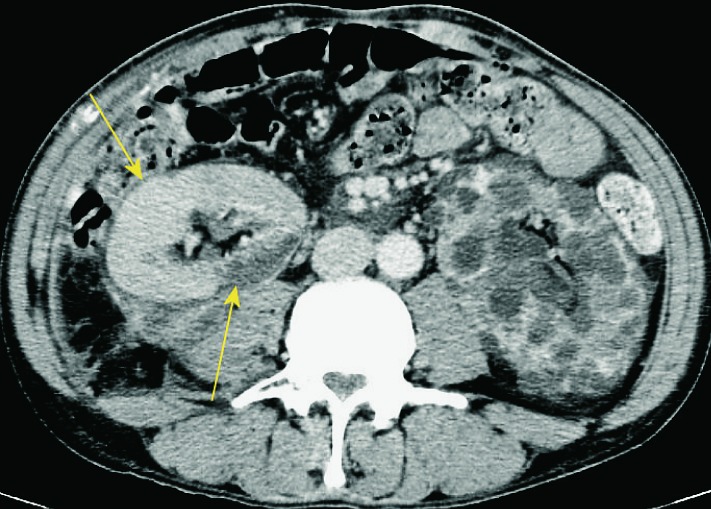
It is important to assess the recipient before transplantation to establish any possible conditions that could present a threat to the recipient or functioning of the received kidney. The usual algorithm includes chest and abdominal x-ray and ultrasound of the abdomen. A very important feature is to analyze the presence and intensity of atherosclerotic changes in the iliac vessels because these patients tend to develop prominent arterial calcifications due to dialysis. This can sometimes be sufficiently analyzed with pelvic x-ray but sometimes a CT is needed. Sometimes a CT will also be needed to assess and plan nephrectomy that is occasionally performed at the same time in patients with large polycystic kidneys in order to make space for the transplanted kidney (10, 18) (Fig. 1).
Fig. 1.
CT axial view. Enlarged polycystic kidneys bilaterally.
3. Postoperative follow up with transplant rejection and complication analysis
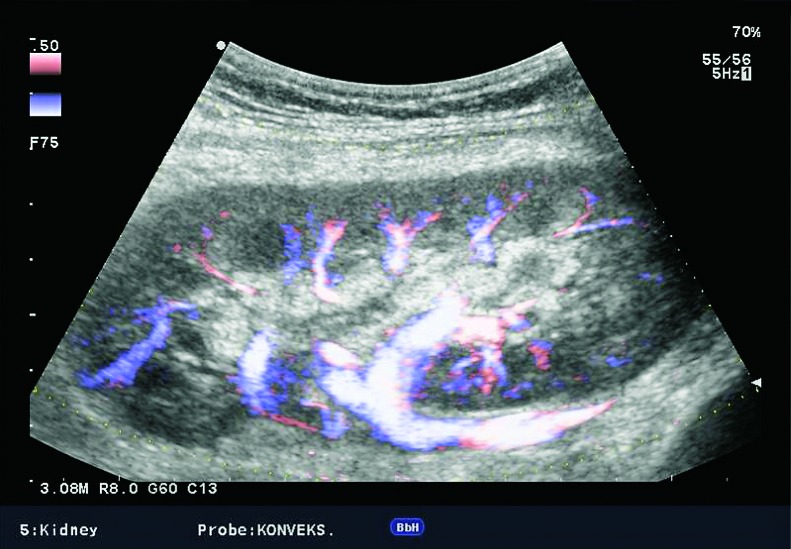
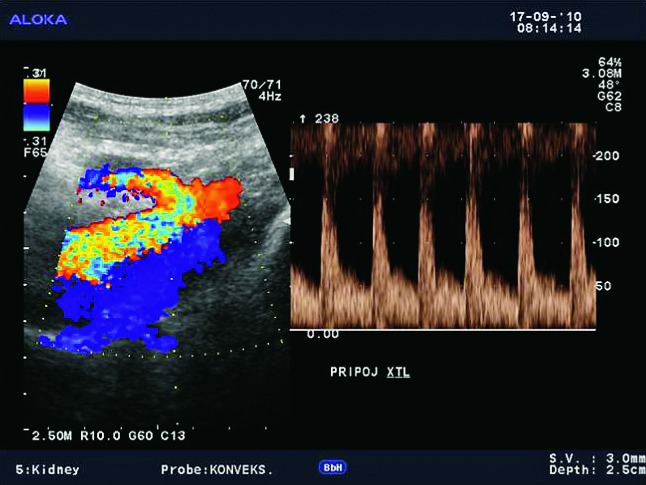
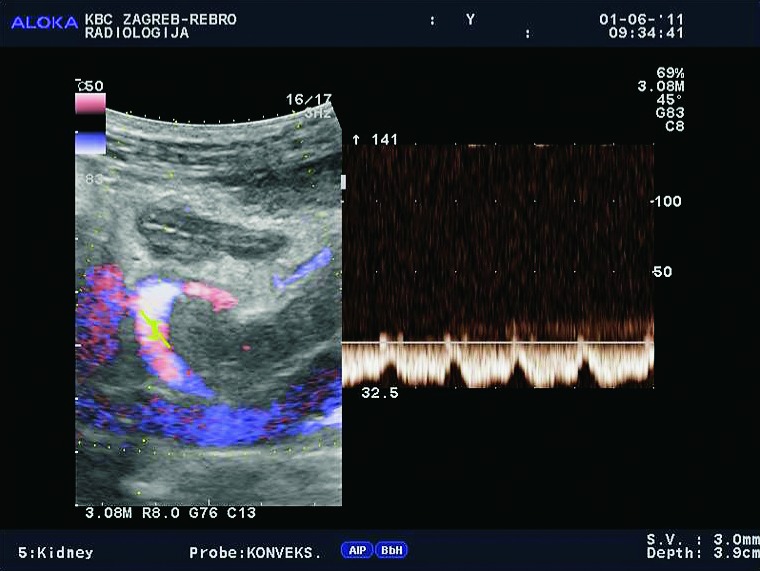
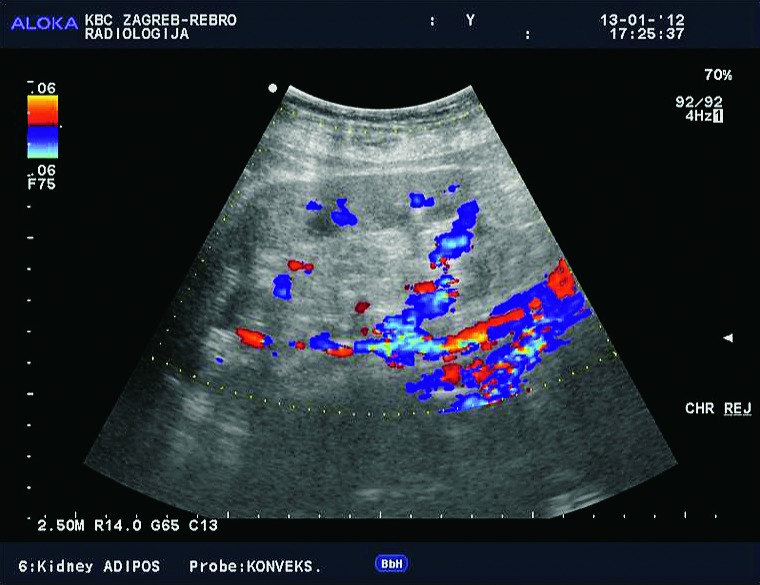
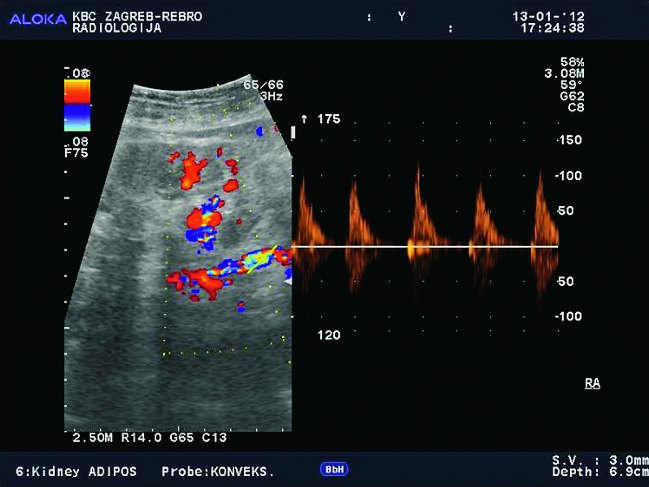
Doppler ultrasound plays a major role in these patients mainly because they usually require repetitive examinations and long term follow up. The fact that the renal transplant is located superficially in the iliac fossa, unlike the native kidneys, which are located deeper in the retroperitoneum, is an additional advantage for its visualization and evaluation of its vascularization with Doppler ultrasonography. Morphologically, the renal transplant is similar to the native, healthy kidney with the distinction that the pyramids are more easily visualized in renal transplant, and the minor calyces and renal pelvis are often slightly dilated due to edema at the vesico-ureteric anastomosis in the early postoperative period (19). Doppler ultrasound provides a good insight into the intrarenal vasculature, transplant artery and vein, and the iliac vessels (7, 8) (Fig. 2). Due to tortuosity of the transplant arteries, their visualization can sometimes be challenging (20). It is necessary to visualize the renal artery in its entire length, from the anastomosis to the iliac artery to the renal hilum (Fig. 3a). It is important to measure the peak systolic velocity (PSV) in the renal artery, which should not exceed 2 m/s. For accurate velocity measurements, Doppler angle should be between 45° and 60°. If it is set any higher, the flow values will be falsely elevated. In the case of borderline PSV values, or when they are slightly elevated above 2 m/s, it is useful to calculate the ratio of PSV in the renal artery to the PSV in the iliac artery, which should not be greater than 2.5:1. If the ratio is any higher, renal artery stenosis may be suspected. During the ultrasound examination, it is important to visualize segmental, interlobar and arcuate arteries and measure their resistive indexes (RI), which range up to 0.70 and are slightly higher than that of a normal kidney (21-23). The identification of flow in the renal transplant vein by color Doppler is sufficient for exclusion of renal vein thrombosis. The e-flow is a high-definition blood flow imaging mode with drastically improved spatial and temporal resolution. In e-flow, it is possible to display blood flow information with higher sensitivity and resolution than with conventional methods. This enables detailed observation of fine blood vessels, which were difficult to display separately in conventional methods (24) (Fig. 3b). The graft arterial vascular anastomosis is usually made with the external iliac artery, in a minority of cases with the internal iliac artery, and rarely with the suprabifurcational aorta. The venous anastomosis is made to the inferior vena cava. Doppler evaluation of the iliac vessels is no different from their pretransplant evaluation. It is very important to identify the flow in the iliac vein by color Doppler, as well as the normal triphasic waveform and normal flow velocity in the iliac artery, without signs of stenosis or occlusion.
Fig. 2.
E-flow Doppler image of intrarenal vascularization. Normal transplanted kidney.
Fig. 3a.
Normal appearance of the main renal artery with normal spectral Doppler waveform of the anastomosis of the transplant artery on iliac artery, with PSV of 1.5 m/s.
Fig. 3b.
Color and spectral Doppler (E-flow). Normal blood flow in the renal vein.
Computed tomography is used when ultrasound examination fails to set a definitive diagnosis, especially in obese patients where the ultrasound examination is more technically challenging. CT is often a better method for visualization of fluid collections located deeper in the abdomen and pelvis, as well as for the three-dimensional image reformatting, which gives us better volume analysis compared to ultrasound. Because of the low availability and duration of the exam, MRI is used only when other techniques are inconclusive, and it is advisable to avoid the application of intravenous iodine contrast medium because of its nephrotoxicity (25, 26).
Posttransplantation complications can be divided into early (up to 28 days after transplantation) and late (after 28 days of transplantation), and to vascular and nonvascular (3, 6, 27). The most important and most common complications are acute rejection, acute tubular necrosis, renal artery thrombosis, renal vein thrombosis, perinephric fluid collections, urinary obstruction, renal artery stenosis, aneurysmal dilatation of the renal artery, arteriovenous fistula, and chronic rejection. Hemorrhage, urinary leak, pyelonephritis, drug nephrotoxicity and de novo glomerulonephritis can also occur. One should also note increased susceptibility to develop malignancy and secondary superinfection in transplant patients due to immunosuppression. There are four major groups of posttransplant complications: perinephric collections, abnormalities of the collecting system, vascular abnormalities and parenchymal abnormalities (Table 1).
Table 1. Posttransplant kidney complications.
| Perinephric fluid collections | Renal collecting system New students |
Vascular complications | Parenchymal abnormalities |
|---|---|---|---|
| Hematoma | Obstructive hydronephrosis | Renal artery thrombosis or stenosis | Focal: |
| Seroma | Nonobstructive hydronephrosis | Renal vein thrombosis or stenosis | Tumors (urethral and bladder tumors) |
| Urinoma | Urinary leak | Segmental infarction | Posttransplant lymphoproliferative syndrome |
| Lymphocele | Nephrolithiasis | Graft torsion | Focal infarction |
| Abscess | Renal abscess | Arteriovenous fistula | Pyelonephritis/renal abscess |
| Hematoma | Fungal infections | Cysts | |
| Transitional cell cancer | Nephrocalcinosis | ||
| Diffuse: | |||
| Acute tubular necrosis | |||
| Hyperacute rejection | |||
| Acute rejection | |||
I. Perinephric fluid collections
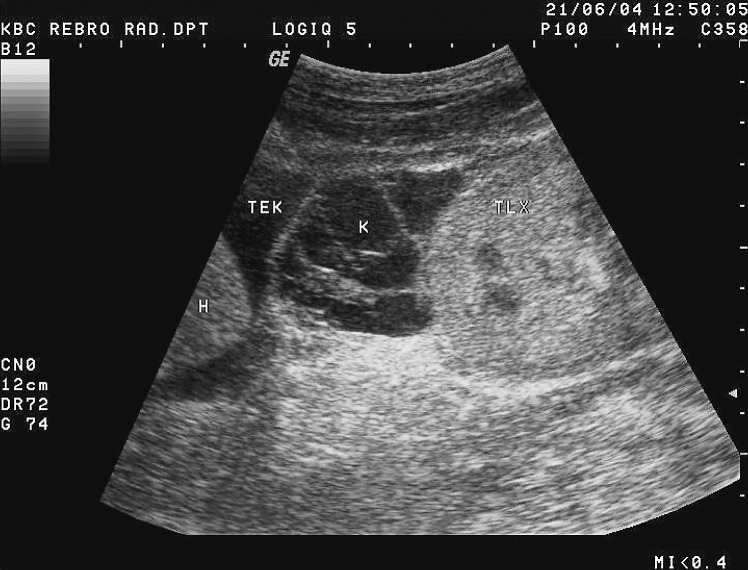
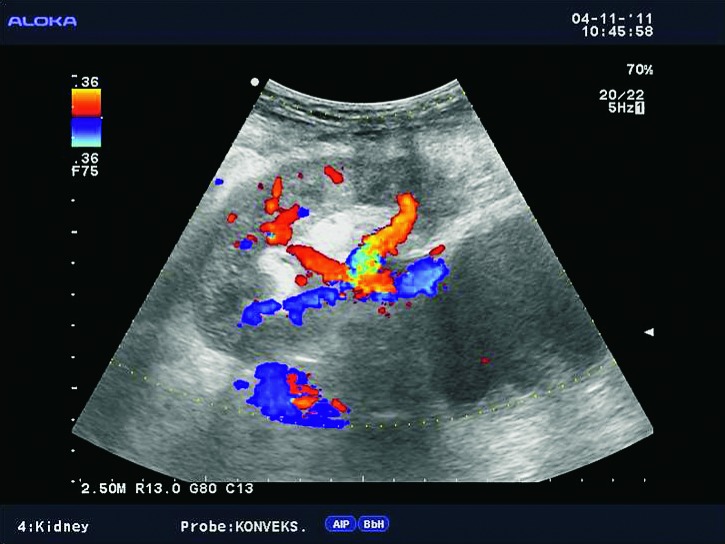
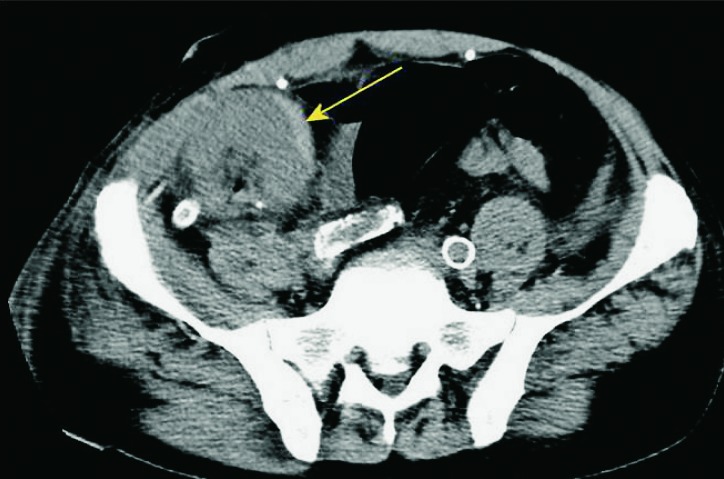
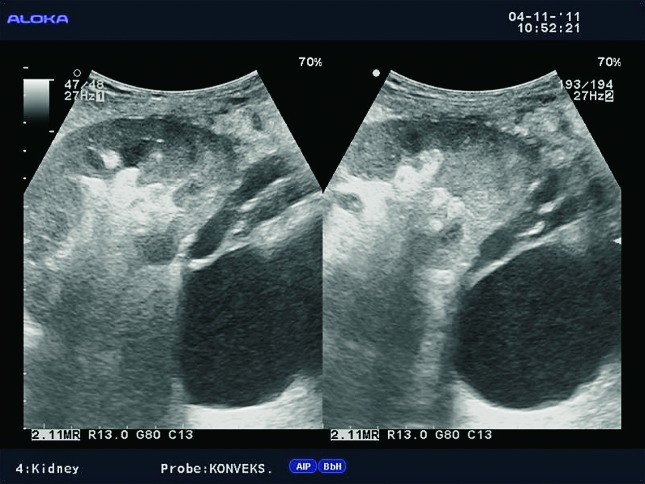
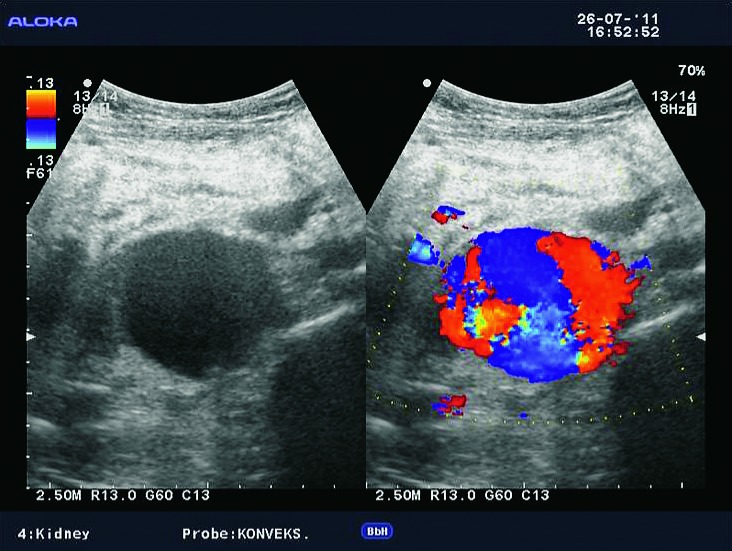
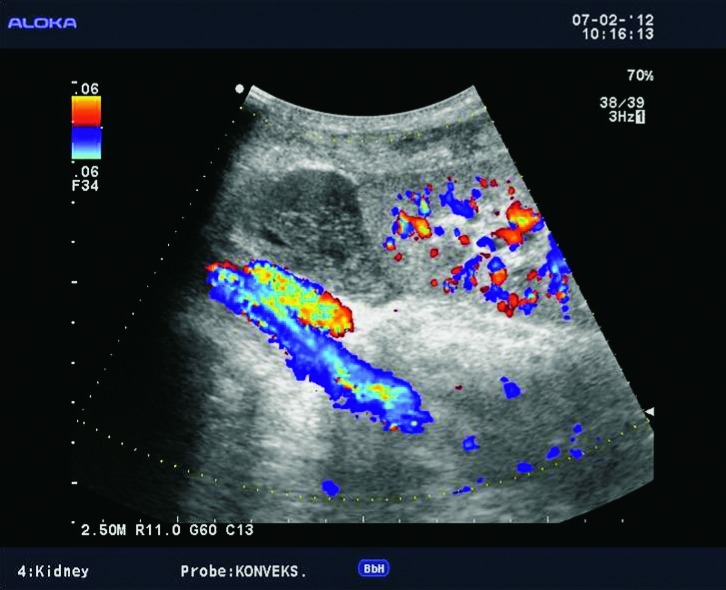
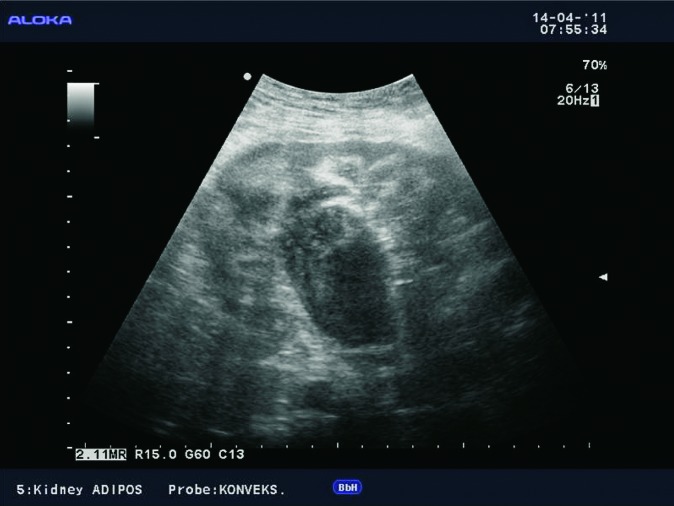
Perinephric fluid collections include hematoma, seroma, lymphocele, urinoma, and abscesses. In the early posttransplant period, fluid collections around the kidney are common and usually quickly resorbed. The clinical signs and symptoms after transplantation can be very useful in characterization of fluid collections. In cases when fluid collections are not resorbed or when they increase in size, ultrasound is important to assess the presence and size of these collections. Ultrasound usually shows anechogenic and avascular collections, sometimes with septations (Fig. 4), or solid tissue inside the collection. It is very important to determine their relation to the renal vascular pedicle and detect possible compression of the renal artery or vein (Fig. 5). In obese patients and those with collections located deeper under the skin, CT is the method of choice (10) (Fig. 6).
Fig. 4.
B-mode ultrasound image. Septated fluid collection, large amount of liquid between the lower surface of the liver and the upper pole of the transplanted kidney.
Fig. 5.
Color Doppler. Larger anechogenic fluid collection located dorsally of the transplanted kidney and its relation to the vascular pedicle.
Fig. 6.
CT axial view. Perirenal fluid collection around the transplanted kidney on the right, polycystic kidney on the left, which extends to the pelvis.
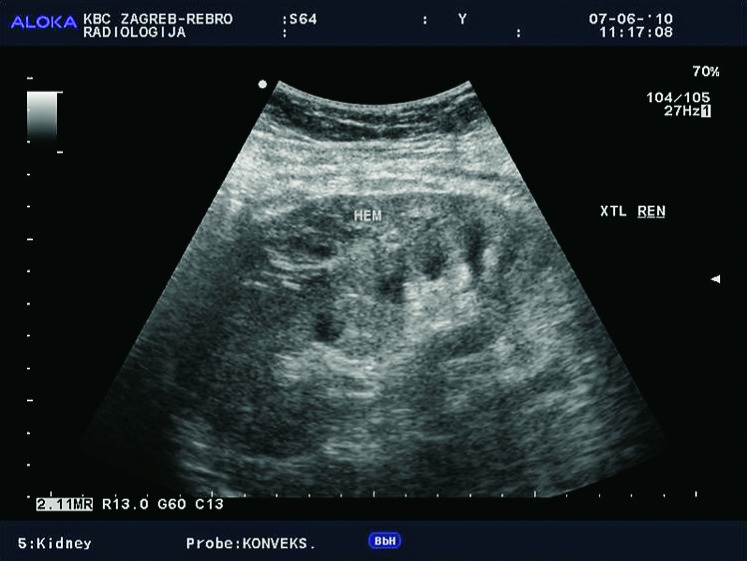
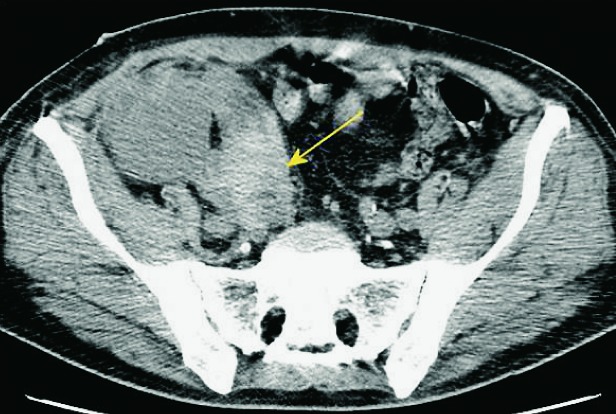
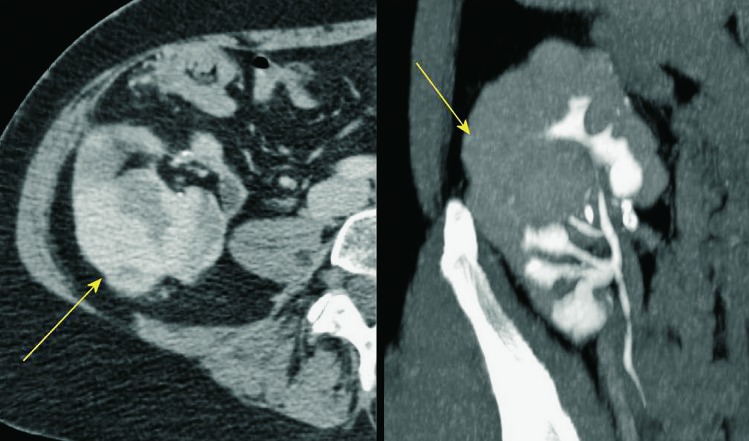
Large and clinically significant hematomas occur in 4%-8% of cases and together with dramatic clinical manifestation and drop of red blood cell count are serious complications that are easily visualized using radiological imaging methods. Large hematomas can occur due to rupture of the graft or lesions of the vascular pedicle. Hematoma can have compressive effect and lead to dysfunction of the renal transplant. They can be localized perinephrically and subcapsularly (Fig. 7). Subcapsular hematomas can be more difficult to visualize by ultrasound (sign of ‘double contour’ of the kidney) (Fig. 8), but can also lead to compression of the renal collecting system, of the vascular pedicle, or to graft dysfunction. In the acute phase of bleeding, ultrasound examination shows a hyperechogenic formation, whereas in the stage of resolution hematomas become hipoechogenic, sometimes even anechogenic. Unenhanced CT is the method of choice for displaying large hematomas, not just because of better delineation of fluid collections and their anatomic relationships to adjacent structures but also for the display of hematomas that are localized deeper in the pelvis and retroperitoneum, and are much harder to detect using ultrasound. Unenhanced CT displays acute hematomas as fluid collections with hyperattenuating areas, which is consistent with fresh blood (10, 18) (Fig. 9).
Fig. 7.
CT axial view. Small subcapsular hematoma.
Fig. 8.
B-mode ultrasound image. Subcapsular hematoma – a sign of ‘double contour’ of the kidney.
Fig. 9.
Unenhanced CT, axial and sagittal view. A large perirenal hematoma (arrow), showing increased absorption coefficients of 85 H.U., indicating the presence of fresh blood immediately after transplantation.
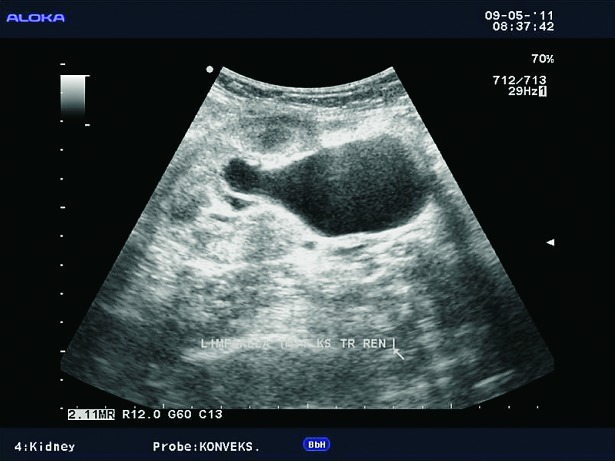
Lymphoceles result from surgical disruption of lymphatics, they usually occur in the late posttransplant period, a month or several months after the surgery. The key to differentiation of lymphoceles from seromas is that lymphoceles occur later and tend to grow. Seromas are composed of clear liquid, while lymphoceles have chylous content and contain triglycerides. In both cases, ultrasound shows an anechogenic mass filled with fluid (Fig. 10), rarely containing internal debris or septations (15). CT displays round, hypoattenuating collections of clear liquid, without postcontrast imbibition. MRI visualizes lymphoceles, seromas and urinomas very similarly, on T1 measured time as low signal intensity collections and on T2 measured time as high signal intensity collections. Large lymphoceles can be clinically significant due to compression of the vascular pedicle (Fig. 11) or ureter (Fig. 12). The use of color Doppler ultrasound is also important for the fluid collection analysis. Round anechogenic collections can also represent aneurysms of the vascular structures, if there is blood flow inside them (Fig. 13).
Fig. 10.
B-mode ultrasound image. Large lymphoceles located dorsally of the renal transplant, 45 days after transplantation.
Fig. 11.
B-mode ultrasound and color Doppler. Lymphocele extending into the hilum of the transplant, imitating dilated renal pelvis.
Fig. 12.
B-mode ultrasound image. Dilatation of the collecting system due to compression of the ureter by lymphocele.
Fig. 13.
B-mode ultrasound and color Doppler. Aneurysm of the transplant artery anastomosis, which imitates lymphocele.
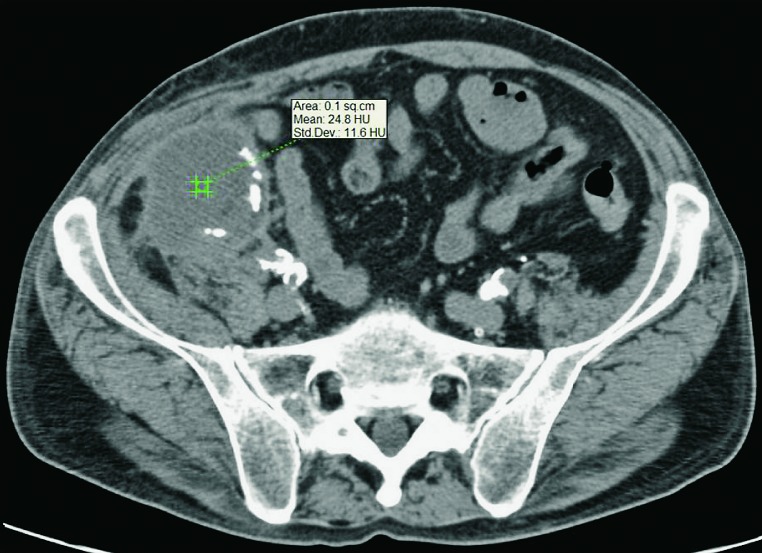
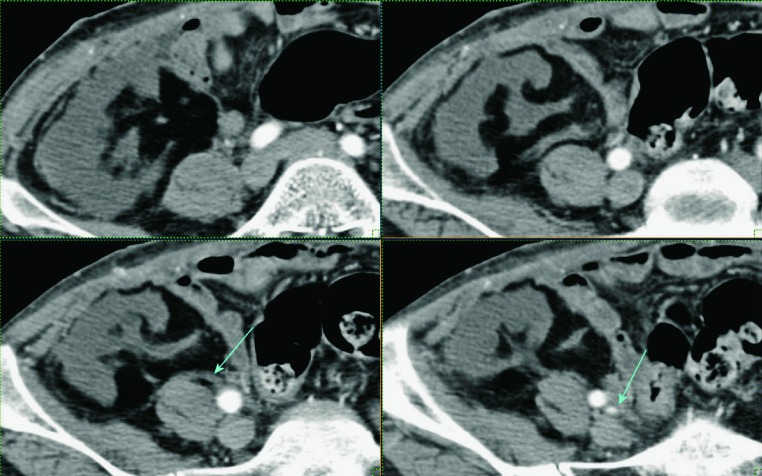
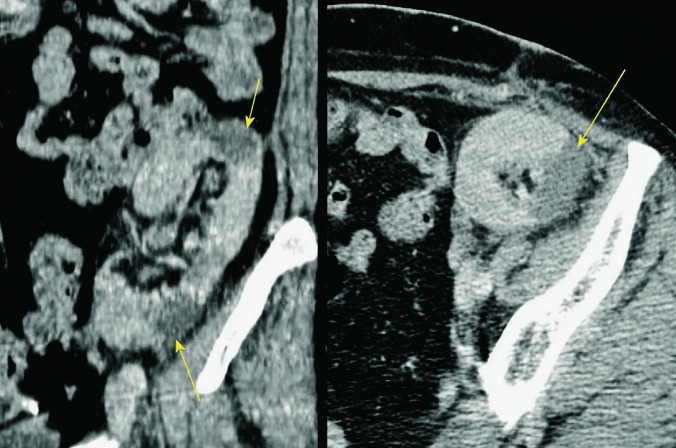
Abscesses are not as frequent as other fluid collections in the early posttransplant period. If perirenal collections are seen in febrile patients, they should be considered potentially infected (Fig. 14 a, b). Unenhanced CT displays abscesses as fluid collections containing dense fluid content, sometimes with visible gas inside the collection (Fig. 15). Contrast enhanced CT or gadolinium enhanced MRI display postcontrast imbibition of hypervascular capsule around the collection containing purulent content (10, 12).
Fig. 14a and b.
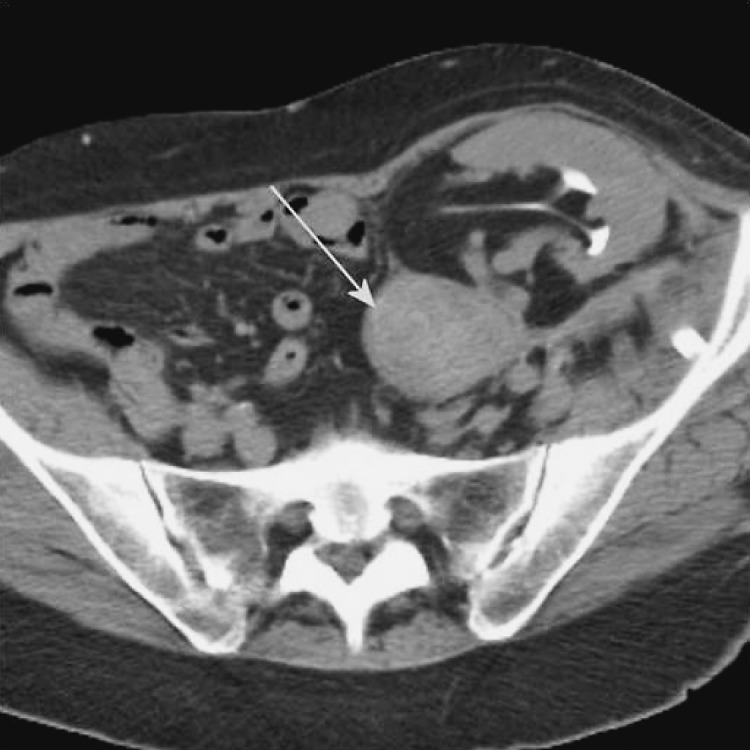
Unenhanced CT, axial and sagittal view. Febrile patient after the transplantation, perirenal collection that fits abscess (marked with arrows).
Fig. 15.
Unenhanced CT, axial view of an abscess. Dense fluid collection with absorption coefficients of 24-33 H.U., extending in the front abdominal wall musculature.
II. Renal collecting system abnormalities
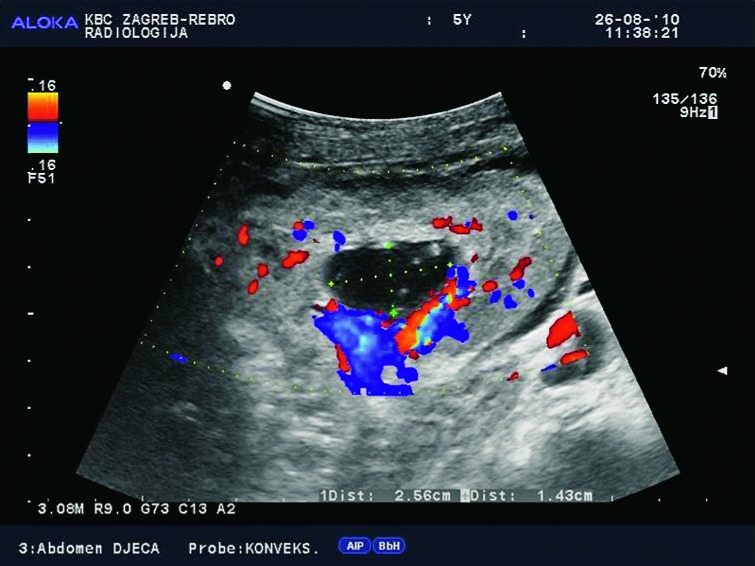
Renal collecting system abnormalities include obstructive hydronephrosis, flaccid or non-obstructive hydronephrosis due to loss of tonicity from denervation (Fig. 16), urinary leak with formation of urinoma, pyonephros, fungal infections, renal stones, and tumors such as transitional-cell carcinoma (TCC).
Fig. 16.
Color Doppler. Nonobstructive hydronephrosis due to the loss of tonicity of the collecting system in a 5-year-old child.
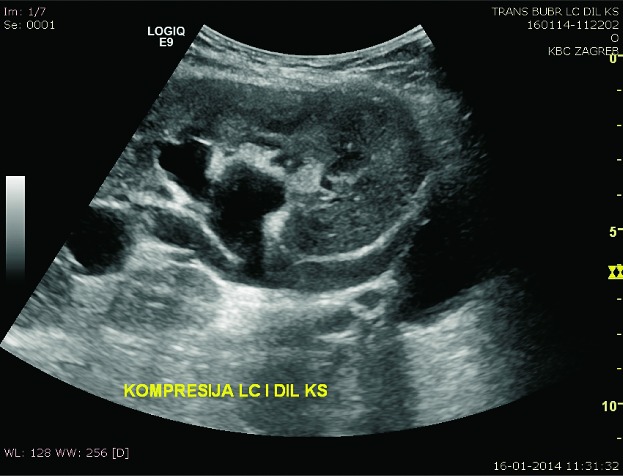
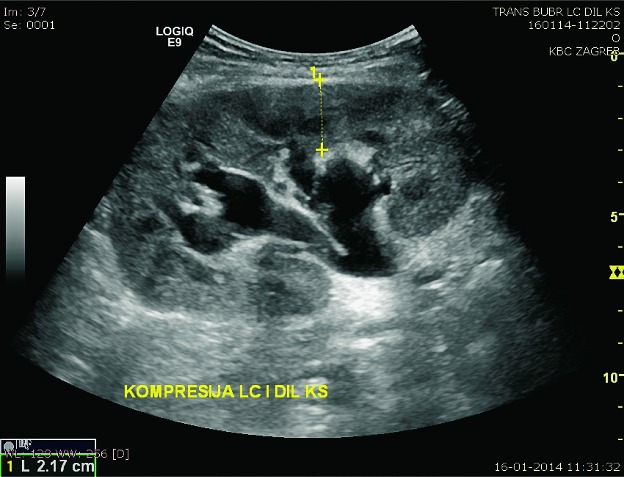
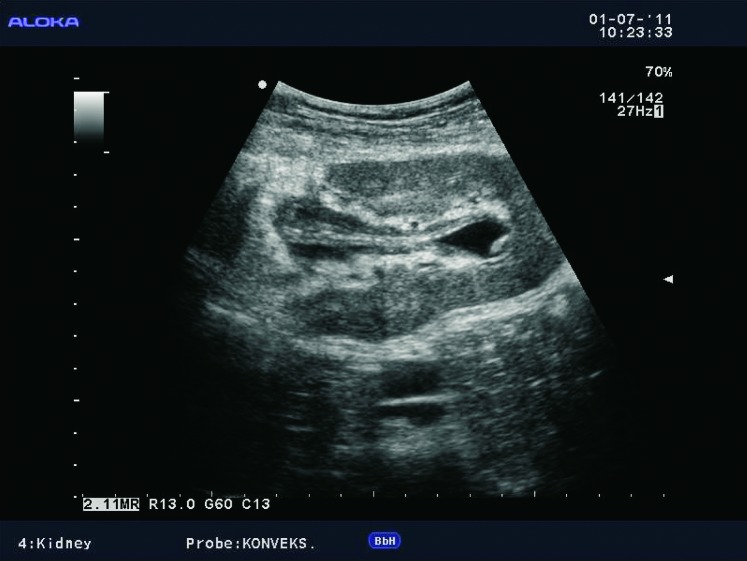
Hydronephrosis in transplanted kidney is encountered in 2%-5% of renal transplant recipients, with obstruction at the level of ureter. The causes of obstruction can be temporary, such as edema at the ureteral anastomosis or blood clots after surgery. The cause can also be external compression by collections such as lymphoceles (Fig. 17). Late-onset obstruction is caused by ureteral stenosis due to fibrosis or ischemia (Fig. 18).
Fig. 17.
B-mode ultrasound image. Dilatation of the collecting system of the transplanted kidney.
Fig. 18.
CT urography, axial and sagittal view. Ureteral stenosis at the ureterovesical junction.
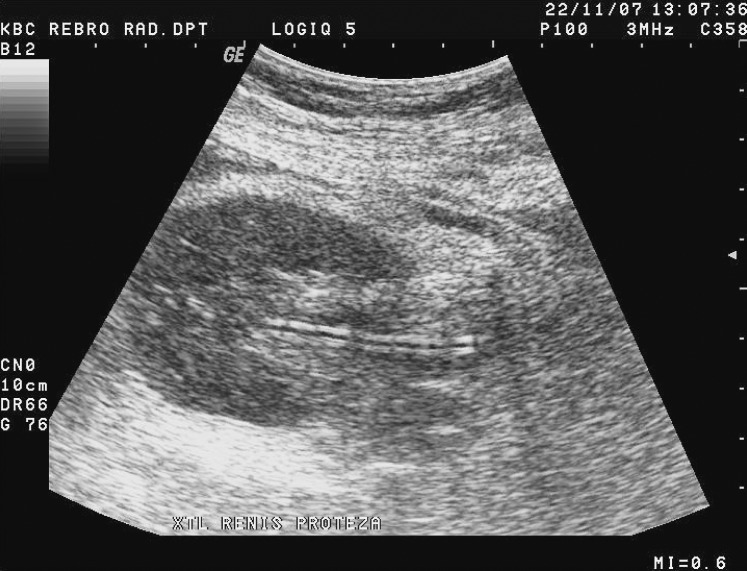
Hydronephrosis can be easily identified with ultrasound (Fig. 17). Ultrasound can identify nephrostomy or ‘double J’ prosthesis position in the canal system, and can be used to monitor therapeutic effect (5, 6) (Fig. 19). Resistance indexes (RI) can be elevated in hydronephrosis. Assessment of the exact site and cause of obstructive uropathy is usually done using unenhanced CT scan.
Fig. 19.
B-mode ultrasound image. Linear echo of a prosthesis in the collecting system of the renal transplant, therapeutically positioned with no signs of hydronephrosis.
Urinomas are seen in 3%-10% of cases, usually due to necrosis of the distal ureter because of its tenacious blood supply. Less common sites of rupture are vesico-ureteric anastomosis or dilated collecting system (28). Ultrasound shows urinoma as an anechogenic cystic collection (Fig. 20), and CT as a perivesically or periureterally located fluid collection. Nuclear medicine studies show increased isotope activity.
Fig. 20.
Color Doppler. Control examination of a patient with previously verified urinoma, seen as an avascular collection between the kidney and iliac blood vessels.
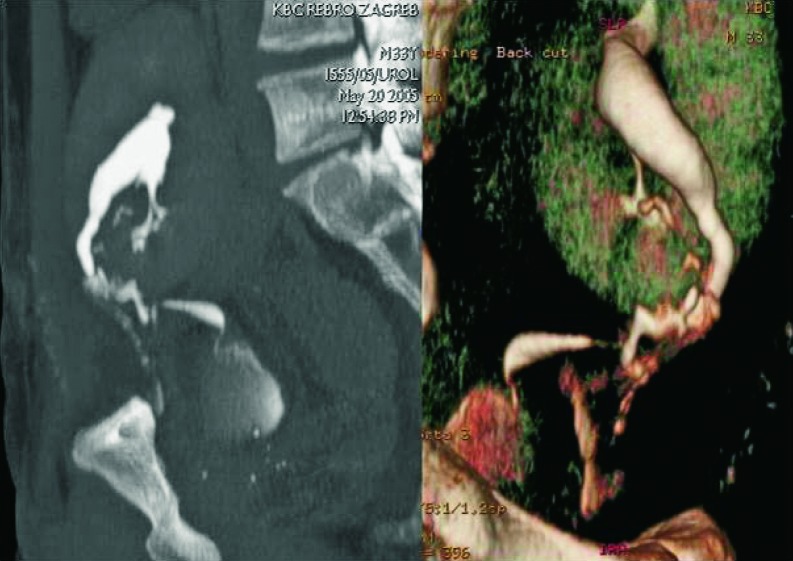
Computed tomography or MRI urography (29) can be used to visualize extralumination of contrast medium (Fig. 21), usually at the level of uretero-vesical anastomosis, necrotic distal part of ureter, or the site of anterior cystostomy. If urinoma puncture is performed under control of ultrasound or CT, elevated levels of creatinine are found in the aspirate.
Fig. 21.
CT urography, 3D. Extralumination of contrast agent due to ischemia of the distal part of the ureter of transplanted kidney.
Kidney stones are rarely the cause of hydronephrosis in transplanted kidney, and either exist initially in the donor kidney or can occur over time as a late complication. Echogenicity in the collecting system can be a sign of pyonephros or fungal infection.
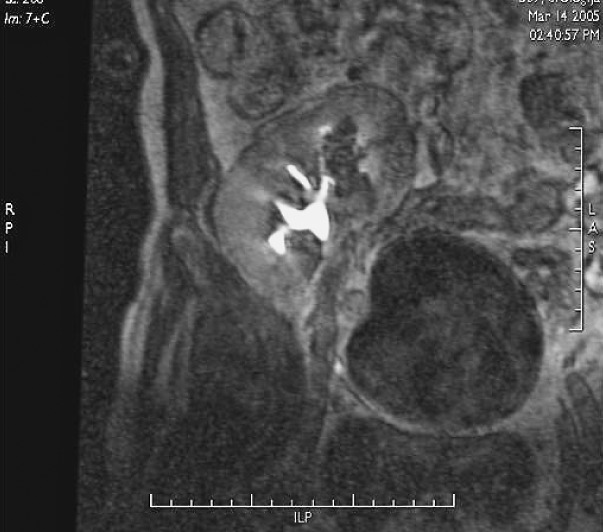
Thickening of the urothelium is a nonspecific sign (Fig. 22), which may suggest graft rejection, pyelonephritis, and it is necessary to exclude tumor of the transitional epithelium (Fig. 23).
Fig. 22.
B-mode ultrasound image. Thickening of the urothelium, a nonspecific sign that may indicate pyelonephritis but also renal rejection.
Fig. 23.
MR urography. Hypointensive mass, seen as a defect of contrast filling, located in the upper calyx of the transplanted kidney. Histologically proven to be a transitional cell tumor.
Computed tomography urography and MRI urography have high sensitivity and specificity in detecting collecting system abnormalities in transplanted kidney, which occur in 3%-14% of cases. In MRI urography, it is recommended to use T2 weighted imaging without the use of gadolinium contrast due to the risk of potentially developing nephrogenic systemic fibrosis (NSF) (30, 31).
III. Vascular complications
Vascular complications include renal artery stenosis/thrombosis, renal vein stenosis/thrombosis, infarct, torsion of the graft, arteriovenous fistula (AVF) and pseudoaneurysm (PA).
Renal artery thrombosis is a rare but very serious complication, which occurs in less than 1% of cases (Fig. 24). The most common cause of thrombosis is hyperacute rejection or damage to the intima of the artery during transplantation. Color Doppler shows the absence of flow in both the main transplant artery and the intra-renal vessels. Thrombosis of segmental arterial vessel leads to segmental infarction, which can be easily visualized using power Doppler as an area without vascular flow (Fig. 25). Limitations of power Doppler analysis can arise when analyzing parts of the kidney located deeper under the skin, due to attenuation of the ultrasonic wave (24, 32). In these situations, contrast-enhanced sonography is the best method to display parenchymal blood perfusion (33, 34). Contrast enhanced CT or contrast enhanced MRI show wedge-shaped areas of decreased parenchymal enhancement, which correspond to infarction (26) (Fig. 26). The size of infarction depends on diameter of the thrombosed intrarenal arterial vessel.
Fig. 24.
Contrast enhanced CT, arterial phase. Kidney transplant without signs of arterial blood flow. The contrast is in the iliac artery, renal artery is not opacified with contrast (marked with arrow). Occlusion of the renal artery.
Fig. 25.
Power Doppler. Segmental area without vascular flow in the renal parenchyma corresponding to renal infarct.
Fig. 26.
Contrast enhanced CT. Defects of contrast opacification of the renal parenchyma – defects of perfusion corresponding to renal infarcts (arrows).
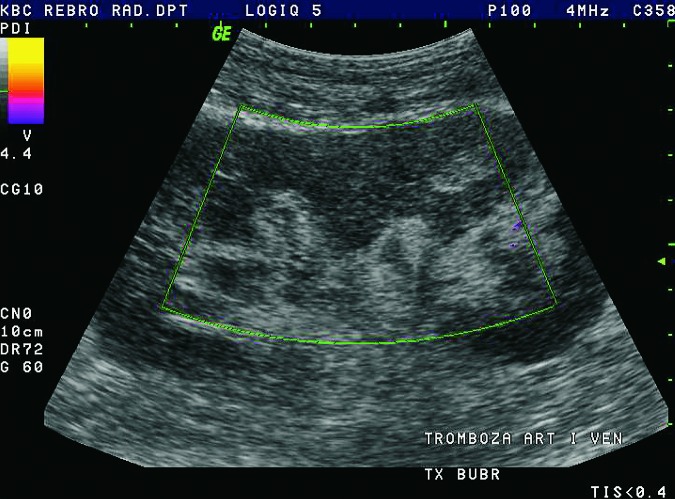
Renal vein thrombosis complicates less than 3% of transplants, typically as an early complication within the first postoperative week. Renal vein thrombosis and renal artery occlusion usually result in graft loss, but fortunately are rare complications. Clinical manifestations include acute pain and swelling of the graft. The causes are external compression by fluid collections or extension of iliac vein thrombosis, hypovolemia, and surgical complications. Doppler examination demonstrates absent flow within the renal vein, with the thrombus inside the lumen of the vein (7, 8) (Fig. 27). At the same time, it is possible to detect reverse diastolic flow within the intrarenal arterial system and the transplant renal artery. The thrombus inside the renal vein can be directly seen on contrast enhanced CT with delayed nephrogram.
Fig. 27.
B-mode ultrasound image. Renal vein filled with a large thrombus.
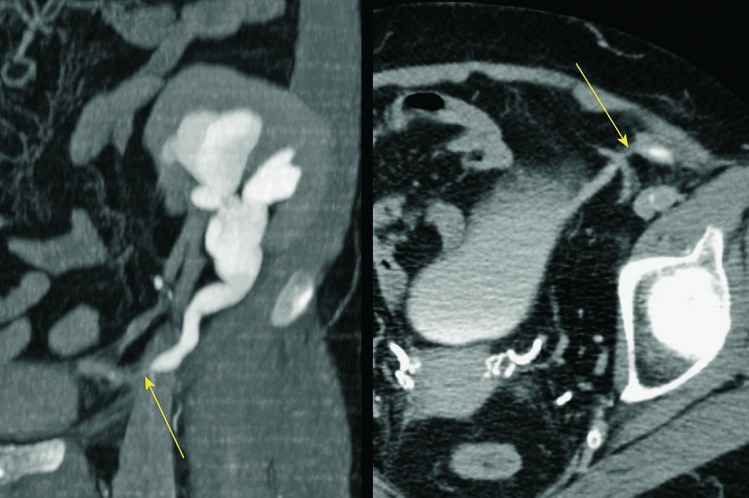
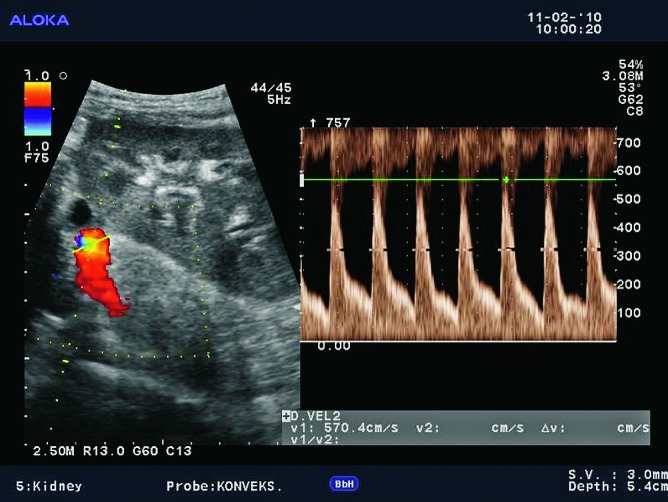
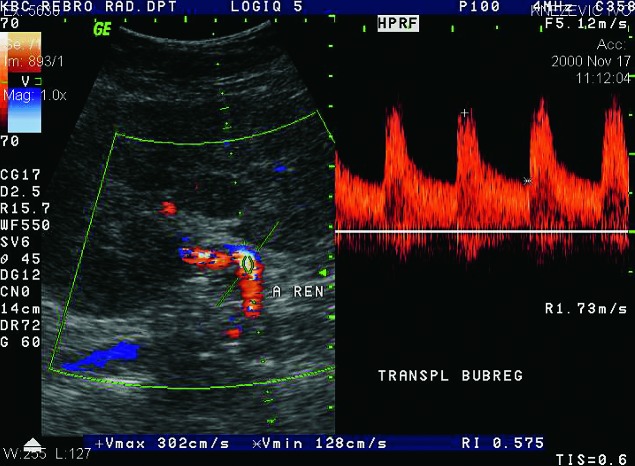
Renal artery stenosis occurs in about 10% of renal transplant patients. It can occur in the first posttransplant week, but also several years after the kidney transplantation. It is more common in cadaveric transplants, transplants with multiple renal arteries, and patients with complex vascular anastomosis (Fig. 28). The presenting symptom is hypertension. The main location of the stenosis is at the anastomotic site, or very close to the anastomosis of the renal artery and the iliac artery. In approximately 25% of cases, stenosis occurs in the prehilar segment of the renal artery (Fig. 29). In cases when parvus-tardus waveform is detected at the site of anastomosis, the cause of stenosis should be searched for proximally from the anastomosis, in the iliac artery. Doppler ultrasound is the best method for detection of renal artery stenosis, with the reliability of about 90% (7, 8). The parameters for diagnosing stenosis with Doppler are PSV higher than 2 m/s, turbulence distal to that area, and intrarenal parvus-tardus waveform with RI lower than 0.50. The ratio of PSV in the renal artery relative to PSV in the external iliac artery greater than 3 is also supportive of the diagnosis of renal artery stenosis. Velocity of just over 2 m/s at the anastomotic site, just as a PSV ratio of 2:1 is a borderline result which requires more frequent monitoring and follow up. Renal artery tortuosity (Fig. 30) can result in inaccurate Doppler angle correction (higher than 60 degrees) and inaccurate velocity measurements. Intrarenal and multisegmental branch stenosis are difficult to visualize with Doppler (Fig. 31). In cases when ultrasound studies are inconclusive and stenosis is suspected, CT (Figs. 32 and 33) or MRI angiography is the imaging modality of choice (17) (Fig. 34). The main advantage of CT is that there are less artifacts from surgical clips, whereas MRI is recommended for younger patients to avoid radiation and it is less nephrotoxic, even though there is a risk of developing NSF (31).
Fig. 28.
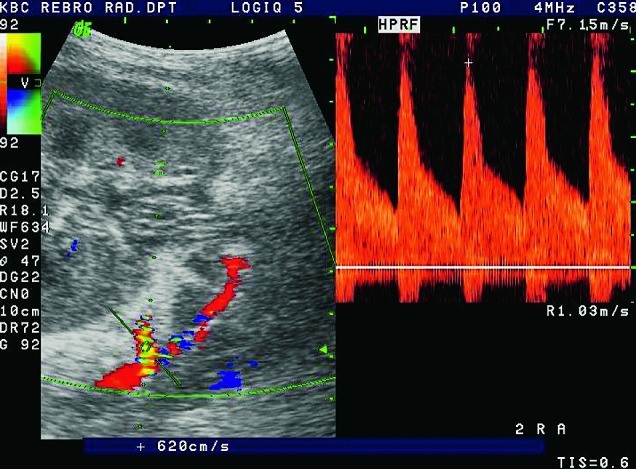
Color and pulsed Doppler. Complex anastomosis using the ‘patch’ to the iliac artery, blood flow rates are elevated (over 6 m/s), which is conclusive of stenosis.
Fig. 29.
Color and pulsed Doppler. Increased flow rate in the prehilar segment to 5.7 m/s, which corresponds to stenosis of the prehilar renal artery.
Fig. 30.
Color and pulsed Doppler. Elevation of blood flow rate in renal artery due to a sharp curvature; segment before and segment after the curvature shows normal blood flow rate, without Doppler signs of stenosis.
Fig. 31.
Color and pulsed Doppler. Segmental stenosis of the arterial branch with PSV elevation to 3 m/s.
Fig. 32.
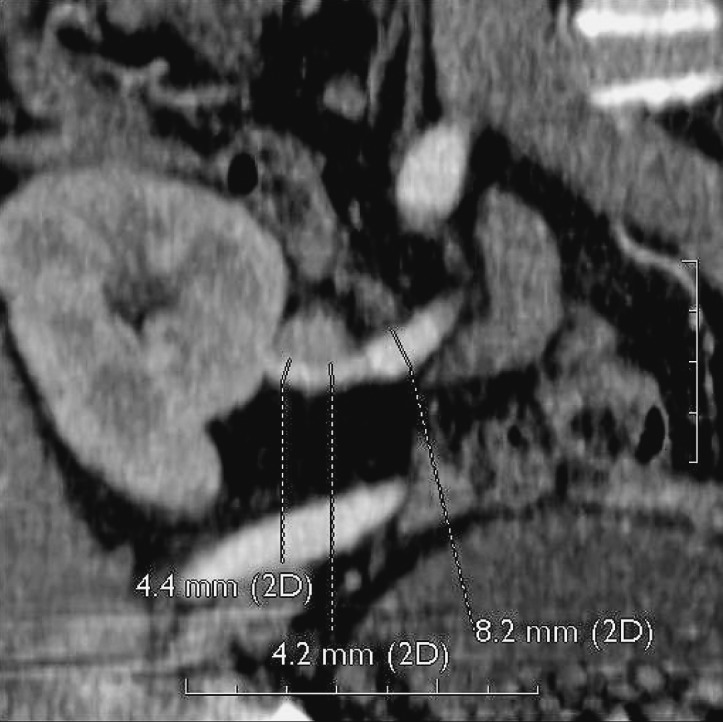
CT angiography, 3D. Stenosis of the prehilar segment of the renal artery on the long segment.
Fig. 33.
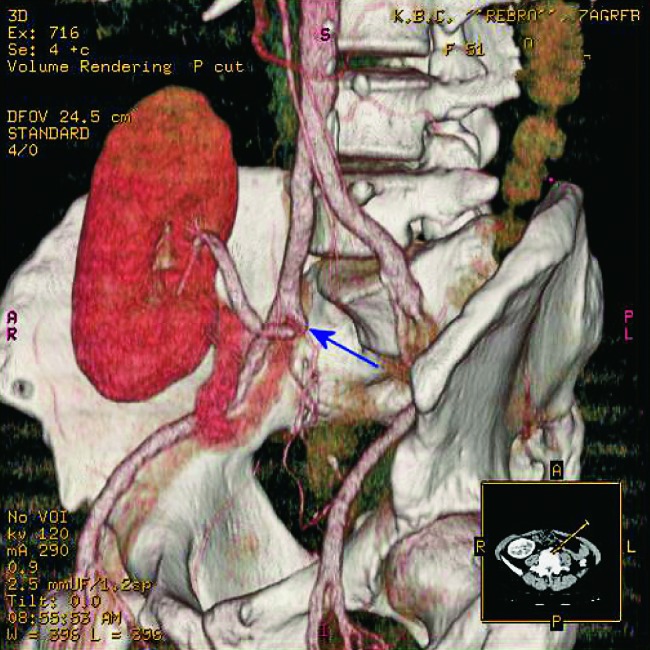
CT angiography, 3D. Stenosis of the post-anastomosis part of the renal artery on a short segment (arrows).
Fig. 34.
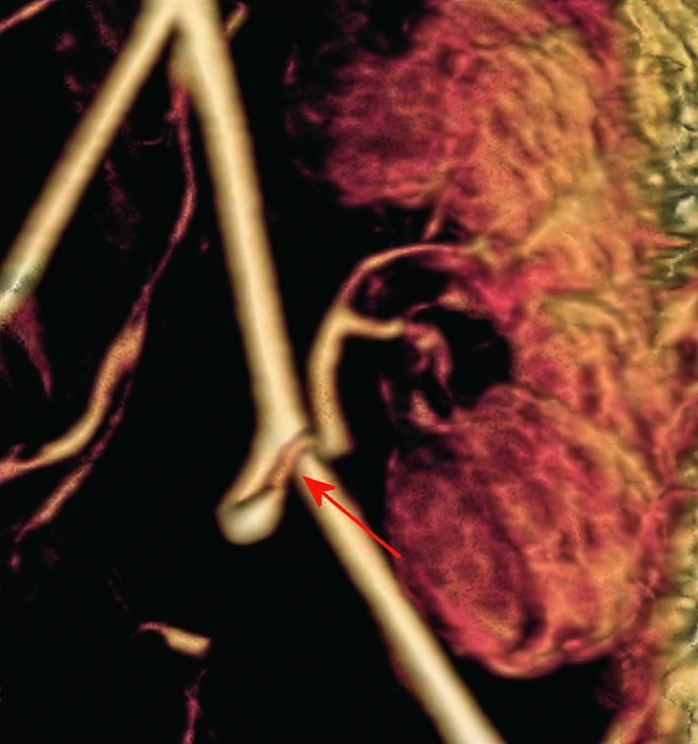
MR angiography 3D, the same patient. Stenosis of the main renal arterial tree on anastomosis with iliac artery, confirmation of diagnosis made using Doppler.
Digital subtraction angiography (DSA) is no longer recommended for diagnostic purposes, but only for therapeutic purposes (13). Percutaneous transluminal angioplasty (PTA) with angioplasty balloon dilatation is the therapeutic method of choice for renal artery stenosis. Technical success ranges from 60% to 94%, and complications occur in 4%-10% of cases. Complications include dissection, rupture and thrombosis of renal artery. Indications for stent placement are as follows: if diastolic pressure is greater than 10 mm Hg after PTA, if there is residual stenosis greater than 30% after PTA, and if there is a dissection of the intima with luminal compromise (13). Restenosis after PTA occurs in 5%-30% of patients 6-8 months after the intervention. In those patients, re-PTA or stent placement can be performed, with restenosis percentage below 10%. Clinical success after PTA procedure is defined as more than 15% reduction in serum creatinine level (Fig. 35), more than 15% reduction in mean diastolic blood pressure with the number of antihypertensive medications equal to that before PTA, or more than 10% reduction in mean diastolic blood pressure with a reduction in the number of antihypertensive medications. PTA is successful in 85%-93% of cases with reduction in serum creatinine levels, and in 63%-83% with reduction in blood pressure.
Fig. 35.
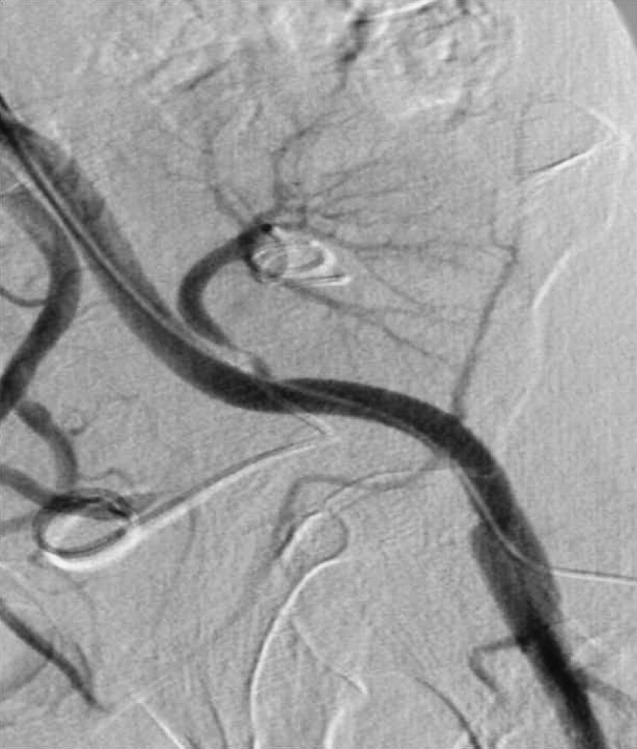
DSA. Renal artery stenosis immediately after the anastomosis. Serum creatinine value before endovascular treatment of 180 mmol/L with BP 180/110.
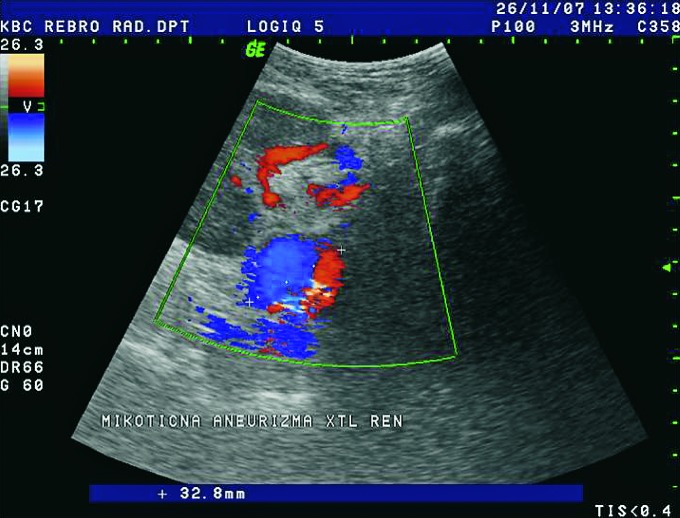
Aneurysmatic dilatation of the renal arteries is easily shown using Doppler and must be differentiated from dilated pyelon. Waveform analysis of the aneurysm demonstrates typical bidirectional flow (to and from pattern) (Fig. 36). There are 3 groups of aneurysms: poststenotic, mycotic and iatrogenic.
Fig. 36.
Color Doppler. Aneurysm of renal artery with diameter of 32 mm, mycotic etiology.
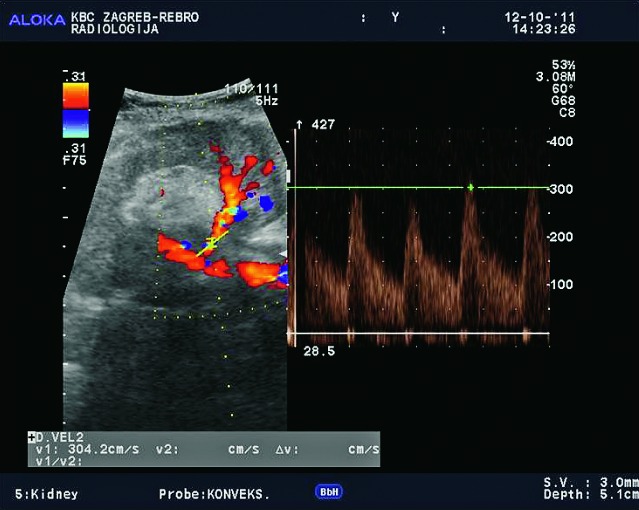
Arteriovenous fistula (AVF) and pseudoaneurysm (PA) form intrarenally, as a result of renal biopsy. AVF may form when an artery and vein are lacerated, whereas PA results when only the artery is lacerated. Doppler US is the modality of choice for detection of those iatrogenic lesions (5, 7). When using color Doppler by increasing the pulse repetition frequency to a level where the normal intrarenal vasculature is not visualized, only the abnormal high flow within the AVF and PA can be visualized (Fig. 37). Spectral Doppler analysis shows elevated PSV of over 3 m/s with only the arterial flow component in PA or arterialization of a venous waveform in AVF. Both PA and AVF usually resolve spontaneously but regular Doppler follow up is required. In rare instances, an AVF may be large enough to cause decreased graft perfusion leading to graft dysfunction. In those cases, they can be effectively treated with endovascular embolization.
Fig. 37.
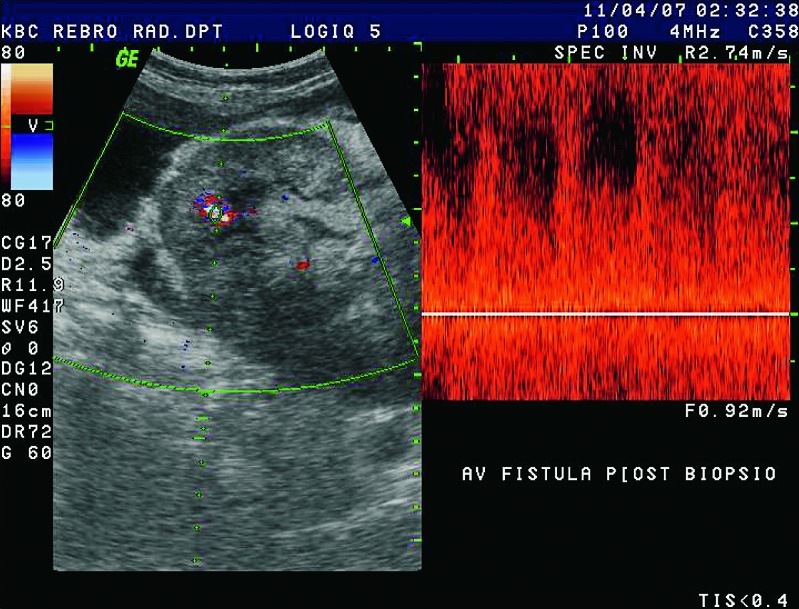
Color and pulsed Doppler. After biopsy, there was an irregular vascular lesion in renal parenchyma, detectable at high flow rates. Typical mixing of arterial and venous high-speed flow is suggestive of AVF.
IV. Focal parenchymal abnormalities
Parenchymal abnormalities are grouped into focal and diffuse. The most important focal abnormality is a tumor mass such as renal cell carcinoma and post-transplant lymphoproliferative disorder (PTLD) (35). Renal cell carcinomas have the same appearance in native and in transplanted kidneys (Fig. 38). On the other hand, PTLD occurs only in transplanted kidneys and is a direct sequel of immunosuppression. It is connected to Epstein-Barr virus infection following transplantation, and occurs in less than 1% of patients. PTLD may present as perihilar soft tissue thickening, perinephric masses and lymphadenopathy (Fig. 39). When diagnosed early, PTLD may regress after reduction of immunosuppressive agents, but if untreated it can progress to aggressive lymphoma. Other focal renal abnormalities such as focal infarction and renal abscess as a complication of pyelonephritis have been described earlier in the text. Renal cysts are usually parenchymal, containing clear fluid and should be monitored for their growth, which is rare in transplanted kidneys.
Fig. 38.
Contrast enhanced CT, axial view. Hypervascularized tumor in the transplanted kidney. CT urography shows a solid tissue mass in the upper pole of the transplanted kidney. Histologically proven hypernephroma.
Fig. 39.
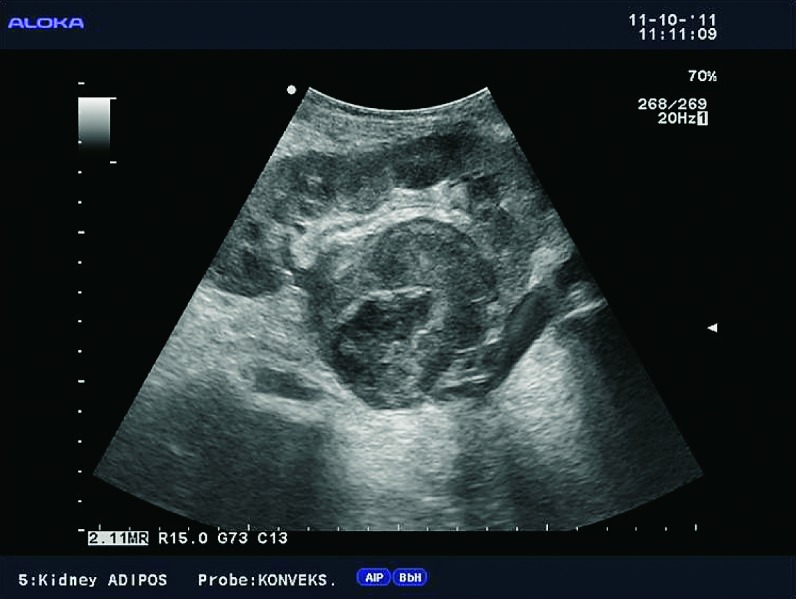
B-mode ultrasound image. Large solid mass located in the hilus of the transplanted kidney. The differential diagnosis includes hypernephroma, PTLD, and abscess.
V. Diffuse parenchymal abnormalities
Diffuse parenchymal abnormalities include acute tubular necrosis, hyperacute rejection, acute rejection, chronic rejection, and drug-induced nephrotoxicity.
Hyperacute rejection is caused by the presence of preformed antibodies in the recipient’s serum. It occurs immediately after the surgery, sometimes even at the end of the operation.
Histopathologic finding is microvascular thrombosis, which spreads from the periphery to the renal hilus, with graftectomy as the final outcome. Color Doppler shows complete absence of arterial and venous flow in transplanted kidney (Fig. 40).
Fig. 40.
Power Doppler. Kidney transplant immediately after transplantation with no signs of blood flow due to hyperacute rejection.
Acute tubular necrosis (ATN) is a common cause of anuria in the postoperative period (36). Histopathologic finding is necrosis of tubular cells that relates to ischemic time and reperfusion injury. Bridging dialysis is often required for delayed graft function, for about 1-2 weeks after the surgery.
Acute rejection is a cellular immune response of the recipient, which identifies the transplanted kidney as a foreign body. It usually occurs 1-3 weeks after surgery, very rarely in the first week after transplantation. It is the time of occurrence that separates acute rejection from ATN, but these two complications overlap during the second week. Clinical presentations vary from mild forms, which are almost asymptomatic, to severe forms with fatigue, pain, fever and graft dysfunction. Acute rejection can be reversed with high doses of corticosteroids. Because of the advances in immunotherapy following transplantation, the incidence of acute rejection has significantly decreased from former 50% to 10%-40%.
The use of new immunosuppression drugs such as cyclosporine, tacrolimus, sirolimus and others has significantly reduced acute rejection and improved the success of transplantations, but their nephrotoxicity remains a problem. Ultrasound and Doppler are generally of little help as nephrotoxicity has a variable effect on kidney morphology and intrarenal Doppler spectrum. The results vary from almost normal to elevated RI, which can require renal biopsy for specific diagnosis and further treatment.
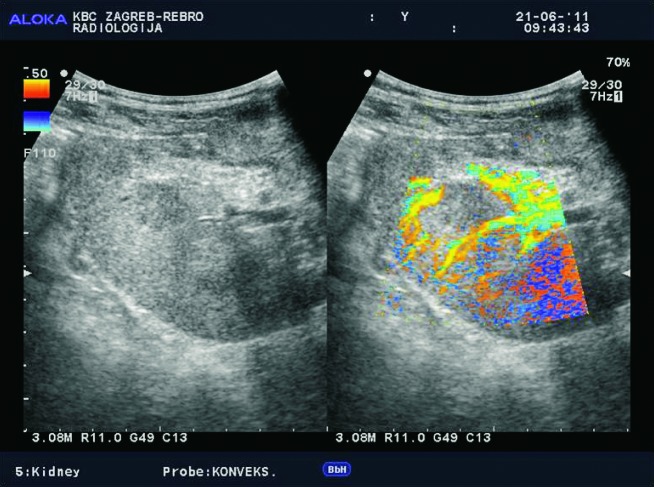
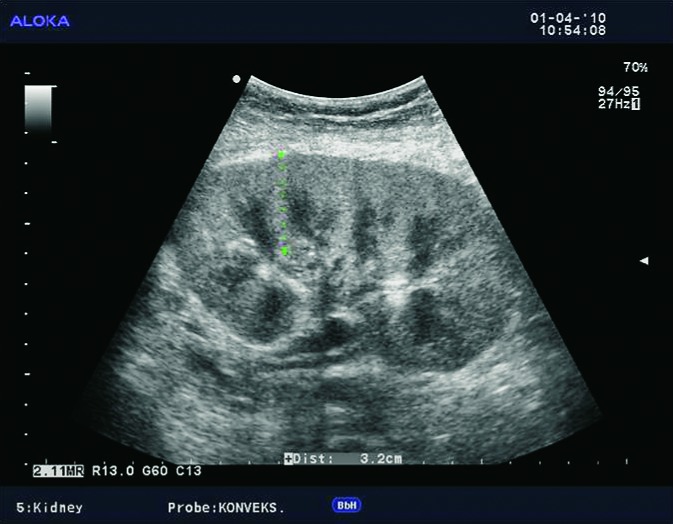
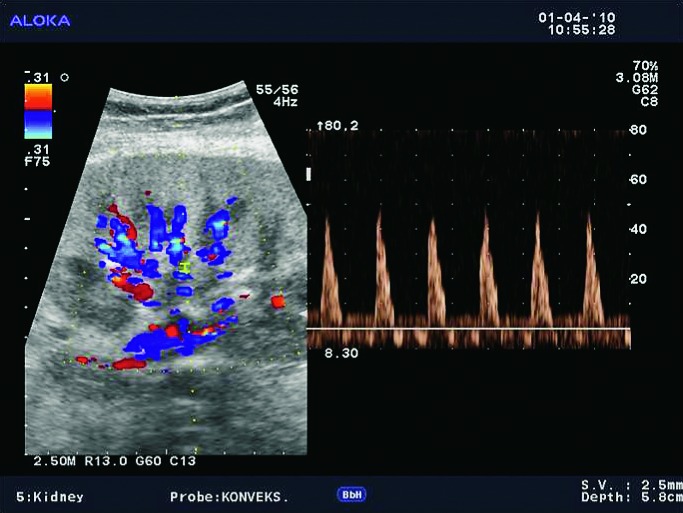
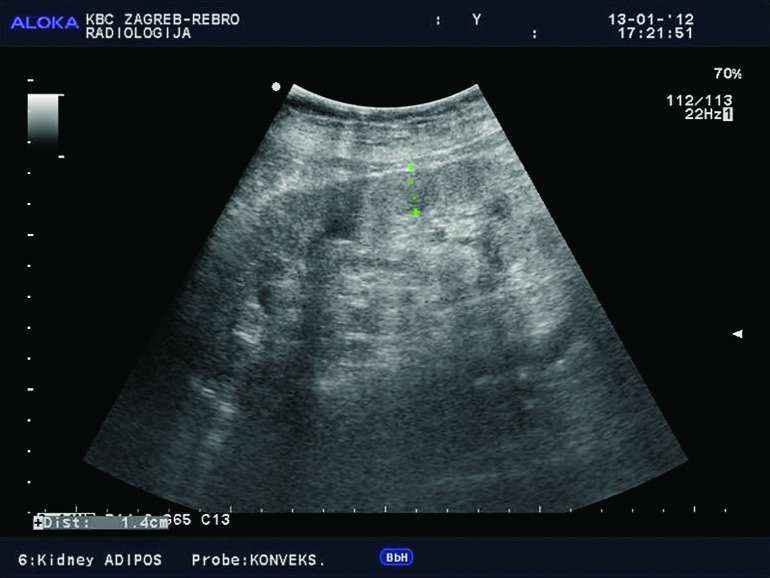
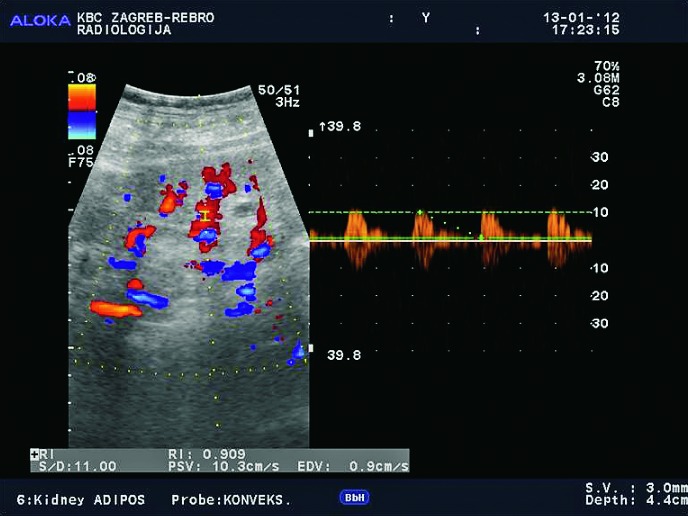
For all three diffuse parenchymal complications, i.e. acute rejection, acute tubular necrosis and nephrotoxicity, B-mode ultrasound presentation can be identical (5). It shows an enlarged kidney in both diameters, with thickened and hyperechogenic parenchyma, with prominent pyramids and effacement of the renal sinus. In mild forms of these complications, there is no visible effect on Doppler, whereas in more severe forms there may be reduction in diastolic flow with high RI. The values of RI are above 0.80 (normal range is up to 0.70), due to decreased diastolic flow which is an important but not specific finding. In the most severe forms of acute rejection, RI can be 1.0, and diastolic flow absent or even reversed (22, 23) (Fig. 41 a,b).
Fig. 41a.
B-mode ultrasound image. Enlarged kidney, with thickened and hyperechogenic parenchyma, with prominent pyramids and narrowed renal sinus.
Fig. 41b.
Pulsed Doppler. The altered intrarenal arterial spectrum without diastolic flow, even with triphasic spectrum. Acute rejection proven with biopsy.
Considering that it is impossible to differentiate among these three complications using Doppler, renal biopsy is the gold standard for diagnosis. The role of Doppler is monitoring of patients with delayed graft function 2-3 times per week, until graft function is established and RI values are normal. Besides measuring RIs using Doppler, it is also important to sonographically exclude vascular occlusion, ureteral obstruction, and postoperative hematoma that can compress and occlude the ureter and renal vein.
In these diffuse parenchymal complications, CT demonstrates decreased graft enhancement, with no contrast excretion in excretory phase, which is initially of little diagnostic value.
Loss of corticomedullary differentiation on T1-weighted images on MRI was initially considered the most consistent MRI finding in acute rejection. However, further studies have shown that there is loss of corticomedullary differentiation also with other diffuse parenchymal complications. To conclude, the loss of corticomedullary differentiation on T1-weighted images is nonspecific but indicative of the presence of diffuse parenchymal complications and impaired graft function (11, 17).
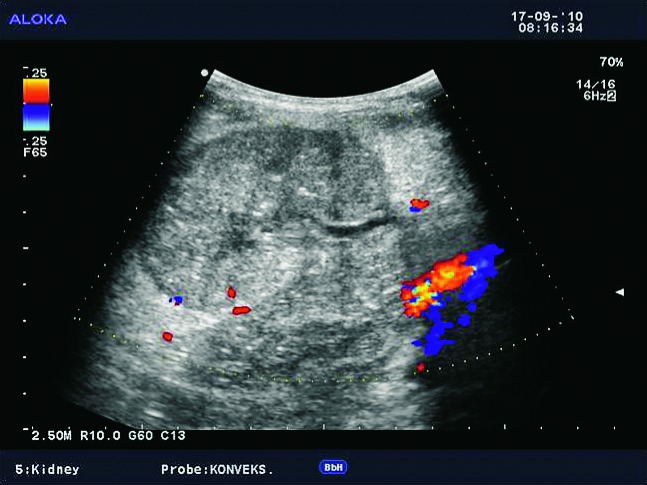
Chronic transplant dysfunction is the most common cause of later deterioration of renal graft function, and previous episodes of acute rejection are also a risk factor (Fig. 42). The role of Doppler ultrasound in diagnosing chronic rejection is limited, although certain findings may indicate chronic changes. On ultrasound exam, renal transplant may be smaller, with reduced and hyperechogenic parenchyma and mild hydronephrosis (37).
Fig. 42.
Color Doppler. Afunctional and avascular transplanted kidney located in the right iliac fossa.
Doppler exam can show reduction of intrarenal arborization, lower flow rate values intrarenally with elevated RIs (Fig. 43a-d). The role of Doppler is limited in chronic renal dysfunction, infection, or glomerulonephritis, in contrast to renal artery stenosis, renal artery aneurysms or arteriovenous fistula, when Doppler ultrasound is the method of choice in detection of those renal transplant complications.
Fig. 43a.
B-mode ultrasound image. Kidney with moderately reduced and hyperechogenic parenchyma in long-term graft.
Fig. 43b.
Color Doppler. Substantial reduction in intrarenal arborization, the same patient.
Fig. 43c.
Pulsed Doppler. Intrarenal atypical spectrum, extremely low flow rates of about 10 cm/s, the same patient.
Fig. 43d.
Pulsed Doppler. Renal artery shows still normal flow rates of about 1 m/s, but with high-resistance waveform and almost no diastolic flow. All the above indicates chronic graft dysfunction.
New Diagnostic Methods – Contrast Enhanced Sonography, Functional MRI Techniques
New diagnostic methods (contrast enhanced sonography, functional MRI techniques) indicate a potential future direction of radiological diagnostic methods for transplanted kidney. It is an important physiological fact that the blood flow in large intrarenal blood vessels does not correlate with intrarenal parenchymal perfusion in transplanted kidney (38).
Kidney autonomously regulates blood flow at capillary level to maintain cortical and medullary perfusion and oxygenation. With mild, but also with more severe forms of diffuse parenchymal complications, parenchymal renal perfusion remains sufficient for normal kidney function. On Doppler ultrasound and nuclear isotopic methods, renal perfusion is measured only in segmental and interlobar renal arteries, whereas contrast enhanced sonography and functional MRI techniques provide measurement of cortical and medullary perfusion, after the blood has passed the glomerular unit. Contrast enhanced sonography provides information on microvascular parenchymal perfusion, and also provides quantitative measurements, which can be useful in chronic graft dysfunction (39-41). Functional MRI techniques are divided into four main groups: MRI perfusion techniques with the use of gadolinium, USPIO (Ultrasmall Superparamagnetic Iron Oxide)-MRI technique, FISP (fast imaging with steady-state free precession) ASL (arterial spin labeling) MRI, and BOLD (blood oxygen level dependent) MRI (42-46).
Magnetic resonance imaging perfusion techniques with the use of gadolinium have presented the following: medullary blood flow was significantly lower in subjects with acute renal rejection compared to the group with ATN and in normal subjects. Cortical blood flow was higher in normal subjects than in those with acute rejection and ATN, which showed no difference. The FISP ASL (arterial spin labeling) MRI technique uses blood as an endogenous contrast agent and enables measurement of cortical and medullary perfusion of the transplanted kidney without the use of gadolinium, which is a big advantage. USPIO-MRI represents marking the macrophages (specific inflammatory cells in nephropathy) using USPIO particles (ultra-small paramagnetic iron oxide particles). The study concludes that the signal intensity in acute rejection drops in the medulla and cortex, whereas in ATN it drops only in the medulla. BOLD (blood oxygen level dependent) MRI is one of the functional methods that measures deoxyhemoglobin in the renal parenchyma. The amount of deoxyhemoglobin in the medulla was significantly lower in subjects with acute renal rejection, compared to those of normal subjects and those with ATN.
In conclusion, the use of contrast enhanced sonography and especially functional MRI techniques points to the possibility of resolving the most complex problem in kidney transplantation, i.e. distinguishing between diffuse parenchymal abnormalities. The main guiding idea is finding a reliable and sensitive method in differentiating diffuse parenchymal abnormalities and avoiding invasive renal biopsy, which at the present stage of development is still the gold standard. However, it should be pointed out that none of these techniques has been established in everyday radiological analysis of patients with transplanted kidneys, mainly due to the small number of test subjects, lack of cut-off values and lack of an established research methodology. Although promising, these methods require further improvements in terms of a uniformed methodology and larger clinical studies leading to more solid results. Until then, we can conclude that Doppler ultrasound remains the primary diagnostic tool and primary radiological method in detection of complications in the transplanted kidney (47).
References
- 1.Allan PL. Ultrasonography of the native kidney in dialysis and transplant patients. J Clin Ultrasound. 1992;20:557–67. 10.1002/jcu.1870200810 [DOI] [PubMed] [Google Scholar]
- 2.Herz DB, McLorie GA, Ashraf T, Rodgers-Herz C, El-Ghoneimi A, Shuckett B, et al. High resolution ultrasound characterization of early allograft hemodynamics in pediatric living related renal transplantation. J Urol. 2001;166:1853–8. 10.1016/S0022-5347(05)65704-7 [DOI] [PubMed] [Google Scholar]
- 3.Friedewald SM, Molmenti EP, Friedewald JJ, DeJong MR, Hamper UM. Vascular and nonvascular complications of renal transplants: sonographic evaluation and correlation with other imaging modalities, surgery, and pathology. J Clin Ultrasound. 2005;33:127–39. 10.1002/jcu.20105 [DOI] [PubMed] [Google Scholar]
- 4.Irshad A, Ackerman S, Sosnouski D, Anis M, Chavin K, Baliga P. A review of sonographic evaluation of renal transplant complications. Curr Probl Diagn Radiol. 2008;37:67–79. 10.1067/j.cpradiol.2007.06.001 [DOI] [PubMed] [Google Scholar]
- 5.Baxter GM. Ultrasound of renal transplantation. Clin Radiol. 2001;56:802–18. 10.1053/crad.2001.0812 [DOI] [PubMed] [Google Scholar]
- 6.O’Neill WC, Baumgarten DA. Ultrasonography in renal transplantation. Am J Kidney Dis. 2002;39(4):663–78. 10.1053/ajkd.2002.31978 [DOI] [PubMed] [Google Scholar]
- 7.Pozniak MA. Doppler ultrasound evaluation of transplantation. In: Allan PA, Dubbins PA, McDicken WN, Pozniak MA, editors. Clinical Doppler Ultrasound. Churchill Livigstone Elsevier 2007; 215-27. [Google Scholar]
- 8.Pelling M, Dubbins PA. Doppler and color Doppler imaging in acute transplant failure. J Clin Ultrasound. 1992;20:507–16. 10.1002/jcu.1870200804 [DOI] [PubMed] [Google Scholar]
- 9.Gayer G, Apter S, Katz R, Ben-David A, Katzir Z, Hertz M. CT findings in ten patients with failed renal allografts: comparison with findings in functional grafts. Eur J Radiol. 2000;36:133–8. 10.1016/S0720-048X(00)00162-5 [DOI] [PubMed] [Google Scholar]
- 10.Sebastià C, Quiroga S, Boyé R, Cantarell C, Fernandez-Planaz M, Alvarez A. Helical CT in renal transplantation: normal findings and early and late complications. Radiographics. 2001;21:1103–17. 10.1148/radiographics.21.5.g01se131103 [DOI] [PubMed] [Google Scholar]
- 11.Fang YC, Siegelman ES. Complications of renal transplantation: MR rindings. J Comput Assist Tomogr. 2001;25(6):836–42. 10.1097/00004728-200111000-00002 [DOI] [PubMed] [Google Scholar]
- 12.Hohenwalter MD, Skowlund CJ, Erickson SJ, Hariharan S, Rilling WS, Crain MR, et al. Renal transplant evaluation with MR angiography and MR imaging. Radiographics. 2001;21:1505–17. 10.1148/radiographics.21.6.g01nv081505 [DOI] [PubMed] [Google Scholar]
- 13.Šurlan M, Popovič P. The role of interventional radiology in management of patients with end-stage renal disease. Eur J Radiol. 2003;46:96–114. 10.1016/S0720-048X(03)00074-3 [DOI] [PubMed] [Google Scholar]
- 14.Schwenger V, Hinkel UP, Nahm A-M, Morath C, Zeier M. Color Doppler ultrasonography in the diagnostic evaluation of renal allografts. Nephron Clin Pract. 2006;104:c107–12. 10.1159/000094445 [DOI] [PubMed] [Google Scholar]
- 15.Sutherland T, Temple F, Chang S, Hennessy O, Lee W-K. Sonographic evaluation of renal transplant complications. J Med Imaging Radiat Oncol. 2010;54:211–8. 10.1111/j.1754-9485.2010.02161.x [DOI] [PubMed] [Google Scholar]
- 16.Catalá V, Martí T, Diaz JM, Cordeiro E, Samaniego J, Rosales A, et al. Use of multidetector CT in presurgical evaluation of potential kidney transplant recipients. Radiographics. 2010;30:517–31. 10.1148/rg.302095080 [DOI] [PubMed] [Google Scholar]
- 17.Zhang JQ, Hu X, Wang W, Li X, Yin H, Zhang X. Multidetector row-CT in evaluation of living renal donors. Chin Med J (Engl). 2010;123(9):1145–8. 10.1016/j.transproceed.2010.06.002 [DOI] [PubMed] [Google Scholar]
- 18.Burgos FJ, Pascual J, Marces R, Garcia-Navas R, Gómez V, Ortuño J. The role of imaging techniques in renal transplantation. World J Urol. 2004;22:399–404. 10.1007/s00345-004-0412-1 [DOI] [PubMed] [Google Scholar]
- 19.Jurriaans E, Dubbins PA. Renal transplantation: the normal morphological and Doppler ultrasound examination. J Clin Ultrasound. 1992;20:495–506. 10.1002/jcu.1870200803 [DOI] [PubMed] [Google Scholar]
- 20.Chua GC, Snowden S, Patel U. Kinks of the transplant renal artery without accompanying intraarterial pressure gradient do not require correction: five-year outcome study. Cardiovasc Intervent Radiol. 2004;27:643–50. 10.1007/s00270-003-0156-0 [DOI] [PubMed] [Google Scholar]
- 21.Chow L, Sommer FG, Huang J, Li KCP. Power Doppler imaging and resistance index measurement in the evaluation of acute renal transplant rejection. J Clin Ultrasound. 2001;29:483–90. 10.1002/jcu.10010 [DOI] [PubMed] [Google Scholar]
- 22.McArthur C, Geddes CC, Baxter G. Early measurement of pulsatility and resistive indexes: correlation with long-term renal transplant function. Radiology. 2011;259(1):278–85. 10.1148/radiol.10101329 [DOI] [PubMed] [Google Scholar]
- 23.Mehrsai A, Salem S, Ahmadi H, Baradaran N, Taherimahmoudi M, Nikoobakht MR, et al. Role of resistive index measurement in diagnosis of acute rejection episodes following successful kidney transplantation. Transplant Proc. 2009;41:2805–7. 10.1016/j.transproceed.2009.07.050 [DOI] [PubMed] [Google Scholar]
- 24.Hélénon O, Correas JM, Chabriais J, Boyer JC, Melki P, Moreau JF. Renal vascular Doppler imaging: clinical benefits of power mode. Radiographics. 1998;18(6):1441–54. 10.1148/radiographics.18.6.9821193 [DOI] [PubMed] [Google Scholar]
- 25.Gedroyc WMW, Negus R. Magnetic resonance angiography of renal transplants. Lancet. 1992;339:789–91. 10.1016/0140-6736(92)91905-N [DOI] [PubMed] [Google Scholar]
- 26.Martinoli C, Crespi G, Bertolotto M, Rollandi GA, Rosenberg I, Pretolesi F, et al. Interlobular vasculature in renal transplants: a power Doppler US dtudy with MR vorrelation. Radiology. 1996;200:111–7. 10.1148/radiology.200.1.8657897 [DOI] [PubMed] [Google Scholar]
- 27.Levarda-Hudolin K, Hudolin T, Basic-Jukic N, Kastelan Z. Oral lesions in kidney transplant patients. Acta Clin Croat. 2016;55:3 10.20471/acc.2016.55.03.15 [DOI] [PubMed] [Google Scholar]
- 28.Shaw JFL. Ultrasound assessment of the problem kidney transplant: a surgical prospective. J Clin Ultrasound. 1992;20:553–5. 10.1002/jcu.1870200809 [DOI] [PubMed] [Google Scholar]
- 29.Blondin D, Koester A, Andersen K, Kurz KD, Moedder U, Cohnen M. Renal transplant failure due to urologic complications: comparison of static fluid with contrast-enhanced magnetic resonance urography. Eur J Radiol. 2009;69:324–30. 10.1016/j.ejrad.2007.10.026 [DOI] [PubMed] [Google Scholar]
- 30.Li X, Zhiyou H, Wei W, Yu Z, Juzhong G. Magnetic resonance urography in the diagnosis of urinary tract obstruction after renal transplantation. Chin Med J (Engl). 2002;115(4):540–2. [PubMed] [Google Scholar]
- 31.Sadowski EA, Bennett LK, Chan MR, Wentland AL, Garrett AL, Garrett RW, et al. Nephrogenic systemic fibrosis: risk factors and incidence estimation. Radiology. 2007;243(1):148–57. 10.1148/radiol.2431062144 [DOI] [PubMed] [Google Scholar]
- 32.Hilborn MD, Bude RO, Murphy KJ, Platt JF, Rubin JM. Renal transplant evaluation with power Doppler sonography. Br J Radiol. 1997;70:39–42. 10.1259/bjr.70.829.9059293 [DOI] [PubMed] [Google Scholar]
- 33.Kay DH, Mazonakis M, Geddes C, Baxter G. Ultrasonic microbubble contrast agents and the transplant kidney. Clin Radiol. 2009;64(11):1081–7. 10.1016/j.crad.2009.06.010 [DOI] [PubMed] [Google Scholar]
- 34.Lebkowska U, Janica J, Lebkowski W, Malyszko J, Lebkowski T, Leoniuk J, et al. Renal parenchyma perfusion spectrum and resistive index (RI) in ultrasound examinations with contrast medium in the early period after kidney transplantation. Transplant Proc. 2009;41(8):3024–7. 10.1016/j.transproceed.2009.08.023 [DOI] [PubMed] [Google Scholar]
- 35.Vrachliotis TG, Vaswani KK, Davies EA, Elkhammas EA, Bennett WF, Bova JG. CT findings in posttransplantation lymphoproliferative disorder of renal transplants. AJR Am J Roentgenol. 2000;175:183–8. 10.2214/ajr.175.1.1750183 [DOI] [PubMed] [Google Scholar]
- 36.Liou JTS, Lee JKT, Heiken JP, Totty WG, Molina PL, Flye WM. Renal transplants: can acute rejection and acute tubular necrosis be differentiated with MR imaging? Radiology. 1991;179:61–5. 10.1148/radiology.179.1.2006305 [DOI] [PubMed] [Google Scholar]
- 37.Deane C. Doppler and color Doppler ultrasonography in renal transplants: chronic rejection. J Clin Ultrasound. 1992;20:539–44. 10.1002/jcu.1870200807 [DOI] [PubMed] [Google Scholar]
- 38.Pallone TL, Zhang Z, Rhinehart K. Physiology of the renal medullary microcirculation. Am J Physiol Renal Physiol. 2003;284:F253–66. 10.1152/ajprenal.00304.2002 [DOI] [PubMed] [Google Scholar]
- 39.Scholbach T, Girelli E, Scholbach J. Dynamic tissue perfusion measurement: a novel tool in follow-up of renal transplant. Transplantation. 2005;79:1711–6. 10.1097/01.TP.0000164145.89275.02 [DOI] [PubMed] [Google Scholar]
- 40.Scholbach T, Scholbach J. Can we measure renal tissue perfusion by ultrasound? J Med Ultrasound. 2009;17:9–16. 10.1016/S0929-6441(09)60010-2 [DOI] [Google Scholar]
- 41.Schwenger V, Hinkel UP, Nahm AM, Morath C, Zeier M. Real-time contrast-enhanced sonography in renal transplant recipients. Clin Transplant. 2006;20(17):51–4. 10.1111/j.1399-0012.2006.00600.x [DOI] [PubMed] [Google Scholar]
- 42.Hauger O, Grenier N, Deminère C, Lasseur C, Delmas Y, Merville P, et al. USPIO-enhanced MR imaging of macrophage infiltration in native and transplanted kidneys: initial results in humans. Eur Radiol. 2007;17:2898–907. 10.1007/s00330-007-0660-8 [DOI] [PubMed] [Google Scholar]
- 43.Lanzman RS, Wittsack HJ, Martirosian P, Zgoura P, Bilk P, Kröpil P, et al. Quantification of renal allograft perfusion using arterial spin labeling MRI: initial results. Eur Radiol. 2010;20(6):1485–91. 10.1007/s00330-009-1675-0 [DOI] [PubMed] [Google Scholar]
- 44.Szolar DH, Preidler K, Ebner F, Kammerhuber F, Horn S, Ratschek M, et al. Functional magnetic resonance imaging of human renal allografts during the post-transplant period: preliminary observations. Magn Reson Imaging. 1997;15(7):727–35. 10.1016/S0730-725X(97)00088-X [DOI] [PubMed] [Google Scholar]
- 45.Thoeny HC, Zumstein D, Simon-Zoula S, Eisenberger U, De Keyzer F, Hofmann L, et al. Functional evaluations of transplanted kidneys with diffusion-weighted and BOLD MR imaging: initial experience. Radiology. 2006;241(3):812–21. 10.1148/radiol.2413060103 [DOI] [PubMed] [Google Scholar]
- 46.Wentland AL, Sadowski EA, Djamali A, Grist TM, Becker BN, Fain SB. Quantitative MR measures of intrarenal perfusion in the assessment of transplanted kidneys: initial experience. Acad Radiol. 2009;16(9):1077–85. 10.1016/j.acra.2009.03.020 [DOI] [PMC free article] [PubMed] [Google Scholar]
- 47.Sjekavica I. Radiological imaging techniques in renal transplantation. In: Basic-Jukic N, Kastelan Z, editors. Kidney Transplantation. Zagreb: Medicinska naklada, 2015; p. 464-98. [Google Scholar]


