Abstract
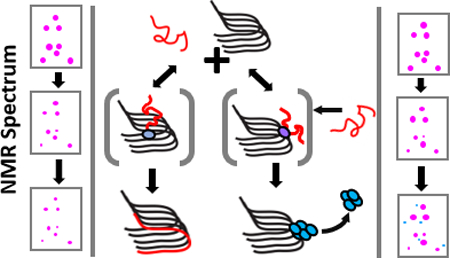
Using NMR to probe transient binding of Aβ1–40 monomers to fibers, we find partially bound conformations with the highest degree of interaction near F19-K28 and a lesser degree of interaction near the C-terminus (L34-G37). This represents a shift away from the KLVFFA recognition sequence (residues 16–21) currently used for inhibitor design.
Graphical Abstract

Monomer interactions with the surface of amyloid fibers can redirect the aggregation pathway, changing both the kinetics of the process and generating potentially toxic new species. Small oligomers form rapidly in samples seeded with amyloid fibers, but slowly in their absence.1 Like the nature of the surface associated states, little is known experimentally about the process of either fiber elongation or secondary nucleation on the molecular level.2 Experiments have proven particularly challenging due to the inherently heterogenous and evolving nature of the sample.3 In the absence of experimental data on the molecular level, molecular dynamics simulations have been used to explore the monomer-fiber binding landscape. The reported results suggest a rugged landscape for the fiber elongation4, 5 with both productive and non-productive binding modes.6–10
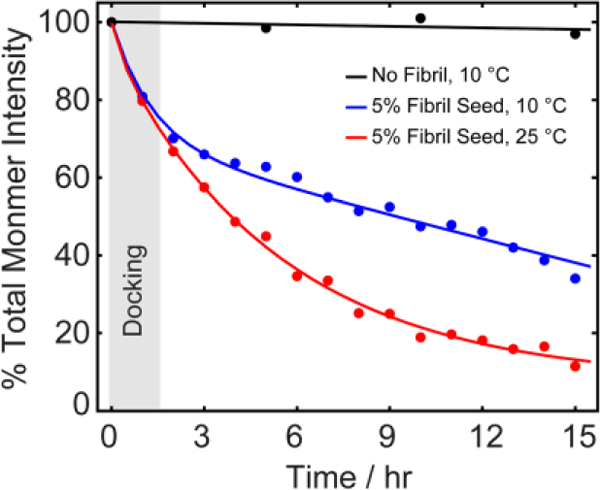
Many questions remain on the molecular determinants of the fiber-monomer interaction. Here, we take advantage of the broadening of NMR peaks due to exchange between unbound Aβ1–40 and fiber-associated monomers in a sample seeded with amyloid fibers to indirectly observe the docked state. The SOFAST-HMQC experiment offers a unique ability to monitor Aβ aggregation at atomic resolution without the time constraints typical of most 2D NMR experiments,11 allowing the kinetic processes of fibril assembly to be monitored with residue specificity. As a control, we first measured the rate of monomer loss in unseeded solutions of Aβ1–40 through sequentially acquired 1H-15N SOFAST-HMQC spectra. In the absence of a fibril seed, the signal remained invariant over 15 hours, with a negligible change in either signal intensity (Fig. 1, black circles) or chemical shift. The absence of any significant changes indicates that freshly dissolved Aβ1–40 is, if not necessarily entirely monomeric in nature, at least conformationally stable under these conditions on the time-scale of our experiments and does not form new oligomers or aggregates to any detectable extent in the absence of fibers.12
Figure 1.

Kinetics of aggregation of Aβ1–40 with and without 5 mol % fiber seeds monitored by 2D 1H-15N SOFAST-HMQC NMR (Figs.S1 and S2). Each data point represents the total intensity summed over all monomer peaks (Fig. S2). The two observable phases at 10 °C indicate two kinetically distinct processes with the grey shaded vertical bar indicating the time-scale in which the first kinetic phase (docking mechanism) is dominant. The peak center was adjusted for each time-point in the intensity calculation; experimentally measured ranges of chemical shift changes with time are given Fig. S1.
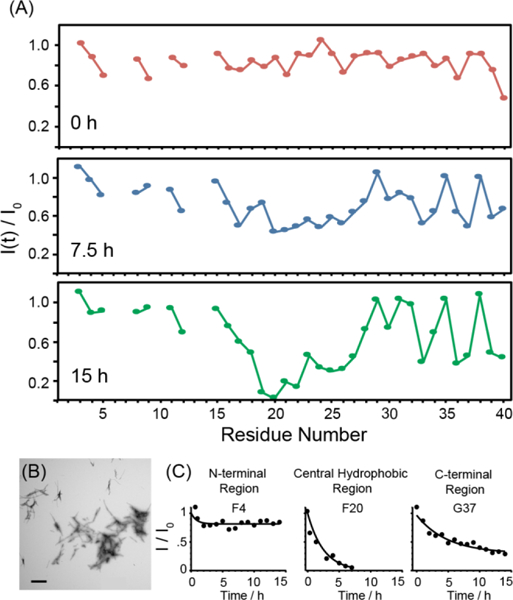
To initiate fiber growth in the sample, we seeded the reaction with 5 mol% preformed fibers prepared by incubating a 150 μM Aβ1–40 sample for 48 hours at 37 °C with constant agitation. The final result of this process is the formation of short, straight and largely unbranched amyloid fibers as shown in the TEM image in Fig. 2B. Seeding the aggregation reaction with these fibers resulted in complex time-dependent changes in the 2D 1H-15N SOFAST HMQC spectra (Fig. S2), suggesting an underlying dynamic process that is not present in the absence of fibers. The evolution of the signal was dependent on the temperature of the sample. At both 10 and 25 °C there was a near uniform drop in intensity within the first scan (Fig. 1) which was larger in magnitude at 25 then 10 °C. After the first scan, the peaks from both samples continued to decrease in intensity. Unlike the initial drop, this decrease was not uniform throughout the peptide backbone. At both temperatures, the data show a distinct variation along the peptide backbone, which is initially slight but increases substantially as time progresses (Figs. 2, S3, and S4). At 10°C, the intensity of the peaks for first 15 residues remained constant during the initial drop (Figs. 2A and S3). By contrast, the intensity of the peaks corresponding to the central residues from K16 to K28 continued to drop as the experiment progressed until they became nearly undetectable after 4 hours. The C-terminal residues showed a periodic pattern with the peaks corresponding to the most hydrophobic residues (L34, V36, V39 and V40) strongly decreased in intensity and the relatively more hydrophilic residues (G33, M35, G38) showing little change. The time series at 25 °C replicates most of the features observed at 10 °C except the overall signal intensity decreases much more rapidly and the intensity changes are more uniform throughout the peptide backbone. The rapid loss of signal at 25 °C confirms the fibers can form normally under these conditions but the process is slow at lower temperatures.
Figure 2.

(A) Time dependent variation of the peak intensities along the peptide backbone measured from 2D 1H-15N SOFAST-HMQC spectra of a freshly dissolved 80 μM Aβ1–40 sample with 5 mol% fiber seeds at 10 °C. Points represent the signal intensity of the peak maxima (I(t)) relative to the signal intensity in the absence of fiber seeds (Io). (B) Electron micrograph of the preformed amyloid seeds. (C) Time traces for representative residues in the N-terminal, central hydrophobic, and C-terminal regions of the peptide. Time traces for all residues can be found in the supporting information.
There are three possible explanations for the intensity changes. The most straightforward explanation is that the signal decrease simply represents the loss of monomeric peptide to a species that is unobservable on the solution NMR time scale. In general, large aggregates like amyloid fibers give rise to very broad signals that are not detectable in solution NMR experiments. The signal from these aggregates is only detectable if substantial local mobility at specific sites averages out the line-broadening interactions for those particular residues.13 Such mobility does not exist in the fiber conformation, where most residues outside the N-terminus are locked into a relatively rigid β-sheet conformation tightly packed against the fiber body. Fiber elongation is therefore expected to decrease the intensity uniformly throughout the peptide backbone as it represents the loss of the entire molecule.
The variation across the peptide backbone argues against this simple interpretation as being fully responsible for all the changes. In particular, the absence of any changes at the N-terminus beyond the initial ~10% decrease in the first scan (Figs. 2A and S3) argues strongly against fiber elongation as major mechanism for signal loss at 10 °C, as these residues are expected to be broadened beyond detection along with the rest of the peptide backbone.14 Other explanations must therefore be considered.
A second possibility is that the changes are the result of exchange effects from reversible binding to the fiber surface. Previous kinetic experiments have shown that the initial association of the Aβ1–40 monomer with fibers15 and other types of oligomers12, 16–18 is weak and reversible with exchange happening on the millisecond timescale. The influence of the fiber on the spectra is manifested indirectly through exchange processes between the unbound and bound forms. Depending on the timescale of exchange and chemical shift difference between the bound and unbound states, the peaks in the SOFAST-HMQC spectra will either broaden due to intermediate exchange or the peak position will shift due to fast exchange, with approximate exchange life time, τex, of ~1–10 ms or 1 μs-1 ms, respectively.
While such a mechanism can account for some of the observed changes, it does not account for all of them. Intriguingly, a new set of peaks reproducibly appears in the later stages of aggregation measured at 10 °C (Fig. 3 and S5). These peaks do not appear for those samples incubated without fiber seeds indicating their production is dependent on, or catalyzed by, the fiber surface. HPLC and mass spectroscopy confirmed that such peaks are not the result of impurities or peptide degradation (Fig. S6). Interestingly, the intensity buildups measured for three of the new peaks associated with residues G25, G33, and G37 nearly match the intensity decrease observed for the peaks corresponding to the unbound form of these residues (Figs. 3 and S7); a strong indication that these peaks are in slow exchange. No new peaks were observed at 25°C, likely due to an increase in the exchange rate at higher temperature. Interestingly, the new peaks arise mostly from residues near the C-terminus and, to a lesser extent from the N-terminus, with few new peaks arising from the central region (K16-K28) (Fig. 4). Since no changes were observed in this time frame in the absence of fibers, the most likely explanation for the new peaks is that they originate from a new oligomer species whose formation is catalyzed by the interaction of monomers with the surface of fibers.8, 10
Figure 3.

(A) New peaks appeared with time when the sample (80 μM Aβ1–40) was seeded with 5 mol % fibers at 10 °C. 1D spectral slices are given in Fig. S7. (B) Time evolution of the monomers (red) and apparent exchange peaks (blue) G25 (circles), G33 (triangles), G37 (diamonds). Full 1H-15N SOFAST-HMQC spectra are shown in Fig. S2.
Figure 4.

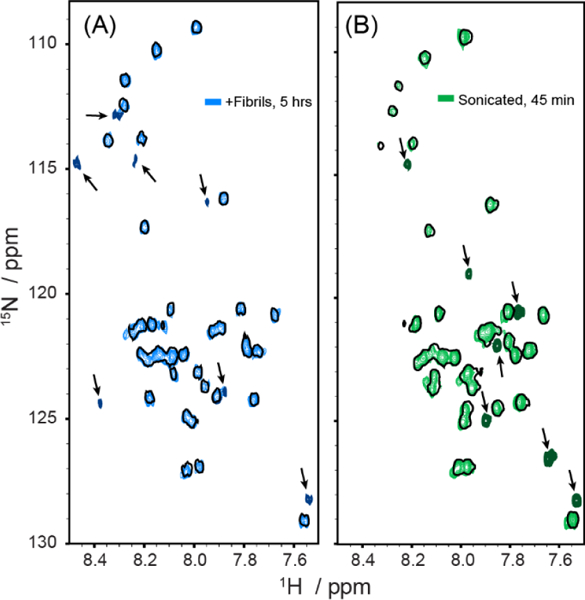
Sonication accelerated the formation of new peaks. Spectra acquired before the addition of preformed fibers are shown in single black contours. New peaks (indicated by the arrows) in 1H-15N SOFAST-HMQC spectra start to appear after 5 hours of incubation with 10% fiber seeds (A) but after only 45 min if the sample was sonicated after the addition of seeds (B).
The above experiments localize the initial association to specific sites on the monomer. They do not provide any information on the corresponding interaction sites on the fiber. Since such information is difficult to obtain directly through NMR or other techniques, we again resort to indirect methods. To identify possible association sites on the fiber body, we repeated the real-time SOFAST-HMQC experiment with intermittent sonication of the sample for 2 minutes after every 90 minutes of incubation, enough to mechanically fragment unstable long fibers to generate new fiber ends but not enough to disrupt smaller oligomers or to cause proteolysis.19 Sonication creates new fiber ends while preserving the surface area along the long axis of the fiber. It therefore provides a mechanism for identifying the probable site of oligomer formation on the fiber surface. If oligomers are formed primarily at the ends of fibers, the expected result is an acceleration of the time-dependent changes seen in the absence of sonication. On the other hand, sonication should have little effect if oligomers are primarily formed along the fiber body.
In the absence of sonication, new peaks were detectable only after 5 hours of the addition of fibers (Fig. 3). When the fibers are sonicated, similar (but not identical) new peaks were detected 45 minutes after the addition of fibers (Fig. 4). Some new peaks formed by fiber fragmentation after sonication are in similar positions as those formed during aggregation. For example, following sonication minor peaks can be detected in the vicinity of V40 and G33 (Fig. 4B). Similar peaks were also detected in nearly identical positions 9 hours after the addition of fibers, suggesting these peaks arise from the creation of new oligomeric species at the fiber ends. However, the pattern of new peak formation is not identical; several new peaks appear after sonication that do not have a close analogue with any new peaks appearing during aggregation (Fig. 4B). The overall correspondence does suggest an overall similarity between the two processes.
The results from this study offer a first glimpse into the molecular processes underlying secondary nucleation during the Aβ fiber elongation process. Before discussing the results, it is important to recognize some of the limitations of the techniques used in this study. First, the bound states are not detected directly; rather their existence and properties are only inferred by their exchange with the monomeric state. To infer the bound state of Aβ monomers, the fiber elongation process had to be slowed down to a rate amenable to analysis by the use of non-physiological low temperatures. The method also does not provide a complete sampling of all bound states. Monomers with slow exchange rates have T2 (i.e. the spin-spin relaxation time) values similar to the amyloid fiber and are therefore undetectable by solution NMR. Because not all states are sampled and the chemical shift of the bound state is unknown, the results are entirely qualitative - they point to the existence of certain states but do not provide quantitative information on their prevalence. Finally, the qualitative results may not hold for all fiber conformations. In this study, short fibers produced by seeded aggregation with mechanical agitation20 were used to generate a detectable population of bound Aβ that is not yet incorporated into the fiber. The possibility must be considered that other fiber morphologies, such as those prepared under quiescent conditions, may have different bound states.
Recognizing these limitations, some details of the association of monomers with fibers emerge that were previously inaccessible to experimental studies. The most detailed examination to date of the binding of soluble Aβ to a fiber-like species at the molecular level was done by Fawzi et al, who used saturation transfer experiments to obtain quantitative estimates of binding to amyloid protofibers at the residue level.12, 16, 17 The highest affinity for the protofiber surface was found in two stretches on the monomer (K16–G25 and K28–G37) that roughly correspond to the residues forming β-sheets in the fiber model.21 However, distinct structural differences exist between protofibers and mature amyloid fibers that translate to differences in site-specific binding affinity.21 Protofibers are intermediates created when a high concentration (>150 μM) of monomeric Aβ is incubated in vitro12 which differs structurally from mature fibers in their supramolecular organization. In contrast to the relatively long straight morphology of amyloid fibers (Fig. 2B), protofibers are short, worm-like aggregates of irregular shape with a lower amount of stable hydrogen bonded structure than mature amyloid fibers.22 Significantly, infrared spectroscopy suggests an antiparallel organization of the beta sheets rather than the parallel orientation found in amyloid fibers33 with different contacts among the core than in amyloid fibers.31 NMR studies have also suggested the β-strands to be shorter in protofibers than that in amyloid fibers,23 and that the side-chains of protofibers are more dynamic.21 The difference in structures translates to a difference in properties between the two species. Protofibers exist in a stable equilibrium with monomeric Aβ12 and the transition between protofibers and monomeric Aβ is readily reversed by dilution.14 In contrast, the equilibrium concentration of monomer with amyloid fibers is very low (<1 μM) and the thermodynamic equilibrium strongly favors eventual fiber formation.24, 25
Molecular details of the association steps involved in fiber elongation have largely been unavailable. The experiments used to determine protofibrillar association require a kinetically stable, non-evolving sample. The same techniques that provided site specific, quantitative information on the stable monomer/protofiber system cannot be applied to the continuously evolving monomer/fiber system. A few low-resolution experiments have been attempted. Paramagnetic relaxation enhancement experiments using a fibril seed labeled at either A2 or A30 suggest that association of the monomer with the N-terminus of the fiber during the docking stage is rare.26 Our experiments offer a more detailed view and highlight important similarities and differences between association of the monomer in the fibers and protofibers. Like the protofiber /monomer system, we find the monomeric peptide can bind to the surface of the amyloid fiber in a tethered conformation with a great deal of mobility outside the few points of contact. The evidence for this is in the localized nature of the spectral changes shown in Fig 1. If the majority of the residues are in contact with the fiber, no matter how transiently, it is expected the spectral changes should vary smoothly and fairly consistently throughout the peptide. Instead we see three distinct regions with different pattern of changes in each region. This points to a binding conformation distinctly different from the final fiber conformation where all the residues outside of the eight N-terminal ones are involved in stabilizing the fiber structure.
While both fibers and protofibers have loosely bound surface associated states, the binding mode differs. In the protofiber-monomer system, the KLVFFA sequence from residues 16–21 of the monomer has the highest affinity for the protofiber surface.12, 16 In fully formed fibers, the main recognition sequence of the docked state is shifted towards the C-terminus, centered on the F19-N27 region of the incoming monomeric peptide (Figs 2A). The shift is significant as the KLVFF sequence has been implicated in Aβ1–40 self-recognition and modified forms of the peptide sequence have been used for this reason as a motif in the design of peptide inhibitors for arresting fiber formation.27 This particular sequence was identified by finding the optimal binding sequence in a series of short peptides derived from the Aβ1–40 sequence.28 However, the KLVFF peptide is only moderately effective at suppressing fiber formation and toxicity,29 in contrast to the substantial effects seen at sub-stoichiometric levels with some longer peptides.30 Considering the potential role of surface associated states in fiber elongation may lead to more effective inhibitors.
This study was partly supported by NIH, Hans-Fischer Senior Fellowship (Münich, Germany), and the Protein Folding Initiative at Michigan (to AR). This work was also partly supported by Council of Scientific and Industrial Research (CSIR), Govt. of India (02(0292)/17/EMR-II) (to AB). We thank Dr. Yamazaki for performing 3D NMR experiments.
Supplementary Material
Footnotes
Footnotes relating to the title and/or authors should appear here.
Electronic Supplementary Information (ESI) available: See DOI: 10.1039/x0xx00000x
Conflicts of interest. There are no conflicts to declare.
Notes and references
- 1.Cohen SIA, Linse S, Luheshi LM, Hellstrand E, White DA, Rajah L, Otzen DE, Vendruscolo M, Dobson CM and Knowles TPJ, Proc Natl Acad Sci USA, 2013, 110, 9758–9763. [DOI] [PMC free article] [PubMed] [Google Scholar]
- 2.Tornquist M, Michaels TCT, Sanagavarapu K, Yang XT, Meisl G, Cohen SIA, Knowles TPJ and Linse S, Chem Commun, 2018, 54, 8667–8684. [DOI] [PubMed] [Google Scholar]
- 3.Potapov A, Yau WM, Ghirlando R, Thurber KR and Tycko R, J Am Chem Soc, 2015, 137, 8294–8307. [DOI] [PMC free article] [PubMed] [Google Scholar]
- 4.Lee CF, Loken J, Jean L and Vaux DJ, Phys Rev E, 2009, 80, 041906. [DOI] [PubMed] [Google Scholar]
- 5.Straub JE and Thirumalai D, Ann Rev Phys Chem, 2011, 62, 437–463. [DOI] [PMC free article] [PubMed] [Google Scholar]
- 6.Gurry T and Stultz CM, Biochemistry, 2014, 53, 6981–6991. [DOI] [PubMed] [Google Scholar]
- 7.Schor M, Mey ASJS, Noe F and MacPhee CE, J Phys Chem Lett, 2015, 6, 1076–1081. [DOI] [PubMed] [Google Scholar]
- 8.Barz B and Strodel B, Chemistry, 2016, 22, 8768–8772. [DOI] [PubMed] [Google Scholar]
- 9.Kar RK, Brender JR, Ghosh A and Bhunia A, J Chem Inf Model, 2018, 58, 1576–1586. [DOI] [PubMed] [Google Scholar]
- 10.Gurry T and Stultz CM, Biochemistry, 2014, 53, 6981–6991. [DOI] [PubMed] [Google Scholar]
- 11.Bellomo G, Bologna S, Gonnelli L, Ravera E, Fragai M, Lelli M and Luchinat C, Chem Commun, 2018, 54, 7601–7604. [DOI] [PubMed] [Google Scholar]
- 12.Fawzi NL, Ying JF, Ghirlando R, Torchia DA and Clore GM, Nature, 2011, 480, 268–U161. [DOI] [PMC free article] [PubMed] [Google Scholar]
- 13.Yoshimura Y, Sakurai K, Lee YH, Ikegami T, Chatani E, Naiki H and Goto Y, Protein Sci, 2010, 19, 2347–2355. [DOI] [PMC free article] [PubMed] [Google Scholar]
- 14.Suzuki Y, Brender JR, Soper MT, Krishnamoorthy J, Zhou YL, Ruotolo BT, Kotov NA, Ramamoorthy A and Marsh ENG, Biochemistry, 2013, 52, 1903–1912. [DOI] [PMC free article] [PubMed] [Google Scholar]
- 15.Cannon MJ, Williams AD, Wetzel R and Myszka DG, Anal Biochem, 2004, 328, 67–75. [DOI] [PubMed] [Google Scholar]
- 16.Fawzi NL, Libich DS, Ying JF, Tugarinov V and Clore GM, Angew Chem Int Edit, 2014, 53, 10345–10349. [DOI] [PMC free article] [PubMed] [Google Scholar]
- 17.Fawzi NL, Ying J, Torchia DA and Clore GM, J Am Chem Soc, 2010, 132, 9948–9951. [DOI] [PMC free article] [PubMed] [Google Scholar]
- 18.Krishnamoorthy J, Brender JR, Vivekanandan S, Jahr N and Ramamoorthy A, J Phys Chem B, 2012, 116, 13618–13623. [DOI] [PMC free article] [PubMed] [Google Scholar]
- 19.Huang YY, Knowles TPJ and Terentjev EM, Adv Mater, 2009, 21, 3945–3948. [Google Scholar]
- 20.Kotler SA, Brender JR, Vivekanandan S, Suzuki Y, Yamamoto K, Monette M, Krishnamoorthy J, Walsh P, Cauble M, Holl MM, Marsh EN and Ramamoorthy A, Sci Rep, 2015, 5, 11811. [DOI] [PMC free article] [PubMed] [Google Scholar]
- 21.Scheidt HA, Morgado I and Huster D, J Biol Chem, 2012, 287, 22822–22826. [DOI] [PMC free article] [PubMed] [Google Scholar]
- 22.Kheterpal I, Lashuel HA, Hartley DM, Wlaz T, Lansbury PT and Wetzel R, Biochemistry, 2003, 42, 14092–14098. [DOI] [PubMed] [Google Scholar]
- 23.Scheidt HA, Morgado I, Rothemund S, Huster D and Fandrich M, Angew Chem Int Edit, 2011, 50, 2837–2840. [DOI] [PubMed] [Google Scholar]
- 24.Kotarek JA, Johnson KC and Moss MA, Anal Biochem, 2008, 378, 15–24. [DOI] [PubMed] [Google Scholar]
- 25.O’Nuallain B, Shivaprasad S, Kheterpal I and Wetzel R, Biochemistry, 2005, 44, 12709–12718. [DOI] [PubMed] [Google Scholar]
- 26.Yamaguchi T, Matsuzaki K and Hoshino M, FEBS Lett, 2013, 587, 620–624. [DOI] [PubMed] [Google Scholar]
- 27.Mishra P, Ayyannan SR and Panda G, ChemMedChem, 2015, 10, 1467–1474. [DOI] [PubMed] [Google Scholar]
- 28.Tjernberg LO, Naslund J, Lindqvist F, Johansson J, Karlstrom AR, Thyberg J, Terenius L and Nordstedt C, J Biol Chem, 1996, 271, 8545–8548. [DOI] [PubMed] [Google Scholar]
- 29.Ghanta J, Shen CL, Kiessling LL and Murphy RM, J Biol Chem, 1996, 271, 29525–29528. [DOI] [PubMed] [Google Scholar]
- 30.Mustafi SM, Garai K, Crick SL, Baban B and Frieden C, Biochem Bioph Res Commun, 2010, 397, 509–512. [DOI] [PMC free article] [PubMed] [Google Scholar]
Associated Data
This section collects any data citations, data availability statements, or supplementary materials included in this article.


