

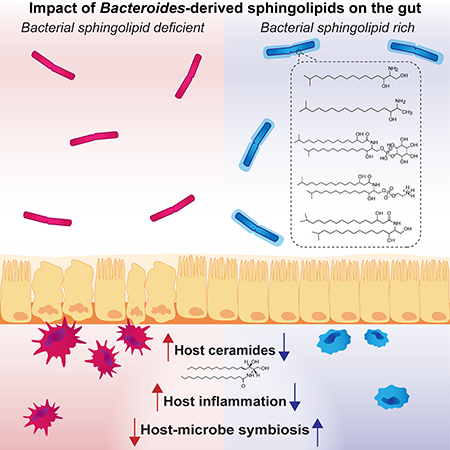
Abstract
Sphingolipids are structural membrane components and important eukaryotic signaling molecules. Sphingolipids regulate inflammation and immunity, and were recently identified as the most differentially abundant metabolite in stool from inflammatory bowel disease (IBD) patients. Commensal bacteria, from the Bacteroidetes phylum, also produce sphingolipids, but the impact of these metabolites on host pathways is largely uncharacterized. To determine whether bacterial sphingolipids modulate intestinal health, we colonized germ-free mice with a sphingolipid-deficient Bacteroides thetaiotaomicron strain. A lack of Bacteroides-derived sphingolipids resulted in intestinal inflammation and altered host ceramide pools in mice. Using lipidomic analysis, we described a sphingolipid biosynthesis pathway and revealed a variety of Bacteroides-derived sphingolipids, including ceramide phosphoinositol and deoxy-sphingolipids. Annotating Bacteroides sphingolipids in an IBD metabolomic dataset revealed lower abundances in IBD and negative correlations with inflammation and host sphingolipid production. These data highlight the role of bacterial sphingolipids in maintaining homeostasis and symbiosis in the gut.
eToC Blurb
In this issue, Brown et al. discover a number of bacterial sphingolipid metabolites and demonstrate that sphingolipid production by Bacteroides species in the gut microbiome promotes symbiosis with the host. Bacterial sphingolipid deficiency correlates with inflammatory bowel diseases and increased host-produced sphingolipid abundance in the human intestine.
Graphical Abstract
Introduction
Sphingolipids are aliphatic amino alcohols that serve as ubiquitous structural components of all eukaryotic and some prokaryotic cell membranes (Hannun and Obeid, 2008). They are important signaling molecules with central roles in regulating inflammation, immunity, autophagy, growth and survival (Hannun and Obeid, 2018; Koberlin et al., 2015; Maceyka and Spiegel, 2014; Merrill and Carman, 2015; Spiegel and Milstien, 2011). Sphingolipid-mediated metabolic and immune signaling events are implicated in autoimmune and chronic inflammatory diseases, including inflammatory bowel disease (IBD) (Bryan et al., 2016; Maceyka and Spiegel, 2014; Nielsen et al., 2017; Norris and Blesso, 2017).
Sphingolipid synthesis depends on the enzyme serine palmitoyltransferase (SPT), which catalyzes a reaction between serine and an acyl-CoA thioester (e.g., palmitoyl-CoA) to form 3-ketosphinganine (Yard et al., 2007). SPT can alternatively use glycine or alanine to form 1-deoxyketosphinganine and 1-deoxymethyl-ketosphinganine, respectively (Duan and Merrill, 2015). In both prokaryotic and eukaryotic cells, this SPT-mediated reaction is the committed step to sphingolipid biosynthesis. The three sphingoid backbones are further catalyzed into sphinganines, dihydroceramides and complex lipid structures with characteristic head-groups, which could include a sugar (e.g. galactose), phosphate, phosphoethanolamine, phosphocholine or phospho-sugar (e.g. phosphoinositol) (Futerman and Hannun, 2004).
Most Bacteroidetes and certain alpha-Proteobacteria species synthesize sphingolipids, but Bacteroidetes are the only gut commensal known to produce sphingolipids (Olsen and Jantzen, 2001). Bacteroidetes are the most abundant members of the mammalian intestinal microbiota, and the average adult human gut contains over one trillion cells from this phylum (Human Microbiome Project, 2012; Yatsunenko et al., 2012). Sphingolipids make up a significant portion of the Bacteroidetes total membrane (An et al., 2011), providing a large pool of potentially metabolically and immunologically active metabolites in the human gut, most with unknown functions in health and disease (Heaver et al., 2018). Previous studies demonstrated that the Bacteroides fragilis sphingolipid alpha-galactosylceramide binds to the antigen-presenting molecule CD1d, influencing the number and function of natural killer T-cells (NKT-cells) in the intestine and the progression of a murine model of colitis (An et al., 2014; Wieland Brown et al., 2013). The full repertoire of Bacteroides sphingolipids and their roles in innate immune and metabolic pathways of chronic inflammation in the mammalian gut, however, remain largely unknown (Kato et al., 1995; Kunsman, 1973; LaBach and White, 1969; Miyagawa et al., 1979; Rizza et al., 1970; Wieland Brown et al., 2013).
Based on our previous findings of dysregulated host sphingolipid metabolism during IBD (Franzosa et al., 2019), we sought to understand the role of Bacteroides sphingolipid production in the gut during health and disease. In characterizing the host response to bacterial sphingolipids, we discovered that a lack of bacterial sphingolipid production resulted in intestinal inflammation and changes in host sphingolipid metabolites in mice. Lipidomic analysis revealed a number of previously unknown bacterial sphingolipids that negatively correlated with IBD and inflammation in a human cohort. These data suggest sphingolipids play a role in maintaining symbiosis and homeostasis in the intestine.
Results
Host-produced sphingolipid abundance in stool is a defining metabolic feature during inflammatory bowel disease
In an IBD cohort with paired stool metabolomic and metagenomic data, sphingolipids were the metabolite class most significantly increased in samples from ulcerative colitis (UC) and Crohn’s disease (CD) subjects (Franzosa et al., 2019). Here, we reanalyzed the metabolomic data from this study using a more sensitive peak-finding algorithm (Progenesis QI) to improve the accuracy and resolution of sphingolipids we were able to annotate (Data File S1). Thirteen of the top 25 most significantly increased metabolites (Hochberg-Benjamini, FDR <0.01) in IBD were host-produced sphingolipids (distinguished by 18-carbon, single double-bond [d18:1] sphingoid backbones) including ceramides, sphingomyelin and sphingosines (Fig. 1A, Fig. S1 A–Y). Grouping metabolites into classes as in the Human Metabolome Database, sphingolipids remained the most differentially abundant feature in IBD by t-statistic (Fig. 1B). The normalized, relative abundance of each host ceramide, sphingomyelin or sphingosine identified in stool was summed, binned into presence in UC, CD or non-IBD controls, and analyzed for significance (Hochberg-Benjamini; FDR <0.01). Host-produced ceramide and sphingosine abundances were more elevated during CD than UC, while sphingomyelins were more elevated during UC (Fig. 1C–E; Data File S1).
Figure 1: Increased abundances of host-produced sphingolipids is the most significant metabolite signature in stool during IBD.

(A) A clustered heat-map (Pearson-ward) displaying the 25 most significantly increased metabolites in Crohn’s disease (CD), ulcerative colitis (UC) and non-IBD control stool samples. Red indicates increased and blue indicates decreased relative abundance for each metabolite (rows) and sample (columns). Metabolites classified as sphingolipids are in italics. (B) A list of all 512 metabolites identified in the stool of IBD subjects and non-IBD controls, collapsed into 17 classes using metabolite class identifiers from the Human Metabolome Database. The x-axis indicates the change in the t-statistic for each metabolite class in IBD versus control samples. The relative abundance of host-produced (C) ceramides, (D) sphingomyelins and (E) sphingosine was summed and displayed in box-plots. Relative abundance (ppm) was quantified in UC (yellow), CD (red) and control stool (blue). (F) The total percentage abundance of Bacteroidetes strains identified in controls (blue), CD (red) and UC (yellow) was plotted for each individual in the study. (G) The total abundance of annotated mammalian ceramides was plotted against the total percentage abundance of Bacteroidetes species in each control and UC sample. Correlation and statistical regression analysis was performed using Pearson’s method. Statistical significance in (A) and (C-F) was determined by analysis of the FDR by the Hochberg-Benjamini test. *FDR<0.05; **FDR<0.01; ***FDR<0.001; NS, not significant. See also Figure S1 and Data File S1.
Stool metabolites represent diet-, host- and microbial-derived molecules. To understand how Bacteroides sphingolipid-producing strains are impacted during IBD, we relied on the same paired metagenomic and metabolomic data from IBD patients generated by Franzosa et al. The abundance of Bacteroidetes species was lower during CD (Hochberg-Benjamini, FDR <0.01) (Fig. 1F), and Bacteroidetes abundance per sample negatively correlated with host-produced ceramides abundance per sample (Fig. 1G). This observation suggests that Bacteroidetes sphingolipids may be required to maintain a balance in host-produced sphingolipid levels and play a protective role in host health.
Synthesis and characterization of a sphingolipid-deficient Bacteroides strain
To mechanistically address the role of Bacteroides sphingolipids in intestinal health, we generated a mutant unable to produce these molecules. Commitment to sphingolipid biosynthesis begins with Spt converting serine and acyl CoA to 3-ketosphinganine (Fig. 2A). We identified a genetically-tractable B. thetaiotaomicron strain that contained an spt gene (BT_0870) homologous to yeast and mammalian SPT. We deleted the putative spt gene in B. thetaiotaomicron VPI-5482 using the tdk-vector system (Wieland Brown et al., 2013). We then used thin-layer chromatography (TLC) to separate and compare lipid extracts prepared from the wild-type and spt mutant strains. To confirm the absence of sphingolipids in the mutant strain, we used a ninhydrin spray, which reacts with amine groups to produce a colorimetric pink band. This method labels the sphingolipid ceramide phosphoethanolamine (CerPE) previously identified in B. fragilis (Fig. 2B). Lipids separated from the B. thetaiotaomicron spt mutant (BTΔSPT) did not have the expected CerPE band, whereas this band appeared in lipid extracts from the B. thetaiotaomicron wild-type (BTWT) strain and a purified CerPE standard, C12 sphingosyl-PE (C12 SPE) (Fig. 2B). To further confirm the loss of CerPE and other bacterial sphingolipids after spt deletion, lipid extracts from each strain were analyzed using liquid chromatography-mass spectrometry (LC-MS). Peaks corresponding to known masses of CerPE (679, 693, and 707m/z) established in previous studies (An et al., 2014; Wieland Brown et al., 2013) were present only in the BTWT extract (Fig. 2C, D). The absence of CerPE from the BTΔSPT extract was further confirmed using MS/MS spectra, where we identified a neutral loss of 141 m/z corresponding to the PE head-group, similar to the C12 SPE standard (Fig. S2A), that was consistent with CerPE masses identified in previous studies (An et al., 2014; Wieland Brown et al., 2013). We further demonstrated functionality of Spt and confirmed the Spt protein alone was required for sphingolipid synthesis by restoring CerPE production after complementation in the BTΔSPT strain (Fig. 2E).
Figure 2: Genetic deletion of the serine palmitoyltransferase enzyme in B. thetaiotaomicron results in sphingolipid-deficient bacteria.

(A) Schematic of sphingolipid biosynthesis, in which serine palmitoyltransferase (SPT) catalyzes the addition of amino acids (e.g. serine) to acyl-coenzyme A (CoA) to form an N-acylated sphingoid backbone (e.g. 3-ketosphinganine). (B) Representative TLC plate verifying that ceramide phosphoethanolamine (CerPE) in wild type B. thetaiotaomicron (BTWT) is absent in the B. theta spt mutant (BTΔSPT). CerPE (Rf 0.35) is shown after ninhydrin staining (red) on TLC plates below the phosphorylethanolamine (PE) band and run with a CerPE standard, C12 sphingosyl-PE (C12 SPE). (C) Representative tick plots of the elution peak at the CerPE (679 m/z) retention time (RT) on a C8-column (7.7 min). The CerPE sphingolipid peak present in BTWT lipids (blue box) was absent in BTΔSPT lipids (red box). Data is representative of 3 biological replicates. (D) Isolation of purified CerPE from B. thetaiotaomicron was confirmed using LC-MS/MS. Tail lengths corresponding to the known masses of CerPE (679, 693, and 707m/z) were identified. Structures are shown above. (E) Representative TLC plate stained with ninhydrin (red) showing the CerPE band (Rf 0.35) is present in BTWT and SPT-complemented BTΔSPT strains. (F) Log2 fold-change (FC) difference between each B. thetaiotaomicron gene significantly changed (>2-fold upregulated, FDR<0.01) in the wild-type or mutant strain after growth in minimal and rich media. Genes upregulated in BTWT relative to BTΔSPT are in red and downregulated are in blue. Annotated gene functions, if available, are listed on the right. N=3. Only genes significantly changed in both rich and minimal media are displayed. See also Figure S2, Table S1, and Data File S2.
To interrogate the impact of spt deletion on bacterial gene expression profiles, we performed RNA-seq on BTWT and BTΔSPT monocultures in rich and minimal media (Data File S2). As expected, the spt gene was significantly upregulated in BTWT cultures, confirming its deletion (Fig. 2F). Comparing expression profiles of BTWT and BTΔSPT strains grown in minimal and rich media, we discovered changes (|log2FC|>2) in genes encoding outer membrane proteins, lipid transporters and LPS biosynthesis genes (Fig. 2F; Table S1). Membrane differences suggested by transcriptomics were also apparent in electron micrographs of negatively-stained BTWT and BTΔSPT strains, which showed darker staining along the membrane in the BTΔSPT strain compared to BTWT, indicative of a significantly altered membrane composition (Fig. S2B, C). Changes in membrane ultrastructure, transcription and sphingolipid production corresponded with decreased colony size and growth rate in BTΔSPT compared to BTWT (Fig. S2D–F). Importantly, growth rate was restored to wild-type levels by complementation of the spt gene in the BTΔSPT strain, confirming that absence of the spt gene rather than an off-target effect produced this phenotype (Fig. S2F).
Mono-colonization of germ-free mice with a sphingolipid-deficient B. thetaiotaomicron strain results in intestinal inflammation
After confirming the sphingolipid-deficient Bacteroides strain, we sought to directly address the in vivo role Bacteroides sphingolipids may have in mucosal immunity and host lipid metabolism in the intestine in a manner which could explain our observation of altered host sphingolipid metabolism in IBD. We mono-colonized germ-free (GF) mice with either BTWT or BTΔSPT for 3 days to specifically analyze innate immune and metabolic effects of Bacteroides sphingolipids independent of adaptive immunity (Fig. 3A). No significant difference in colonization of GF mice was observed in vivo (Fig. 3A). Strikingly, examination of ileal and colonic sections from BTΔSPT-colonized mice revealed histopathological signatures of inflammation in the epithelial layer (Fig. 3B), highlighted by crypt hyperplasia as measured by crypt height (Fig. 3C, D). Further, ileal sections from BTΔSPT-colonized mice had a greater number of goblet cells per villi, indicative of goblet cell hyperplasia (Fig. 3E). Epithelia stained with KI67 to assess cell proliferation showed no abnormalities in the localization or number of KI67+ cells per crypt in the ileum (Fig. S3A), indicating the epithelium maintains a steady proliferative capacity, and any phenotypes observed are independent of this. Intestinal inflammation was also apparent when we analyzed the cytokine profile of the colon. Concentrations of IL-6 and MCP-1 were increased (>2-fold, Mann-Whitney; p<0.01) in supernatants of cultured epithelial cells from BTΔSPT-colonized mice (Fig. 3F, G). To determine the changes in immune cell populations related to the observed increase in IL-6 and MCP-1, we isolated colonic lamina propria lymphocytes (LPLs) from BTWT- and BTΔSPT-colonized mice. More F4/80+ macrophages were found in the LPLs of BTΔSPT-colonized mice (Fig. 3H), and this observation was further confirmed by immunohistochemistry, where we observed an increase in F4/80+ cells present in the LPLs of BTΔSPT- compared to BTWT-colonized mice (Fig. 3I).
Figure 3: Mono-colonization of germ-free mice with a sphingolipid-deficient B. thetaiotaomicron strain results in intestinal inflammation and barrier dysfunction.

(A) Female, 6-week old, germ-free (GF) C57BL/6N mice were colonized with B. thetaiotaomicron WT (BTWT) and B. thetaiotaomicron spt deletion (BTΔSPT) strains. BTWT (blue) and BTΔSPT (red) colony-forming units (CFU) in fecal pellets were determined after 3 days of colonization. (B) Representative images of H&E stained colon and ileum sections from BTWT- and BTΔSPT-colonized mice. The average crypt height for each (C) ileal and (D) colonic section collected from BTWT- (blue) and BTΔSPT-colonized (red) mice was measured and plotted. (E) The number of goblet cells per villi observed in the ileum of BTWT- (blue) and BTΔSPT-colonized (red) mice was measured and plotted. Concentrations of (F) IL-6 and (G) MCP-1 detected in the colons of BTWT- (blue) and BTΔSPT-colonized (red) mice. (H) Relative abundance of F4/80+ macrophages compared to total lymphocytes (CD45+) from the colonic lamina propria of BTWT-(blue) and BTΔSPT-colonized (red) mice. (I) Representative immunofluorescence images of colon sections stained for macrophages (orange) with an F4/80-specific antibody. Nuclei are stained with DAPI (blue). All data are representative of 2 independent experiments, n=3 or n=6 per group. Scale bars, 100 μm. Statistical analysis was performed using the Mann-Whitney U-test. *p<0.05, **p<0.01. Error bars are +/− SEM. See also Figure S3.
To further examine the immunological features of BTWT- and BTΔSPT-colonized mice, intraepithelial lymphocytes (IELs) and LPLs from the small intestine were isolated, stained and counted. Total IEL number slightly decreased in BTΔSPT-colonized mice, but LPL cellularity remained unchanged, with no significant differences in the frequency of T-cell subsets (Fig. S3B, C). When we analyzed other CD45+ cells in the LPLs, we observed an approximately 2-fold increase in the number of F4/80+ macrophages in the small intestines of BTΔSPT-colonized mice (Fig. S3C), consistent with our findings in the colon. To understand B-cell responses to each strain, we analyzed sIgA binding efficiency using a flow cytometry-based IgA-binding assay on fecal pellets from BTWT- and BTΔSPT-colonized mice. This was a measurement of natural sIgA independent of the adaptive immune response as these are not protein-specific, adaptive sIgAs. The frequency of sIgA binding to the B. thetaiotaomicron outer membrane was higher in BTΔSPT-colonized compared to BTWT-colonized mice (Fig. S3D) and was not confounded by differences in total amount of IgA in the serum or feces (Fig. S3E).
Increased sIgA binding and translocation into the lumen may indicate a leaky intestinal barrier. The mucus layer serves an important role in barrier function, and MUC2 transcript levels were significantly decreased in colons of BTΔSPT-colonized mice (Fig. S3F); however, we were unable to detect a consistent mucus layer in the tissues to measure the functional output of this observation. Expression of the antimicrobial peptide alpha-defensin (DEFA) was upregulated (but not statistically significant; p=0.054) in the colon of BTΔSPT-colonized mice (Fig. S3G). To further analyze the impact of sphingolipid-deficient Bacteroides colonization on barrier function, we first looked at transcriptional levels of tight-junction proteins TJP1 and CLDN2 in the colon, but both remained unchanged between BTWT- and BTΔSPT-colonized mice (Fig. S3H, I). We then cultured colonic epithelial monolayers in vitro and used lipid extracts from BTWT and BTΔSPT strains as stimulants. Comparing the transepithelial electrical resistance (TEER) of monolayers after 24 hours, we observed no difference between monolayers stimulated with BTWT or BTΔSPT extracts (Fig. S3J). We next tested whether Bacteroides sphingolipids altered the ability of monolayers to repair after injury by performing a calcium switch assay but found no difference in recovery between monolayers stimulated with BTWT or BTΔSPT extracts (Fig. S3K). Thus, the barrier dysfunction and inflammation seen in our in vivo data likely involves an immune component and more than only lipid-epithelial interactions.
Colonization with B. thetaiotaomicron generates expansive shifts in bioavailable sphingolipids in the intestine
To further understand how Bacteroides sphingolipid alterations in the gut result in inflammation, we sought to identify how BTWT and BTΔSPT colonization could affect host- and bacteria-derived sphingolipid pools. To this end, we performed untargeted lipidomics on bacterial and caecal extracts from BTWT- and BTΔSPT-colonized mice and naïve GF mice (Fig. S4A; Data Files S3, S4). To determine which lipid features were bacteria- or host-produced and SPT-dependent, total bacterial and caecal content was normalized and lipids were extracted and analyzed by LC-MS. Approximately 4,600 metabolite features were identified, of which 443 were significantly changed (FDR<0.01) between BTWT- and BTΔSPT-colonized mice (Data File S4). Broad analysis of the lipidome in the caecum using partial least squares discriminant analysis (PLS-DA) and clustering of the top 250 abundant features by the Pearson-ward method showed significant changes in bioavailable lipids between BTWT- and BTΔSPT-colonized mice (Fig. S4B). Lipidomic features from BTWT-colonized mice clustered together separately from the BTΔSPT-colonized mouse lipidome (Fig. S4C).
With this dataset of SPT-dependent and -independent host and bacterial lipidomic features, we sought to understand how bacterial sphingolipid production changed the host sphingolipid pool in BTWT- and BTΔSPT-colonized mice. Using the relative abundance of each annotated lipid, we assessed differences in the sphingolipid pools between GF, BTWT- and BTΔSPT-colonized mice. Host-produced ceramides have an even number of carbons and a double-bond in the backbone (e.g. ceramide d18:1) but the acyl chain structure can vary. Bacterial-produced ceramides, however, have not been observed to have a double bond in the backbone to date and can have odd or even numbers of carbons in their backbones and acyl chains. Of note we did observe trace amounts of annotated host-produced ceramides in BTWT grown alone in minimal media (Data File S3). For host-produced ceramides, there were significant differences in the composition of the acyl-chain pool between GF, BTWT- and BTΔSPT-colonized mice (Fig. 4A, Fig. S4D). This broad difference in the ceramide pool was quantified using PCA, which showed significant clustering in ceramide composition of BTWT- and BTΔSPT-colonized mice (Fig. 4B). We observed that a subset of acyl-chains with odd numbers of carbons (C15, C17, and C19) appears only in samples from BTWT- but not BTΔSPT-colonized or GF mice (Fig. 4A, Fig. S4D). Total ceramide and even-carbon chain length abundances remained unchanged between BTWT- and BTΔSPT-colonized mice (Fig. 4C, D). Odd-chain length ceramides were more abundant in BTWT-colonized mice (Fig 4E). Sphingomyelin (SM) abundances were unchanged between BTWT- and BTΔSPT-colonized mice, with the exception of an increase in SM(14:0) in BTΔSPT-colonized mice (Fig. S4E). Lipids produced independently of mammalian SPT, including phosphatidylethanolamines (PE) and phosphatidylcholines (PC), were also assessed (Fig. S4F, G). Several PEs showed significant changes in abundance among the GF, BTWT- and BTΔSPT-colonized mice (Fig. S4F), while PC levels were unchanged between BTWT- and BTΔSPT-colonized mice (Fig. S4G), indicating that PC production is independent of and PE production is influenced by Bacteroides colonization.
Figure 4: B. thetaiotaomicron mono-colonization significantly alters the host ceramide pool.

(A) Normalized relative abundances (% of total) of all annotated host ceramides with a d18:1 backbone found in caecum of BTWT-colonized (left), BTΔSPT-colonized (middle) or GF (right) mice. Colors represent a unique lipid acyl chain annotated based on a d18:1 backbone. Asterisks denote lipids with significant changes. (B) Principal component analysis (PCA) was performed on the total ceramide d18:1 pool of acyl-chains presented in (A) from BTWT- (blue) and BTΔSPT-colonized (red) mouse caecum. The component change between each sample was plotted and values recorded on the x- and y-axes for percentage change. Mouse caecal samples from each group clustered within the 95% confidence intervals (blue and red shading). (C) Log-transformed relative abundance of all annotated host ceramides found in caecum of BTWT-colonized (blue), BTΔSPT-colonized (red) or GF (green) mice. Each ceramide with an (D) even-acyl or (E) odd-acyl chain length in the caecum of BTWT-colonized (blue), BTΔSPT-colonized (red) or GF (green) mice was summed and plotted, with the y-axis denoting the relative abundance of each observed metabolite detected. All data are representative of 2 independent experiments, n=6 for BTWT- and BTΔSPT-colonized mice and n=2 for GF mice. Statistical analysis in panels (A, E) was determined by the Hochberg-Benjamini test. *FDR<0.05; **FDR<0.01. Error bars are +/− SEM. See also Figure S4 and Data Files S3 and S4.
Identification and characterization of Bacteroides sphingolipids
To annotate the unknown Bacteroides sphingolipids produced in the intestine downstream of the Spt enzyme, we first ranked the relative importance of each lipidomic feature in the dataset based on fold-change (>10) and FDR (<0.01). We excluded adducts and removed lipids that were significantly more abundant in GF mice; thus, only features present in vivo in BTWT- colonized caecum and absent in BTΔSPT-colonized caecum were included in our analysis. We obtained a list of 144 unique, Spt-dependent, bacterial lipids. Based on MS data, commercial sphingolipid standards, our ability to isolate CerPE (Fig. 2) and previous studies (An et al., 2014; Wieland Brown et al., 2013), we annotated 35 unique Bacteroides sphingolipids present in the BTWT and absent in the BTΔSPT strain, significantly more than previously assumed (Table S2). The level of confidence of this annotation, based on previous frameworks for metabolite identification (Sumner et al., 2007), is level 3 or higher and presented with relative abundance, chemical formula and detection in human stool (Table S2). We generated an spt knockout in B. ovatus to annotate these sphingolipids in an additional Bacteroides strain. Similar to BTΔSPT, the B. ovatus spt deletion (BOΔSPT) is deficient in sphingolipid production compared to the B. ovatus WT (BOWT) strain (Data File S3), displayed an altered membrane ultrastructure compared to BOWT (Fig. S5A, B) and has a decreased growth rate compared to BOWT that can be restored with complementation of the spt gene (Fig. S5C).
To establish which Spt-dependent and -independent metabolite features were conserved within bacteria, we first annotated the sphingolipid content present in BOWT but not BOΔSPT cultures (Table S2). We then created one dataset of Bacteroides-derived metabolite features by combining all metabolomic features annotated from both the BTWT and BOWT strains. From this dataset of annotated features, we ranked the top 50 most differentially abundant metabolites by FDR found in caeca from BTWT- and BTΔSPT-colonized mice (Fig. 5A). As expected, most of the annotated sphingolipids, such as sphinganine, dihydroceramide (DHCer) and CerPE, were highly differential between the caeca (Fig. 5A). Of the differential sphingolipids, the most abundant in BTWT-colonized mouse caecum were CerPE and DHCer (Fig. 5B, C). We also discovered a subset of PEs that were significantly more abundant in BTΔSPT-colonized mouse caecum (Fig. 5A, Fig. S4F), potentially compensating for the lack of sphingolipids in the BTΔSPT membrane. The most differential PEs in vivo were PE 32:0 and PE 35:0 (Fig. 5D, E).
Figure 5: Lipidomic analysis reveals expansive shifts and insight into the bacterial lipid content dependent on serine palmitoyltransferase in the intestine.

(A) The top 50 annotated metabolite features by FDR changed in BTWT- and BTΔSPT-colonized mice, clustered using Euclidean distance and Pearson correlation. The most abundant and changed features in BTWT-colonized mice were (B) CerPE and (C) DHCer. Their relative abundances in mouse caecum and culture are compared to those in BTΔSPT-colonized mouse caecum and culture, where they are not detected. The most abundant and changed features in BTΔSPT-colonized mice were (D) PE 32:0 and (E) PE 35:0. Their relative abundances in mouse caecum and culture are compared to those in BTΔWT-colonized mouse caecum and culture, where they are significantly decreased. Statistical analysis was performed using the Mann-Whitney U-test. ***p<0.001; **p<0.01; *p<0.05. Error bars are +/− SEM. See also Table S2 and Data Files S3 and S4.
Considering these data together, we predicted an alternate sphingolipid biosynthesis pathway based on a transition from ketosphinganine to sphinganine and then to more complex dihydroceramides (Fig. 6). DHCer and CerPE were the two most abundant features in BTWT-colonized mouse caecum, each present with at least four different tail lengths. For simplicity we show the abundance of C17-based sphingolipids and C18-based deoxysphingolipids and their predicted structures here (Fig. 6). Notably, we were unable to detect the previously published mass corresponding to alpha-galactosylceramide (Wieland Brown et al., 2013) in BTWT and BOWT bacterial extracts. Instead, we observed an abundant sphingolipid feature, which we predicted to be ceramide phosphoinositol (CerPI), indicating synthesis of an inositol rather than a galactosyl sugar on sphingoid backbones in these bacteria (Fig. 6). This was further confirmed when the same neutral loss of 260.0289 m/z that corresponds to the mass of the PI head-group was identified on CerPI and on a phosphoinositol (PI) 18:1 lipid standard (Fig. S5D). To date, CerPI has not been reported to be produced by gut Bacteroides strains nor detected in mammalian cells (Ren and Hannun, 2016).
Figure 6: Proposed sphingolipid biosynthesis pathways for the most abundant sphingolipid metabolite features in Bacteroides.

Sphingolipid structures and features enriched in WT Bacteroides as predicted from LC-MS data. Bars represent relative abundances of each lipid in B. thetaiotaomicron and B. ovatus and losses in the corresponding ΔSPT strains. Annotation of SPT-dependent metabolite features reveals SPT can utilize serine (upper panels) or alanine (lower panels) to synthesize complex sphingolipids. From left to right, Spt is required for synthesis of 3-ketosphinganine or deoxy-ketosphinganine, sphinganine or 1-deoxy-sphinganine, dihydroceramide or deoxy-dihydroceramide, and ceramide phosphoethanolamine (CerPE) or ceramide phosphoinositol (CerPI). Chemical structure representations are based on an acyl chain backbone length of 17 carbons (C17) for sphingolipids and 18 carbons (C18) for deoxysphingolipids. See also Figures S5 and S6 and Data Files S3 and S5.
As the mass of inositol is similar to other sugars, such as mannose, we sought further biological evidence for incorporation of an inositol-based head-group. CerPI is a common feature of yeast membranes, and the genes required for CerPI synthesis are annotated (Ren and Hannun, 2016). We ran a BLAST search of the yeast CerPI synthase gene with our BTWT and BOWT genomes and discovered a gene cluster that contained a putative CerPI synthase gene (BT_1522; BACOVA_04257) surrounded by an operon containing a phosphoinositol synthase and membrane proteins, which is predicted to be controlled by a histidine-kinase two-component system (Fig. S5E, F). We proposed a CerPI synthase mechanism based on integration of PI into a dihydroceramide backbone, where PI is made endogenously by PI synthases (BT_1526; BACOVA_04261) (Fig. S5G). Indeed, CerPI was synthesized by both BTWT and BOWT in minimal medium with no inositol or yeast extract, indicating these Bacteroides can endogenously synthesize inositol to make lipids with PI head-groups (Fig. S5H). The CerPI gene cluster was only present in a subset of Bacteroides strains (Fig. S5I) and absent in the alpha-galactosylceramide-producing B. fragilis ATCC strain.
BTWT and BOWT extracts harbored lipids consistent with the mass of mammalian 1-deoxy-sphinganine, an understudied but characterized sphingolipid synthesized by mammalian SPT using alanine instead of serine (Duan and Merrill, 2015) (Fig. 6). Both BTWT and BOWT also produced the precursor deoxy-ketosphinganine and product deoxy-dihydroceramide, indicating that these alanine-based sphingolipids are synthesized de novo by Bacteroides. To confirm the molecules were enzymatically produced by Spt, we added D4-labelled alanine to a minimal medium with a single carbon source and found a deuterated shift only in masses corresponding to predicted alanine-based deoxy-sphinganines and deoxy-dihydroceramides compared to their serine-based counterparts (Fig. S6A, B; Data File S5). There was a significant difference in the proportion of deoxy-sphingolipids measured in the BTWT and BOWT strains (Fig. S6C, D), and we postulate that strain variations in the Spt protein could affect its affinity for alanine incorporation. Previous studies determined that residue changes in the mammalian SPT enzyme enriched alanine integration with acyl CoA (Gable et al., 2010).
The identification of deoxy-sphinganine in Bacteroides was further confirmed by LC-MS/MS analysis using a mammalian-produced commercial standard (Fig. S6E). The branched acyl chain structure of bacterial lipids is well documented, and in our study, structures were assembled based on this previous observation from NMR data of identical Bacteroides sphingolipids (An et al., 2014; Wieland Brown et al., 2013). We compared LC-MS/MS analysis of iso-branched Bacteroides sphinganines to an unbranched sphinganine standard to provide further evidence of the sphinganine backbone structure (Fig. S6F). MS/MS spectra of C18 sphinganine and the iso-C17 sphinganine were nearly identical (Fig S6F). Conversely, MS/MS spectra were not identical between the mammalian standard for C18 dihydroceramide and the Bacteroides dihydroceramide, indicative of the fact the bacteria synthesize unique dihydroceramides with a third hydroxyl-group and odd-chain length backbones (Fig. S6G). Unfortunately, commercial standards to confirm the accuracy of these DHCer-based bacterial sphingolipids do not exist; thus we based our predictions on the aforementioned NMR data from previously published studies (An et al., 2014; Wieland Brown et al., 2013). Our data illustrate that Bacteroides Spt catalyzes a reaction resulting in N-acylated lipids and is responsible for many more lipid products than previously recognized.
Bacteroides sphingolipids are negatively correlated with inflammation and IBD in humans
To determine the relevance of the newly annotated Bacteroides sphingolipids to intestinal inflammation, we searched the IBD stool metabolomics dataset described in Figure 1 and found bacterial-produced sphinganine, DHCer, CerPE and CerPI in 94% (146/155) of metabolomes (Fig. S7A). The 9 samples without Bacteroides sphingolipids corresponded to CD or UC subjects, 7 of which also had less than 0.1% of their gut microbiota mapped to the phylum Bacteroidetes. We detected positive correlations (Pearson’s; p<0.01) between CerPE abundance and both the abundance of Bacteroidetes (Fig. S7B) and the spt gene (Fig. S7C), suggesting Bacteroidetes produce the vast majority of non-host sphingolipids in the intestine.
Bacteroidetes sphingolipid production was significantly decreased in UC and CD (Hochberg-Benjamini, FDR <0.05) (Fig. 7). Bacterial sphinganine, DHCer, and CerPE abundances were significantly lower in UC patients compared to non-IBD controls (Fig. 7A–D). DHCer and CerPE abundances in CD patients were less than half those in controls (q=0.021; q=0.027) (Fig. 7C, D). Sphinganine was significantly decreased (p=0.048) in UC but not CD, where there was a subset of samples with high sphinganine levels (Fig. 7B). CerPI was also reduced in UC, although this did not reach statistical significance (Fig. 7E). Deoxysphingolipids, specifically deoxysphinganine and deoxy-DHCer, were also detected in human stool but were not decreased in UC or CD compared to control samples (Fig. 7F, G). We used fecal calprotectin levels (a biomarker for intestinal inflammation) and batched UC and control samples into two groups: fecal calprotectin level less than 100 μg/g stool (lower inflammation) and greater than 100 μg/g stool (higher inflammation). Stratifying CerPE, DHCer, sphinganine and deoxysphingolipid abundances across these samples revealed a negative correlation between bacterial sphingolipid abundance and significant intestinal inflammation (50th percentile, μg/g stool) (Fig. 7H). Further, there was a negative correlation between fecal calprotectin level and Bacteroides-derived CerPE, DHCer and sphinganine abundances (Pearson’s; p=0.008, p=0.0071, p=0.024, respectively) (Fig. S7D–F). Deoxysphingolipids showed no decreases in samples with high levels of inflammation (Fig. 7H). When sphingolipid abundance in UC and CD samples was stratified by disease activity, we found decreases in DHCer, CerPE and sphinganine in samples with active disease (Harvey-Bradshaw index >3 for CD; Simple clinical colitis index (SCCI) >5 for UC) (Fig. 7I, J). The corresponding abundance of Bacteroidetes by metagenomic analysis was also lower in active CD but not statistically significant (Fig. 7K).
Figure 7: Bacteroides sphingolipids are significantly decreased during IBD and negatively correlated with intestinal inflammation.

Relative abundances of Bacteroides-produced sphinganine, DHCer, CerPE, and CerPI were quantified in stool of ulcerative colitis (UC), Crohn’s disease (CD), and non-IBD control subjects. (A) A heat-map displaying the relative abundances found in UC and control samples. Red indicates increased and blue indicates decreased relative abundances for each sample (rows) and metabolite (columns). Relative abundances in control (blue), UC (yellow), and CD (red) stool are shown for (B) C17 sphinganine, (C) DHCer, (D) CerPE, (E) CerPI, (F) C17 deoxysphinganine, and (G) C17 deoxy-DHCer. (H) The relative abundance of each of these sphingolipids was stratified by low-grade inflammation (fecal calprotectin <100 μg/g; blue) and high-grade inflammation (fecal calprotectin >100 μg/g; red). Bacteroides sphingolipid abundances in (I) UC or (J) CD were further stratified by active disease (Harvey-Bradshaw index >3 for CD and SCCI index >5 for UC; red) or remission (blue). (K) The corresponding percentage abundance of Bacteroidetes by metagenomic analysis was plotted to compare samples from patients with active disease versus those in remission. Statistical significance in panels (B, C, D) was determined by analysis of the FDR (*FDR<0.05; **FDR<0.01; ***FDR<0.001). Statistical analysis in (H, I, J, K) was performed using the Mann-Whitney U-test (*p<0.05; **p<0.01). Error bars are +/− SEM. See also Figure S7 and Data File S1.
C18 sphinganine and C18 deoxysphinganine, produced by both the host and Bacteroides, did not significantly correlate with disease (Fig. S7G, H). Additionally, C18 sphingosine abundance increased in BTΔSPT- compared to BTWT-colonized mice, which have bacterial sphingolipids present (Fig. S7I). This correlation was also observed in the IBD cohort: in the subset of UC patients where less than 1% of the gut microbiota were Bacteroidetes, the abundance of host- produced C18 sphingosine was strikingly high relative to other samples (Fig. S7J). We found a negative correlation (Pearson; p=0.008) between host ceramide abundance and Bacteroides DHCer abundance across control and UC samples (Fig. S7K). There was also a negative correlation between C17 sphinganine and C18 sphinganine production across control and UC samples (Fig. S7L), and a higher abundance of C18 sphinganine was detected in samples in which C17 sphinganine was not detected (Fig. S7M). In UC samples with SCCI index data, total sphingomyelin abundance was approximately 10-fold higher in patients with active disease compared to those in remission (Fig. S7N). Active UC samples had significantly lower Bacteroides DHCer abundance (Fig. 7I). Together, these data indicate the host may compensate for a lack of bacterially-produced sphingolipids during IBD.
Discussion
Gut microbiota metabolites signal to the host and contribute positively and negatively to health outcomes in IBD (Lee-Sarwar et al., 2018; Wlodarska et al., 2015). A major roadblock to deciphering these signals is a fundamental lack of understanding of microbiota-produced metabolites. Identifying and characterizing gut metabolites of bacterial origin remains difficult in part due to an inability to distinguish between bacterial and host metabolite features. In this study, we successfully de-coupled host and bacterial sphingolipids, finding that Bacteroides sphingolipids are significantly decreased in stool of IBD subjects and negatively correlated with gut inflammation, while host sphingolipids were increased in IBD stool and negatively associated with Bacteroidetes abundance. Our in vivo mouse studies corroborated these human cohort data, providing evidence that both bacterial and host sphingolipid pathways are dysregulated during inflammation and IBD. This finding is significant given the central role of sphingolipid signaling in pathways linked to IBD pathogenesis (e.g. autophagy, ER stress, innate immune responses, G-protein-coupled-receptor signaling), the high abundance of sphingolipid-producing bacteria in the healthy human gut (Bryan et al., 2016) and the significant decrease in Bacteroidetes abundance observed in several IBD cohorts (Gevers et al., 2014; Zhou and Zhi, 2016).
By analyzing germ-free mice colonized with wild-type or sphingolipid-deficient Bacteroides strains after 3 days, we delineated innate immune responses to the presence or absence of bacterial sphingolipids. We were unable to identify the NKT-cell interactor alpha-galactosylceramide in either the B. thetaiotaomicron or B. ovatus strain; thus, responses in this study are likely independent of this mechanism. BTWT-colonized mice lacked inflammation and altered histopathological features, consistent with previous studies (Goodman et al., 2009; Lee et al., 2013; Wexler and Goodman, 2017). BTΔSPT-colonized mice displayed signs of inflammation, with the strongest immune signal being an increase in macrophages in IEL and LPL populations. Increased macrophage presence could be explained by corresponding increases in MCP-1 secretion, which provides an inflammatory environment and chemokine signals to these cells.
The extent to which inflammation in BTΔSPT-colonized mice is a direct effect of bacterial sphingolipid deficiency is still unclear, as other downstream changes could confound this observation. Our transcriptome analysis revealed that many polysaccharide genes were also differently expressed in these mice. Conversely, these inflammatory signals could be due to a sphingolipid-mediated loss in tolerogenic signals from the bacteria. Host immune systems have evolved to respond to colonization by symbiotic bacteria in a largely tolerogenic manner, and conserved outer membrane components can play a role in Bacteroides symbiotic capabilities (Donaldson et al., 2018; Round et al., 2011; Vatanen et al., 2016). Through RNA expression profiles, metabolomic analyses, sIgA-binding and membrane ultrastructures, we concluded that the outer membranes of sphingolipid-deficient Bacteroides strains are significantly different from wild-type, potentially preventing symbiotic host interactions.
We characterized the full repertoire of Bacteroides sphingolipids and identified dihydroceramide sphingolipids among the most abundant metabolite features in human and mouse stool. Bacterial dihydroceramides were synthesized with sphinganines ranging from C15 to C20, however C17-, C18- and C19-based lipids were the most abundant. Functional differences imparted from varying acyl-chain lengths of bacterial sphingolipids are unclear; however, chain length differences in mammalian ceramides affect signaling potency (Grosch et al., 2012). Here, we inferred structures based on previous literature showing Bacteroides sphingolipids have branched acyl-chains and an extra hydroxyl group on the secondary acyl-chain attached to the sphinganine backbone (Wieland Brown et al., 2013). Studies suggest the branched acyl-chain and hydroxyl group could impart more potent signaling potential (Hannun and Obeid, 2008; Siddique et al., 2015).
In addition to known bacterial sphingolipids, our bacterial dataset identified deoxysphingolipids that were previously only described in eukaryotic cells. These deoxy-sphinganines and deoxy-dihydroceramides have a characteristic methyl head-group resulting from incorporation of alanine rather than serine (Duan and Merrill, 2015). Importantly, the lack of a free hydroxyl on the deoxy-dihydroceramide head-group makes the molecule unamenable to enzymatic additions of more complex head-groups and leads to a dead-end in the pathway. Deoxy-dihydroceramide accumulation can have unique signaling properties, such as activating protein kinase C-zeta, and impact diseases such as diabetes through insulin signaling alterations (Duan and Merrill, 2015). We also demonstrated gut bacteria produce a sphingolipid metabolite consistent with CerPI, a sphingolipid that is commonly synthesized in yeast (Ren and Hannun, 2016). Although the precise functions of deoxysphingolipid and CerPI in host and bacterial processes are unknown—as are the contributions of fungi to the production of these sphingolipids—our study suggests that Bacteroides sphingolipid production is essential for maintenance of the symbiotic relationship with mammalian hosts.
STAR Methods
CONTACT FOR REAGENT AND RESOURCE SHARING
Further information and requests for reagents may be directed to and will be fulfilled by Lead Contact, Ramnik J. Xavier (xavier@molbio.mgh.harvard.edu).
EXPERIMENTAL MODEL AND SUBJECT DETAILS
Mouse experiments
Six-week old, female C57BL/6N germ-free mice were purchased from Taconic USA and maintained at a facility in either the University of British Columbia or Joslin Diabetes Center at Harvard Medical School. In each facility, mice were housed in cages with 3 mice per cage and given access to sterilized food and water ad libitum. Mice were allocated to experimental groups randomly. After inoculation, mice were housed in a barrier facility at UBC and a germ-free facility at Joslin, and sterility was maintained for 3 days until the experimental endpoint. All experimental procedures were conducted under protocols approved by the Institutional Animal Care and Use Committee (IACUC) at each institution.
Human Subjects
Stools samples from non-inflammatory bowel disease (IBD) control individuals or patients with Crohn’s disease (CD) or ulcerative colitis (UC) were taken from the Prospective Registry in IBD Study at MGH (PRISM). Details of this patient registry have been described previously in great detail, and all data is publicly available (Ananthakrishnan et al., 2014; Franzosa et al., 2019). Briefly, PRISM is a prospective cohort of adult IBD patients (>18 years of age) who were selected for the study based on standard criteria from endoscopic, radiographical and histological analyses. Controls are pre-screened for eligibility and recruited prior to appointment. The cohort consists of a total of 155 individuals (n=155), of which 34 were non-IBD controls, 53 were from UC patients and 68 were from CD patients. The samples were from a total of 74 males and 81 females, who were an average of 42 years old (+/− 16.9 years; standard deviation). Analysis of these samples did not take into account sex or age of the subjects to be consistent with the analysis from data derived from Franzosa et al. 2019. Analysis of these samples did not take into account gender or age of the subjects given it was an adult cohort, and IBD diagnosis and treatment is the same for both genders. This gender analysis is consistent with the analysis from data derived from the same cohort published by Franzosa et al. 2019. The study was approved by the Institutional Review Board of Partners Healthcare (ref. 2004-P-001067), and all patients provided informed consent.
METHOD DETAILS
Bacterial strains and growth conditions
All strains used are listed in the Key Resources Table. The Bacteroides strains we used were all generated from the B. ovatus ATCC 8483 and B. thetaiotaomicron VPI-5482 strains, each carrying a deletion in the tdk gene as previously described (Larsbrink et al., 2014; Martens et al., 2008). Bacteroides strains were cultured anaerobically at 37°C in liqu id Brain Heart Infusion (BHI, Becton Dickinson) medium supplemented with 1% Vitamin K1-Hemin Solution (VitK/Hemin, Becton Dickinson) or on BHI agar (Becton Dickinson) supplemented with 1% VitK/Hemin. Cultures were grown and manipulated in an anaerobic chamber (Coy Laboratory Products) with an atmosphere of 20% CO2, 5% H2, and 75% N2 at 37°C. E. coli strains PIR2 (Invitrogen) and S17–1 λ pir were used for propagation and transfer, respectively, of R6K pir plasmids. E. coli strains were grown aerobically in Luria-Bertani (LB) medium at 37°C. When required, antibiotics were added to the medium as follows: ampicillin 100 μg/mL, gentamicin 200 μg/mL, and erythromycin 25 μg/mL.
Molecular cloning
The plasmids used in this study are listed in the Key Resources Table. All primers used in this study were synthesized by Integrated DNA Technologies (IDT) and listed in the Key Resources Table. DNA amplification for cloning procedures and colony PCR were carried out using Q5 High Fidelity DNA Polymerase (New England Biolabs). Genetic modifications generated on plasmids and Bacteroides strains were verified by Sanger sequencing (Genewiz). Overlap Extension (SOE) PCR (Bryksin and Matsumura, 2010) was utilized to generate B. ovatus spt deletion construct, followed by Restriction digest/ Gibson cloning (HiFi DNA Assembly Master Mix, New England Biolabs).
Unmarked chromosomal deletion in B. thetaiotaomicron and B. ovatus
In-frame deletion of the serine palmitoyl transferase gene (spt) in B. thetaiotaomicron Δtdkwas generated using a counter-selectable allelic exchange procedure (Koropatkin et al., 2008). Briefly, a 2 kb fragment concatenating the 700 bp upstream sequence, the first 291 bp of the SPT gene (BT_0870) followed by a stop, and the 1 kb downstream sequences of SPT was synthesized by IDT. The in-frame deletion in spt encodes only the first 97 amino acids of the B. thetaiotaomicron Spt protein. This 2 kb fragment was amplified using primer pairs BT0870_Up700b_BamHI _F and BT0870_Down1kb_NotI_R and ligated into the suicide vector pExchange_tdk (obtained from Dr. Harry Brumer, UBC) (Tamura et al., 2017). The resulting pExchange_tdk_BT0870_DEL vector was electroporated into E. coli S17–1 λ pir and then conjugated into B. thetaiotaomicron VPI-5482. Single recombinants were selected on BHI agar plates containing gentamicin and erythromycin, cultured in liquid BHI medium overnight without antibiotics and then plated onto BHI agar plates containing 200 μg/mL 5-fluoro-2-deoxyuridine (FUdR). Single colonies of spt deletion candidates were confirmed by PCR using the diagnostic primers BT0870_Up1kb_F and BT0870_Down1150b_R. The B. ovatus spt deletion mutant was generated in a similar fashion. Briefly, ~900 bp fragments upstream and downstream of the B. ovatus spt (BACOVA_02588) were cloned and fused using primer pairs ΔSPT Xba1-UPF (5’AGTCACGACGTTGTAAAACGACGGCCAGT-3’), BamH1 UPR-(5’-GGCGTAATCATGGTCATAGCTGTTTCCTG-3’), EcoR1-DNF (5’-GTTGTAAAACGACGGCCAGT-3’) and HindIII-DNR (5’-GGCGTAATCATGGTCATAGC-3’), respectively, and ligated into pExchange_tdk. The resulting pExchange_tdk_BACOVA_02588_DEL vector was electroporated into E. coli S17–1 λ pir and then conjugated into B. ovatus ATCC 8483. Single recombinants were selected on BHI agar plates containing gentamicin and erythromycin, cultured in liquid BHI plus medium [BHI supplemented with 5% heat inactivated fetal bovine serum, 1% vitamin K1-hemin solution (Becton Dickinson), 1% trace mineral supplement (ATCC), 1% vitamin supplement (ATCC), 2.9 mM (+)-cellobiose (Becton Dickinson), 2.9 mM maltose (Hardy Diagnostics), 5.8 mM D-(−)-Fructose (Sigma) and 2.8 mM L-Cysteine hydrochloride monohydrate (Sigma)] overnight without antibiotics, and then plated onto BHI plus agar plates containing 200 μg/mL FUdR. Single colonies of spt deletion candidates were screened and confirmed by PCR using the diagnostic primers BACOVA_02588 _Up1kb_F and BACOVA_02588 _Down1kb_R.
Spt complementation
A constitutively-expressing SPT construct was built by joining 300 base pairs of the BT_1311 (rpoD; a70) promoter to the SPT gene. Single-copy introduction of pNBU2 vectors harboring SPT gene into B. theta genomes and determination of genomic insertion site location was carried out as previously described (Koropatkin et al., 2008; Larsbrink et al., 2014; Martens et al., 2008). Overnight cultures of E. coli S17–1 λ pir donor strains were diluted 1,000-fold in LB medium containing ampicillin and Bacteroides recipients diluted 250-fold in BHI medium and each grown to early exponential phase (OD600 ~0.3). Donor and recipient strains were combined at a 1:1 donor:recipient culture volume ratio, centrifuged at 4,000 rpm for 5 min, re-suspended in 1 mL of BHI-VitK/Hemin liquid medium and plated as a puddle on non-selective BHI plus agar plates for 12 hr at 37°C under aerobic conditions to allow for conjugation. Biomass from mating lawns were streaked on BHI plus agar plates containing gentamicin and erythromycin to select for conjugants. Insertion site location was verified by PCR.
Isolation and purification of sphingolipids from bacterial cell culture
B. ovatus Δtdk ATCC 8483, B. ovatus Δtdk ΔSPT ATCC 8483, B. thetaiotaomicron Δtdk VPI-5482, and B. thetaiotaomicron Δtdk ΔSPT VPI-5482 were grown in 1 L batches of BHI with vitamin K/hemin supplementation, and harvested cells were extracted with a 1:2:0.8 ratio of CHCl3:MeOH:H2O for 18 hrs (all reagents purchased from Sigma-Aldrich). Subsequently, a 2:1 ratio of CHCl3 and H2O was added to the cell suspension for a final solvent ratio of 1:1:0.9 of CHCl3:MeOH:H2O. The lower chloroform phase was removed, and this organic extract was dried, stored at −20C, and later re-suspended in t he desired solvent. For isolation of CerPE, the crude extract was purified by a 2 mm silica preparative TLC plate (Sigma-Aldrich) with a running solvent of CHCl3:MeOH:AcOH:H2O at a 100:20:12:5 ratio, along with a CerPE migration standard C12 SPE (Avanti). Bacterial CerPE was confirmed by migration Rf equal to C12 sphingosyl-PE (Avanti) standard and staining with ninhydrin (Sigma-Aldrich). The resulting CerPE sphingolipid fraction was scraped and excised (Rf=0.35) and re-purified on a 0.2 mm TLC plate (Sigma-Aldrich) using the same separation solvent and extraction technique as above. Eluted lipids were stored dried in glass vials at −20°C.
Transcriptional analysis
Cultures of B. thetaiotaomicron VPI-5482 Δtdk and Δtdk Δspt were diluted 1:100 from overnight cultures into 5 mL of BHI medium, supplemented with 1% Vitamin K1-hemin (Becton Dickinson) or minimal medium [1× M9 salts (Teknova), 1% sterile-filtered fetal bovine serum (Sigma-Aldrich), 1% vitamin K1-hemin solution (Becton Dickinson), 1% trace mineral supplement (ATCC), 1% trace vitamin supplement (ATCC), 1 g/L D-(+)-cellobiose (Sigma-Aldrich), 1 g/L D-(+)-maltose (Sigma-Aldrich), 1 g/L D-(+)-fructose (Sigma-Aldrich) and 0.5 g/L L-cysteine (Sigma-Aldrich)] and grown to exponential phase (OD600 ~0.4) in anaerobic conditions. Each culture was pelleted in the anaerobic chamber, supernatants were decanted, and pellets were resuspended in 500 μL Trizol. Trizol suspensions underwent a step of bead-beating using ~500 μL of 0.1 mm silica beads (BioSpec). RNA was extracted with the Direct-Zol RNA MiniPrep Plus (Zymo Research) according to manufacturer’s instructions.
Generation of RNA-sequencing data
Illumina cDNA libraries were generated using a modified version of the RNAtag-seq protocol (Shishkin et al., 2015). Briefly, 500 ng-1 μg of total RNA was fragmented, depleted of genomic DNA, dephosphorylated, and ligated to DNA adapters carrying 5’-AN8-3’ barcodes of known sequence with a 5’ phosphate and a 3’ blocking group. Barcoded RNAs were pooled and depleted of rRNA using the RiboZero rRNA depletion kit (Epicentre). Pools of barcoded RNAs were converted to Illumina cDNA libraries in 2 main steps: (i) reverse transcription of the RNA using a primer designed to the constant region of the barcoded adaptor with addition of an adapter to the 3’ end of the cDNA by template switching using SMARTScribe (Clontech) as described (Zajac et al., 2013); (ii) PCR amplification using primers whose 5’ ends target the constant regions of the 3’ or 5’ adaptors and whose 3’ ends contain the full Illumina P5 or P7 sequences. cDNA libraries were sequenced on an Illumina NextSeq for monoculture transcriptomic data and on the Illumina HiSeq 2500 platform to generate paired-end reads for the transcriptomic data.
RNA-sequencing analysis
Sequencing reads from each sample were demultiplexed based on their associated barcode sequence using custom scripts. Up to 1 mismatch in the barcode was allowed provided it did not make assignment of the read to a different barcode possible. Barcode sequences were removed from the first read as were terminal G’s from the second read that may have been added by SMARTScribe during template switching. Reads were aligned using Burrows-Wheeler Alignment tool (BWA), and read counts were assigned to genes and other genomic features using custom scripts. Differential expression analysis was conducted with edgeR (Robinson et al., 2010). Visualization of raw sequencing data and coverage plots in the context of genome sequences and gene annotations was conducted using GenomeView.
Electron microscopy
WT and ΔSPT cultures of B. thetaiotaomicron and B. ovatus were grown in 5 mL of BHI supplemented with hemin and vitamin K for 24 hrs. Resulting culture density was normalized. Cells were absorbed onto freshly ionized EM grids coated with carbon film. The grids were negative stained using 0.5% ammonium molybdate. Samples were examined using a FEI Technai Spirit transmission electron microscope (TEM) at magnifications 30,000X and 49,000X.
Bacterial cocktail preparation and inoculation
In an anaerobic chamber, bacterial cultures from frozen stocks were first plated on BHI supplemented with hemin and vitamin K, and subsequently pure cultures were selected and mixed together at a 1:1 ratio in sterile, reduced phosphate-buffered saline (PBS). Bacterial mixtures in PBS were removed from the anaerobic chamber and immediately transported to the animal facility for gavage experiments. The volume of the mixture received per mouse was 100 μL, at a concentration of 109 cells/mL. The concentration of the mixture in cell/mL was determined using a UV spectrometer, and gavage doses were confirmed by back-titering the inocula.
Flow cytometry
For quantification of sIgA-bound bacteria, a dilution of 10 mg of stool containing approximately 109 cells/mL of Bacteroides were stained on ice with a 1/50 dilution of anti-mouse IgA (eBioscience) in 2% bovine serum albumin (BSA) in PBS. Bacterial cultures were then washed in PBS and analyzed on a CytoFLEX (Beckman-Coulter) using software packages from CellQuest and FlowJo version 11. For host immune cell profiling, approximately 100,000 cells per mouse were stained with fluorochrome-conjugated antibodies against CD45, CD3ε, CD4, CD8, CD38, CD11 b, CD11 c, F4/80, and γδ TCR (eBioscience), and their populations were analyzed by an LSR II flow cytometer (BD Biosciences) and a CytoFLEX (Beckman-Coulter) using software packages from CellQuest and FlowJo version 11.
Intraepithelial lymphocyte and lamina propria lymphocyte isolation
Approximately 5 cm of the ileum and distal colon of mice was excised, attached fat and Peyer’s patches were removed, and tissues were cut longitudinally to further remove luminal contents by washing with ice-cold PBS. Epithelial cells were isolated using a PBS buffer containing 1 mM EDTA, 1 mM DTT and 5% FBS, shaking at 37C for 10 m in. The intact intestinal tissue was resuspended in additional PBS buffer containing 1 mM EDTA, 1 mM DTT and 5% FBS, shaking at 37°C for 20 min in order to isolate intraepithelial lymphocytes (lELs). Lamina propria lymphocytes (LPLs) were purified by digesting the remaining tissue for 30 min at 37°C with 1 μg/mL DNase and 0.5 mg/mL collagenase. After digestion, lymphocytes were further purified using a 40% Percoll gradient, re-suspended in RPMI 1640 with 5% FBS, and enumerated using a hemocytometer.
Cytokine profiling
For ex vivo quantification of cytokine secretion, small intestinal epithelia were washed with complete tissue culture media (RPMI, 10% FBS, 1% glutamine and 1% of 1:1 penicillin/streptomycin) and cultured in 1 mL of the same media in 24-well plates for 24 hours at 37°C, 5% carbon dioxide. The resulting supernatants were used to determine the amount of each cytokine using murine-specific ELISA kits (BD Biosciences) and a CBA flex set (BD Biosciences), relative to a standard curve, according to the manufacturer’s recommendations.
RT-qPCR
RNA was extracted from mouse colon tissue and further purified using the RNeasy kit (Qiagen), and 1 μg was used to generate cDNA using the iScript synthesis kit (Bio-Rad). We then performed qPCR using the SYBR Green Super mix (Bio-Rad). Each sample was run in a 10 μL total volume using a PCR program consisting of: initial denaturation at 95 °C for 10 min, followed by 40 cycles of 95 °C for 15 s and 60 °C f or 1 min, and a final extension at 72 °C for 10 min. The primers used for each gene are listed in the Key Resources Table.
Histology and immunohistochemistry analysis
Intestinal sections 1 cm in length were collected from the ileum and colon of mice and immediately placed in 10% buffered formalin overnight at room temperature. Paraffin-embedded tissues were cut into 5 μm slices and stained with hematoxylin and eosin (H&E) using standard techniques. H&E-stained tissues were visualized under a light microscope, and villous length and crypt depth of each villous and crypt of the tissue were enumerated using microscopy software and ImageJ. For visualizing the mucus sugars, paraffin-embedded tissues were cut into 5 μm slices and stained with Alcan blue-periodic acid (AB-PAS) using standard techniques. For immunohistochemistry, histological sections were baked, de-paraffinized, stained and washed using standard methods. KI-67 was visualized using a 1/80 dilution of an anti-KI-67 antibody purchased from BioLegend (652402). F4/80 was visualized using a 1/75 dilution of anti-F4/80 antibody purchased from Abcam (ab6640).
Mouse colon spheroid culture
Colonic crypts were isolated from C57BL/6N mice and cultured as previously described (Miyoshi and Stappenbeck, 2013). Briefly, crypts were isolated from mice by incubation of colonic tissue in 8 mM EDTA in PBS for 60 min at 4°C, followed by manual disruption of the tissue by pipetting. Crypts were plated in 15 μl Matrigel basement membrane (Corning) and maintained in 50% L-WRN conditioned media (L-WRN conditioned media, diluted with advanced DMEM F-12 supplemented with 20% FBS, GlutaMAX, and penicillin-streptomycin). Media was replaced every 2 days, and spheroids were passaged every 3–4 days.
2D Mouse intestinal monolayer culture
2D mouse intestinal monolayer culture has been previously described (Mohanan et al., 2018; Moon et al., 2014). Briefly, day-3 colonic spheroids were dissociated into single cells using TrypLE Express and passed through a 70 μm filter into 50% L-WRN conditioned medium containing 10 μM Y27632 (R&D Systems). 3×10⁵ cells were plated on a 24-well transwell insert (Costar, #3470) coated with 1:40 Matrigel diluted in PBS. 150 μL of medium was added to the upper compartment and 600 μL of medium was added to the lower compartment. After 24 h, the media in both compartments was replaced with 50% L-WRN medium. After an additional 24 h, the media was replaced with 5% L-WRN medium to induce differentiation. Media was replaced daily, and monolayers were maintained for up to 5 days.
Trans-epithelial electrical resistance measurement
Resistance of monolayers was measured using an ohmmeter (EVOM2, World Precision instruments). The resistance value, measured in ohms (Q), was obtained by subtracting the trans-epithelial electrical resistance (TEER) value of a blank insert and multiplying the difference by the growth surface area of the transwell insert.
Calcium chelation assay
As described above, 48hrs after seeding a monolayer, the medium from the upper and lower compartment was replaced with 5% L-WRN conditioned medium. After 16hr incubation in 5% L-WRN medium, monolayers were treated by adding 2 mM EDTA to the upper compartment medium for 8 min, after which the medium was replaced with 5% L-WRN medium. TEER was measured repeatedly throughout the assay.
Lipidomic Profiling
WT and ΔSPT cultures of B. thetaiotaomicron and B. ovatus were grown in 5 mL of BHI liquid media supplemented with vitamin K and hemin. After 24 hrs, cultures were normalized by OD60o and centrifuged at 8,000 rpm for 10 min to pellet cells. Resulting pellets were washed and further centrifuged twice to remove residual media. Resulting pellets were resuspended in 5 mL isopropanol + 0.1 ng/μL C24:0 PC, incubated at RT for 1 hr, and centrifuged for 10 min at 10,000g. From each sample, 2 μL was injected on a Q-Exactive Focus. In parallel, caecal samples from germ-free mice colonized with B. thetaiotaomicron WT or the ΔSPT mutant were weighed, and 20 mg of each wet-weight sample was extracted using 200 μL isopropanol + 0.1 ng/μL C24:0 PC, incubated at RT for 1 hr, and centrifuged for 10 min at 10,000g. From each sample, 2 μL was injected on a Q-Exactive Focus. These samples from the caecal content were median-scaled to the metabolite intensity from the bacterial pellets. Lipid extracts were analyzed using a Nexera X2 U-HPLC (Shimadzu, Marlborough, MA) coupled to an Exactive Plus orbitrap mass spectrometer (Thermo Fisher Scientific; Waltham, MA). Extracts (10μL) were injected onto a ACQUITY UPLC BEH C8 column (1.7μm, 2.1 × 100 mm; Waters; Milford, MA). The column was initially eluted isocratically at a flow rate of 450 μL/min with 80% mobile phase A (95:5:0.1 vol/vol/vol 10mM ammonium acetate/methanol/formic acid) for 1 minute followed by a linear gradient to 80% mobile phase B (99.9:0.1 vol/vol methanol/formic acid) over 2 minutes, a linear gradient to 100% mobile phase B over 7 minutes, and then 3 minutes at 100% mobile phase B. Mass spectrometry (MS) analyses were carried out using electrospray ionization in the positive ion mode (source voltage was 3kV, source temperature was 30013, sheath gas was 50.0, auxiliary gas was 15) using full scan analysis over m/z 200–1100 and at 70,000 resolution. Metabolite identities were confirmed using reference standards and MS/MS peaks. Raw data were processed using TraceFinder 3.1 (Thermo Fischer) and Progenesis QI (Nonlinear dynamics). Tandem Mass Spectrometry was collected using a Q Exactive Plus hybrid quadrupole orbitrap mass spectrometer (Thermo Fisher Scientific; Waltham, MA). Using Parallel Reaction Monitoring (PRM), MS/MS was collected on all masses of interest. The collision energies used were 10, 20, 30, 40, and 50. The isolation window was 1.0 m/z, and the resolution was 35,000.
Alanine-labelling
WT and ΔSPT cultures of B. thetaiotaomicron and B. ovatus were grown in 5 mL of minimal media [M9 salts (Teknova), 1% vitamin K1-hemin solution (Becton Dickinson), 1% trace mineral supplement (ATCC), 1% trace vitamin supplement (ATCC), 2% lactose)] supplemented with 10μM of deuterium (D4)-labelled alanine (Sigma) or 10μM of unlabeled alanine (Sigma). After 48 hrs, resulting cultures were pelleted by centrifugation at 8,000 rpm for 10 min and cell density was normalized. Lipids were extracted using isopropanol and sent for lipidomic analysis.
QUANTIFICATION AND STATISTICAL ANALYSIS
Statistical analysis
Statistical significance for the difference between two treatment groups was calculated by using a two-tailed Student’s t-test or the Mann-Whitney U-test (for non-parametric data) unless otherwise stated. For the metabolomics and RNA-seq analysis, statistical significance was determined by false discovery rate (FDR) analysis using the Hochberg-Benjamini procedure. For assessing statistical significance among three or more groups, a one-way ANOVA with post hoc Tukey’s test was utilized. The “n” number reported in each figure legend refers to biological replicates for mouse, human or cultured monolayer studies. Statistical analysis was performed with assistance from R-Studio, metaboanalyst version 4.0 or GraphPad Prism version 7.0. Statistical significance was given as *** p-value < 0.001; ** p-value < 0.01; * p-value < 0.05; NS (not significant) p-value > 0.05. The results are expressed as the mean value with standard error of the mean (SEM), unless otherwise indicated.
DATA AND SOFTWARE AVAILABILITY
The metabolomics data is available at the NIH Common Fund’s Metabolomics Data Repository and Coordinating Center (supported by NIH grant, U01-DK097430) website, the Metabolomics Workbench, http://www.metabolomicsworkbench.org, where it has been assigned Project ID PR000754. The data can be accessed directly via it’s Project DOI: 10.21228/M8709G. The MS/MS spectral libraries were deposited at The Global Natural Product Social Molecular Networking (GNPS) database and are publicly available under its Project MassIVE ID MSV000083552, doi:10.25345/C5862T. The RNA-sequencing data was uploaded to the Sequence Read Archive (SRA) and is available under Project ID PRJNA517943. The processed RNA-sequencing and metabolomics data are available in the supplementary material (Data Files S1–5).
Supplementary Material
Data File S2. Related to Figure 2. RNA-sequencing: minimal and BHI media
Data File S5. Related to Figure 6. D4-alanine labeling
Highlights.
Colonization with a sphingolipid-deficient Bacteroides strain is pro-inflammatory
Metabolomics describe Bacteroides sphingolipids and their biosynthetic pathway
IBD patients have decreased Bacteroides sphingolipids but increased host sphingolipids
Acknowledgements
The authors are grateful to Dr. Harry Brumer for providing the B. ovatus strain and Thomas Cullen and Eric Martens for the B. thetaiotaomicron strain. We thank the animal facility at Joslin and UBC for facilitating our germ-free mouse experiments, the PRISM IBD cohort at Massachusetts General Hospital for their participation in the study, Theresa Reimels for editing text and figures to improve the manuscript, and Jonathan Livny and the Broad Institute Microbial ‘Omics Core for generating RNA sequencing data. EMB was supported by a Canadian Institutes of Health (CIHR) post-doctoral fellowship. ADK was funded by a Smith Family Foundation Award for Excellence in Biomedical Research and an American Diabetes Association Pathway to Stop Diabetes Initiator Award. BBF was funded by a CIHR grant. RJX was funded by the National Institutes of Health (P30 DK043351, R24 DK110499 and R01 AT009708), the Crohn’s and Colitis Foundation of America, and the Center for Microbiome Informatics and Therapeutics at MIT.
Footnotes
Declaration of Interests
RJX is a consultant to Novartis and Nestle.
Publisher's Disclaimer: This is a PDF file of an unedited manuscript that has been accepted for publication. As a service to our customers we are providing this early version of the manuscript. The manuscript will undergo copyediting, typesetting, and review of the resulting proof before it is published in its final citable form. Please note that during the production process errors may be discovered which could affect the content, and all legal disclaimers that apply to the journal pertain.
References
- An D, Na C, Bielawski J, Hannun YA & Kasper DL (2011). Membrane sphingolipids as essential molecular signals for Bacteroides survival in the intestine. Proc Natl Acad Sci U S A, 108 Suppl 1, 4666–71. [DOI] [PMC free article] [PubMed] [Google Scholar]
- An D, Oh SF, Olszak T, Neves JF, Avci FY, Erturk-Hasdemir D, Lu X, Zeissig S, Blumberg RS & Kasper DL (2014). Sphingolipids from a symbiotic microbe regulate homeostasis of host intestinal natural killer T cells. Cell, 156, 123–33. [DOI] [PMC free article] [PubMed] [Google Scholar]
- Ananthakrishnan AN, Huang H, Nguyen DD, Sauk J, Yajnik V & Xavier RJ (2014). Differential effect of genetic burden on disease phenotypes in Crohn’s disease and ulcerative colitis: analysis of a North American cohort. Am J Gastroenterol, 109, 395–400. [DOI] [PMC free article] [PubMed] [Google Scholar]
- Bryan PF, Karla C, Edgar Alejandro MT, Sara Elva EP, Gemma F & Luz C (2016). Sphingolipids as Mediators in the Crosstalk between Microbiota and Intestinal Cells: Implications for Inflammatory Bowel Disease. Mediators Inflamm, 2016, 9890141. [DOI] [PMC free article] [PubMed] [Google Scholar]
- Bryksin AV & Matsumura I (2010). Overlap extension PCR cloning: a simple and reliable way to create recombinant plasmids. Biotechniques, 48, 463–5. [DOI] [PMC free article] [PubMed] [Google Scholar]
- Donaldson GP, Ladinsky MS, Yu KB, Sanders JG, Yoo BB, Chou WC, Conner ME, Earl AM, Knight R, Bjorkman PJ, et al. (2018). Gut microbiota utilize immunoglobulin A for mucosal colonization. Science, 360, 795–800. [DOI] [PMC free article] [PubMed] [Google Scholar]
- Duan J & Merrill AH Jr. (2015). 1-Deoxysphingolipids Encountered Exogenously and Made de Novo: Dangerous Mysteries inside an Enigma. J Biol Chem, 290, 15380–9. [DOI] [PMC free article] [PubMed] [Google Scholar]
- Franzosa EA, Sirota-Madi A, Avila-Pacheco J, Fornelos N, Haiser HJ, Reinker S, Vatanen T, Hall AB, Mallick H, Mciver LJ, et al. (2019). Gut microbiome structure and metabolic activity in inflammatory bowel disease. Nat Microbiol, 4, 293–305. [DOI] [PMC free article] [PubMed] [Google Scholar]
- Futerman AH & Hannun YA (2004). The complex life of simple sphingolipids. EMBO Rep, 5, 777–82. [DOI] [PMC free article] [PubMed] [Google Scholar]
- Gable K, Gupta SD, Han G, Niranjanakumari S, Harmon JM & Dunn TM (2010). A disease-causing mutation in the active site of serine palmitoyltransferase causes catalytic promiscuity. J Biol Chem, 285, 22846–52. [DOI] [PMC free article] [PubMed] [Google Scholar]
- Gevers D, Kugathasan S, Denson LA, Vazquez-Baeza Y, Van Treuren W, Ren B, Schwager E, Knights D, Song SJ, Yassour M, et al. (2014). The treatment-naive microbiome in new-onset Crohn’s disease. Cell Host Microbe, 15, 382–392. [DOI] [PMC free article] [PubMed] [Google Scholar]
- Goodman AL, Mcnulty NP, Zhao Y, Leip D, Mitra RD, Lozupone CA, Knight R & Gordon JI (2009). Identifying genetic determinants needed to establish a human gut symbiont in its habitat. Cell Host Microbe, 6, 279–89. [DOI] [PMC free article] [PubMed] [Google Scholar]
- Grosch S, Schiffmann S & Geisslinger G (2012). Chain length-specific properties of ceramides. Prog Lipid Res, 51, 50–62. [DOI] [PubMed] [Google Scholar]
- Hannun YA & Obeid LM (2008). Principles of bioactive lipid signalling: lessons from sphingolipids. Nat Rev Mol Cell Biol, 9, 139–50. [DOI] [PubMed] [Google Scholar]
- Hannun YA & Obeid LM (2018). Sphingolipids and their metabolism in physiology and disease. Nat Rev Mol Cell Biol, 19, 175–191. [DOI] [PMC free article] [PubMed] [Google Scholar]
- Heaver SL, Johnson EL & Ley RE (2018). Sphingolipids in host-microbial interactions. Curr Opin Microbiol, 43, 92–99. [DOI] [PubMed] [Google Scholar]
- Human Microbiome Project, C. (2012). Structure, function and diversity of the healthy human microbiome. Nature, 486, 207–14. [DOI] [PMC free article] [PubMed] [Google Scholar]
- Kato M, Muto Y, Tanaka-Bandoh K, Watanabe K & Ueno K (1995). Sphingolipid composition in Bacteroides species. Anaerobe, 1, 135–9. [DOI] [PubMed] [Google Scholar]
- Koberlin MS, Snijder B, Heinz LX, Baumann CL, Fauster A, Vladimer GI, Gavin AC & Superti-Furga G (2015). A Conserved Circular Network of Coregulated Lipids Modulates Innate Immune Responses. Cell, 162, 170–83. [DOI] [PMC free article] [PubMed] [Google Scholar]
- Koropatkin NM, Martens EC, Gordon JI & Smith TJ (2008). Starch catabolism by a prominent human gut symbiont is directed by the recognition of amylose helices. Structure, 16, 1105–15. [DOI] [PMC free article] [PubMed] [Google Scholar]
- Kunsman JE (1973). Characterization of the lipids of six strains of Bacteroides ruminicola. J Bacteriol, 113, 1121–6. [DOI] [PMC free article] [PubMed] [Google Scholar]
- Labach JP & White DC (1969). Identification of ceramide phosphorylethanolamine and ceramide phosphorylglycerol in the lipids of an anaerobic bacterium. J Lipid Res, 10, 528–34. [PubMed] [Google Scholar]
- Larsbrink J, Rogers TE, Hemsworth GR, Mckee LS, Tauzin AS, Spadiut O, Klinter S, Pudlo NA, Urs K, Koropatkin NM, et al. (2014). A discrete genetic locus confers xyloglucan metabolism in select human gut Bacteroidetes. Nature, 506, 498–502. [DOI] [PMC free article] [PubMed] [Google Scholar]
- Lee SM, Donaldson GP, Mikulski Z, Boyajian S, Ley K & Mazmanian SK (2013). Bacterial colonization factors control specificity and stability of the gut microbiota. Nature, 501, 426–9. [DOI] [PMC free article] [PubMed] [Google Scholar]
- Lee-Sarwar K, Kelly RS, Lasky-Su J, Moody DB, Mola AR, Cheng TY, Comstock LE, Zeiger RS, O’connor GT, Sandel MT, et al. (2018). Intestinal microbial- derived sphingolipids are inversely associated with childhood food allergy. J Allergy Clin Immunol, 142, 335–338 e9. [DOI] [PMC free article] [PubMed] [Google Scholar]
- Maceyka M & Spiegel S (2014). Sphingolipid metabolites in inflammatory disease. Nature, 510, 58–67. [DOI] [PMC free article] [PubMed] [Google Scholar]
- Martens EC, Chiang HC & Gordon JI (2008). Mucosal glycan foraging enhances fitness and transmission of a saccharolytic human gut bacterial symbiont. Cell Host Microbe, 4, 447–57. [DOI] [PMC free article] [PubMed] [Google Scholar]
- Merrill AH Jr. & Carman GM (2015). Introduction to Thematic Minireview Series: Novel Bioactive Sphingolipids. J Biol Chem, 290, 15362–4. [DOI] [PMC free article] [PubMed] [Google Scholar]
- Miyagawa E, Azuma R, Suto T & Yano I (1979). Occurrence of free ceramides in Bacteroides fragilis NCTC 9343. J Biochem, 86, 311–20. [DOI] [PubMed] [Google Scholar]
- Miyoshi H & Stappenbeck TS (2013). In vitro expansion and genetic modification of gastrointestinal stem cells in spheroid culture. Nat Protoc, 8, 2471–82. [DOI] [PMC free article] [PubMed] [Google Scholar]
- Mohanan V, Nakata T, Desch AN, Levesque C, Boroughs A, Guzman G, Cao Z, Creasey E, Yao J, Boucher G, et al. (2018). C1orf106 is a colitis risk gene that regulates stability of epithelial adherens junctions. Science, 359, 1161–1166. [DOI] [PMC free article] [PubMed] [Google Scholar]
- Moon C, Vandussen KL, Miyoshi H & Stappenbeck TS (2014). Development of a primary mouse intestinal epithelial cell monolayer culture system to evaluate factors that modulate IgA transcytosis. Mucosal Immunol, 7, 818–28. [DOI] [PMC free article] [PubMed] [Google Scholar]
- Nielsen OH, Li Y, Johansson-Lindbom B & Coskun M (2017). Sphingosine-1-Phosphate Signaling in Inflammatory Bowel Disease. Trends Mol Med, 23, 362–374. [DOI] [PubMed] [Google Scholar]
- Norris GH & Blesso CN (2017). Dietary and Endogenous Sphingolipid Metabolism in Chronic Inflammation. Nutrients, 9. [DOI] [PMC free article] [PubMed] [Google Scholar]
- Olsen I & Jantzen E (2001). Sphingolipids in bacteria and fungi. Anaerobe, 7, 103–112. [Google Scholar]
- Ren J & Hannun YA (2016). Metabolism and Roles of Sphingolipids in Yeast Saccharomyces cerevisiae In: Geiger O (eds) Biogenesis of Fatty Acids, Lipids and Membranes. Handbook of Hydrocarbon and Lipid Microbiology. Springer, Cham. [Google Scholar]
- Rizza V, Tucker AN & White DC (1970). Lipids of Bacteroides melaninogenicus. J Bacteriol, 101, 84–91. [DOI] [PMC free article] [PubMed] [Google Scholar]
- Robinson MD, Mccarthy DJ & Smyth GK (2010). edgeR: a Bioconductor package for differential expression analysis of digital gene expression data. Bioinformatics, 26, 13940. [DOI] [PMC free article] [PubMed] [Google Scholar]
- Round JL, Lee SM, Li J, Tran G, Jabri B, Chatila TA & Mazmanian SK (2011). The Toll-like receptor 2 pathway establishes colonization by a commensal of the human microbiota. Science, 332, 974–7. [DOI] [PMC free article] [PubMed] [Google Scholar]
- Shishkin AA, Giannoukos G, Kucukural A, Ciulla D, Busby M, Surka C, Chen J, Bhattacharyya RP, Rudy RF, Patel MM, et al. (20l5). Simultaneous generation of many RNA-seq libraries in a single reaction. Nat Methods, 12, 323–5. [DOI] [PMC free article] [PubMed] [Google Scholar]
- Siddique MM, Li Y, Chaurasia B, Kaddai VA & Summers SA (2015). Dihydroceramides: From Bit Players to Lead Actors. J Biol Chem, 290, 15371–9. [DOI] [PMC free article] [PubMed] [Google Scholar]
- Spiegel S & Milstien S (2011). The outs and the ins of sphingosine-1-phosphate in immunity. Nat Rev Immunol, 11, 403–15. [DOI] [PMC free article] [PubMed] [Google Scholar]
- Sumner LW, Amberg A, Barrett D, Beale MH, Beger R, Daykin CA, Fan TW, Fiehn O, Goodacre R, Griffin JL, et al. (2007). Proposed minimum reporting standards for chemical analysis Chemical Analysis Working Group (CAWG) Metabolomics Standards Initiative (MSI). Metabolomics, 3, 211–221. [DOI] [PMC free article] [PubMed] [Google Scholar]
- Tamura K, Hemsworth GR, Dejean G, Rogers TE, Pudlo NA, Urs K, Jain N, Davies GJ, Martens EC & Brumer H (2017). Molecular Mechanism by which Prominent Human Gut Bacteroidetes Utilize Mixed-Linkage Beta-Glucans, Major Health-Promoting Cereal Polysaccharides. Cell Rep, 21, 2030. [DOI] [PMC free article] [PubMed] [Google Scholar]
- Vatanen T, Kostic AD, D’hennezel E, Siljander H, Franzosa EA, Yassour M, Kolde R, Vlamakis H, Arthur TD, Hamalainen AM, et al. (2016). Variation in Microbiome LPS Immunogenicity Contributes to Autoimmunity in Humans. Cell, 165, 842–53. [DOI] [PMC free article] [PubMed] [Google Scholar]
- Wexler AG & Goodman AL (2017). An insider’s perspective: Bacteroides as a window into the microbiome. Nat Microbiol, 2, 17026. [DOI] [PMC free article] [PubMed] [Google Scholar]
- Wieland Brown LC, Penaranda C, Kashyap PC, Williams BB, Clardy J, Kronenberg M, Sonnenburg JL, Comstock LE, Bluestone JA & Fischbach MA (2013). Production of alpha-galactosylceramide by a prominent member of the human gut microbiota. PLoS Biol, 11, e1001610. [DOI] [PMC free article] [PubMed] [Google Scholar]
- Wlodarska M, Kostic AD & Xavier RJ (2015). An integrative view of microbiome-host interactions in inflammatory bowel diseases. Cell Host Microbe, 17, 577–91. [DOI] [PMC free article] [PubMed] [Google Scholar]
- Yard BA, Carter LG, Johnson KA, Overton IM, Dorward M, Liu H, Mcmahon SA, Oke M, Puech D, Barton GJ, et al. (2007). The structure of serine palmitoyltransferase; gateway to sphingolipid biosynthesis. J Mol Biol, 370, 870–86. [DOI] [PubMed] [Google Scholar]
- Yatsunenko T, Rey FE, Manary MJ, Trehan I, Dominguez-Bello MG, Contreras M, Magris M, Hidalgo G, Baldassano RN, Anokhin AP, et al. (2012). Human gut microbiome viewed across age and geography. Nature, 486, 222–7. [DOI] [PMC free article] [PubMed] [Google Scholar]
- Zajac P, Islam S, Hochgerner H, Lonnerberg P & Linnarsson S (2013). Base preferences in non-templated nucleotide incorporation by MMLV-derived reverse transcriptases. PLoS One, 8, e85270. [DOI] [PMC free article] [PubMed] [Google Scholar]
- Zhou Y & Zhi F (2016). Lower Level of Bacteroides in the Gut Microbiota Is Associated with Inflammatory Bowel Disease: A Meta-Analysis. Biomed Res Int, 2016, 5828959. [DOI] [PMC free article] [PubMed] [Google Scholar]
Associated Data
This section collects any data citations, data availability statements, or supplementary materials included in this article.
Supplementary Materials
Data File S2. Related to Figure 2. RNA-sequencing: minimal and BHI media
Data File S5. Related to Figure 6. D4-alanine labeling
Data Availability Statement
The metabolomics data is available at the NIH Common Fund’s Metabolomics Data Repository and Coordinating Center (supported by NIH grant, U01-DK097430) website, the Metabolomics Workbench, http://www.metabolomicsworkbench.org, where it has been assigned Project ID PR000754. The data can be accessed directly via it’s Project DOI: 10.21228/M8709G. The MS/MS spectral libraries were deposited at The Global Natural Product Social Molecular Networking (GNPS) database and are publicly available under its Project MassIVE ID MSV000083552, doi:10.25345/C5862T. The RNA-sequencing data was uploaded to the Sequence Read Archive (SRA) and is available under Project ID PRJNA517943. The processed RNA-sequencing and metabolomics data are available in the supplementary material (Data Files S1–5).