

Watch a video presentation of this article
Answer questions and earn CME
Abbreviations
- ALD
alcoholic liver disease
- AUD
alcohol use disorder
- CI
confidence interval
- DALY
disability‐adjusted life‐year
- RR
relative risk
Alcohol use is an intrinsic part of the pathophysiology of alcoholic liver disease (ALD). Understanding the epidemiology and changing trends in alcohol use in the United States and worldwide is important for those who care for patients with ALD. ALD is a spectrum of disease, which starts with steatosis and progresses to fibrosis and ultimately cirrhosis in approximately 20% to 25% of patients who drink heavily over many years.1 Chronic alcohol use of approximately 20 to 50 g/day for women or 60 to 80 g/day for men increases the risk for alcoholic cirrhosis.2
Defining Alcohol Use
Understanding the epidemiology of alcohol use requires understanding definitions of alcohol use and misuse, as well as understanding variation in what is considered a standard drink.3 In the United States, a standard drink contains 14 g of alcohol and is the equivalent of a 12‐ounce can of beer, 8 to 9 fluid ounces of malt liquor, a 1/2‐ounce shot of 80 proof spirits, or 5 ounces of wine (Fig. 1). Although the definition of a standard drink varies by country, a standard drink typically contains approximately 10 to 14 g of alcohol.4 Recommendations for safe limits for men and women in terms of drinking also vary worldwide; but in general, women are advised to drink less than men, typically about half as much.
Figure 1.
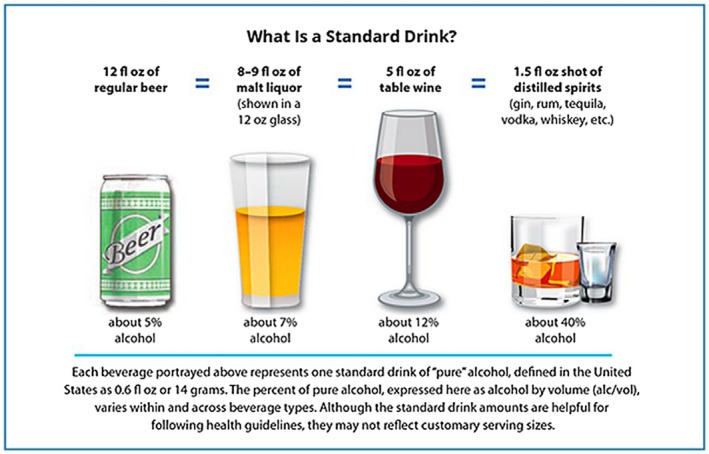
National Institute on Alcohol Abuse and Alcoholism guidance on US standard drink sizes.
Defining how much alcohol is too much is also critically important. Moderate alcohol use has been defined in the dietary guidelines for the United States as up to one drink a day for women or two standard drinks a day for men.5 Binge drinking is defined as drinking more than four standard drinks for women or more than five standard drinks for men in a single occasion. Heavy alcohol use has been defined as binge drinking 5 or more days in the past month.3 Alcohol use disorder (AUD) is defined by the use of large and escalating amounts of alcohol over a period of time with unsuccessful efforts to cut down; much time spent recovering, obtaining, or using alcohol; recurrent alcohol use when is physically hazardous; and craving and withdrawal.6 The accumulation of more symptoms results in a more severe AUD.
Global Alcohol Use Patterns: Who, What, and How much?
Globally, the average per capita alcohol consumption per year is approximately 6.4 L, having risen from 5.5 L in 2005.7 There is geographic variation in this amount, with the lowest amount of per capita alcohol consumption occurring in the Middle East and northern Africa, whereas Russia and Europe, particularly Eastern Europe, have some of the highest rates of per capita alcohol consumption, although encouragingly, those rates seem to be declining.7, 8 In Europe, the overall per capita consumption of alcohol declined from 12.1 to 9.8 L per person from 2000 to 2016, and in countries such as Russia, which were among the highest consumers of alcohol, per capita consumption declined from 18.7 to 11.7 L over the same time frame.7 By contrast, the Western Pacific and Southeast Asia regions saw increases in overall per capita alcohol consumption. Importantly, however, among drinkers, per capita consumption increased in nearly all regions of the world except Europe, indicating that those who do drink at all are drinking more heavily (Fig. 2).7 The types of alcohol consumed vary according to geography. Beer consumption made up 34% of total alcohol consumption and was the most commonly consumed alcoholic beverage in North America, South America, and Europe. Overall, however, spirits made up 45% of global alcohol consumption and were highest in the Southeast Asia region (88% of total consumption), the Western Pacific (59%), and the Middle East/Eastern Mediterranean region (48%).7 Reasons for these global variations are complex and include demographic, religious, and cultural factors, as well as economic development level.
Figure 2.
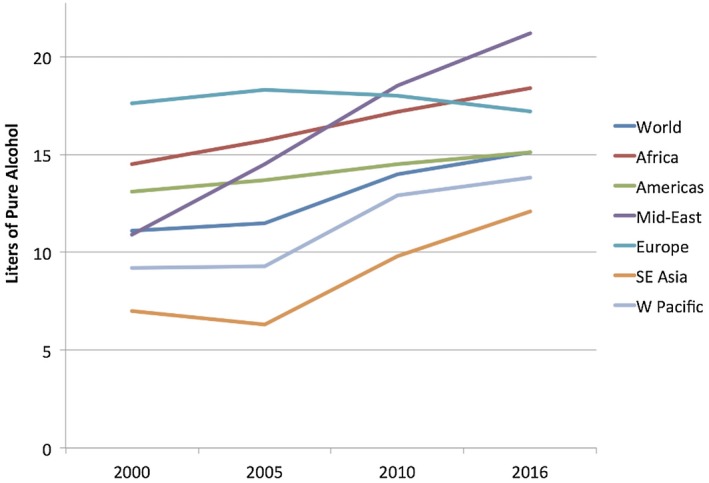
Trends in per capita consumption of alcohol (in liters of pure alcohol per year) among active drinkers. Data are from the World Health Organization.7 Copyright 2018, World Health Organization.
Drinking patterns varied, and binge drinking prevalence was reported to be highest in Europe overall with Eastern European countries, as well as France and England, reporting some of the highest rates of binge drinking. Encouragingly, however, prevalence of binge drinking declined in Europe from 2000 to 2016, decreasing 10% to 12% in both the total population and the population of active drinkers.7 With respect to gender, unsurprisingly, more men than women drink and drink more heavily. Worldwide, the proportion of current drinkers was 54% of men and 32% of women. The ratio of male to female was 3.8. Importantly, these prevalence estimates mask the fact that the absolute numbers of drinkers have increased given that the population has increased over time as well. The absolute numbers of currently drinking women have increased worldwide, despite the fact that, compared with men, women drink less often and lower amounts of alcohol overall.
Alcohol Use in the United States and Elsewhere
National estimates of alcohol use in the United States have recently shown alarming figures. Data from the National Epidemiologic Survey on Alcohol and Related Conditions, a large comprehensive survey conducted in the United States since 2001, recently showed that across all categories of alcohol use and all demographics, alcohol use has risen in the United States from 2001 to 2012.9 The prevalence of any alcohol use in 12 months rose from approximately 65% to just over 72%. This rise was more pronounced in women, rural citizens, and those with lower socioeconomic status. In addition, minorities showed stronger increases across all categories.9 High‐risk drinking, defined as drinking four to five drinks per day, increased by 30%, with more marked increases among women and minorities. Among the youngest age group (18‐29 years), the prevalence rate of high‐risk drinking was 19%. The most alarming findings, however, show that AUDs, the most severe form of alcohol misuse, increased by 50% across the 10‐year time frame, and this increase was more pronounced in women, rising 80% over the time frame.9 In addition, AUD rates for the youngest age group, aged 18 to 29 years, also increased sharply to nearly 25% by 2012. Similar trends for alcohol use in other countries have been shown. For example, in the United Kingdom, consumption of cider, wine, and spirits increased by 150% to 400% over a 30‐year time frame from 1980 to 2013. Alongside these increases was an increase in liver‐related mortality in England and Wales.10
An important feature of alcohol use epidemiology is the comorbid association with both other substance use disorders and other mood disorders. Comorbid alcohol use and substance use disorders have been well described, with large population‐level surveys in the United States showing an odds ratio of comorbid substance use disorders ranging from 2.2 to 6.4 over a lifetime.11 Tobacco use is an important comorbid disorder that commonly occurs alongside alcohol use and is known to be a factor in relapse to alcohol use.11, 12 Mood disorders, such as depression and anxiety, are also common comorbid mental illnesses in the AUD population.11 Maintaining awareness of the common comorbid substance use and mental health disorders that may impact patients with AUDs is critical for effective long‐term management and mandates a multidisciplinary approach to management of patients with ALD.
Health Consequences of Alcohol Use
Death and disability from alcohol use worldwide are high and have increased. In 2016, worldwide alcohol‐attributable mortality was 38.8 per 100,000 people and 1759 disability‐adjusted life‐years (DALYs) per 100,000 people.7 The highest percentage of overall deaths attributable to alcohol consumption was in Europe at 10.1%. Digestive diseases, including liver disease, made up a substantial portion of these trends, resulting in 8.3 deaths and 307 DALYs per 100,000 people.7
Importantly, for hepatologists, half of all cirrhosis‐related deaths worldwide were attributable to alcohol use, in whole or in part.7 Alcohol use does have a dose‐response effect on risk for liver cirrhosis. In a meta‐analysis, increasing alcohol consumption, measured in grams per day, was associated with an increased relative risk (RR) for cirrhosis in both men and women. However, at the same level of alcohol, women had an increased risk for cirrhosis. For example, at an alcohol consumption level of 48 g/day (approximately four standard drinks in the United States), the RR for cirrhosis for women was double that for men (RR 10.1 [95% confidence interval [CI]: 7.5‐13.5] for women, RR 5.6 [CI: 4.5‐7.0]).13 Although it has been suggested that low‐to‐moderate doses of alcohol may be beneficial to health, particularly cardiovascular health, these data have been called into question recently, with a large‐scale study showing that current thresholds for “safe” drinking may be too high.14 For those with comorbid liver disease, including nonalcoholic fatty liver disease or hepatitis C, alcohol use appears to accelerate liver damage and hepatic decompensation in those with existing cirrhosis.15, 16
Unsurprisingly, given these trends, alcoholic cirrhosis prevalence has been shown to be increasing. In a privately insured population, the alcoholic cirrhosis prevalence rate increased by 43% over the course of a 7‐year period, with the prevalence rate in women increasing by 50% compared with 30% in men.17 In addition, ALD mortality increased in patients aged 25 to 34 years, rising 15% over a 10‐year period.18 AUDs are common in comorbid liver disease, particularly hepatitis C, where the presence of an AUD increased the risk for decompensation by nearly 4‐fold.15, 19 Furthermore, comorbid AUD with hepatitis C results in an earlier age for decompensated cirrhosis. In a study comparing the population attributable fraction of decompensation in hepatitis C‐related cirrhosis, alcohol use was responsible for 13% to 40% of decompensating events in geographically diverse areas.15 These alarming trends suggest that the rising tide of AUDs in the United States may undo the benefits of direct‐acting antiviral therapy for hepatitis C in many patients.
In conclusion, global alcohol trends for some populations are decreasing, but for others, particularly women, they appear to be worsening, especially among active drinkers. In the United States, alcohol consumption trends are moving in an unfavorable direction, particularly among women, minorities, and those living in rural areas. These trends threaten to worsen the burden of ALD as well, a burden that is also rising in tandem with increases in alcohol use. Efforts to decrease problem alcohol use at the policy and patient level are urgently needed.
Potential conflict of interest: Nothing to report.
References
- 1. O’Shea RS, Dasarathy S, McCullough AJ. Practice Guideline Committee of the American Association for the Study of Liver Diseases; Practice Parameters Committee of the American College of Gastroenterology. Alcoholic liver disease. Hepatology 2010;51:307‐328. [DOI] [PubMed] [Google Scholar]
- 2. Mathurin P, Bataller R. Trends in the management and burden of alcoholic liver disease. J Hepatol 2015;62:S38‐S46. [DOI] [PMC free article] [PubMed] [Google Scholar]
- 3. Kranzler HR, Soyka M. Diagnosis and pharmacotherapy of alcohol use disorder: a review. JAMA 2018;320:815‐824. [DOI] [PMC free article] [PubMed] [Google Scholar]
- 4. International Alliance on Responsible Drinking . Drinking guidelines. Available at: http://www.iard.org/resources/drinking-guidelines-general-population/. Accessed February 5, 2019.
- 5. US Department of Health and Human Services; US Department of Agriculture . 2015–2020 Dietary Guidelines for Americans. 8th ed Available at: https://health.gov/dietaryguidelines/2015/guidelines/. Published December 2015.
- 6. American Psychiatric Association . Diagnostic and Statistical Manual of Mental Disorders (DSM‐5). Washington, DC: American Psychiatric Publishing; 2013. [Google Scholar]
- 7. World Health Organization . In: Poznyak V, Rekve D, eds. Global Status Report on Alcohol and Health 2018. Geneva: WHO; 2018. [Google Scholar]
- 8. Rehm J, Samokhvalov AV, Shield KD. Global burden of alcoholic liver diseases. J Hepatol 2013;59:160‐168. [DOI] [PubMed] [Google Scholar]
- 9. Grant BF, Chou SP, Saha TD, et al. Prevalence of 12‐month alcohol use, high‐risk drinking, and DSM‐IV alcohol use disorder in the United States, 2001–2002 to 2012–2013: results from the National Epidemiologic Survey on Alcohol and Related Conditions. JAMA Psychiatry 2017;74:911‐923. [DOI] [PMC free article] [PubMed] [Google Scholar]
- 10. Williams R, Aspinall R, Bellis M, et al. Addressing liver disease in the UK: a blueprint for attaining excellence in health care and reducing premature mortality from lifestyle issues of excess consumption of alcohol, obesity, and viral hepatitis. Lancet 2014;384:1953‐1997. [DOI] [PubMed] [Google Scholar]
- 11. Grant BF, Goldstein RB, Saha TD, et al. Epidemiology of DSM‐5 alcohol use disorder: results from the National Epidemiologic Survey on Alcohol and Related Conditions III. JAMA Psychiatry 2015;72:757‐766. [DOI] [PMC free article] [PubMed] [Google Scholar]
- 12. Weinberger AH, Platt J, Esan H, et al. Cigarette smoking is associated with increased risk of substance use disorder relapse: a nationally representative, prospective longitudinal investigation. J Clin Psychiatry 2017;78:e152‐e160. [DOI] [PMC free article] [PubMed] [Google Scholar]
- 13. Rehm J, Taylor B, Mohapatra S, et al. Alcohol as a risk factor for liver cirrhosis: a systematic review and meta‐analysis. Drug Alcohol Rev 2010;29:437‐445. [DOI] [PubMed] [Google Scholar]
- 14. Wood AM, Kaptoge S, Butterworth AS, et al. Risk thresholds for alcohol consumption: combined analysis of individual‐participant data for 599 912 current drinkers in 83 prospective studies. Lancet 2018;391:1513‐1523. [DOI] [PMC free article] [PubMed] [Google Scholar]
- 15. Alavi M, Janjua NZ, Chong M, et al. The contribution of alcohol use disorder to decompensated cirrhosis among people with hepatitis C: an international study. J Hepatol 2018;68:393‐401. [DOI] [PubMed] [Google Scholar]
- 16. Åberg F, Helenius‐Hietala J, Puukka P, et al. Interaction between alcohol consumption and metabolic syndrome in predicting severe liver disease in the general population. Hepatology 2018;67:2141‐2149. [DOI] [PubMed] [Google Scholar]
- 17. Mellinger JL, Shedden K, Winder GS, et al. The high burden of alcoholic cirrhosis in privately insured persons in the United States. Hepatology 2018;68:872‐882. [DOI] [PubMed] [Google Scholar]
- 18. Tapper EB, Parikh ND. Mortality due to cirrhosis and liver cancer in the United States, 1999–2016: observational study. BMJ 2018;362:k2817. [DOI] [PMC free article] [PubMed] [Google Scholar]
- 19. Beste LA, Leipertz SL, Green PK, et al. Trends in burden of cirrhosis and hepatocellular carcinoma by underlying liver disease in US veterans, 2001–2013. Gastroenterology 2015;149:1471‐1482. [DOI] [PubMed] [Google Scholar]