Abstract
Intestinal organoids are complex three-dimensional structures that mimic the cell type composition and tissue organization of the intestine by recapitulating the self-organizing ability of cell populations derived from a single intestinal stem cell. Crucial in this process is a first symmetry-breaking event, in which only a fraction of identical cells in a symmetrical sphere differentiate into Paneth cells, which generate the stem cell niche and lead to asymmetric structures such as crypts and villi. We here combine single-cell quantitative genomic and imaging approaches to characterize the development of intestinal organoids from single cells. We show that their development follows a regeneration process driven by transient Yap1 activation. Cell-to-cell variability in Yap1, emerging in symmetrical spheres, initiates a Notch/Dll1 activation driving the symmetry-breaking event and the formation of the first Paneth cell. Our findings reveal how single cells exposed to a uniform growth-promoting environment have the intrinsic ability to generate emergent, self-organized behavior resulting in the formation of complex multicellular asymmetric structures.
Genetically identical cells grown under the same conditions can display extensive variability in their potential to grow and differentiate1–3. This may be attributed to stochastic fluctuations in gene expression4, 5, or non-genetic variability emerging from collective cell-behavior 6–8. The latter is generated by single-cells that sense the ‘population-context’, resulting in microenvironmental effects that can feed-back on their physiological state and gene expression programs9. This enables single-cells to break the symmetry of a population by changing their differentiation potential10 with respect to other identical cells.
Organoids recapitulate the self-organizing potential of stem cells, creating three-dimensional structures in vitro. In particular, intestinal organoids recapitulate patterning processes and contain all cell types found in the adult intestine11, 12. A characteristic of these intestinal organoids is that they develop from a single Lgr5-positive (Lgr5+) stem cell11. Despite their extensive use, it is unclear how single intestinal stem cells give rise to cell populations with the capability of self-organization, and which transcriptional program cells use. First, the stem cell generates a symmetrical sphere-like structure. Next, a secretory-cell, named Paneth cell, emerges and is believed to determine the future crypt site. Paneth cells create the niche environment and secrete Wnt3a13. In vivo these cells are not the only source of Wnt14, 15. After this symmetry-breaking event, a gradient of Wnt3a is formed around the Paneth cell, which induces the formation of a crypt16. The seemingly spontaneous emergence of a Paneth cell within a sphere, that is formed by genetically identical cells, represents the first and most crucial symmetry breaking event in intestinal organoid formation, but how this occurs remains unknown.
Here we characterize the development of intestinal organoids using a combination of single-cell genomics and imaging approaches to show that generation of organoids is not limited to Lgr5+ cells, and organoid formation is a regenerative process that relies on transient Yap1 activation. Finally, we show that for effective organoid development, Yap1 needs to display transient cell-to-cell variability in localization, which in turn initiates a Notch/Dll1lateral inhibition event that drives Paneth cell differentiation and subsequent crypt formation.
Intestinal organoid development from single cells
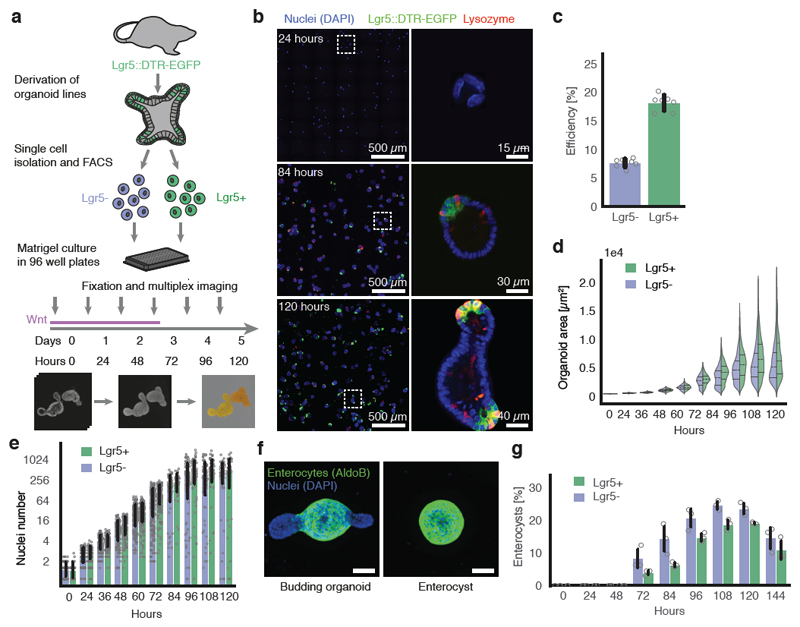
Many intestinal cell types can de-differentiate in vivo during injury, and both Lgr5+ and Lgr5- cells can generate organoids17–19. We characterized the growth of intestinal organoids from sorted single Lgr5+ and Lgr5- cells derived from Lgr5::DTR-EGFP mouse20 (Fig. 1a). Cells were seeded as multiple individual cells and cultured in ENR medium, and, only for the first three days, Wnt3a13. Organoids were fixed at different time points, stained with multiplexed immunofluorescence (4i)21, imaged at high resolution and segmented using cellular computer vision algorithms (Fig. 1a, b, Extended Data Figure 1a, b, c).
Figure 1. Intestinal organoids development from Lgr5+ and Lgr5- single cells.
a, Workflow of organoid development time-course from Lgr5+ and Lgr5- FACS sorted single cells (Lgr5::DTR-EGFP mice). b, Representative images of organoids (nuclei (DAPI)), stem cells (Lgr5::DTR-EGFP), Paneth cells (Lysozyme). Left column: maximum intensity projections (MIP). Right column: single plane zoom-in. c, Lgr5+ higher efficiency of organoid formation (n=7 for each condition, n=replicates, two-sided t-test, p-value 7.6*10-10). d, Organoid area (n=9798 Lgr5+, n=13623 Lgr5-, n=organoids), violin plot lines: quartiles for each group. e, Nuclei number (n=2829, n=organoids). f, Representative images of budding organoids and enterocysts. Scale bar = 50 μm. g, Relative amount of enterocysts over time (n=3 replicates for each condition, two-sided t-test at 120h, p-value 0.019). (c, e, g) Barplots: mean ± s.d.
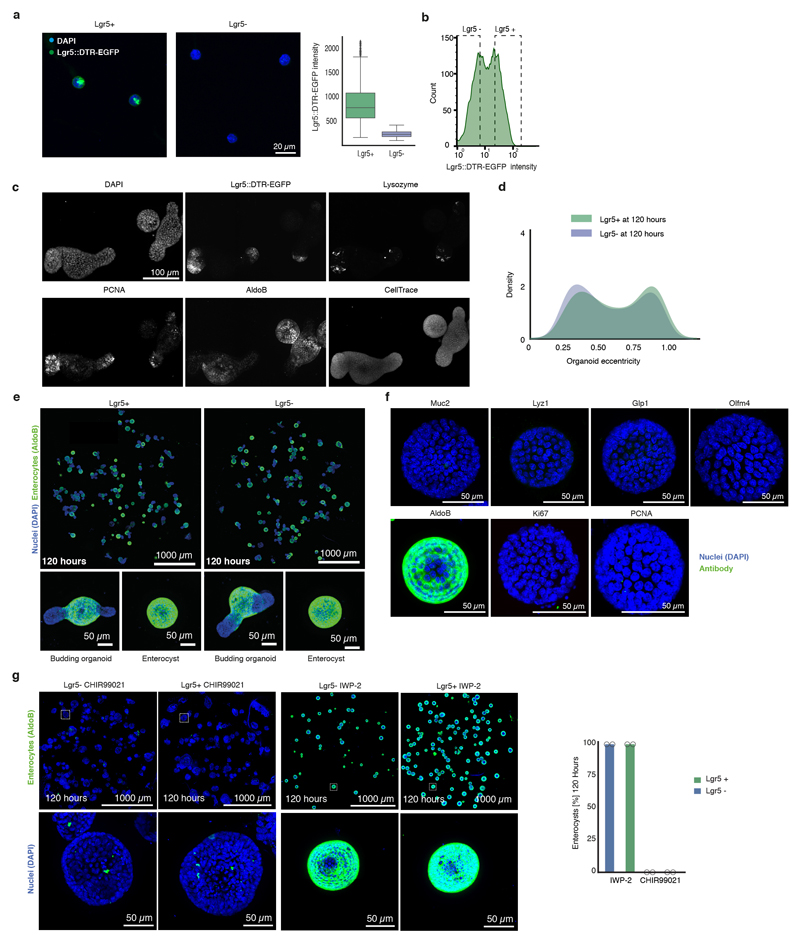
The efficiency of organoid formation was ~18%, for Lgr5+ and ~7.5% for Lgr5- (Fig. 1c). Both starting populations induce a similar, stereotyped pattern of organoid development: 24h - single-cells; 48h – small spheres with a lumen; 72h – larger spheres of which most contain one Paneth cells; 96h - asymmetric spheres with initial buds; and 120h - organoids with crypts (Fig. 1b). Organoids increase exponentially in size and cell number during the first 72h (~500 cells by 96h, Fig. 1d, e). Interestingly, organoid eccentricity, a feature that measure object roundness, displayed bimodal distributions at 120h (Extended Data Figure 1d), indicating that two morphologically distinct organoids developed (Fig. 1f). Markers of different intestinal cell types revealed the existence of spherical organoids consisting entirely of enterocytes, and devoid of other cell types (Extended Data Figure 1e, f). We refer to these organoids as enterocysts, as compared to budding organoids. Enterocysts appear after 60h and, at 120h, ~20% of multicellular structures are enterocyst, while ~80% are budding organoids (Fig. 1g). There is an increase in enterocyst from Lgr5- cells, suggesting that some progenitors have a higher probability to become enterocysts (Fig. 1g). In absence of Wnt, enterocysts die after 120h (Fig. 1g). We hypothesized that enterocysts develop due to an absence of symmetry breaking and no Paneth cell differentiation (and thus an absence of endogenously produced Wnt). To test this, we modulated the rate of Paneth cell differentiation, resulting in changes in enterocyst formation showing a strong correlation between absence of Paneth cells and enterocyst formation (Extended Data Figure 1g). Thus, the successful formation of budding organoids requires a symmetry-breaking event, resulting in the differentiation into a Paneth cell in the presence of exogenous Wnt.
Trajectory of Lgr5 dynamics and organoid development
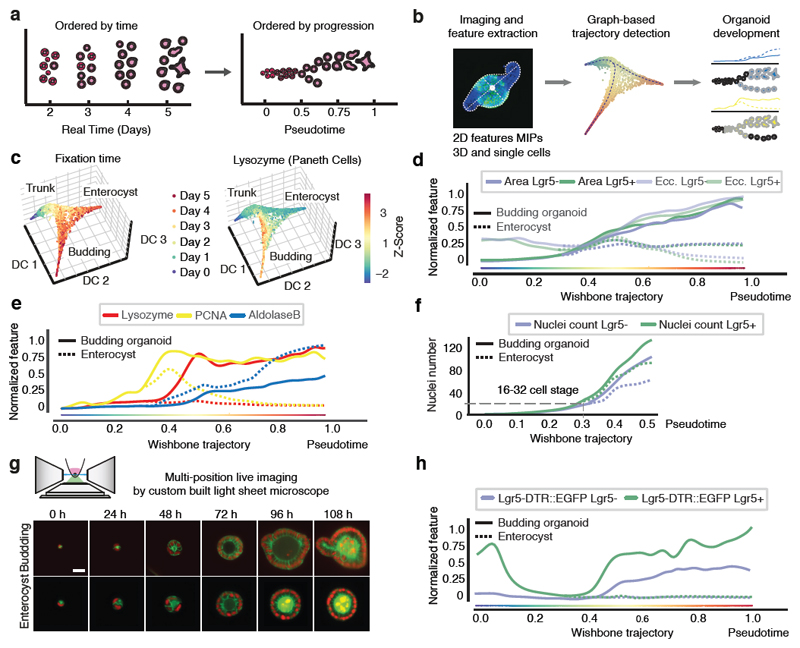
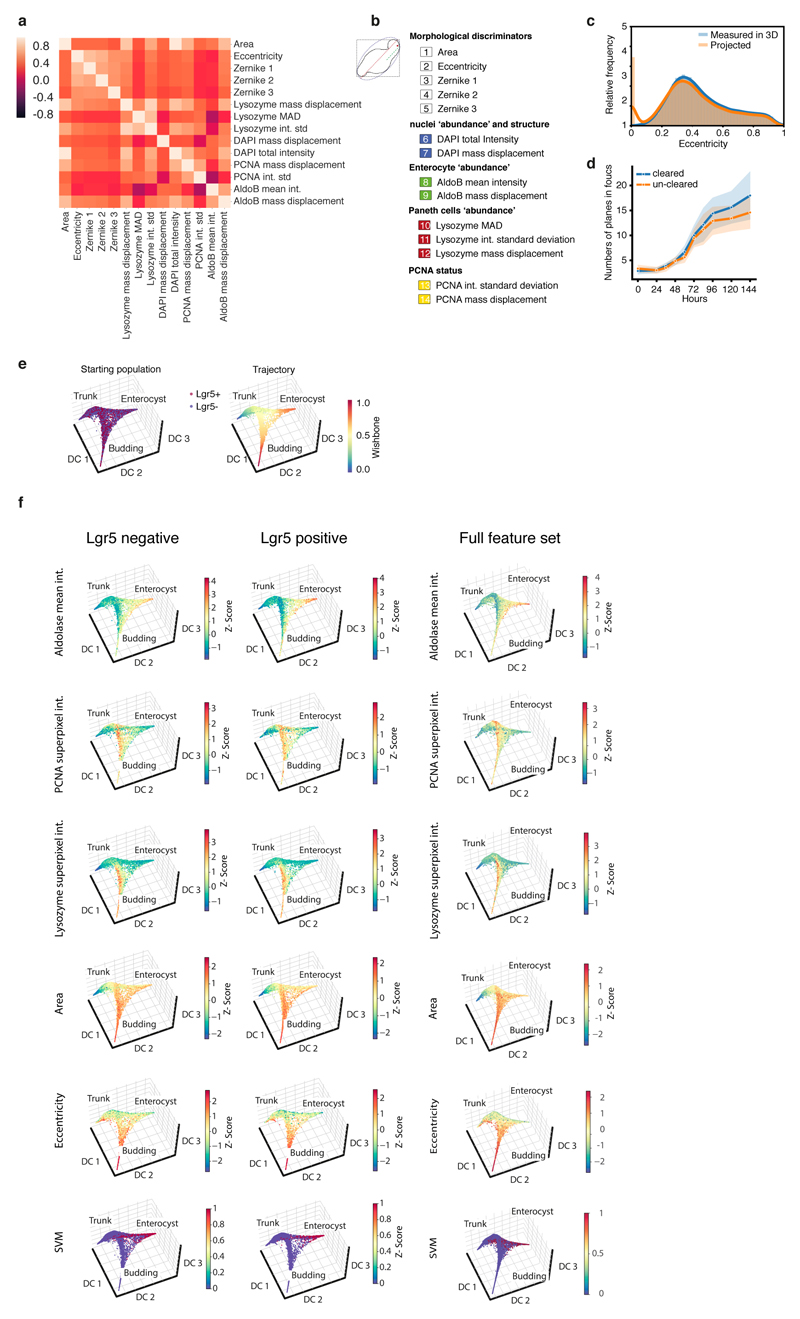
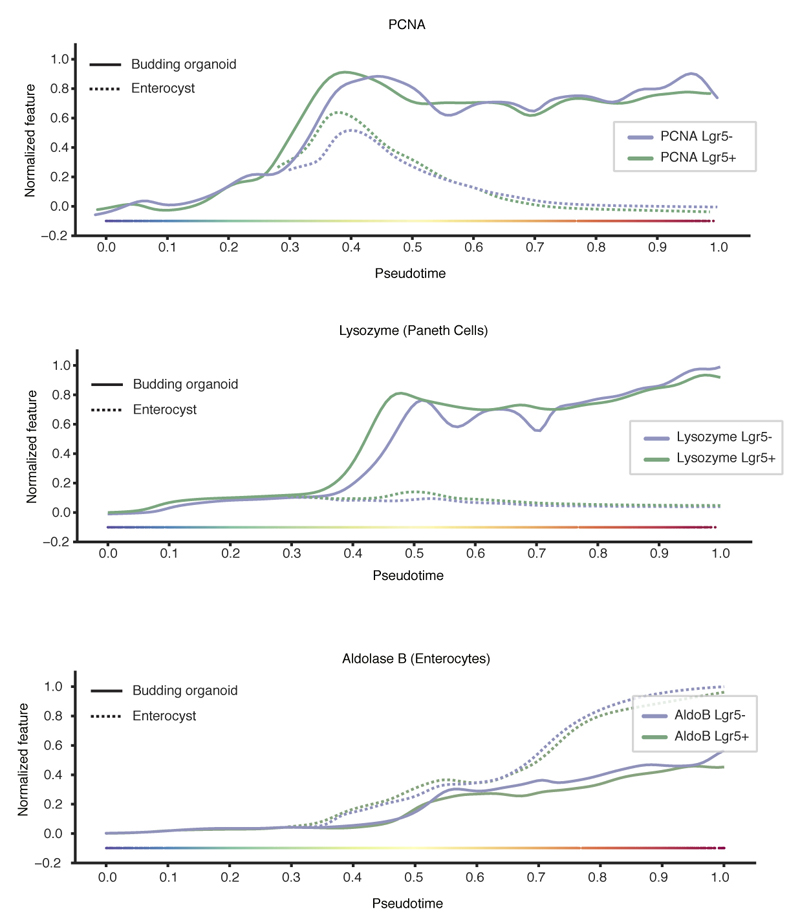
We next quantified the time progression of organoid development to pinpoint when symmetry breaks (Fig. 2a, b). The subsampling of temporal progression with fixed organoid time-courses prohibit the determination of exact morphological and phenotypic stages at which enterocysts emerge. We therefore inferred continuous single-organoid trajectories of development using the imaging multidimensional feature space (Extended Data Figure 2a-d) 22, 23. Interestingly, organoids grown from Lgr5+ and Lgr5- cells display identical patterns of growth (Fig. 2c, d, Extended Data Figure 2e, f). This revealed a single ‘pseudotime’ trajectory up to ~0.3, after which it bifurcates into budding organoid, and enterocyst branches (Fig. 2d, e). Both enterocysts and budding organoids are proliferative but only the budding organoids stay proliferative after Wnt removal (Fig. 2e). Paneth cells appear only in budding organoids after pseudotime 0.3 and the timing is very similar for both starting populations (Fig. 2e, Extended Data Figure 3). Strikingly, mapping cell-number per organoid revealed that the bifurcation occurs when organoids have around 16-32 cells (Fig. 2f).
Figure 2. Trajectory of organoid development.
a, b, Pseudotime ordering and trajectory inferences. c, Diffusion-maps for pooled Lgr5+ and Lgr5-organoids (n=23421), color-coding: fixation time and Lysozyme intensity (Paneth cells). d, Morphological features on pseudotime of Lgr5+ (n=9798) and Lgr5- (n=13623). e, Cell types and proliferation markers on pseudotime (n=23421). f, Nuclei number on pseudotime for Lgr5+ (n=4104), Lgr5- (n=5593). Dashed lines: cell state around the branch point. g, Custom built light-sheet and imaging of single cells forming budding organoids or enterocysts (H2B-mCherry, red; mem9-GFP, green). Single planes in the middle of organoids. Scale bar = 25 μm. h, Lgr5::DTR-EGFP reporter signal on pseudotime of Lgr5+ (n=9798), Lgr5- (n=13623).
To map real-time onto the trajectory we performed time-lapse imaging from single-cells using a custom-built light-sheet microscope suitable for organoids (Fig. 2g, Extended Data Figure 4a-f). This revealed similar growth and proliferation dynamics for both budding organoids and enterocysts until 48h (Fig. 2g, Extended Data Figure 4g, Video S1, S2, S3). A sphere is created at the 2-cell stage, with subsequent fast cell division rate of around 8h. After 72h, when exogenous Wnt is removed, budding organoids show localized cell proliferation, representing the site of crypt formation, while cells into enterocysts stop proliferating. Comparing organoids area over time with that of fixed organoids along the trajectory shows that pseudo-time is slightly compressed in the beginning and stretched toward the end (Extended Data Figure 4h). Mapping real-time onto pseudotime further revealed that the bifurcation at ~0.3 pseudotime corresponds to ~45h. Thus, a trajectory of organoid progression, inferred from thousands of fixed organoids obtained with a time-course experiment, provides an accurate representation of organoid development dynamic. Moreover, it allows us to directly compare experiments performed in a time course with live-cell imaging.
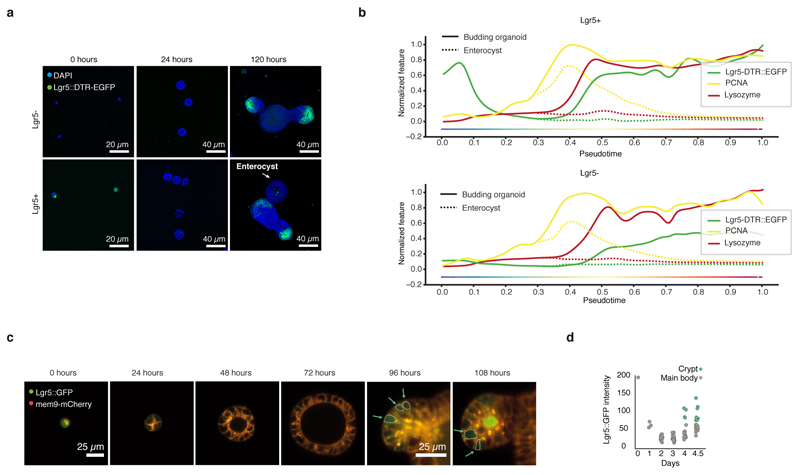
Following the expression of Lgr5 along the trajectory led to an unexpected discovery. Lgr5+ cells strongly downregulate Lgr5 expression during the first day and reacquire it only around 0.4 pseudotime (~62h) after the appearance of Paneth cells (Fig. 2h, Extended Data Figure 5a, b). This loss of Lgr5 expression also strongly correlates with the onset of fast proliferation and was confirmed with live-cell imaging of single Lgr5+ cell (Extended Data Figure 5c, d, Video S4). Lgr5 was also upregulated at ~62h in organoids from Lgr5- cells, although slightly delayed and dimmer (Fig. 2h). This shows that Lgr5+ and Lgr5- cells display similar patterns of organoid development through a transient proliferative sphere consisting of cells not expressing Lgr5, after which Lgr5 is expressed in stem cells in the newly formed crypts of budding organoids.
Transient Yap1 activation during organoid development
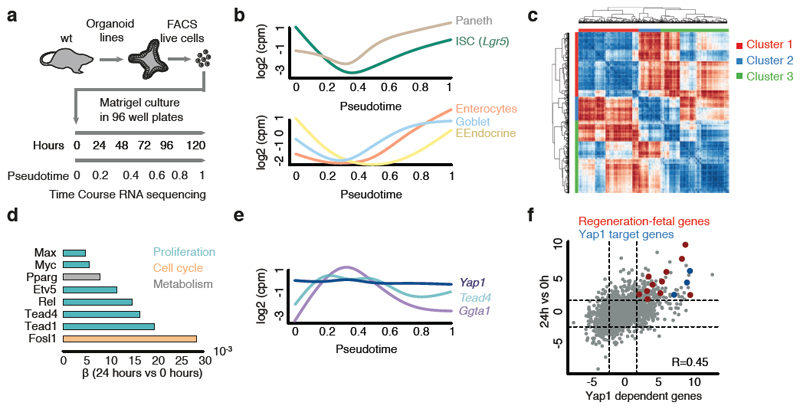
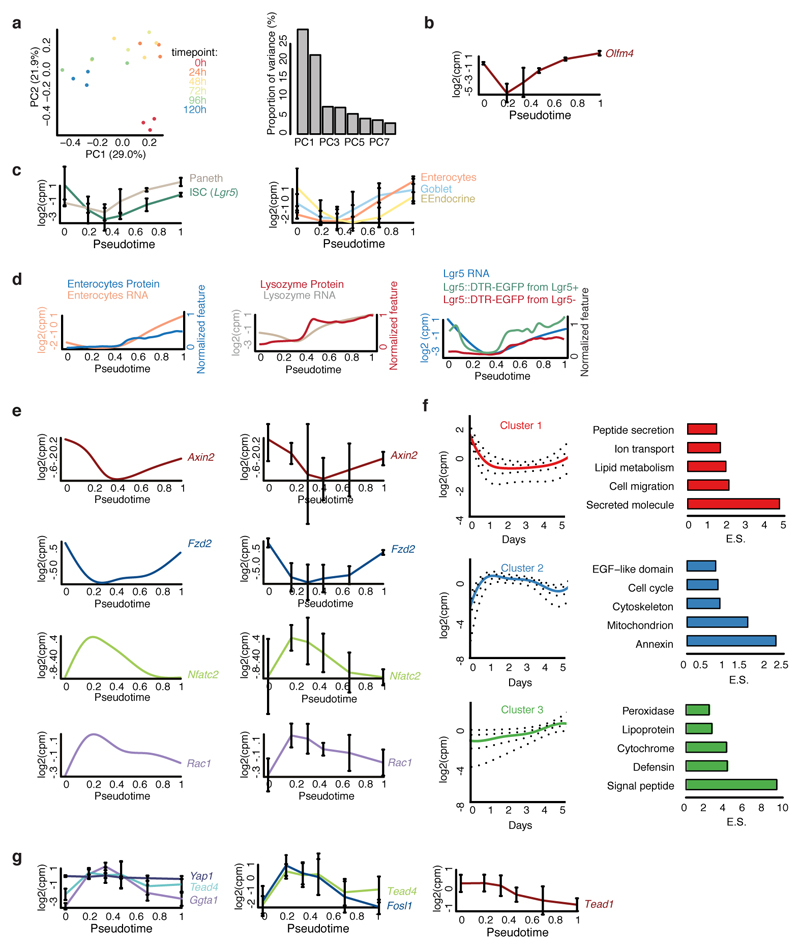
To determine the transcriptional programs modulated during the first days of organoid growth, RNA sequencing time course was performed and mapped onto pseudo-time (Fig. 3a, Extended Data Fig. 6a, Table S1). This shows that stem-cell markers are similarly downregulated at the transcriptional and protein level and, then, reacquired after Paneth cells differentiation (Fig. 3b, Extended Data Fig. 6b, c, d). Similar expression dynamics were also observed for all other cell-type specific genes (Fig. 3b, Extended Data Fig. 6b, c, d). Interestingly, canonical Wnt-targets are downregulated while non-canonical targets are upregulated in the first days (Extended Data Figure 6e). To gain an overview of transcriptional changes, we then clustered the temporal expression patterns (Fig. 3c). This revealed 3 major clusters: red cluster enriched in stem-cell markers, other cell-type specific genes, and genes involved in secretion and cell migration. There is a re-programming of cells into an undifferentiated state, which is followed by the re-establishment of Lgr5+ stem cells and acquisition of differentiation after Paneth cells formation (Extended Data Fig. 6f). Blue cluster enriched in functions linked to mitochondria, actin cytoskeleton, cell cycle and extracellular matrix. These genes are likely required to supply the energetic demand of undergoing rapid cell divisions. Finally, green cluster enriched in functions related to metabolism and cell-type-related functions (Extended Data Fig. 6f).
Figure 3. Yap1 target genes are transiently expressed during organoids development.
a, Workflow for bulk RNA-sequencing time-course. b, Expression profiles of cell-type markers mapped on pseudotime. Paneth cells (Lysozyme), ISCs (Lgr5), Enterocytes (Apolipoprotein), Goblet cells (Mucin 2), EEndocrine cells (Somatostatin). c, Hierarchical clustering of gene expression correlation profiles. d, Magnitude of contribution (β) of transcription factors to differential expression 24h vs 0h. e, Gene expression profiles of Yap1, Tead4 and Ggta1 mapped on pseudotime. f, Pearson correlation between genes expressed 24h vs 0h and genes expressed in Yap1 overexpression (OE) vs knockdown (KD). n=3 organoid cultures from 3 independent mice.
To focus on the earliest phase of development, we quantified transcription factor binding motifs in promoters of genes expressed at 24h (Fig. 3d). The most important motifs were for Fosl1, Tead1 and Tead4, which all require Yap1 as transcriptional co-activator24, 25. These transcription factors show an early increased expression, while Yap1 mRNA level stays constant (Fig. 3e, Extended Data Fig. 6g). Yap1 is a mechanosensing nuclear effector of the Hippo pathway regulating organ growth, regeneration, and tumorigenesis26, 27. It is also an important effector of intestine regeneration where it reprograms Lgr5-positive cells into Lgr5-negative cells inhibiting Paneth cell differentiation28, 29. When we correlated the expression levels of the early expressed genes (24h vs 0h) in organoid development with the expression levels of Yap1-dependent gene expression 28, we observed a good correlation (r=0.45) (Fig. 3f). These early genes include Yap1 target genes30 and fetal genes involved in regeneration31. Thus, this support a model where organoid development follows a regenerative response with a transient activation of Yap1 target genes in a Lgr5- sphere.
Yap1 activation followed by heterogeneous Yap1 inactivation is necessary for symmetry-breaking
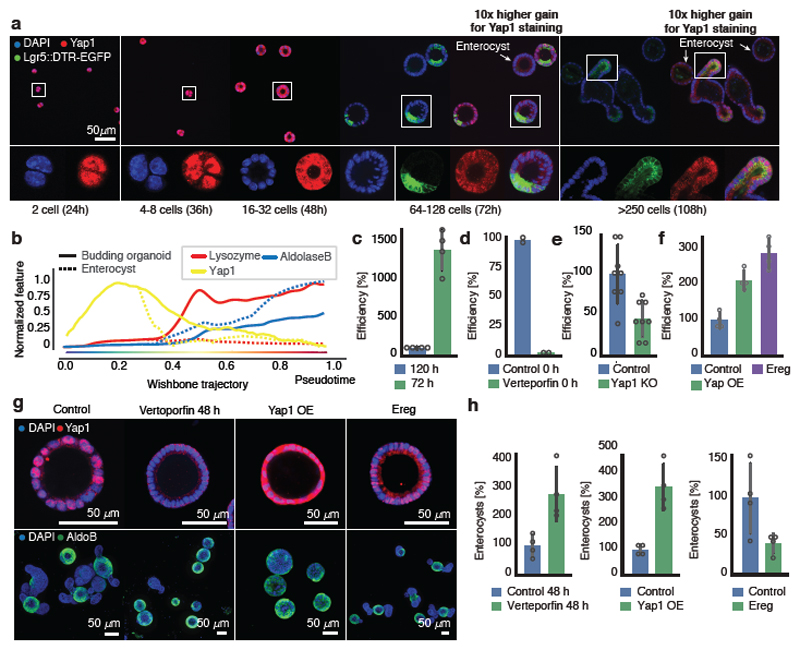
Yap1 targets are transiently upregulated while Yap1 mRNA is unchanged (Fig. 3e), suggesting post-transcriptional regulation. We therefore analyzed Yap1 protein during organoid development. Yap1 protein abundance in organoids shows an initial increase until 48h (Fig. 4a, b), while its subcellular localization starts to become variable between single-cells after 24h, increasing entropy in its ON and OFF state (Extended Data Fig. 7a,b). More precisely, in the 4-cell stage little cell-to-cell variability in the nuclear localization of Yap1 is observed, while in the 8-cell and 16-cell stages, when cells are more crowded, Yap1 is translocated to the cytosol, and thus inactivated, in a subset of cells (Fig. 4a). After Wnt removal, Yap1 protein levels strongly decreased (Fig. 4b), with Yap1 regionalizing only in the crypt area. Yap1 is absent in enterocysts. Removing Wnt earlier promotes Yap1 relocalization to the cytosol and decreased expression (Extended Data Fig. 7c).
Figure 4. Transient Yap1 activation is necessary for symmetry breaking.
a, Yap1 localization (Lgr5::DTR-EGFP). b, Yap1 protein abundance along pseudotime (n=6892, n=organoids). c, Efficiency of organoids formation from cells isolated at 72h and at 120h (normalization: 120h). Fixed: 72h (n=4, n=replicates, two-sided t-test, p-value 0.00007). d, Efficiency of organoid formation in Verteporfin (normalization: control). Fixed: 48h (n=2, n=replicates). e, Efficiency of organoid formation from Yap1 KO (normalization: control). Fixed: 72h (n=8, n=replicates, two-sided t-test, p-value 0.002). f, Efficiency of organoid formation from Yap1 overexpression and Ereg activation (normalization: control). (n=4, n=replicates, two-sided t-test, p-value: Yap1OE-0.001, Ereg-0.0002). g, Images of organoids treated with Verteporfin (at 48h), Yap1-overexpression and Ereg. Top panel: fixed at 72h. Bottom panel: fixed at 96h (Yap1-overexpression) or 120h (Control, Verteporfin, Ereg). h, Quantification of enterocysts as retrieved in g. (normalization: control). (n=4, n=replicates, two-sided t-test, p-value Verteporfin-0.01, Yap1 OE-0.002, Ereg-0.05). (c, d, e, f, h) Barplots: mean ± s.d.
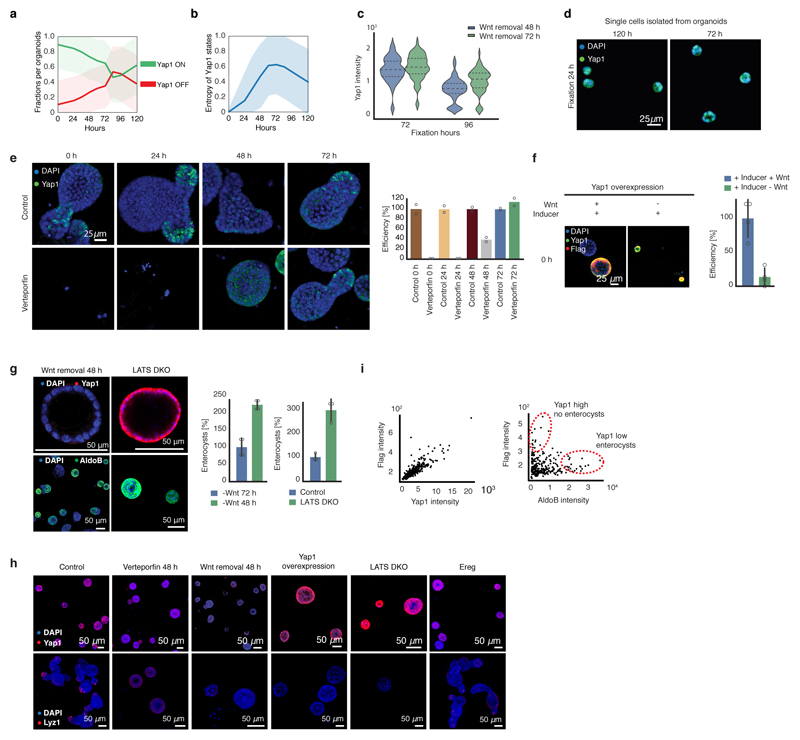
When we generated organoids from single cells that on average have more Yap1 activity (all single cells extracted from 72h-old organoids), we observed a strong increase in efficiency in organoid formation (Fig. 4c, Extended Data Fig. 7d). Inhibition of Yap1 and Yap1 knock-out result in reduced organoid efficiency (Fig. 4d, e, Extended Data Fig. 7e). Conversely, ectopic activation of Yap1 using Yap1 overexpression, or activation of its downstream effector Ereg28, increases organoid formation efficiency (Fig. 4f). This phenotype requires the presence of exogenous Wnt (Extended Data Fig. 7f).
Interestingly, Yap1 homogeneous inhibitions after 48 hours in all cells reduces Paneth cell differentiation, and increases the number of enterocysts. Surprisingly, this phenotype is similar to Yap1-overexpression organoids, where Yap1 is homogeneously active in all cells, and form neither Paneth cells nor display symmetry breaking (Fig. 4g, h, Extended Data Fig. 7g, h). Instead, they either develop into enterocysts or remain as undifferentiated symmetrical spheres when Yap1 expression is high (Extended Data Figure Fig. 7i). Also inducible Lats1/2 knock-out organoids28, remain symmetrical and contain no Paneth cells. (Extended Data Fig. 7g, h). We then activated Yap1 in a heterogeneous manner with Ereg, which decreased enterocyst formation (Fig. 4g). From these findings, we conclude that during the first 72h of organoid development, Yap1 is transiently active in every cell and induces cell proliferation, after which it becomes inactive in only few cells. Both, homogeneous inactivation and overactivation of Yap1 in spheres abolish symmetry breaking and organoid formation suggesting that it is not the absolute levels of Yap1, but its varying state between single cells that drives symmetry breaking.
A Yap1/Notch switch drives symmetry breaking
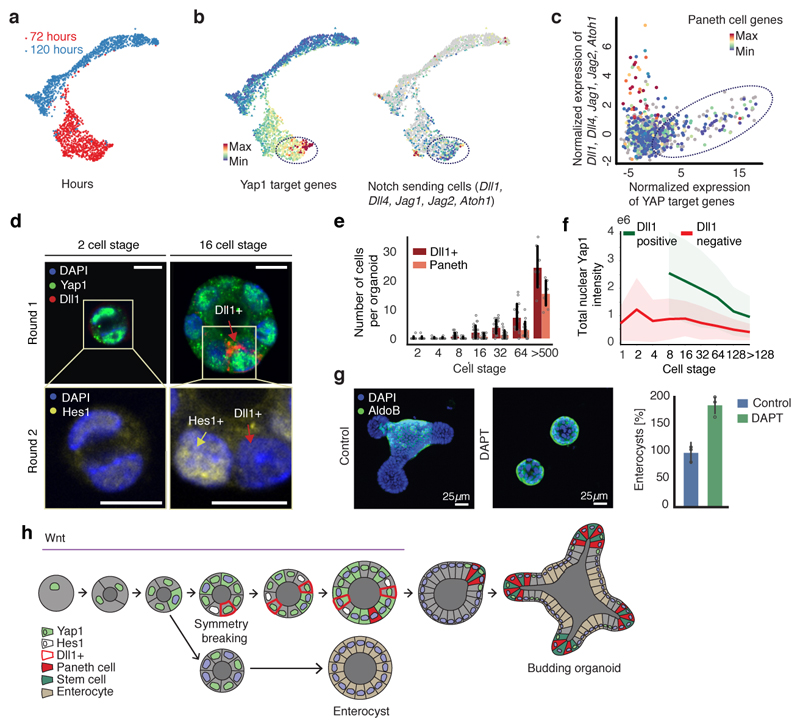
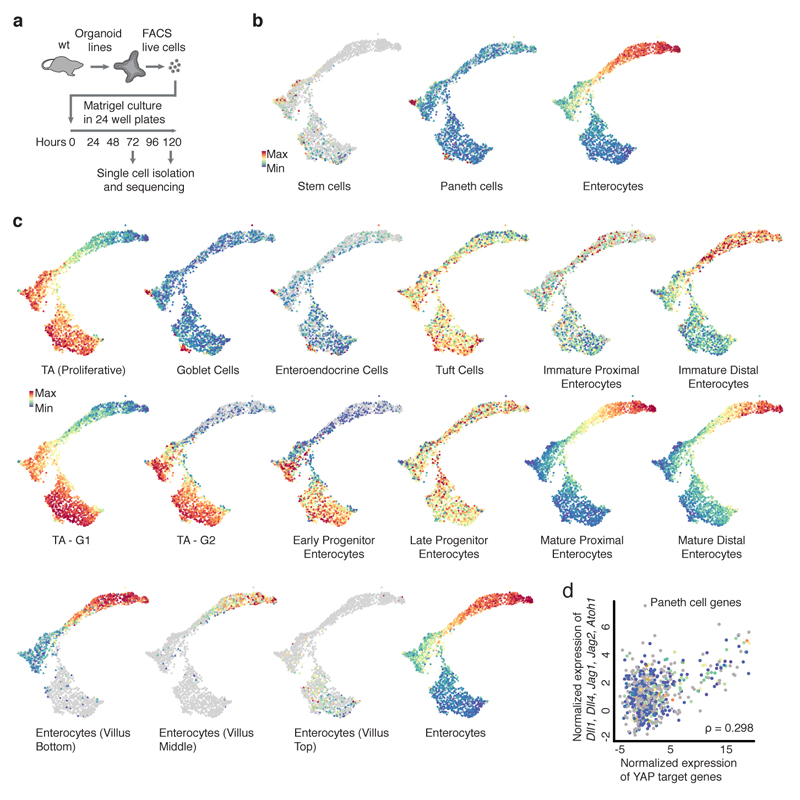
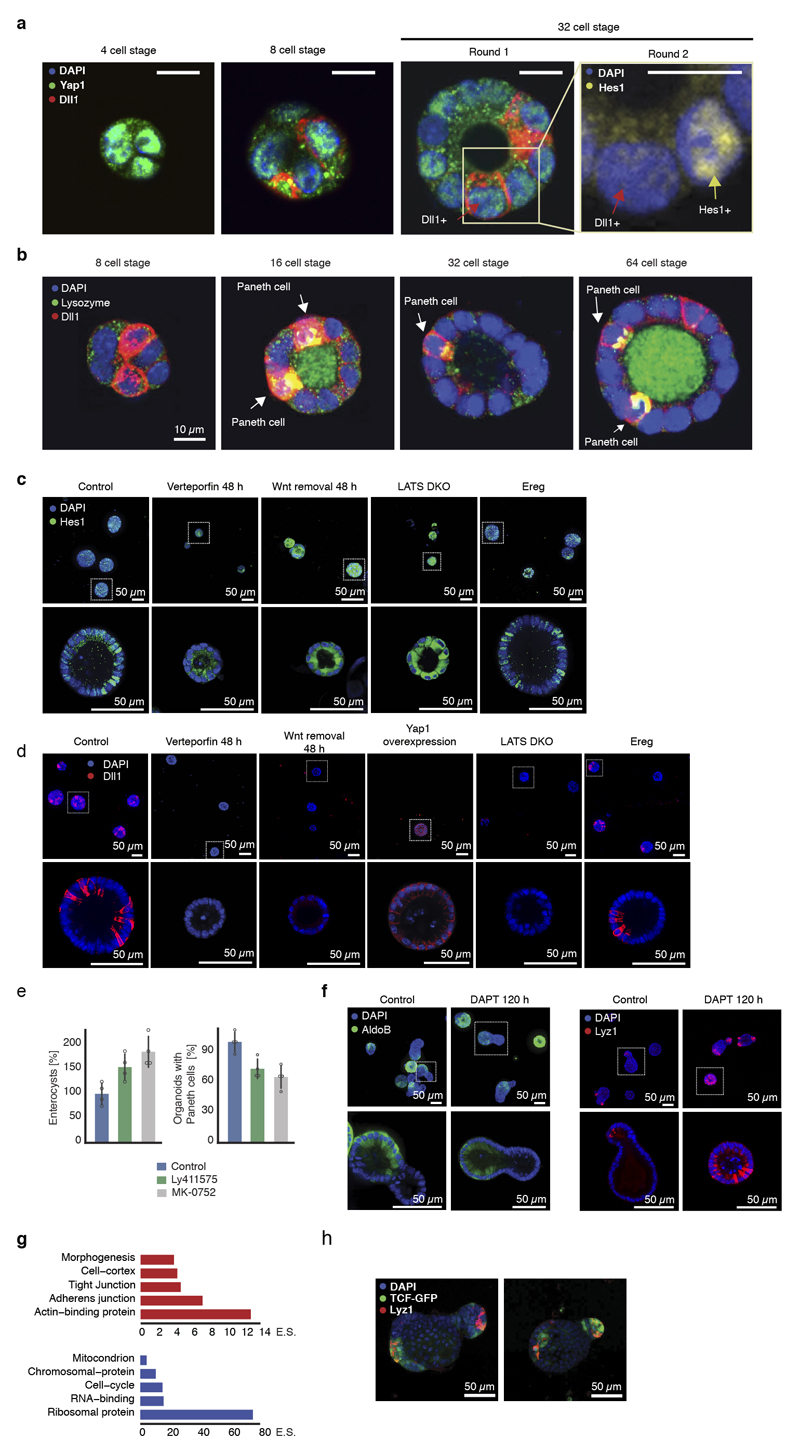
To understand how Yap1 variability drives symmetry breaking, we performed single-cell RNA sequencing at different time points (Fig. 5a, Extended Data Figure 8a, b, 9a). At 72h, the population of cells is homogeneous, with only a few stem and Paneth cell, and no enterocytes (Extended Data Fig. 9b). At 120h, most cell-types are represented (Extended Data Fig. 9b, c)32, 33. A subset of cells from organoids at 72h shows a high expression of Yap1 target genes (Fig. 5b, Table S1), whose levels correlate with the expression level of Notch ligands, such as Dll1 (Fig. 5b, c, Extended Data Fig. 9d). This suggests that the variability in Yap1 activation might generate variability in Notch ligand expression. Interestingly, the Notch signaling is a regulator of the intestinal stem cell niche, specifying distinct cell fates34, 35. In vivo and in mature organoids, it is known that Notch inhibition increases the differentiation of secretory cells36. Yap1 nuclear localization is variable between cells after the 4-cell stage and precedes the expression of Dll1 in few cells between the 8-cell and 16-cell stages. Dll1 expression occurs in cells with high level of nuclear Yap1 (Fig. 5d, e, f, Extended Data Fig. 10a). This is consistent with findings in other tissues that Dll1 is a Yap1 target gene28, 37. Moreover, Hes1 is expressed in single cells that neighbor Dll1-positive cells (Fig. 5d, Extended Data Fig. 10a). Between the 16-cell and the 32-cell stages, Paneth cells appear, which are all positive for Dll1 and start losing nuclear Yap1 (Fig. 5e, f, Extended Data Fig. 10a, b), as also seen in the loss of Yap1 target-genes expression in Paneth cells from scRNA-seq (Fig. 5c). This indicates that variability in nuclear Yap1 is involved in the initiation of a Notch/Dll1event, which, once established, maintain itself in the absence of Yap138, 39. We then homogeneously inactivated or activated Yap1, and in both conditions, no Notch/Dll1 event is observed (Extended Data Fig. 10c, d). In contrary, when we used Ereg, Notch/Dll1 is activated (Extended Data Fig. 10c, d). Finally, to determine if a Notch/Dll1 activation is required for symmetry breaking, we used gamma-secretase inhibitors. All these inhibitors reduce symmetry breaking and Paneth cell differentiation, resulting in an increased fraction of enterocysts (Fig. 5g, Extended Data Fig. 10e), strengthening the correlation between absence of Paneth cell and enterocyst formation. Adding DAPT after 120h shows the expected increase in secretory cells, (Extended Data Fig. 10f). Thus, while Notch lateral inhibition is required for enterocyte differentiation in large organoids, it needs to be activated in small symmetrical spheres to drive symmetry breaking and the formation of the first secretory Dll1+ cell, the Paneth cell. Taken together, this shows that variability in nuclear Yap1 initiates a Notch/Dll1 event. Cells with a high level of nuclear Yap1 become Dll1+ cells and subsequently Paneth cells. Once having become a Paneth cell, the upstream regulation of Yap1 on Dll1 is then lost.
Figure 5. Yap1 cell-to-cell variability allow Notch/Dll1 activation and symmetry breaking.
a, Griph-based visualization (72h and 120h) of single cells. b, Single-cell expression of Yap1 targets and Notch ligand. Dotted square: high Yap1 targets expressing cells. c, Spearman correlation between Yap1 target genes and Notch ligand expression at 72h (n=798, n=cells). d, Multiplexed imaging Yap1 variability and Dll1+ cells. Upper panel: nuclei, Yap1 (green), Dll1(red). Lower panel: nuclei and Hes1 (yellow). Arrows: Red (Dll1+ cells), yellow (Hes1+). Scale bar=10 μm. e, Number of Dll1+ and Paneth cells (n=170, n=organoids). f, Nuclear Yap1 intensity in Dll1+ (green) and Dll1- (red) cells (n=73899, n=cells). Shadows: s.d. g, Left panel: images of organoid treated with DAPT. Fixed 96h. Right panel: quantification of fraction of enterocysts (normalization: control). Fixed 96h (n=3, n=replicates, two-sided t-test, p-value 0.003). h Model of organoid development and symmetry breaking. (e, g) Barplots: mean ± s.d.
Discussion
Here we characterize the development of intestinal organoids from single cells and show that it exploits the plasticity of the intestine and is driven by transient Yap1 activation, following a regeneration process. We then show that cell-to-cell variability in nuclear Yap1, emerging in symmetrical spheres, initiates a Notch/Dll1 lateral inhibition event between the 8 cell- and 16 cell- stage, which constitutes the first symmetry-breaking event in intestinal organoid growth and drives the formation of the first Paneth cell (Fig. 5h). It is yet not clear what drives the variability in Yap1 subcellular localization but it may be determined by a combinatorial effect of local variation in cell crowding caused by asynchronous cell divisions40 and extracellular matrix density41 (Extended Data Fig. 10g). Subsequently, variability in Yap1 results in variability in Dll1 activation. While fluctuations in Dll1 ligand can be amplified by negative feedback42, we here show that it does not arise from intrinsic stochasticity, but can be determined by cell-to-cell variability in the mechano-sensor Yap1. Thus, Notch signaling has a dual role in organoid development, first in symmetry breaking and then, after homeostasis has been reached, in maintaining enterocyte differentiation36.
Taken together, our findings underscore the notion that Yap1 acts as a sensor of tissue integrity. Upon tissue dissociation, Yap1 is activated to drive tissue repair but once it is repaired, local cell crowding increases and induces heterogeneous activation of Yap1 in organoids and possibly also in vivo, driving the heterogeneous expression of Dll1 and formation of Paneth cells. Interestingly, cells that neighbor these Paneth cells show an increase in canonical Wnt signaling response (TCF-GFP expression) (Extended Data Fig. 10h). Thus, Paneth cells might switch a general non-canonical/Yap1 dependent response in transient-amplifying (TA)-like cells to a locally-induced canonical Wnt response in their neighboring cells with the re-expression of Lgr5 and the recreation of a stem cell niche, bringing the system back to homeostasis. Indeed, Yap1 could be a general sensor for tissue injury and repair in many other tissues43–45, by having a broad regulatory role at enhancers and distal regions of progenitor-specific genes45, 46. This could shed new light onto the development of cancer47, which may often reflect an inability to reacquire homeostasis upon tissue damage28. Finally, this work reveals how single cells have the intrinsic ability to generate emergent, self-organized behaviors resulting in multicellular asymmetric structures.
Extended Data
Extended Data Figure 1. Intestinal organoids development from Lgr5+ and Lgr5-.
a, Lgr5+ and Lgr5- single cells sorted from Lgr5::DTR-EGFP reporter mouse 3h after FACS (left panel) with boxplot showing Lgr5::DTR-EGFP intensity quantification (right panel, n=602 for Lgr5+ and n=576 for Lgr5-, n=organoids). Boxplot elements show quartiles. Boxplot whiskers show 1.5 x the interquartile range. b, FACS histogram of GFP signal of Lgr5::DTR-EGFP single cells. Dashed boxes depict gating. c, Representative images of 4i imaging showing the same organoids stained with DAPI, GFP, Lysozyme, PCNA, AldolaseB and Cell Trace. d, Distribution of eccentricity at 120h of development for Lgr5+ and Lgr5- starting populations (Lgr5+ n=463, Lgr5- n=711, n=organoids). e, Representative images of Lgr5+ and Lgr5- cells at 120h of development. Enlargements (bottom panel): Budding organoids and enterocysts. f, Representative images of enterocysts stained with DAPI, different cell type and proliferation markers. g, Left panel: representative images of organoids grown from Lgr5+ and Lgr5- single cells in presence of Wnt signaling inhibition (IWP-2 2 μM) or activation (CHIR99021 5 μM). Organoids are fixed at 120h and stained for nuclear marker (DAPI) and enterocyte marker (AldoB). Top-row shows complete wells overview, while bottom-row shows zoom-in examples of single organoid. Right panel: quantification of enterocysts at 120h of organoid development after Wnt signaling inhibition (IWP-2 2 μM) or activation (CHIR99021 2 μM) (n=2 replicates). Barplots show mean values.
Extended Data Figure 2. Feature selection for organoid development.
a, Pearson correlation cluster gram between the 14 selected features used for trajectory inference (n=23421 organoids). b, 14 selected features are grouped based on the underlying information c, Comparison between eccentricities calculated on projected images and on 3D volumes (n=16175 organoids). d, Number of in-focus planes at different time points in cleared and un-cleared organoids (n=2310, n=organoids). Planes are classified as in-focus with a logistic regression using the ratio of maximum in-plane intensity to maximum intensity in the whole stack as feature. shades: s.d. e, Diffusion-maps for pooled Lgr5+ and Lgr5-organoids (14 selected features, n=23421 organoids) color-coded: starting population and pseudotime. f, Diffusion maps for Lgr5- (first column, 14 selected features, n=13623), Lgr5+ (second column, 14 selected features, n=9798) and for the pooled dataset with the full feature set (third column, 66 features, n=23421) color coding: enterocytes (AldoB), PCNA, Paneth cells (Lysozyme), organoid area, eccentricity and SVM for enterocysts.
Extended Data Figure 3. Cell types and proliferation markers along organoid development trajectories.
Proliferation (PCNA) and cell type marker (Lysozyme and AldolaseB) trends on pseudotime for Lgr5+ (n=9798) and Lgr5- (n=13623).
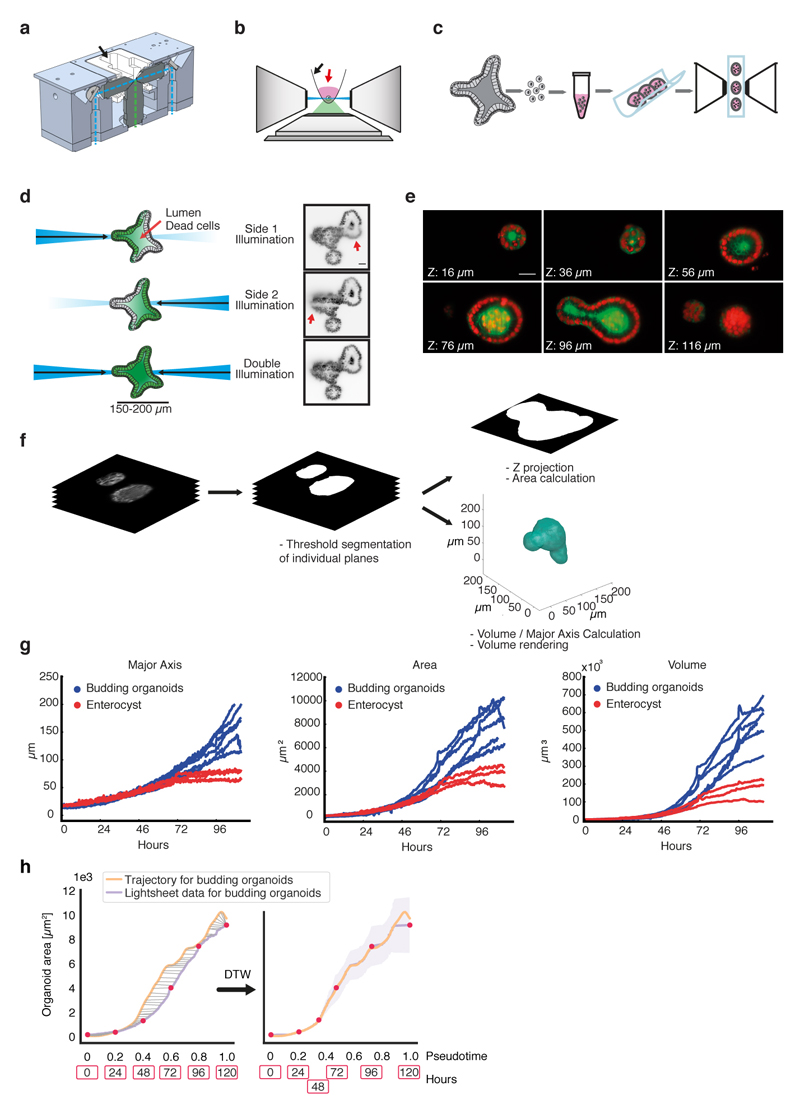
Extended Data Figure 4. Dual illumination inverted light sheet for organoids imaging.
a, Cross-sectional view of objective mounting block showing illumination paths (light blue dashed line) and imaging path (green dashed line). Illumination and imaging objective are solid mounted in the aluminum block and immersed in water contained in the reservoir (black arrow). b, Side view of microscope objectives arrangement: the sample embedded in Matrigel (red arrow) is held on the FEP membrane (black arrow) mounted in a sample holder and positioned between the two illumination objectives. c, Organoids handling procedure: Grown organoids are dissociated and single cells are embedded in Matrigel. Multiple Matrigel drops can be transferred into the imaging chamber allowing imaging parallelization. d, Illustration of image improvement by double illumination. Scattering of single illumination beam by the organoid prevents complete and homogenous illumination (red arrows). This problem is minimized by double illumination. Scale bar: 25μm. e, Representative images of an organoid expressing H2b-mCherry (red) and membrane bound GFP (green). Slices every 20 μm across the organoid volume are shown. Scale bar: 25μm. f, Workflow of light sheet data analysis. g, Morphological features (major axis, area and volume) derived from light sheet imaging. Budding organoids n=6, enterocysts n=3. h, Dynamic time warp mapping of light sheet data onto the trajectory. Budding organoid branch for mean area progression inferred from the trajectory (orange line, n=23421) and mean area progression extracted from time-lapse light sheet imaging (violet line, n=6) before morphing (left panel) and after morphing (right panel). Red dots indicate positions of real time (h) relative to pseudotime. Shades: s.d.
Extended Data Figure 5. Lgr5 dynamics during organoid development.
a, Representative images of organoids grown from Lgr5+ and Lgr5- starting populations at 0, 24 and 120h of development. b, Cell types and proliferation markers plotted on pseudotime for Lgr5+ (top panel, n=9798) and Lgr5- (bottom panel, n=13623) starting populations. c, Light-sheet time-lapse imaging of organoid formation starting from a single Lgr5+ cell (GFP signal) expressing membrane bound mCherry (mem9-mCherry). Green arrows are pointing to cells re-acquiring GFP signal from Lgr5 reporter in the organoid crypts. d, Quantification of GFP signal of Lgr5 reporter from time lapse shown in panel c. Cells localized in the organoid crypt are plotted in green, cells localized outside the crypt and on the main body are plotted in grey (n=91 cells).
Extended Data Figure 6. Bulk RNA sequencing analysis.
a, PCA analysis of time-course (0h - 120h) bulk RNA-sequencing shows no mouse or batch effect (n=3 biological replicates). b, Unsmoothed gene expression profile mapped on pseudotime trajectory of stem cell marker Olfm4. c, Unsmoothed gene expression profiles mapped on pseudotime trajectory of cell-type specific genes. Paneth cell = Lyz1, ISC = Lgr5, Enterocyte = Apoc3, Goblet cell = Muc2, Enteroendocrine cell = Sst. d, Left panel: protein abundance of Enterocyte marker AldoB and gene expression profile of Enterocyte marker Apoc3 mapped on pseudotime trajectory. Middle panel: protein abundance and gene expression profile of Paneth cell marker Lyz1 mapped on pseudotime trajectory. Right panel: protein abundance and gene expression profile of ISC marker Lgr5 mapped on pseudotime trajectory. e, Smoothed and unsmoothed gene expression profile of canonical Wnt target gene Axin2, Fzd2 and non-canonical target genes Nfatc2 and Rac1. f, Mean expression profile for each cluster and relative quantiles (0.05, 0.25, 0.50, 0.75, 0.95). Annotation enrichments are shown on the right. Enrichment Score (E.S.). g, Unsmoothed gene expression profile of Yap1, Tead4, Ggta1 and top 3 transcription factors (Tead1, Tead4 and Fosl1) contributing to differential gene expression between 24h – 0h. (b, c, e, g) Mean values are shown with error bars corresponding to standard deviation (n=3 biological replicates).
Extended Data Figure 7. Yap1 is necessary but not sufficient for organoid formation.
a, Fraction of cells per organoid having Yap1 in ON state (green, nuclear localization) or in OFF state (red, cytoplasm localization) over time (n=1074 organoids). b, Entropy of Yap1 states (i.e. variability in Yap1 activation ON and OFF state) over time (n =1074 organoids). (a, b) Shades show s.d. c, Quantification of Yap1 mean intensity after Wnt removal at 48h or 72h in organoids fixed at 72h or 96h (n=4 replicates). Violin plot lines show quartiles. d, Images of organoids derived from single cells isolated from organoids at 72h or at 120h. e, Organoids treated at different time points with control or with Verteporfin. Fixation at 96h. Left: representative images, right: efficiency quantification (normalization: control, n=2 replicates). Barplots: mean. f, Yap1 overexpressing organoids with or without Wnt. Fixation at 96h. Left: representative images, right: efficiency quantification (normalization: control, n=4 replicates, two-sided t-test, p-value 0.001). g, Left: images of organoids with Wnt removal at 48h or LATS DKO. Top-row: fixation at 72h. Bottom-row: fixation at 96h (Wnt removal 48h) or 120h (LATS DKO). Right: quantification of enterocysts as retrieved in the left panel. (n=4 replicates for Wnt removal 48h and two-sided t-test, p-value 0.0001, n=3 replicates for LATS DKO and two-sided t-test p-value 0.002). h, Representative images of control, Verteporfin treatment at 48h, Wnt removal at 48h, Yap1 overexpression, LATS DKO or treatment with Ereg. Top-row: Fixation at 72h. Bottom-row: Fixation at 96h (Wnt removal 48h, Yap1 overexpression, LATS DKO) or 120h (control, Verteporfin 48h, Ereg). i, Scatterplot of Flag mean intensity signal and Yap1 mean intensity signal (left) and of Flag mean intensity and AldoB mean intensity (right) in Yap1 overexpressing organoids at 96h. (f, g) Barplots: mean ± s.d.
Extended Data Figure 8. Griph robustness analysis and comparison to other methods.
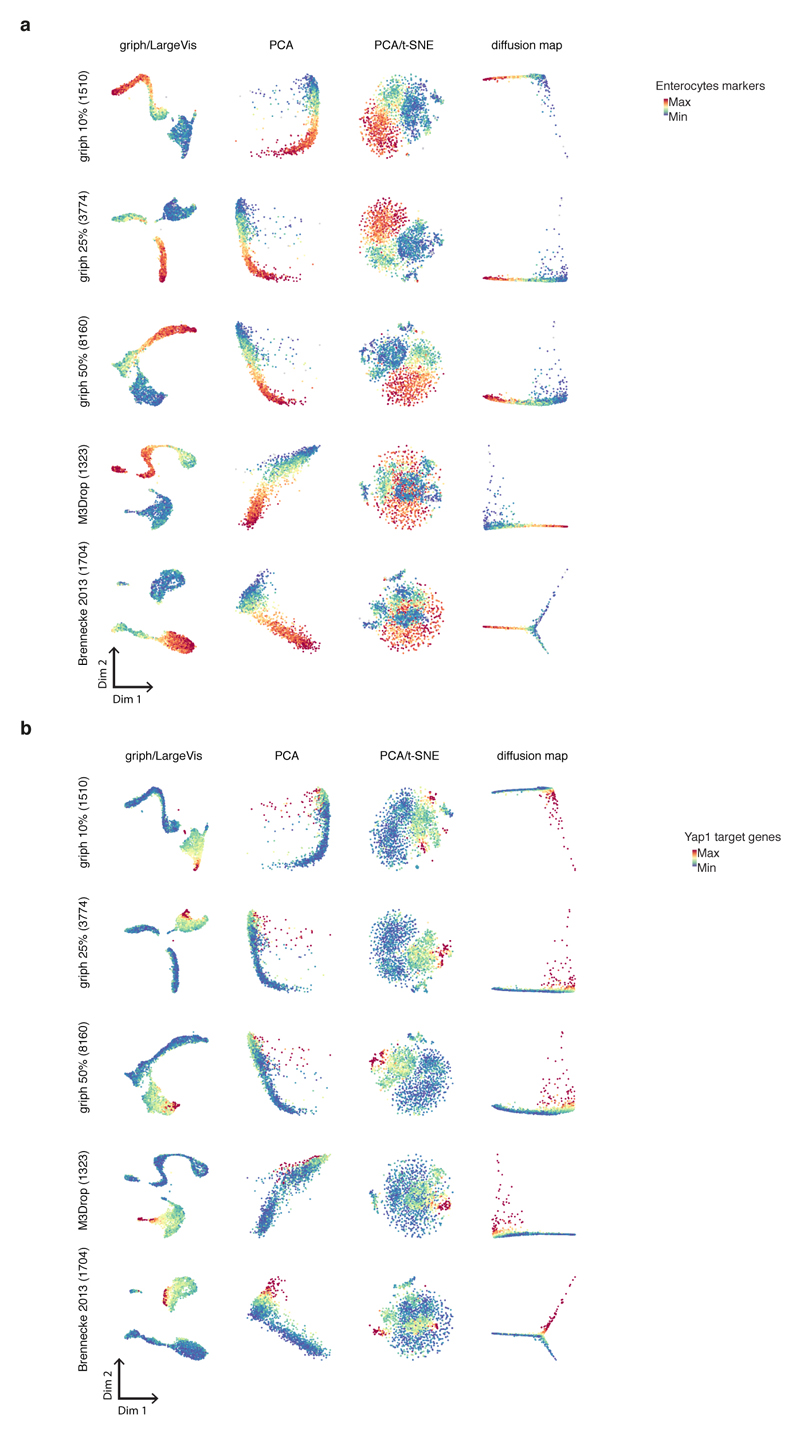
Comparison of Griph lower dimensional embedding (Griph/LargeVis) to different embedding approaches (PCA, PCA combined with t-SNE, diffusion maps) and analysis of method sensitivity for variable gene selection. Five different sets of variable genes have been selected (using Griph to retain 10%, 25% or 50% of genes per bin, by Michaelis-Menten fitting of the gene dropout rates as implemented in M3Drop, or by the mean-variance fitting procedure described in Brennecke et al., 2013) and analyzed. a, First and second dimension are shown and results are color-coded for Enterocytes marker genes (as in Fig. 5b) and b, Yap1 target genes (as in Fig. 5c). n= 1863 cells.
Extended Data Figure 9. scRNA analysis.
a, Experimental workflow for single cell RNA-sequencing. b, Griph-based visualization of single cell degree of expression of Stem cell, Paneth cell and Enterocyte marker genes. c, Griph-based visualization of single cell degree of expression of Transient Amplifying cells, Goblet cells, Enteroendocrine cells, Tuft cells, Immature Proximal Enterocytes, Immature Distal Enterocytes, Transient Amplifying cells G1-phase, Transient Amplifying cells G2-phase, Early progenitor enterocytes, Late progenitor enterocytes, Mature proximal enterocytes, Mature distal enterocytes, Enterocytes (Villus Bottom), Enterocytes (Villus Middle), Enterocytes (Villus Top) and Enterocytes marker genes. d, Spearman correlation between Yap1 target genes expression and Dll1, Dll4, Jag1, Jag2, Atoh1 expression in single cells 120h not expressing Paneth, Goblet, Enteroendocrine, Enterocyte and Stem cell markers (n=696 cells).
Extended Data Figure 10. Yap1 cell-to-cell variability allow a Notch/Dll1 event and symmetry breaking.
a, Images showing Yap1 variability and Dll1+ cells. Zoom in: nuclear localization of Hes1 in the same organoid. Arrows: Red (Dll1+ cells), yellow (Hes1+). Scale bar=10 μm. b, Images showing overlap of Paneth cells with Dll1+ cells. c, MIP images (top row) and zoom-in single plane images (bottom row) of: control, Verteporfin added at 48h, Wnt removal at 48h, LATS DKO and Ereg treatment. Organoids are fixed at 72h. d, MIP images (top-row) and zoom-in single plane images (bottom-row) of: control, Verteporfin added at 48h, Wnt removal at 48h, Yap1 overexpression, LATS DKO and Ereg treatment. Organoids are fixed at 72h. e, Fraction of enterocysts (left panel) and fraction of organoids with Paneth cells (right panel) for control and organoids treated with Ly411575 or MK-0752 at 0h. Fixation at 120h. (normalization: control, n=4 replicates, two-sided t-test, p-value Ly411575 0.009, MK-0752 0.003). Barplots: mean ± s.d. f, MIP images (top-row) and zoom-in single plane images (bottom-row) of organoids treated with control or DAPT at 120h and fixed at 144h and stained for AldoB (left panel) or Lys1 (right panel) g, Top panel: annotation enrichment of genes correlated with Yap1 target genes expression in cells expressing Yap1 target genes and Dll1, Dll4, Jag1, Jag2, Atoh1 genes. Bottom panel: annotation enrichment of genes anti-correlated with Yap1 target genes expression in cells expressing Yap1 target genes and Dll1, Dll4, Jag1, Jag2, Atoh1 genes. Enrichment Score (E.S.). h, MIP images of organoids at 120h, showing canonical Wnt signalling response (TCF-GFP) in cells neighbouring Paneth cells.
Supplementary Material
Acknowledgments
We thank Francisca Maurer for organoid preparation, Dario Vischi and Enrico Tagliavini for IT support, Gustavo de Medeiros for help in light sheet imaging, Antoine Peters for light sheet, Laurent Gelman for assistance and training, Hubertus Kohler for sorting, Sebastien Smallwood and Stephane Thiry for sequencing, Rachel Cuttat and Sven Schuierer for scRNA-seq, Lucas Pelkmans, Joerg Betschinger, Darren Gilmour, Luca Giorgetti and Charisios Tsiairis and lab members for reading the manuscript. Funding: SNSF (POOP3_157531 to P.L). This work received funding from the ERC under the European Union’s Horizon 2020 research and innovation programme (grant agreement No 758617).
Footnotes
Code Availability:
Code used for image analysis in this study was developed in the Liberali lab in Matlab and Python 3. For Python 3 multiple open source Python libraries for scientific computing and image analysis were used. The code for organoid 2D and 3D segmentation, feature extraction and organoid linkage is available under https://github.com/fmi-basel/glib-nature2018-materials. An R implementation of the Griph algorithm for scRNA-seq analysis is available as an R package at https://github.com/ppapasaikas/Griph.
Statistics and Reproducibility:
The investigators were not blinded to allocation during experiments and data analysis. The allocation of wells for experimental conditions was randomly assigned. All statistics were calculated based on technical replicates except if stated otherwise in figure legends. Statistical significance was determined with two-sided t-tests. Experiments were repeated at least twice with exception of the following experiments which were repeated once: 4i multiplexing experiment (7 technical replicates per condition and time points) used for Figure 1b, Extended data figure 1c and 4i multiplexing experiment (8 technical replicates per time point) used for Figure 5, Extended data figure 10a (Individual staining rounds were repeated at least twice in other experiments). Muc2, Glp1 (Extended data figure 1f) and Dll1/Paneth (Extended data figure 10b) staining were repeated once. Experiment in Extended data figure 1g and Extended data figure 7f, h (Lats DKO), Extended data figure 7i (Verteporfin 48h, Lats DKO), Extended data figure 10d (Wnt removal 48h), Extended data figure 10g.
Data availability: RNA-seq data are available at the Gene Expression Omnibus under accession codes GSE115955 (bulk) and GSE115956 (single-cell). Source data for figures available in the online version of the paper.
Author contributions: P.L. conceived and supervised, P.L., D.S., U.M. and A.B. designed the experiments, D.S., U.M., L.C.M. and A.B. performed the time-courses, I.L. performed the first Yap1 experiments, U.M. and A.B designed the image analysis, M.R. developed 3D and single-cell imaging, U.M. developed the trajectory inference, A.B. and P.S. built the light-sheet, A.B. and U.M. performed the light-sheet experiments, A.B. performed light-sheet image-analysis, D.S. performed all transcriptomics experiments, M.B.S. designed TF-motifs analysis, D.S. and M.B.S. performed the analysis of RNA-sequencing data, M.B.S. and P.P. developed Griph, A.W. and G.R. performed the scRNA sequencing, U.M. performed the multiplexing experiments, P.L., D.S., U.M. and A.B. wrote the paper.
Reprints and permissions information is available at www.nature.com/reprints.
Competing interests: A.B. and P.S. co-founders of Viventis Microscopy Sàrl that commercializes the light-sheet microscope.
References
- 1.Sasai Y. Cytosystems dynamics in self-organization of tissue architecture. Nature. 2013;493:318–326. doi: 10.1038/nature11859. [DOI] [PubMed] [Google Scholar]
- 2.Ohnishi Y, et al. Cell-to-cell expression variability followed by signal reinforcement progressively segregates early mouse lineages. Nat Cell Biol. 2014;16:27–37. doi: 10.1038/ncb2881. [DOI] [PMC free article] [PubMed] [Google Scholar]
- 3.Goolam M, et al. Heterogeneity in Oct4 and Sox2 Targets Biases Cell Fate in 4-Cell Mouse Embryos. Cell. 2016;165:61–74. doi: 10.1016/j.cell.2016.01.047. [DOI] [PMC free article] [PubMed] [Google Scholar]
- 4.Hanna J, et al. Direct cell reprogramming is a stochastic process amenable to acceleration. Nature. 2009;462:595–601. doi: 10.1038/nature08592. [DOI] [PMC free article] [PubMed] [Google Scholar]
- 5.Eldar A, Elowitz MB. Functional roles for noise in genetic circuits. Nature. 2010;467:167–173. doi: 10.1038/nature09326. [DOI] [PMC free article] [PubMed] [Google Scholar]
- 6.Snijder B, et al. Population context determines cell-to-cell variability in endocytosis and virus infection. Nature. 2009;461:520–523. doi: 10.1038/nature08282. [DOI] [PubMed] [Google Scholar]
- 7.Battich N, Stoeger T, Pelkmans L. Control of Transcript Variability in Single Mammalian Cells. Cell. 2015;163:1596–1610. doi: 10.1016/j.cell.2015.11.018. [DOI] [PubMed] [Google Scholar]
- 8.Loewer A, Lahav G. We are all individuals: causes and consequences of non-genetic heterogeneity in mammalian cells. Current Opinion in Genetics & Development. 2011:1–6. doi: 10.1016/j.gde.2011.09.010. [DOI] [PMC free article] [PubMed] [Google Scholar]
- 9.Snijder B, Pelkmans L. Origins of regulated cell-to-cell variability. Nat Rev Mol Cell Biol. 2011;12:119–125. doi: 10.1038/nrm3044. [DOI] [PubMed] [Google Scholar]
- 10.Wennekamp S, Mesecke S, Nedelec F, Hiiragi T. A self-organization framework for symmetry breaking in the mammalian embryo. Nat Rev Mol Cell Biol. 2013;14:452–459. doi: 10.1038/nrm3602. [DOI] [PubMed] [Google Scholar]
- 11.Sato T, et al. Single Lgr5 stem cells build cryptvillus structures in vitro without a mesenchymal niche. Nature. 2009;459:262–265. doi: 10.1038/nature07935. [DOI] [PubMed] [Google Scholar]
- 12.Spence JR, et al. Directed differentiation of human pluripotent stem cells into intestinal tissue in vitro. Nature. 2010;470:105–109. doi: 10.1038/nature09691. [DOI] [PMC free article] [PubMed] [Google Scholar]
- 13.Sato T, et al. Paneth cells constitute the niche for Lgr5 stem cells in intestinal crypts. Nature. 2011;469:415–418. doi: 10.1038/nature09637. [DOI] [PMC free article] [PubMed] [Google Scholar]
- 14.Shoshkes-Carmel M, et al. Subepithelial telocytes are an important source of Wnts that supports intestinal crypts. Nature. 2018;557:242–246. doi: 10.1038/s41586-018-0084-4. [DOI] [PMC free article] [PubMed] [Google Scholar]
- 15.San Roman AK, Jayewickreme CD, Murtaugh LC, Shivdasani RA. Wnt secretion from epithelial cells and subepithelial myofibroblasts is not required in the mouse intestinal stem cell niche in vivo. Stem Cell Reports. 2014;2:127–134. doi: 10.1016/j.stemcr.2013.12.012. [DOI] [PMC free article] [PubMed] [Google Scholar]
- 16.Farin HF, et al. Visualization of a short-range Wnt gradient in the intestinal stem-cell niche. Nature. 2016;530:340–343. doi: 10.1038/nature16937. [DOI] [PubMed] [Google Scholar]
- 17.van Es JH, et al. Dll1+ secretory progenitor cells revert to stem cells upon crypt damage. Nat Cell Biol. 2012;14:1099–1104. doi: 10.1038/ncb2581. [DOI] [PMC free article] [PubMed] [Google Scholar]
- 18.Tetteh PW, et al. Replacement of Lost Lgr5-Positive Stem Cells through Plasticity of Their Enterocyte-Lineage Daughters. Cell stem cell. 2016;18:203–213. doi: 10.1016/j.stem.2016.01.001. [DOI] [PubMed] [Google Scholar]
- 19.Yan KS, et al. Intestinal Enteroendocrine Lineage Cells Possess Homeostatic and Injury-Inducible Stem Cell Activity. Cell Stem Cell. 2017;21:78–90 e76. doi: 10.1016/j.stem.2017.06.014. [DOI] [PMC free article] [PubMed] [Google Scholar]
- 20.Tian H, et al. A reserve stem cell population in small intestine renders Lgr5-positive cells dispensable. Nature. 2011;478:255–259. doi: 10.1038/nature10408. [DOI] [PMC free article] [PubMed] [Google Scholar]
- 21.Gut G, Herrmann MD, Pelkmans L. Multiplexed protein maps link subcellular organization to cellular states. Science. 2018;361 doi: 10.1126/science.aar7042. [DOI] [PubMed] [Google Scholar]
- 22.Setty M, et al. Wishbone identifies bifurcating developmental trajectories from single-cell data. Nat Biotechnol. 2016;34:637–645. doi: 10.1038/nbt.3569. [DOI] [PMC free article] [PubMed] [Google Scholar]
- 23.Herring CA, et al. Unsupervised Trajectory Analysis of Single-Cell RNA-Seq and Imaging Data Reveals Alternative Tuft Cell Origins in the Gut. Cell Syst. 2018;6:37–51 e39. doi: 10.1016/j.cels.2017.10.012. [DOI] [PMC free article] [PubMed] [Google Scholar]
- 24.Zanconato F, et al. Genome-wide association between YAP/TAZ/TEAD and AP-1 at enhancers drives oncogenic growth. Nat Cell Biol. 2015;17:1218–1227. doi: 10.1038/ncb3216. [DOI] [PMC free article] [PubMed] [Google Scholar]
- 25.Stein C, et al. YAP1 Exerts Its Transcriptional Control via TEAD-Mediated Activation of Enhancers. PLoS Genet. 2015;11:e1005465. doi: 10.1371/journal.pgen.1005465. [DOI] [PMC free article] [PubMed] [Google Scholar]
- 26.Dupont S, et al. Role of YAP/TAZ in mechanotransduction. Nature. 2011;474:179–183. doi: 10.1038/nature10137. [DOI] [PubMed] [Google Scholar]
- 27.Camargo FD, et al. YAP1 increases organ size and expands undifferentiated progenitor cells. Current Biology. 2007;17:2054–2060. doi: 10.1016/j.cub.2007.10.039. [DOI] [PubMed] [Google Scholar]
- 28.Gregorieff A, Liu Y, Inanlou MR, Khomchuk Y, Wrana JL. Yap-dependent reprogramming of Lgr5+ stem cells drives intestinal regeneration and cancer. Nature. 2015:1–16. doi: 10.1038/nature15382. [DOI] [PubMed] [Google Scholar]
- 29.Barry ER, et al. Restriction of intestinal stem cell expansion and the regenerative response by YAP. Nature. 2013;493:106–110. doi: 10.1038/nature11693. [DOI] [PMC free article] [PubMed] [Google Scholar]
- 30.Azzolin L, et al. YAP/TAZ Incorporation in the β-Catenin Destruction Complex Orchestrates the Wnt Response. Cell. 2014;158:157–170. doi: 10.1016/j.cell.2014.06.013. [DOI] [PubMed] [Google Scholar]
- 31.Yui S, et al. YAP/TAZ-Dependent Reprogramming of Colonic Epithelium Links ECM Remodeling to Tissue Regeneration. Cell Stem Cell. 2018;22:35–49 e37. doi: 10.1016/j.stem.2017.11.001. [DOI] [PMC free article] [PubMed] [Google Scholar]
- 32.Haber AL, et al. A single-cell survey of the small intestinal epithelium. Nature. 2017;551:333–339. doi: 10.1038/nature24489. [DOI] [PMC free article] [PubMed] [Google Scholar]
- 33.Moor AE, et al. Spatial Reconstruction of Single Enterocytes Uncovers Broad Zonation along the Intestinal Villus Axis. Cell. 2018;175:1156–1167 e1115. doi: 10.1016/j.cell.2018.08.063. [DOI] [PubMed] [Google Scholar]
- 34.Fre S, et al. Notch signals control the fate of immature progenitor cells in the intestine. Nature. 2005;435:964–968. doi: 10.1038/nature03589. [DOI] [PubMed] [Google Scholar]
- 35.Noah TK, Shroyer NF. Notch in the intestine: regulation of homeostasis and pathogenesis. Annu Rev Physiol. 2013;75:263–288. doi: 10.1146/annurev-physiol-030212-183741. [DOI] [PubMed] [Google Scholar]
- 36.Yin X, et al. Niche-independent high-purity cultures of Lgr5+ intestinal stem cells and their progeny. Nat Methods. 2014;11:106–112. doi: 10.1038/nmeth.2737. [DOI] [PMC free article] [PubMed] [Google Scholar]
- 37.Totaro A, et al. YAP/TAZ link cell mechanics to Notch signalling to control epidermal stem cell fate. Nat Commun. 2017;8:15206. doi: 10.1038/ncomms15206. [DOI] [PMC free article] [PubMed] [Google Scholar]
- 38.Bray SJ. Notch signalling in context. Nat Rev Mol Cell Biol. 2016;17:722–735. doi: 10.1038/nrm.2016.94. [DOI] [PubMed] [Google Scholar]
- 39.Chen KY, et al. A Notch positive feedback in the intestinal stem cell niche is essential for stem cell self-renewal. Mol Syst Biol. 2017;13:927. doi: 10.15252/msb.20167324. [DOI] [PMC free article] [PubMed] [Google Scholar]
- 40.Carroll TD, et al. Interkinetic nuclear migration and basal tethering facilitates post-mitotic daughter separation in intestinal organoids. J Cell Sci. 2017;130:3862–3877. doi: 10.1242/jcs.211656. [DOI] [PMC free article] [PubMed] [Google Scholar]
- 41.Gjorevski N, et al. Designer matrices for intestinal stem cell and organoid culture. Nature. 2016;539:560–564. doi: 10.1038/nature20168. [DOI] [PubMed] [Google Scholar]
- 42.Sjoqvist M, Andersson ER. Do as I say, Not(ch) as I do: Lateral control of cell fate. Dev Biol. 2017 doi: 10.1016/j.ydbio.2017.09.032. [DOI] [PubMed] [Google Scholar]
- 43.Zhang H, Pasolli HA, Fuchs E. Yes-associated protein (YAP) transcriptional coactivator functions in balancing growth and differentiation in skin. Proc Natl Acad Sci U S A. 2011;108:2270–2275. doi: 10.1073/pnas.1019603108. [DOI] [PMC free article] [PubMed] [Google Scholar]
- 44.Xin M, et al. Hippo pathway effector Yap promotes cardiac regeneration. Proc Natl Acad Sci U S A. 2013;110:13839–13844. doi: 10.1073/pnas.1313192110. [DOI] [PMC free article] [PubMed] [Google Scholar]
- 45.Yimlamai D, et al. Hippo pathway activity influences liver cell fate. Cell. 2014;157:1324–1338. doi: 10.1016/j.cell.2014.03.060. [DOI] [PMC free article] [PubMed] [Google Scholar]
- 46.Cebola I, et al. TEAD and YAP regulate the enhancer network of human embryonic pancreatic progenitors. Nat Cell Biol. 2015;17:615–626. doi: 10.1038/ncb3160. [DOI] [PMC free article] [PubMed] [Google Scholar]
- 47.Panciera T, Azzolin L, Cordenonsi M, Piccolo S. Mechanobiology of YAP and TAZ in physiology and disease. Nat Rev Mol Cell Biol. 2017;18:758–770. doi: 10.1038/nrm.2017.87. [DOI] [PMC free article] [PubMed] [Google Scholar]
- 48.Zhang N, et al. The Merlin/NF2 tumor suppressor functions through the YAP oncoprotein to regulate tissue homeostasis in mammals. Dev Cell. 2010;19:27–38. doi: 10.1016/j.devcel.2010.06.015. [DOI] [PMC free article] [PubMed] [Google Scholar]
- 49.Sato T, et al. Single Lgr5 stem cells build crypt-villus structures in vitro without a mesenchymal niche. Nature. 2009;459:262–265. doi: 10.1038/nature07935. [DOI] [PubMed] [Google Scholar]
- 50.Murray E, et al. Simple, Scalable Proteomic Imaging for High-Dimensional Profiling of Intact Systems. Cell. 2015;163:1500–1514. doi: 10.1016/j.cell.2015.11.025. [DOI] [PMC free article] [PubMed] [Google Scholar]
- 51.Ronneberger O, Fischer P, Brox T. U-net: Convolutional networks for biomedical image segmentation. International Conference on Medical image computing and computer-assisted intervention; Springer, Cham; 2015. [Google Scholar]
- 52.Xie S, Girshick R, Dollár P, Tu Z, He K. Aggregated Residual Transformations for Deep Neural Networks. Computer Vision and Pattern Recognition (CVPR); IEEE Conference; 2017. [Google Scholar]
- 53.Salvadora S, Chan P. Toward accurate dynamic time warping in linear time and space. Intell Data Anal. 2007;11:561–580. [Google Scholar]
- 54.Strnad P et al. Inverted light-sheet microscope for imaging mouse pre-implantation development. Nature Methods. 2015:1–7. doi: 10.1038/nmeth.3690. [DOI] [PubMed] [Google Scholar]
- 55.Dobin A, et al. STAR: ultrafast universal RNA-seq aligner. Bioinformatics. 2013;29:15–21. doi: 10.1093/bioinformatics/bts635. [DOI] [PMC free article] [PubMed] [Google Scholar]
- 56.Chevrier S et al. An Immune Atlas of Clear Cell Renal Cell Carcinoma. Cell. 2017;169:736–749 e718. doi: 10.1016/j.cell.2017.04.016. [DOI] [PMC free article] [PubMed] [Google Scholar]
- 57.McCarthy DJ, Chen Y, Smyth GK. Differential expression analysis of multifactor RNA-Seq experiments with respect to biological variation. Nucleic Acids Res. 2012;40:4288–4297. doi: 10.1093/nar/gks042. [DOI] [PMC free article] [PubMed] [Google Scholar]
- 58.Friedman J, Hastie T, Tibshirani R. Regularization Paths for Generalized Linear Models via Coordinate Descent. J Stat Softw. 2010;33:1–22. [PMC free article] [PubMed] [Google Scholar]
- 59.Lun AT, McCarthy DJ, Marioni JC. A step-by-step workflow for low-level analysis of single-cell RNA-seq data with Bioconductor. F1000Res. 2016;5:2122. doi: 10.12688/f1000research.9501.1. [DOI] [PMC free article] [PubMed] [Google Scholar]
- 60.McCarthy DJ, Campbell KR, Lun AT, Wills QF. Scater: pre-processing, quality control, normalization and visualization of single-cell RNA-seq data in R. Bioinformatics. 2017;33:1179–1186. doi: 10.1093/bioinformatics/btw777. [DOI] [PMC free article] [PubMed] [Google Scholar]
- 61.Zheng GXY, et al. Massively parallel digital transcriptional profiling of single cells. Nature Communications. 2017;8 doi: 10.1038/ncomms14049. [DOI] [PMC free article] [PubMed] [Google Scholar]
- 62.Hsieh CJ, Sustik MA, Dhillon IS, Ravikumar P. QUIC: Quadratic Approximation for Sparse Inverse Covariance Estimation. J Mach Learn Res. 2014;15:2911–2947. [Google Scholar]
- 63.Friedman J, Hastie T, Tibshirani R. Sparse inverse covariance estimation with the graphical lasso. Biostatistics. 2008;9:432–441. doi: 10.1093/biostatistics/kxm045. [DOI] [PMC free article] [PubMed] [Google Scholar]
- 64.Haveliwala TH. Topic-sensitive PageRank: A context-sensitive ranking algorithm for Web search. Ieee T Knowl Data En. 2003;15:784–796. [Google Scholar]
- 65.Blondel VD, Guillaume JL, Lambiotte R, Lefebvre E. Fast unfolding of communities in large networks. J Stat Mech-Theory E. 2008 [Google Scholar]
- 66.Tang J, Liu J, Zhang M, M Q. Visualizing large-scale and high-dimensional data. Proceedings of the 25th International Conference on World Wide Web; 2016. [Google Scholar]
- 67.van der Maaten L, Hinton G. Visualizing Data using t-SNE. J Mach Learn Res. 2008;9:2579–2605. [Google Scholar]
- 68.Fruchterman TMJ, Reingold EM. Graph Drawing by Force-Directed Placement. Software Pract Exper. 1991;21:1129–1164. [Google Scholar]
- 69.Brennecke P, et al. Accounting for technical noise in single-cell RNA-seq experiments. Nat Methods. 2013;10:1093–1095. doi: 10.1038/nmeth.2645. [DOI] [PubMed] [Google Scholar]
Associated Data
This section collects any data citations, data availability statements, or supplementary materials included in this article.


