Summary
Oligodendrocyte (OL) pathology is increasingly implicated in neurodegenerative diseases as OLs both myelinate and provide metabolic support to axons. In Multiple Sclerosis (MS), demyelination in the central nervous system (CNS) thus leads to neurodegeneration, but the severity of MS between patients is very variable. Disability does not correlate well with the extent of demyelination1, suggesting that other factors contribute to this variability. One such factor may be OL heterogeneity. Not all OLs are the same - mouse spinal cord OLs inherently produce longer myelin sheaths than cortical OLs2, and single cell analysis of mouse CNS identified further differences3,4. However, the extent of human OL heterogeneity and its possible contribution to MS pathology remains unknown. Here we performed single nuclei RNA-sequencing (snRNA-seq) from white matter (WM) areas of post mortem human brain both in control (Ctr) and MS patients. We identified sub-clusters of oligodendroglia in Ctr human WM, some similar to mouse, and defined new markers for these cell states. Strikingly, some sub-clusters were under-represented in MS tissue, while others were more prevalent. These differences in mature OL sub-clusters may indicate different functional states of OLs in MS lesions. Since this is similar in normal appearing white matter (NAWM), MS is a more diffuse disease than its focal demyelination suggests. Our findings of an altered oligodendroglial heterogeneity in MS may be important to understanding disease progression and developing therapeutic approaches.
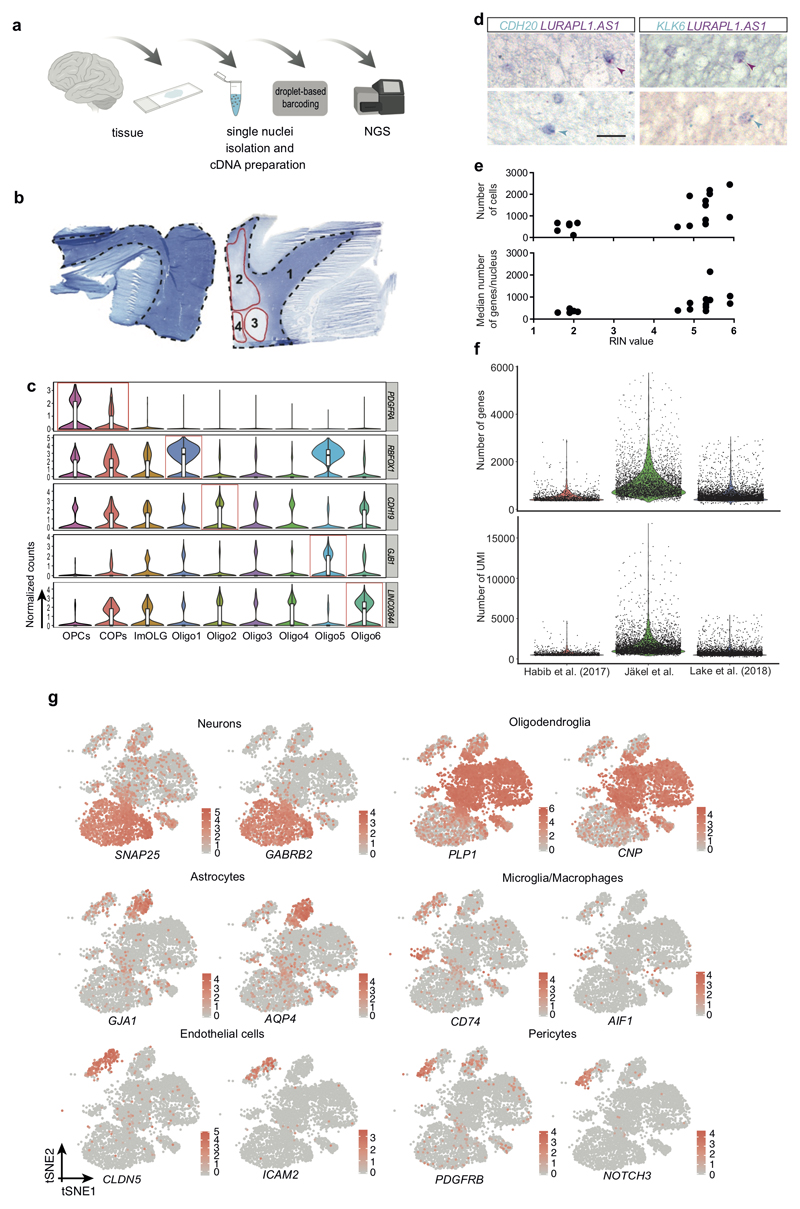
We performed snRNA-seq from WM of post mortem tissue of five human controls without neurological disease and four individuals with progressive MS (Supplementary Table1) using the 10x Genomics pipeline5 (Extended Fig.1a). We isolated nuclei from different WM areas within the same MS tissue block/patient, including NAWM, active (A), chronic active (CA), chronic inactive (CI) and remyelinated (RM) lesions (Extended Fig.1b), as defined by neuropathology6. After quality control, we obtained 17799 nuclei, with a mean of 1096 genes/nucleus, and a mean of 1795 unique molecular identifiers (UMI)/nucleus (Extended Fig.1e,f and Supplementary Table2).
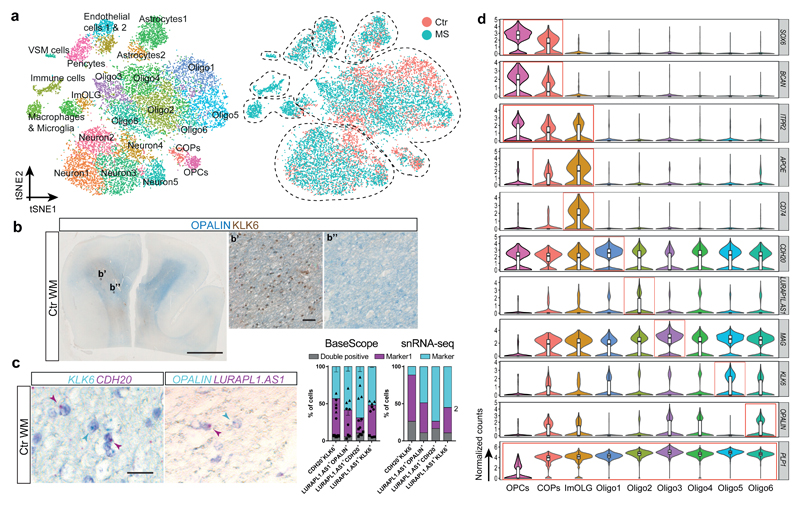
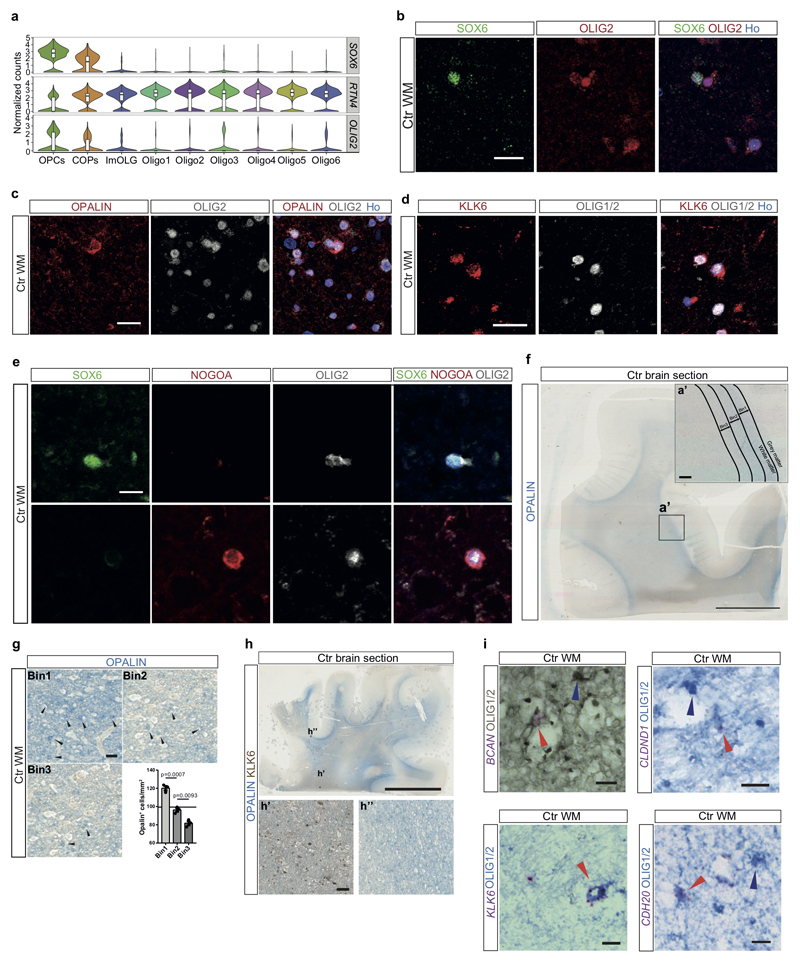
We performed canonical correlation analysis (CCA) in the combined Ctr and MS patient dataset, to minimize sample individual variability batch effects, and clustering with Seurat2 (Extended Fig.3)7. We identified five sub-clusters of neurons, seven of OLs, and additional clusters for OPCs, committed OL precursors (COPs), astrocytes, vascular smooth muscle cells (VSM), pericytes, endothelial cells, and immune cells (Fig.1a, Extended Fig.1g and Supplementary Table3). We found unique or enriched RNA markers for the individual sub-clusters within the OL lineage (Fig.1d, Extended Fig.1c and Supplementary Table4): PDGFRA, BCAN and SOX6 for OPCs, APOE and CD74 for immune oligodendroglia (imOLG, see below), CDH20 and RBFOX1 for Oligo1, LURAP1L.AS1 and CDH19 for Oligo2, KLK6 and GJB1 for Oligo5 and OPALIN, LINC00844 for Oligo6. We confirmed the presence of OLIG2 and absence of NOGOA (RTN4) in human OPCs, as used for their identification by neuropathologists8 (Extended Fig.4a). Immunohistochemistry (IHC) showed that these OLIG2+NOGOA- OPCs are also SOX6+ (Extended Fig.4b,e). IHC confirmed co-labeling of KLK6 (Oligo5) or OPALIN (Oligo6) with OLIG2 (Extended Fig.4c,d) and segregation of Oligo5 and Oligo6 (Fig.1b and Extended Fig.4f-h) on a different set of donor tissue. Segregation of pairs of sub-cluster markers for Oligo1, Oligo2 and Oligo5 was also confirmed using duplex in situ hybridization (ISH - BaseScope), with less than 10% of OLs containing both RNA markers (Fig.1c). Correlation analysis with oligodendroglia from an Experimental Autoimmune Encephalomyelitis (EAE) mouse model of MS4 indicated similarities between mouse and human OPCs (Extended Fig.5 and Supplementary Table5). Human Oligo1 and 5 correlated with mouse MOL1/2, while the remaining mature human OL populations were closer to mouse MOL5/6. Human Oligo3 and imOLG also presented similarities to mouse OPCs/COPS (Extended Fig.5). Therefore, human WM has transcriptionally heterogeneous OL states that show some similarities to the adult mouse counterpart.
Figure1. Single nuclei RNA-seq reveals oligodendroglia heterogeneity in the human brain.
a, tSNE projection of all recovered cell clusters, sorted by cell population (left) or disease condition (right) (n=17799 nuclei from 5 Ctr and 4 MS patients). b, Combined OPALIN and KLK6 staining of human Ctr WM (scale bar: 5mm, inlays: 50µm). c, Double in-situ hybridization (ISH, BaseScope) of human Ctr WM counterstained with hematoxylin; quantification of double-positive OL determined by ISH (left) and the snRNA-seq dataset (right), (left graph: n=4 for LURAP1L.AS1+CDH20+, n=3 for other combinations. Experiments were performed in 3 independent batches; data displayed as mean ± SEM, rectangles, circles and triangles display individual values of double positive, marker1 and marker2, respectively. Right graph: Percentage of nuclei positive for marker 1, marker 2 and double. Positive = average expression >0. Total n (individual nuclei) for each combination: CDH20+KLK6+ n=5902, LUAP1L.AS1+OPALIN+ n=2980, nLUAP1L.AS1+CDH20+=5782, nLUAP1L.AS1+KLK6+=3395. d, Violin plots of markers enriched in specific OL subpopulations showing normalized gene expression (nOPC=352, nCOP=242, ImOLG=207, nOligo1=1129, nOligo2=1839, nOligo3=775, nOligo4=1579, nOligo5=1167, nOligo6=1484). Violin plots are centered around the median with interquartile ranges, with the shape representing cell distribution. ImOLG: immune oligodendroglia, VSM cells: vascular smooth muscle cells, COPs, committed oligodendrocyte progenitor cells, OPCs: oligodendrocyte precursor cells.
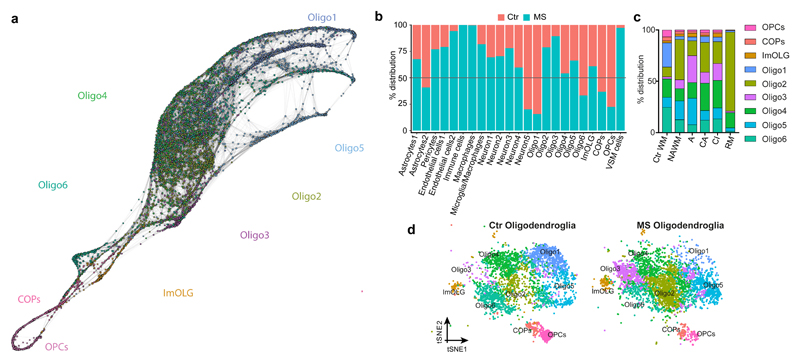
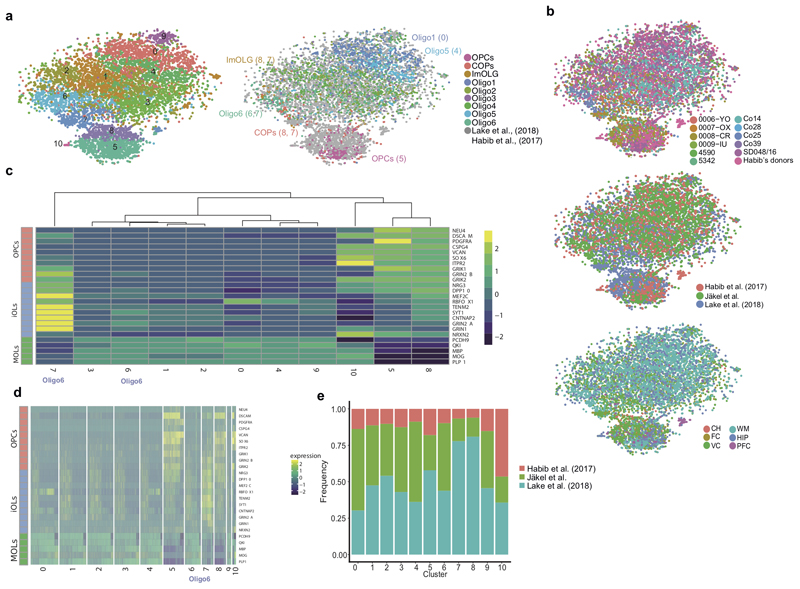
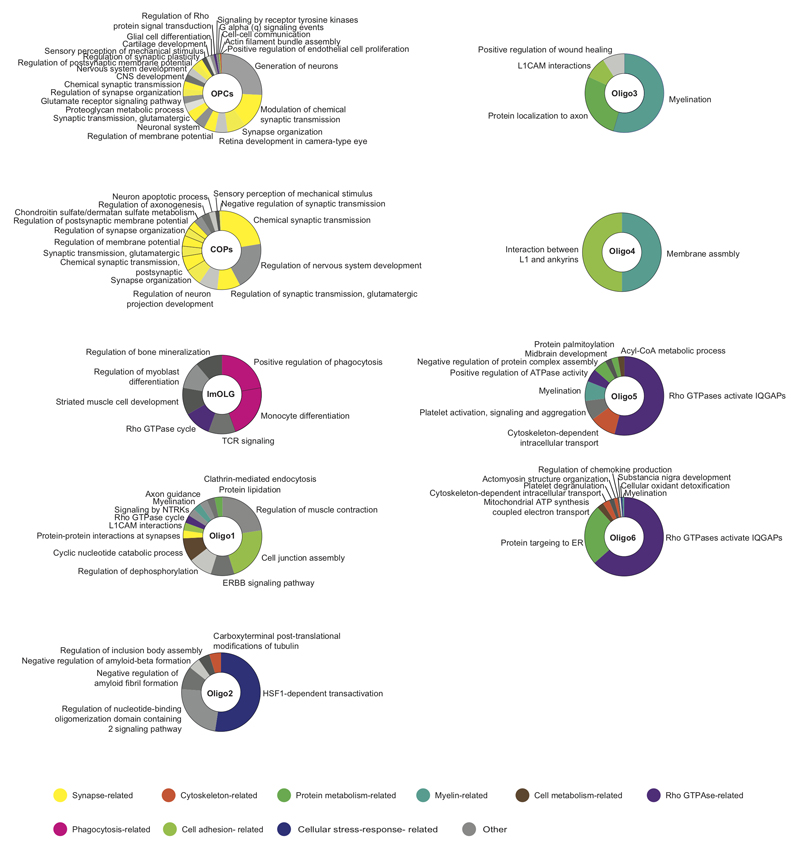
In accordance with adult mouse brain scRNA-Seq3, we detected very few cells with the hallmarks of newly formed OL (NFOLs) (Fig.1a). Thus, we combined our data from Ctr WM with previously published adult brain data9,10 using CCA followed by clustering with Seurat27 (Extended Fig.2a and Supplementary Table2). We were able to re-identify some of our OL sub-clusters in these other datasets (Extended Fig.2a). Moreover, we now found that Oligo6 had hallmarks of an intermediate state between OPCs and mature OLs (Extended Fig.2c,d). To confirm Oligo6 as an intermediate OL state, we performed Single-cell Near-Neighbor Network Embedding (SCN3E) analysis11 to order the identified populations in pseudotime (Fig.2a). A subset of Oligo6 nuclei connected OPCs/COPs with the remaining mature OLs, confirming the intermediate character of this cluster. Oligo1 and Oligo5, by contrast, represented end-states in the SCN3E analysis. Interestingly, gene ontology (GO) analysis indicated that their highest expressed genes were not myelin genes (Extended Fig.6) suggesting that these mature stable OLs do not need to maintain a strongly active transcriptional machinery for myelination, but rather a transcriptional network reinforcing signaling, cell-cell adhesion and viability. By contrast, GO analysis also indicated that Oligo3 and Oligo4, represented actively myelinating oligodendrocytes with ‘myelination’ and ‘membrane assembly’ pathways (Extended Fig. 6).
Figure2. Altered oligodendroglia heterogeneity in human MS brain.
a, SCN3E pseudotime analysis of the human OL lineage in Ctr and MS white matter (WM). b, Frequency distribution of all clusters between Ctr (red) and MS (turquoise) nuclei. c, Frequency distribution of OL clusters between Ctr and different MS lesions. d, tSNE projections of OL sub-clusters in Ctr and MS tissue (n=4037 OL in Ctr and n=4737 OL in MS).
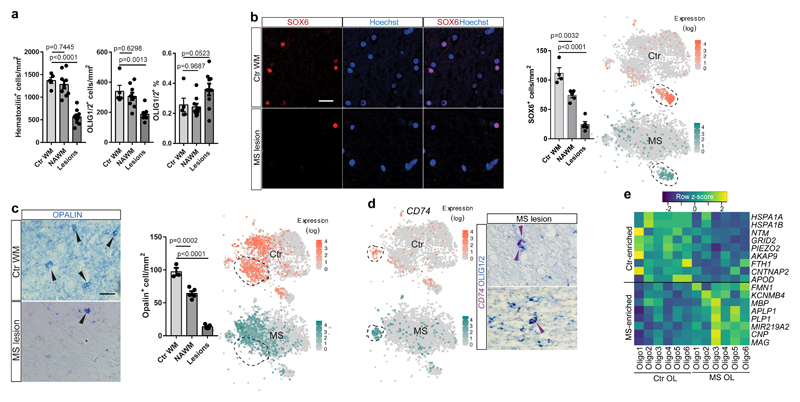
We next compared single-nuclei transcriptional profiles of oligodendroglia from the individuals with MS with the Ctr individuals. CCA analysis (considering all the individual samples as a variable and using the union of the top variable genes from each of the samples) and Seurat2 clustering lead to the identification of all brain cell types, including pericytes, macrophages and other immune cells (Fig. 2b) reflecting immunological infiltration of the CNS in MS. The total number of OL nuclei isolated in Ctr and MS samples was within the same range (Fig.2d). We quantified OLIG1/2-expressing cells and, despite fewer cells generally in demyelinated lesions, the percentage of OLIG1/2+ cells in lesions did not change compared to NAWM and Ctr WM (Fig.3a). Further analysis revealed the same oligodendroglial sub-clusters in the nuclei derived from MS patients as in Ctr individuals. However, the frequency of nuclei in individual sub-clusters was markedly different between Ctr and MS in three ways (Fig.2b), helping to explain previous microarray analyses of human brain tissue showing different OL transcriptional outputs in MS brain at the population level12–16.
Figure3. Depletion of specific OL sub-clusters and increased expression of myelination genes in mature OLs in human MS brain.
a, Total cellular and OL densities in Ctr WM, NAWM and MS lesions (data displayed as mean ± SEM, n=5 Ctr individuals, n=9 MS individuals, ANOVA). b, SOX6-expressing OPCs in Ctr WM, NAWM and MS lesions (scale bars 50µm, data displayed as mean ± SEM, n=4 Ctr individuals, n=5 MS individuals, ANOVA) and tSNE overlay of SOX6 expression in the Ctr and MS snRNA-seq dataset. c, OPALIN-expressing OL in Ctr WM, NAWM and MS lesions (scale bar: 50µm, data displayed as mean±SEM, n=3 Ctr individuals, n=5 MS individuals, ANOVA) and tSNE overlay of OPALIN expression in the Ctr and MS snRNA-seq dataset. d, CD74 expression in the Ctr and the MS snRNA-seq dataset and BaseScope in-situ validation of presence of CD74 combined with IHC staining for Olig1/2+ OLs (n=2 different MS patients, experiments were performed in 2 independent batches). e, Heatmap representing the average gene expression of a subset of genes, including myelin-related genes, in mature OL in Ctr vs. MS samples). For tSNEs and heatmap, n=4037 OL in Ctr and n=4737 OL in MS for all t-SNE projections). a-c: only p-values compared to Ctr are displayed.
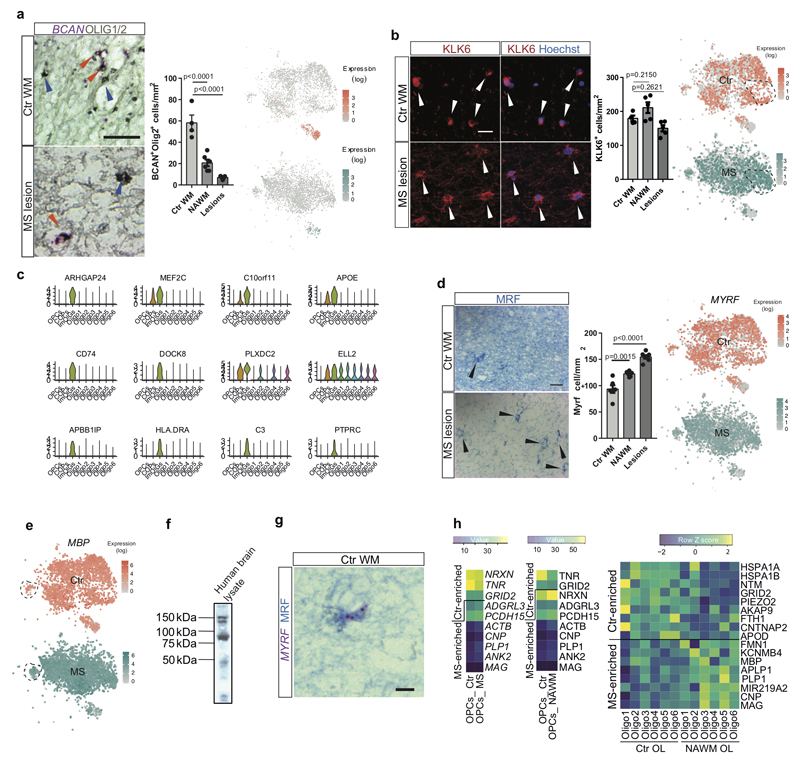
First, we observed fewer nuclei from OPCs in all MS lesions and in NAWM (Fig.2c,d). To verify this reduction in other MS patients, we quantified OPCs using the specific novel markers identified above for human OPCs, BCAN and SOX6, on post mortem MS tissue from a different patient cohort (Supplementary Table1). Using both IHC against SOX6 (Fig.3b) and ISH against BCAN (Extended Fig. 8a), we confirmed a significant reduction in OPCs both in lesions and NAWM, compared to Ctr. This is consistent with previous studies17–19 of OPC numbers showing their loss in some MS lesions.
Second, the intermediate Oligo6 cells were highly reduced in MS (Fig.2b,d). We confirmed this using IHC against OPALIN on MS tissue, both in lesions and in NAWM (Fig.3c). In addition, we found that remaining OPALIN+ Oligo6 cells were predominantly localized to the junction between the WM and GM (Extended Fig.4f,g). This widespread decrease of both OPALIN+ cells and OPCs in MS tissue adds evidence to the concept that NAWM is indeed not ‘normal’ but has more global changes that may reflect a propensity to demyelination20,21 or a regenerative response.
Third, we identified skewing in the sub-clusters of mature OLs between MS and Ctr tissue (Fig.2c,d and Extended Fig.7e): Oligo1 was depleted in MS, while Oligo2, Oligo3, Oligo5 and imOLGs were enriched. This skewed distribution remained after deconvolution of our MS samples according to whether they were from NAWM or lesions (Fig.2c). We confirmed that KLK6+ Oligo5 were not lost in MS lesions and NAWM by IHC (Extended Fig. 8b). Although ImOLG expressed canonical OL genes, they were slightly separated from the main OL cloud in the tSNE, were closely associated with microglia, and expressed genes such as CD74, HLA.DRA, PTPRC, C3 (Fig.3d and Extended Fig.8c). We validated the expression of CD74 in OLIG1/2+ OL by ISH (Fig.3d). GO and SCN3E analysis suggested that this population consists of intermediate OLs with an immunological phenotype (Fig.2a and Extended Fig.6) that we have previously described in EAE and in human4.
In addition, differential gene expression analysis between individual OL in Ctr compared to MS indicated that several myelin protein genes were upregulated in mature OL in MS (Fig.3e, Extended Fig.8h and Supplementary Table6). We found similar upregulation of myelin genes when comparing Ctr and NAWM (Extended Fig.8h) indicating that, in the context of disease, mature OLs might increase transcriptional programs responsible for myelination.
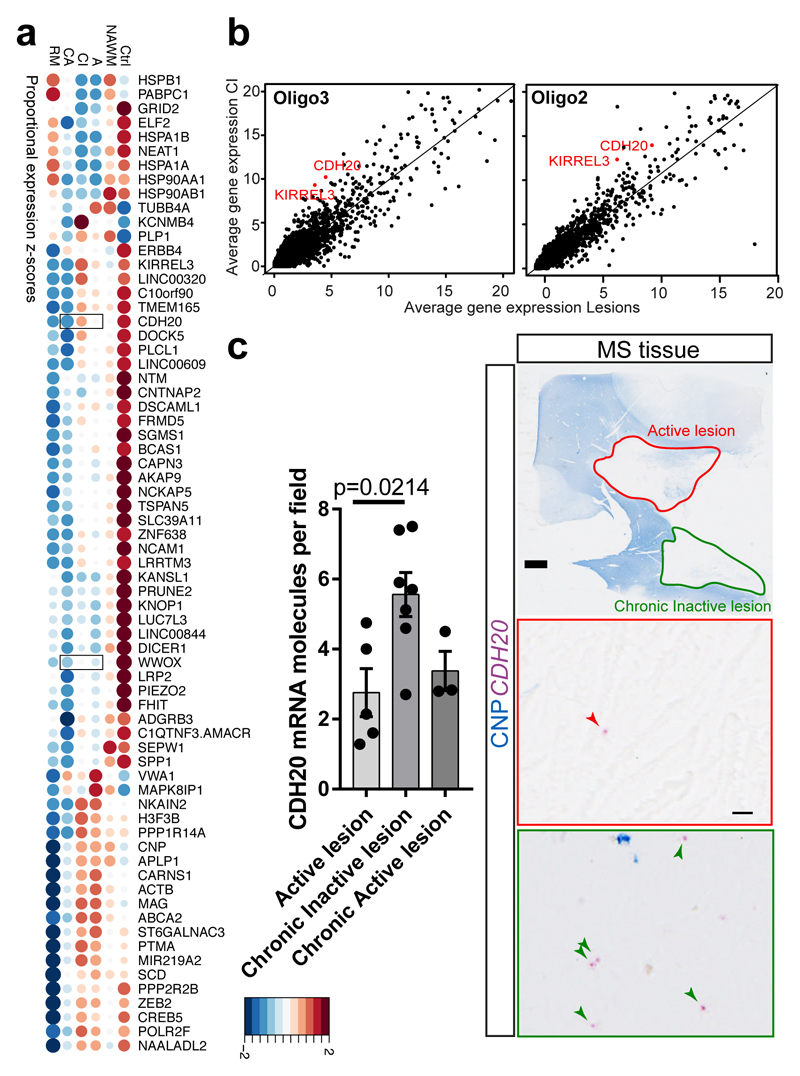
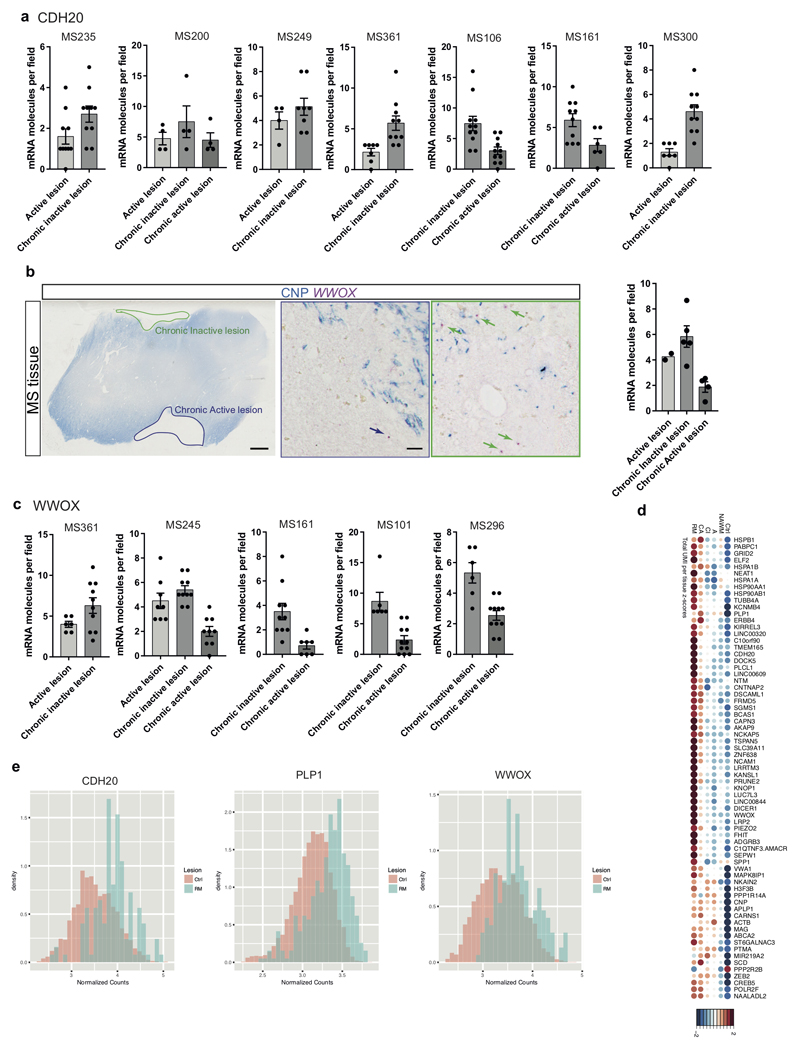
Our dataset has the unique advantage that we could identify and compare expression of potential novel biological markers in different lesion types, NAWM and Ctr WM, albeit on a limited number of patients. The proportion of cells expressing several genes (e.g. KIRREL3, CDH20, PLCL1, LINC00609, FRMD5, LRRTM3, C1QTNF3-AMACR) was enriched in Ctr and CI, but not in other lesions (Fig.4a). Other markers were proportionally enriched or depleted in other lesion types, such as NKAIN2 (reduced proportion in RM lesions) or WWOX (reduced proportion in CA lesions) (Fig.4a). Significant differences in expression levels were also observed in specific OL sub-clusters for KIRREL3 and CDH20 (Fig.4b and Supplementary Table7). Paradoxically, the average expression (total normalized RNA counts) for some of these genes was lower in Ctr tissues and higher in RM lesions (Extended Fig. 9d). This may be due to a lower proportion of cells in RM lesions expressing some genes at a higher level, leading to a sparse but high overall expression level (Extended Fig. 9e). However, using ISH on a different cohort of MS tissue, we could confirm the finding of an increased number of cells expressing CDH20 in CI lesions and reduced number of WWOX-expressing cells in CA lesions (Fig.4c and Extended Fig.9a-c). Thus, in spite of small numbers and pathological subtype lesion variability, our results provide proof of principle that MS lesion subtypes may be identifiable by different markers. Increasing patient and lesion numbers may lead to the identification of novel and specific markers of MS lesions, which will be interesting to correlate with clinical outcome, imaging and cell type-specific effects of MS risk SNPs. These differences may even provide potential future targets for PET biomarkers to identify different MS lesion types in vivo.
Figure4. Differential gene expression analysis of MS lesions reveals potential specific markers.
a, Dotplot illustrating the top differentially expressed genes (in terms of percentage of cells expressing these genes per sample) between lesions, NAWM and control; both size and color indicate z-scores (blue and large: low; red and large: high; small: intermediate). Validated genes CDH20 and WWOX are highlighted with squares. b, Average gene expression across Oligo2 (left) and Oligo3 (right) in chronic inactive (CI) lesions compared to the average expression in the rest of the lesions. In red: examples of genes significantly differentially expressed and upregulated in CI lesions (Bonferroni corrected Wilcoxon Rank Sum two-sided test, adjusted p-val <0.05). c, BaseScope in-situ validation of CDH20 expression in different lesion types (scale bars: 2mm, 10µm, data displayed as mean±SEM, n=5 active lesions, n=7 chronic inactive and n=3 chronic active lesions derived from n=7 different MS patients, ANOVA, only significant p-values are displayed). Abbreviations: NAWM (normal appearing white matter), active (A), chronic active (CA), chronic inactive (CI) and remyelinated (RM).
Our findings clearly illustrate the power of snRNA-Seq for the neuropathological analysis of human diseases, and we predict that the widespread use of this technology at scale will greatly enhance our understanding of chronic neurological diseases and lead to revised classifications, improved diagnostic accuracy, and novel markers. Furthermore our data show the need to re-evaluate current approaches for discovering regenerative therapies in MS. These are based on the assumption that enhancing differentiation of resident OPCs to OLs expressing myelin genes/proteins will lead to enhanced remyelination in progressive MS. Our results show that this is over-simplistic for two reasons. First, the striking pathology we observe is not a failure of differentiation to the myelin gene-expressing OL, but is instead the loss of the Oligo1 population (which we predict to be fully mature and stable OLs) and the skewing of the differentiation program to other subclasses of mature OLs with different transcriptional signatures. These new OLs may therefore have important functional differences in their ability to provide metabolic support or, in the case of imOLG, contribute to the inflammatory pathology. Identification of these functional differences and strategies to restore healthy OL heterogeneity should be a major future focus in MS research. Second, our results showing depletion of not only OPCs but also the intermediate Oligo6 populations, and increased expression of myelin genes in mature OLs in MS, may suggest that subsets of mature OLs contribute to remyelination. This is in line with retrospective carbon 14 based birth-dating in MS patients22 and electron microscopy in large animal models23, but in sharp contrast to rodents where remyelination is driven entirely by recruitment and differentiation of resident OPCs. This highlights the difficulties in extrapolation from rodent to human and further emphasizes the power of studying human pathology at a single cell level to inform appropriate therapeutic approaches.
Methods
Human Donor tissue
Post-mortem unfixed frozen tissue and formalin fixed paraffin embedded (FFPE) tissue was obtained from the UK Multiple Sclerosis Tissue Bank via a UK prospective donor scheme with full premortem consent and with full ethical approval by MREC/02/2/39 (UK Ethics Committee) and 2016/589-31 (Regionala Etiskprövningsnämnden, Stockholm, Sweden). For the snRNA-seq, we used white matter regions from fresh-frozen tissue sections for both controls (4 males and 1 female), NAWM and MS lesions (3 males and 1 female). Controls (Supplementary Table1): 5 samples from 5 different donors, NAWM: 3 samples from 3 patients, Chronic Active: 4 samples from 4 patients, Active: 3 samples from 2 patients, Chronic inactive: 3 samples from 3 patients, Remyelinated: 2 samples from 2 patients. For the in-situ validation on FFPE tissue sections we used a total of 11 Ctr (5 males and 6 females) and 15 MS (7 males and 8 females) tissue samples from different donors. The Ctr and MS donors did not have a significantly different age difference (Ctr frozen: 58.0±17.5 yrs, MS frozen: 46.8±8.4 yrs, Ctr FFPE: 57.7±12.3 yrs, MS FFPE: 53.5±9.1 yrs, One-way ANOVA (p=0.3724), F(3, 31)=1.079, Tukey’s multiple comparison test: Ctr frozen vs. MS frozen: p=0.4769, Ctr frozen vs. Ctr FFPE: p>0.9999, Ctr frozen vs. MS FFPE: p=0.8713, MS frozen vs. Ctr FFPE: p=0.3775, MS frozen vs. MS FFPE: p=0.7307, Ctr FFPE vs. MS FFPE: p=0.7889, data displayed as mean ± SD).
Isolation of Nuclei
Nuclei were isolated from fresh-frozen 10μm sections as previously described24 with modifications. The regions of interest were macro-dissected with a scalpel blade, lysed in Nuclei Isolation Buffer (NEB, 10mM TrisHCl pH 8.0, 0.25M Sucrose, 5mM MgCl2, 25mM KCl, 0.1% Triton X) with 0.1mM DTT and 0.4U/ul RNAse Inhibitors freshly added before use and homogenized with a Dounce homogenizer. The suspension was filtered through a 30μm strainer and centrifuged for 10min at 1,000g. The pellet was re-suspended in 400μl cold PBS with 0.4U/μl RNAse inhibitors and 310μl of solution mixed with 90μl of debris removal solution (Miltenyi Biotech), overlaid with 400μl of cold PBS with 0.4U/μl RNAse inhibitors and centrifuged for 10min at 3,000g. The supernatant was removed, the pellet washed with cold PBS with 0.4U/μl RNAse inhibitors and re-suspended in PBS 0.5% BSA with 0.4U/μl RNAse inhibitors. The remaining 90μl were diluted with 180μl of cold PBS 0.75% BSA 0.4U/μl RNAse inhibitors, filtered through a decreasing cell strainer size (30-10µm) and centrifuged for 5min at 1,000g. The pellet was re-suspended in 25μl PBS 0.5% BSA with 0.4U/μl RNAse inhibitors. The 2 pellets were combined 1:4 (filtered : debris removed, respectively) for further 10x loading.
Single nuclei preparation for 10x loading
25μl of wash buffer (10mM TrisHCl, 10mM NaCl, 3mM MgCl2, 0.005% NP40) with 0.2U/μl RNAse inhibitors was added to each nuclei suspension, gently mixed and incubated for 5min on ice. The suspension was centrifuged for 5min at 1,000g and the pellet gently re-suspended in PBS 2% BSA 0.2U/μl RNAse Inhibitors. For quantification, the nuclei were stained with Hoechst (5μg/ml) and counted in a hemocytometer. A total of 8,000 estimated nuclei for each sample was loaded on the 10x MicroChip, although a much lower number of nuclei was recovered after sequencing (Supplementary Table 2).
cDNA library preparation
cDNA libraries have been prepared using the Chromium Single Cell 3’ Library and Gel Bead kit v2 (120267) according to the manufacturer’s instructions.
MS patients and Control samples preprocessing and clustering
The 20 samples were aligned with Cellranger -version (2.1.1) with reference genome GRCh38-1.2.0. Then, each of the output filtered UMI count matrixes was used as input for Velocyto25 with the parameters, velocyto run10x -m repeatMasker_filtered_UMI_count_matrixes GRCh38-1.2.0_genes.gtf. The repeatmasker track was download from UCSC tables. Velocyto only considers uniquely mapped reads from cellranger output UMI matrixes and reads that align to both exonic regions and intronic regions. The new UMI count matrices were exported from loom file format to R object format with Velocyto25 R package. For each of the samples, we combined the spliced and unspliced count matrices to get a matrix of 33692 genes across 35753 cells. This final aggregate UMI matrices were used for all the downstream analyses. We checked quality metrics and removed cells with less than 200 genes and a total count below 500 and genes with a count above 1 in at least 3 cells.
The following data processing was carried out with Seurat7 (version 2.1). For each of the 20 samples, first we set up a first filter of min.cells = 3 and min.genes = 200 per sample, filtered by number of UMI (>6000), genes (<200) and mitochondrial percentage (>0.20). The distribution for gene, UMI and reads mapped to mitochondrial genome were visually inspected and used for quality assurance. Post-processed matrices were then log-normalized individually with a scale of factor of 10,000, followed by regressing inter-cellular variation in gene expression by UMI counts and batch number, and scaling of the gene expression. Highly variable genes (HVG) were set up as the union from the top 1000 HVG from each sample, resulting in 4361 genes.
After quality filtering, 17799 nuclei and 21581 genes remained. Shared-nearest neighbor (SNN) graph was constructed on cell-to-cell distance matrix from top 15 aligned canonical correlation vectors. The SNN graph with different resolution was used as an input for smart local moving (SLM) algorithm to obtain cell clusters, and visualized with t-Distributed Stochastic neighbor Embedding (tSNE). We performed the analysis in three different resolutions 0.8, 2 and 4. Based on differential expressed genes, identified by Wilcoxon rank sum test, with parameters min.pct = 0.25, thresh.use = 0.25, test.use = "wilcox” 7., we manually assigned and verified the consistency of the three different resolutions (Extended data Figure 2). Based on prior knowledge and consistency within different resolutions we selected the final number of cluster between the resolutions 2 and 4, which included all the major cell types in the brain a novel cell types26, resulting in 23 different clusters.
Oligodendrocyte cell type assignment
The CC alignment applied for the Control and MS combined analysis minimized inter-sample variability to reduce possible batch effects, due to the individual variability or technical performance leading to intermingled comparable clusters that contained MS and Control nuclei. First, oligodendrocyte lineage cell types were identified based on canonical and novel markers3 from differential expression analysis. In order to verify cell identity, the expression patterns distributions were used in the different Oligo subclusters, and then verified in as separate based on the markers. In addition, evidence from mouse single cell data26 has shown OLs with an immunological phenotype in a mouse model of experimental autoimmune encephalomyelitis (EAE). The combination of different resolutions allowed us to identify OLs expressing immune genes in the human dataset (ImOLG).
In order to verify the subcluster identity and possible over or under clustering, a classification hierarchy was built. This approach places transcriptionally similar clusters close to each other on a tree allowing us to finally define the 6 Oligo clusters, the OPCs, the COPs and the ImOlGs as different separate clusters that were later validated with specific markers.
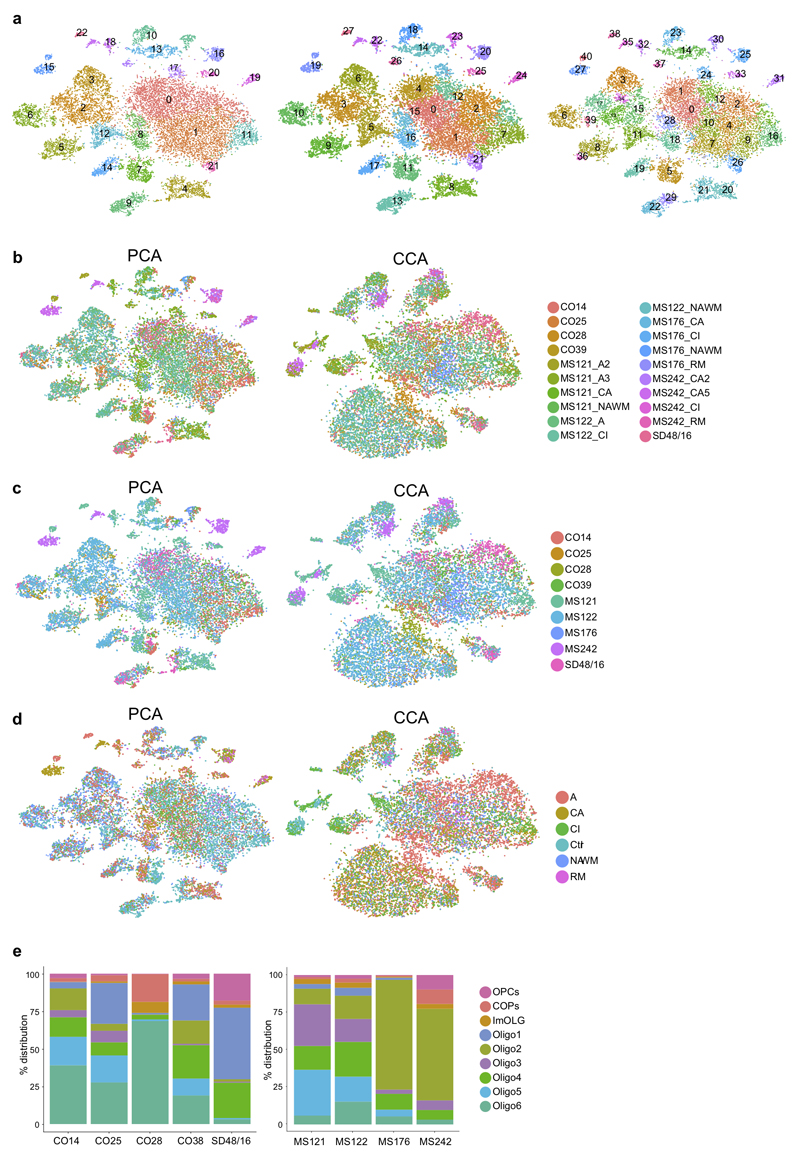
Dimensional reduction with principal component analysis (PCA), followed by regressing out each of the sample variables, showed segregation of clusters based on patient identity (Extended Fig.7), suggestive of batch effects and individual variability. Thus, we performed CCA, considering all the individual samples as a variable and using the union of the top variable genes from each of the samples, in order to get common but also specific variable genes from all samples and discarding cells with higher than 0.5 PCA/CCA variance. CCA allows the alignment of all samples to a common low dimensional subspace followed by clustering7, showing that nuclei cluster more according to cell type rather than sample identity (Fig.1a and Extended Fig.3).
Comparison of human and mouse oligodendroglia
The normalized expression matrix from Falcao et al.26 was retrieved and mouse mm10 Genesymbol IDs were extracted and combined with GRCh38 ENSEMBL geneIDs from Biomart27. We recovered a final matrix with unique GRCh38 gene symbols renamed from mm10. For the comparison analysis we combined in a single matrix the 6 Oligo clusters, OPCs, COPs and ImOlGs from human with the EAE mouse renamed matrix cells. Both datasets included only oligodendrocyte lineage cell clusters that combined MS, or EAE in mouse, and controls. The combined 900 most variable genes as described in 28 from all the mouse and human OLs were used to classify the celltypes. The datasets similarity analysis was performed with an unsupervised classifying approach to find the most similar cell types, using as a training and testing both datasets and with a top hits threshold of >= 0.7 mean area under the receiver operator characteristic curve (AUROC)28 score.
Integration of different human single nuclear-RNAseq datasets
Published datasets pre-processing
UMI count matrices from human cerebellar hemisphere (CH) (24580 genes, 5204 cells), frontal cortex (FC) (24654 genes, 10319 cells) and visual cortex (VC) (32693 genes,1386 cells) were retrieved from GEO (GSE97930), and pre-processed independently. First, cells that had no annotation were discarded (1 cell from frontal cortex UMI count matrix). We performed a quality control procedure as described above. Cells with a number of genes > 3100 (CH, FC and VC) and <350 (FC and VC) and number of UMI >5600 (CH, FC and VC) were considered as low quality or outliers, and were thereafter removed from downstream analysis. After quality controls, 5199, 9557 and 18645 cells remained (CH, FC and VC). Post-processed matrices were then log-normalized individually with a scale of factor of 10,000, followed by regressing inter-cellular variation in gene expression by UMI counts and batch number, and scaling of the gene expression. Canonical correlation analysis7 each region. The first 17 canonical correlation components (CCs) were chosen. There were 465 cells in the 17 CCs with PCA/CCA variance more than 0.5, and thus were considered regional/batch specific and removed for following dataset alignment. After aligning regional expression in the first 17 CCs, clustering, visualization and OLs sub-setting were performed.
UMI count matrices of human archived brain samples were retrieved from https://portals.broadinstitute.org/single_cell/study/dronc-seq-single-nucleus-rna-seq-on-human-archived-brain#study-summary. Hippocampus (HIP) (10326 genes, 5433 cells) and Prefrontal cortex (PFC) (10326 genes, 9530 cells) expression matrices were separated and underwent quality control. Cells with a number of genes > 4000 and < 400 (PFC) and <350 (HIP), number of UMI >7500 (PFC and HIP), and mitochondrial percentage < 0.05 (PFC) and > 0.15 (HIP) were considered as low quality or outliers and were thereafter removed from downstream analysis. 6062 PFC cells and 4765 HIP cells remained. Each regional dataset was then log-normalized with a scale of factor of 10,000, followed by regressing inter-cellular variation in gene expression by UMI counts and mitochondrial percentage, and scaling of the gene expression. Highly variable genes were identified as with the Lake dataset, but with the high end cut off of 4 for average expression, and a union of 1521 variable genes was used for canonical correlation analysis. CCA/PCA variance, dataset low dimensional subspace alignments, followed by clustering and OLs linkage sub-setting were performed as above with the first 11 CCs with 9702 cells in total after discarding cells with higher than 0.5 PCA/CCA variance.
Dataset integration
Oligodendroglial subsets from our Controls, Lake et al. and Habib et al. datasets29,30. were combined by performing a canonical component analysis with the union of top 1000 highly variable genes from each dataset, and then 11 CCs were aligned after discarding data specific cells. Differentially expressed genes that were conserved among the datasets were identified by first performing individual within-dataset Wilcoxon rank sum tests, followed by ranking genes according to a unified combined Fisher’s p-values. The resulting clusters were found under resolution 1.0.
Clustering based on PCA
Seurat2.1 was also used for PCA of the 20 MS and Control samples. The filtered expression matrix, as described before, was log-normalized with a scale factor of 10000, scaled and regressed on number of UMI and sample ID. PCA was run on highly variable genes, which was identified as previously described. 15 PCs were used and the HNN graph was constructed based on the Euclidean distance in PCA space, where the clusters were then identified using Louvain algorithm. The clusters were visualized using t-SNE. Clustering was run in three different resolutions, 0.8, 2 and 4, in order to be comparable with the clusters obtained with the CCA.
Spatial gene-filtering and pseudo-ordering
Cells were ordered, and lineages were approximated using a previously published pipeline31. In short, single nuclei were filtered so that each nucleus contained at least 500 UMI counts, and at least 400 genes. We then used spatially correlating gene selection on the diffusion mapping32 obtained transition matrix. Subsequently, we reduced the high-dimensional space using non-negative matrix factorization33, of which the ideal ranks are estimated using a measure of mutual information across the obtained components. The selected rank was obtained by selecting the rank number for which the calculated joined mutual information no longer highly decreases upon increasing rank. The non-negative matrix is then transformed in a transition space using diffusion mapping for which then lineages are calculated. Please see our github page Castelo-Branco-lab/GeneFocus for recent code.
Differential expression analysis between MS Lesions and Control
For differential expression analysis MAST was used34. All oligodendrocyte lineage cells were included in the analysis. An FDR of 0.05 was taken, and genes were selected with a log fold change of at least 5 to be included in the plot in Fig 4a. Proportional expression was calculated by taking the mean expression value of the cells, leading to a heavily 0 biased threshold. Cells expressing higher than this threshold are considered to be expressing cells, the proportion of expressing cells was then calculated on a per gene basis.
Gene ontology analysis
For the GO analyses, the most significantly differentially expressed genes from the snRNA-seq experiment of each OL subcluster were selected (adjusted p-val ≤0.05, log fold change ≥0.5). GO and pathway analysis was performed with the ClueGO (version 2.5.2) plug-in Cytoscape (version 3.7.0)35 with settings, GO Biological process (04.09.2018) and REACTOME pathways (04.09.2018), showing only pathways with p-val <= 0.05. Default settings and GO fusion were used, for subclusters with more than 200 significantly regulated genes (OPCs and COPs) a minimum of 7 genes per cluster were used, for sublusters less than 50 significantly regulated genes (Oligo4 and Oligo2) a minimum of 2 genes per cluster, for all other subclusters, a minimum of 5 genes per cluster were used.
Immunohistochemistry
4μm FFPE sections were deparaffinized in decreasing EtOH concentrations and antigen retrieval was performed in antigen unmasking solution (Vector laboratories, H-3300) for 10min. For colorimetric labelling, sections were washed in PBS, blocked for 30min at RT with PBS 0.5% Triton (PBS-T) 10% heat inactivated horse serum (HIHS, blocking buffer). Primary antibody incubation was performed overnight a 4°C in blocking buffer. Sections were washed in PBS and incubated with a horseradish peroxidase (HRP)- or alkaline phosphatase (AP)-labelled secondary antibody according to the respective species for 2hrs at RT. Color reaction was performed using DAB or VectorBlue reaction kits (Vector laboratories, SK-4100 and SK-5300 respectively). Sections were washed and mounted. For fluorescent labelling, deparaffinized sections were incubated with autofluorescence eliminator reagent (Millipore, 2160) for 1min and washed with TBS 0.001% TritonX (wash buffer). Endogenous peroxidases were quenched with 3% H2O2 for 15min at RT, washed and blocked for 30min at RT with TBS 0.5% Triton (TBS-T) 10% HIHS (blocking buffer 2). Primary antibody incubation was performed overnight a 4°C in blocking buffer 2. Fluorophore reaction was performed using thyramide reaction kits for fluorescein, Cyanine 3 and Cyanine 5 (Perkin Elmer, NEL741B001KT, NEL744B001KT, NEL745B001KT respectively). Sections were counterstained using Hoechst (1:1000, Thermo Fisher, 62249), washed and mounted. The following primary antibodies were used: rabbit (rb)-Olig2 (Atlas, HPA003254, 1:100), goat (gt)-Olig2 (R&D Systems, AF2418, 1:100), rb-Olig1 (Abcam, ab68105, 1:100), rb-Mrf (Millipore, ABN45, 1:100), rb-Opalin (Abcam, ab121425, 1:100), rb-Sox6(Millipore, AB5805, 1:100) and gt-KLK6 (Life Technologies, PA547239, 1:100). The specificity of our MRF antibody was validated by Western Blot as well as a combination of mRNA and protein-labelling in our tissue (Extended Fig. 7). The following secondary antibodies were used: Vector laboratories, rb-HRP IgG (MP-7401), rb-AP IgG (MP-5401), gt-HRP (MP-7405), ms-HRP IgG (MP-7402), ms-AP IgG (MP-5402).
BaseScope mRNA detection
BaseScope mRNA detection was performed according to the manual using the RNAScope pretreatment and wash buffer reagents (ACD, 322380 and 310091 respectively) and BaseScope Red and BaseScope duplex detection kits (ACD, 322910 and 3223810, respectively). 4μm FFPE sections were deparaffinized 2x 5min in Xylene and 2x 2min in EtOH. Sections were dried and incubated with H2O2 for 10min. Pretreatment was performed for 45min with pretreatment buffer, incubated for 3min in EtOH and dried overnight. Protease treatment was performed using proteaseIV for 1hr at 40°C, the protease was refreshed after 15min. Sections were washed in deionized water and probes were incubated for 2hrs at 40°C. Sections were washed in wash buffer and color reaction was performed according to the user manual with the following adjustments: for the single BaseScope detection, the AMP5 step was increased to 45min. For the duplex assay the steps Amp7 and Amp11 were increased to 1hr. All the probes have been designed and produced by Advanced Cell Diagnostics. Probes against the following human genes were used: Channel 1 probes: BREVICAN, CDH20, WWOX, KLK6, CLDND1, OPALIN. Channel2 probes: LURAPL1.AS1 and CDH20. For the single assay, subsequent IHC was performed as described above. For the duplex assay, sections were counterstained for 1min with Hematoxilin (Scientific Laboratories, GHS132-1L) and blue reaction was performed using 0.02% ammonia water. Sections were dried at 60°C and mounted.
Image analysis
Brightfield images have been acquired using a Widefield observer (Zeiss) inverted microscope and a Vectra Polaris (Perkin Elmer) slide scanner. Fluorescent images (z-stacks) have been acquired using a confocal microscope (Leica TCS SP8). Image analysis has been performed using open source Fiji36 and QuPath37 imaging software. For cell quantification of fluorescent images and brightfield images where no automated quantification was possible, a minimum of 8 randomly chosen regions of equal dimensions per patient and region have been acquired. Total cell numbers/mm2 have been calculated based on the picture dimensions. For fluorescent images, z-stacks have been collapsed to a maximum intensity projection and the number of cells has been quantified using the Fiji cell counter plugin. For quantification of the single channel brightfield images and the BaseScope IHC double positive images, the number of cells also have been quantified using the Fiji cell counter plugin. The average of these different regions has been taken and is considered as n=1. Where possible, brightfield images have been quantified automated. Therefore, whole slides have been scanned using a slide scanner. Using QuPath, a minimum of 4 random regions per sample and condition have been annotated and cells within these regions have been quantified using the automated ‘positive cell detection’ plugin.
For the quantification of the duplex BaseScope, random brightfield images have been acquired in the WM of Ctr donors. All cells having any positive BaseScope signal have been quantified and represent 100% of labelled cells, the % of single- or double positive cells have been determined.
For the quantification of the mRNA-expression differences between MS lesions, whole sections were scanned with a slide scanner. Lesioned regions were highlighted by the absence of CNP IHC. Within these regions, between 4 and 11 random regions of equal size have been annotated using QuPath and the number of BaseScope-positive dots have been quantified. The average of the random regions within 1 lesioned area were considered as n=1.
Western Blot
Fresh frozen human brain sections (10µm) were lysed in RIPA buffer (Thermo Scientific 89900), sonicated, centrifuged for 10min at 13,000g and the supernatant collected. 10µl of supernatant per lane was diluted in RIPA and Laemmli-buffer and incubated for 5min at 96°C. Proteins were separated on an SDS-gel (Bio-Rad #161-1176) together with a protein ladder (Bio-Rad kaleidoscope standard #161-0375). Proteins were blotted on a PVDF membrane in a wet blotting chamber with transfer buffer (1xTris-Glycine buffer, 20% MeOH) (2hrs @400mA). Membrane was washed with 1x TBS 0.01% Tween (TBS-T) and blocked for 1hr with TBS-T, 5% milk. The primary antibody (rb-MRF, Millipore, ABN45, 1:500) was incubated in blocking buffer over night at 4°C. The membrane was washed and secondary antibody (anti-rb HRP, Vector laboratories MP-7401,1:10,000) was incubated for 1hr at RT in blocking buffer. The membrane was washed and incubated for 5min with ECL solution (Thermo Scientific 1863031). Proteins were visualized using x-ray film.
Statistics
Statistical analysis has been performed using GraphPad Prism 7. In Fig.1g n represents the number of biologically independent persons. We used n=4 for LURAP1L.AS1+CDH20+, n=3 for the other combinations of OL subclass markers. No statistics applied. In Fig.3a n represents the number of different (i.e. biologically independent) donors. We used n=5 Ctr and n=9 MS patients. Hematoxylin: One-way ANOVA, F(2,20)=34.8, p<0.0001, Tukey’s multiple comparison test: Ctr WM vs. NAWM: p=0.7445, Ctr WM vs. Lesions: p<0.0001, NAWM vs. Lesions: p<0.0001. OLIG2/mm2: One-way ANOVA, F(2,20)=11.3, p=0.0005, Tukey’s multiple comparison test: Ctr WM vs. NAWM: p=0.6298, Ctr WM vs. Lesions: p=0.0013, NAWM vs. Lesions: p=0.0029. OLIG2%: One-way ANOVA, F(2,20)=3.553, p=0.0478, Tukey’s multiple comparison test: Ctr WM vs. NAWM: p=0.9687, Ctr WM vs. Lesions: p=0.1707, NAWM vs. Lesions: p=0.0523. In Fig.3b (SOX6) n represents the number of different donors. We used n=4 Ctr and n=5 NAWM and lesions. One-way ANOVA, F(2,11)=50.42, p<0.0001, Tukey’s multiple comparison test: Ctr WM vs. NAWM: p=0.0032, Ctr WM vs. Lesions: p<0.0001, NAWM vs. Lesions: p=0.0003. For Fig. 3c (OPALIN) we used n=3 for Ctr and n=5 for NAWM and Lesions. One-way ANOVA, F(2,10)=147.9, p<0.0001. Tukey’s multiple comparison test: Ctr WM vs. NAWM: p=0.0002, Ctr WM vs. Lesions: p<0.0001, NAWM vs. Lesions: p<0.0001. In Fig.4e (CDH20 BaseScope) n represents the number of different lesions from separate individuals. We used n=5 for active lesion, n=7 for chronic inactive lesions and n=3 for chronic active lesions in a total of 7 MS patients. One way ANOVA, F(2,12)=5.473, p=0.0205. Tukey’s multiple comparison test: Active vs. chronic inactive lesions: p=0.0214, active vs. chronic active lesions: p=0.8439, chronic inactive vs. chronic active lesions: p=0.1368. For Extended Fig.4b-e we used n=3 different donors to validate the co-labeling of each marker. For Extended Fig.4g (OPALIN bins) we used n=3 different donors for each group. One-way ANOVA, F(2,6)=73.89, p<0.0001. Tukey’s multiple comparison test: Ctr WM vs. NAWM: p=0.0007, Ctr WM vs. Lesions: p<0.0001, NAWM vs. Lesions: p=0.0093. In Extended Fig. 8a (BCAN) n represents the number of different donors. We used n=4 Ctr, n=6 NAWM and n=5 Lesions. One-way ANOVA, F(2,12)=38.39, p<0.0001, Tukey’s multiple comparison test: Ctr WM vs. NAWM: p<0.0001, Ctr WM vs. Lesions: p<0.0001, NAWM vs. Lesions: p=0.0634. In Fig. 8b (KLK6) n represents the number of different donors. We used n=4 Ctr and n=5 NAWM and lesions. One-way ANOVA, F(2,11)=6.742, p=0.0123. Tukey’s multiple comparison test: Ctr WM vs. NAWM: p=0.2150, Ctr WM vs. Lesions: p=0.2621, NAWM vs. Lesions: p=0.0095. In Extended Fig.8d (MYRF) n represents the number of different donors. We used n=6 Ctr and NAWM and n=7 lesions. One-way ANOVA, F(2,16)=44.63, p<0.0001. Tukey’s multiple comparison test: Ctr WM vs. NAWM: p=0.0015, Ctr WM vs. Lesions: p<0.0001, NAWM vs. Lesions: p=0.0004. For Extended Fig.9a, the individual number of quantified mRNA molecules per field per patient (n=7) are shown. We used the following number of fields: MS235: n=10 for A and CI lesions, MS200: n=4 for A, CI and CA lesions, MS249: n=4 for A and n=8 for CI lesions, MS361: n=7 for A and n=10 for CI lesions, MS106: n=11 for CA and CI lesions, MS161: n=6 for CA and n=10 for CI lesions, MS300: n=7 for A and n=10 for CI lesions. No statistics applied. For Extended Fig.9b (WWOX) n represents the number of different lesions from separate individuals. we used n=2 active lesions, n=5 chronic inactive lesions and n=4 chronic active lesions in a total of 5 MS patients. No statistics applied. For Extended Fig.9c, the individual number of quantified mRNA molecules per field per patient (n=5) are shown. We used the following number of fields: MS245: n=8 for A, n=10 for CI and n=9 for CA lesions, MS361: n=6 for A and n=10 for CI lesions, MS101: n=6 for CI and n=11 for CA lesions, MS161: n=10 for CI and n=7 for CA lesions, MS296: n=11 for CA and n=6 for CI lesions. No statistics applied.
Extended Data
Extended Figure1. Single nuclei RNA-seq of human post-mortem brain tissue.
a, Schematic overview of the methodology and workflow used to isolate single nuclei from human white matter and RNA-seq using Chromium 10x Genomics and Illumina NGS (scheme was created with BioRender). b, Luxol Fast Blue (LFB) staining of human control (Ctr, left) and Multiple Sclerosis (MS, right) brain sections used for the experiment; WM is outlined with a dotted line. MS brains were divided into normal appearing white matter (NAWM) (1) and different lesion types (2-4). c, Violin Plots of additional markers enriched in specific OL subpopulations showing normalized gene expression (nOPC=352, nCOP=242, ImOLG=207, nOligo1=1129, nOligo2=1839, nOligo3=775, nOligo4=1579, nOligo5=1167, nOligo6=1484). Violin plots are centered around the median with interquartile ranges, with shape representing cell distribution. d, Double in-situ hybridization (ISH, BaseScope) of human Ctr WM counterstained with Hematoxylin. e, Correlation between RIN values and number of genes per nucleus or number of cells recovered in individual samples. f, Quality control parameters of different human brain OLs snRNA-seq datasets showing the individual number of genes (top) and number of UMI (bottom) per cell (n=1161 cells from Habib et al 2017, n=3998 Ctr nuclei from this dataset and n=4873 nuclei from Lake et al. 2018). g, tSNE projections of known cellular markers for the identification of all brain cell clusters in Ctr samples (n=6591 nuclei).
Extended Figure2. Quality control of snRNA-seq dataset reveals similar depth to previous datasets, and combination with other human brain snRNA-seq datasets identifies Oligo6 as an intermediate OL state.
a, tSNEs representing OL lineage clusters when performing clustering analysis with the combination of the three datasets (left) and assigning cell identity according to the clusters identified in Fig.1 (right, in brackets, the numerical cluster identity with the dataset combination, as indicated in the left tSNE) (n= number of nuclei, nCluster0=1445, nCluster1=1406, nCluster2=1355, nCluster3=1299, nCluster4=1150, nCluster5=1068, nCluster6=828, nCluster7=605, nCluster8=59, nCluster9=250, nCluster10=28). b, tSNEs indicating the cell origin when combining the current snRNA-seq dataset with Habib et al., 2017 and Lake et al., 2018 snRNA-seq datasets sorted by different individuals (top), different datasets (middle) and different regions (bottom) (n=9493 nuclei). c-d, Heatmaps representing expression of genes associated with intermediate states across the oligodendroglial lineage (as defined by Lake et al., 2018) at a cluster (c) and individual cell (d) level. e, Frequency distribution of identified oligodendroglia between different datasets.
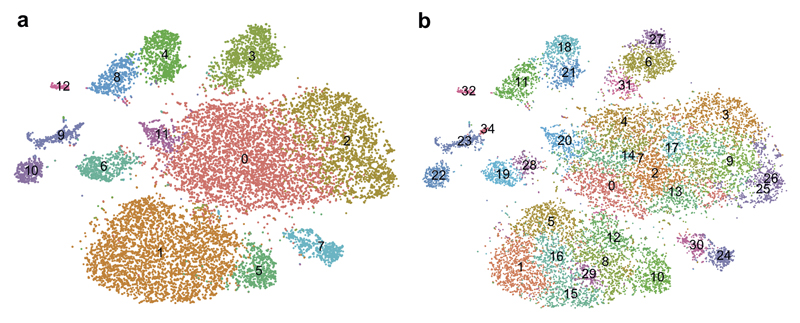
Extended Figure3. Seurat2 CCA clustering of snRNA-seq dataset at different clustering resolutions.
Seurat clustering at a lower (a) and higher resolution (b) than the clustering resolution in Fig.1 (n=17799 nuclei derived from 5 Ctr and 4 MS patients).
Extended Figure4. Validation of novel OL sub-cluster markers and regional OL subpopulation distribution in human Ctr brain.
a, Violin plots showing SOX6, RTN4 (NOGOA) and OLIG2 normalized expression counts in different OL subpopulations (n=number of nuclei in Ctr nOPC=273, nCOP=153, ImOLG=81, nOligo1=952, nOligo2=388, nOligo3=82, nOligo4=724, nOligo5=393, nOligo6=991). Violin plots are centered around the median with interquartile ranges, with shape representing cell distribution. b, Colocalization of SOX6 and OLIG2 as a marker for OPCs (scale bar: 20µm). c, Colocalization of OPALIN and OLIG2 as a marker for Oligo6 (scale bar: 20µm). d, Colocalization of KLK6 and OLIG1/2 as a marker for Oligo5. e, Colocalization of SOX6, NOGOA and OLIG2. SOX6+OLIG2+NOGOA- cells (upper panel) are OPCs, NOGOA+OLIG2+SOX6- cells are mature OL (scale bar: 10µm). f, OPALIN staining of a Ctr brain section (scale bars: 5mm, inlay: 300µm). g, OPALIN+ Oligo6 in different bins of 300µm increments from the GM/WM border (scale bar:50µm, n=3 different Ctr and MS individuals with NAWM and lesions, ANOVA, data are displayed as mean ± SEM). h, Combined OPALIN and KLK6 staining of another human Ctr brain block (scale bar: 5mm, inlays: 50µm). In b-e experiments were independently performed in 2 batches. i, Validation of novel OL mRNA markers in combination with OLIG1/2 IHC. BCAN (top left), CLDND1 (top right), KLK6 (bottom left) and CDH20 (bottom right). Red arrowheads: marker+/OLIG1/2+ OL, blue arrowhead: marker-/OLIG1/2+ OL (scale bars: 10µm).
Extended Figure5. Comparison of human Ctr and MS OL snRNA-seq and mouse EAE oligodendroglia scRNA-seq datasets shows similarities and differences in OL heterogeneity.
Heatmap of the mean AUROC values (see methods), from the unsupervised classification, of cell type to cell type comparison between human (current dataset) and mouse oligodendroglia (Falcao et al, 2018).
Extended Figure6. Gene Ontology analysis reveals functional differences between human OL sub-clusters.
The most significantly differentially expressed genes from the snRNA-seq experiment of each OL sub-cluster were selected and Gene Ontology and pathway analysis was performed with the ClueGO plug-in in Cytoscape on each individual cluster. Individual donut charts present the percentage of found genes associated with the term and depict the most significant biological categories.
Extended Figure7. Clustering of snRNA-seq dataset by different origins.
a, tSNEs representing human Ctr and MS WM nuclei after dimensionality reduction with principal component analysis (PCA) at different resolutions. b-d, Clustering of snRNA-seq datasets by sample after dimensionality reduction with PCA (left) and canonical component analysis (CCA, right), highlighting Ctr/MS individual and lesion type combined (b), Ctr/MS individual (c) and lesion type (d) separately. e, Frequency distributions of OL sub-clusters by Ctr (left) and MS (right) individuals. (n=17799 cells derived from 5 Ctr and 4 MS patients).
Extended Figure8. Validation of skewed MS heterogeneity and OL gene expression profiling in Ctr and NAWM.
a, Validation of BCAN-expressing OPCs in combination with OLIG1/2 IHC. Red arrowhead: BCAN+/OLIG1/2+ OPC, blue arrowhead: BCAN-/OLIG1/2+ OL (scale bar: 20µm) and tSNE overlay of BCAN expression in the snRNA-seq dataset in Ctr and MS, (scale bar: 20µm, data displayed as mean±SEM, n=4 samples from different control individuals, n=6 NAWM samples and n=5 MS lesion samples from different MS patients, ANOVA. b, KLK6-expressing OL in Ctr WM, NAWM and MS lesions (scale bar: 50µm, data displayed as mean±SEM, n=4 samples from different Ctr individuals and n=5 different MS individuals, ANOVA) and tSNE overlay of KLK6 expression in the Ctr and MS snRNA-seq dataset. c, Violin plots showing the normalized expression counts of genes enriched in ImOLG in the snRNA-seq dataset (nOPC=352, nCOP=242, nImOLG=207, nOligo1=1129, nOligo2=1839, nOligo3=775, nOligo4=1579, nOligo5=1167, nOligo6=1484). Violin plots are centered around the median with interquartile ranges, with shape representing cell distribution. d, MRF IHC in Ctr WM, NAWM and MS lesions (scale bar: 50µm, data displayed as mean±SEM, n=6 samples from different control individuals, and n=7 different MS patients, ANOVA) and tSNE overlay of MYRF expression in the snRNA-seq dataset. e, tSNE overlay of MBP expression in the Ctr and the MS snRNA-seq dataset (n=4037 OL in Ctr and n=4737 OL in MS). f, Western blot of the MYRF antibody on human brain lysate to validate the specificity of the antibody. For gel source data, see Supporting Fig.1 g, Combination of MYRF mRNA and protein labeling to confirm the specificity of the MYRF antibody in Ctr WM (scale bar: 10µm). h, Heatmaps representing the average gene expression of a subset of genes, including myelin-related genes, in Ctr vs. MS samples in OPCs (Ctr.vs. MS and Ctr. vs. NAWM) and mature OLs (Ctr vs. NAWM). a-b,d: each experiment was performed in 2 (3 for d) independent batches and p-values are only displayed compared to Ctr.; f,g: each experiment was performed twice on independent samples.
Extended Figure9. Validations of altered OL heterogeneity in MS and mRNA expression differences in lesions.
a, Quantification of BaseScope in-situ hybridization of CDH20 (mRNA) in individual MS patients (corresponds to Fig. 4c) shows an enrichment in chronic inactive lesions in each individual (n= individual number of quantified fields per patient (n=7): MS235: n=10 for A and CI lesions, MS200: n=4 for A, CI and CA lesions, MS249: n=4 for A and n=8 for CI lesions, MS361: n=7 for A and n=10 for CI lesions, MS106: n=11 for CA and CI lesions, MS161: n=6 for CA and n=10 for CI lesions, MS300: n=7 for A and n=10 for CI lesions, data displayed as mean ± SEM). b-c, BaseScope in-situ hybridization of WWOX (mRNA) shows depletion of detected mRNA in CA lesions on average (b) and in individual MS patients (c) (scale bars: 2mm, 20µm, b: n=2 for active lesions and n=4 for chronic inactive and chronic active lesions, data displayed as mean ± SEM, ANOVA, c: dots display the individual number of quantified fields per patient (n=5), MS245: n=8 for A, n=10 for CI and n=9 for CA lesions, MS361: n=6 for A and n=10 for CI lesions, MS101: n=6 for CI and n=11 for CA lesions, MS161: n=10 for CI and n=7 for CA lesions, MS296: n=11 for CA and n=6 for CI lesions, data displayed as mean ± SEM). d, Dotplot of the total normalized RNA UMI counts found within the lesions, NAWM and controls, where both size and color indicate z-scores blue and large: low; red and large: high; small: intermediate). e, Density histograms showing the difference in distribution of normalized counts observed between control and remyelinated lesions.
Supplementary Material
Supplementary Information is linked to the online version of the paper at www.nature.com/nature.
Acknowledgements
We thank the MS Society UK Tissue Bank and the MRC Sudden Death and MS brain banks for post-mortem brain tissue, ACD for their help with BaseScope, Tony Jimenez-Beristain, Alessandra Nanni and Ahmad Moshref for support, Eukaryotic Single Cell Genomics Facility (ESCGF) at Science for Life Laboratory, Leif Wigge (Wallenberg Advanced Bioinformatics Infrastructure (WABI) Long Term Bioinformatic Support at SciLifeLab) and the National Genomics Infrastructure for providing assistance with snRNA-Seq and Bertrand Vernay, Eoghan O’Duibhir and Matthieu Vermeren (CRM) for imaging support. The bioinformatics computations were performed at Swedish National Infrastructure for Computing (SNIC) at UPPMAX, Uppsala University. Funding: SJ: European Union, Horizon 2020, Marie-Skłodowska Curie Actions EC ref.no. 789492); Cf-C: Wellcome Trust Investigator award; AW: UK Multiple Sclerosis Society, F. Hoffmann – La Roche, Ltd; EA: European Union, Horizon 2020, Marie-Skłodowska Curie Actions, grant SOLO no.794689; AMF: European Committee for Treatment and Research of Multiple Sclerosis; GC-B: European Union Horizon 2020/European Research Council Consolidator Grant EPIScOPE no.681893, Swedish Research Council (no.2015-03558), Swedish Brain Foundation (no.FO2017-0075), Swedish Cancer Society (Cancerfonden, CAN2016/555), Stockholm City Council (grant 20170397), Ming Wai Lau Centre for Reparative Medicine, F. Hoffmann – La Roche, Ltd.
Footnotes
Code availability
All source code and notebooks can be found at the github page “https://github.com/Castelo-Branco-lab/Jaekel_Agirre_et_al_2018”.
Author contributions: SJ, EA, AMF, IK, DM, CFC, AW and GCB designed all experiments. SJ and AMF performed snRNA-seq sample-prep, together with ESCGF (see Acknowledgements), and DM performed sequencing after snRNA sample-prep. EA, DvB and KWL performed the computational analysis of the snRNA-seq data; SJ performed validation experiments, with assistance of AW and IK; SJ, EA, CFC, AW, and GCB wrote the manuscript with input from the co-authors. CFC, AW and GCB oversaw all aspects of the study.
Author information: Reprints and permissions information is available at www.nature.com/reprints.
The authors declare competing financial interests. DM and IK are employees at F. Hoffmann – La Roche, Ltd.
Data Availability: Sequence data has been deposited at the European Genome-phenome Archive (EGA), which is hosted by the EBI and the CRG, under accession number EGAS00001003412. Further information about EGA can be found on https://ega-archive.org and "The European Genome-phenome Archive of human data consented for biomedical research: http://www.nature.com/ng/journal/v47/n7/full/ng.3312.html.
A web resource for snRNA-Seq can be accessed at https://ki.se/en/mbb/oligointernode. UMI expression and cell type annotation tables have been deposited in GEO, accession number GSE118257. Source code notebooks are available at https://github.com/Castelo-Branco-lab/Jaekel_Agirre_et_al_2018. Expression and annotation tables are available at https://ki.se/en/mbb/oligointernode.
References
- 1.Bodini B, et al. Dynamic Imaging of Individual Remyelination Profiles in Multiple Sclerosis. Ann Neurol. 2016;79:726–738. doi: 10.1002/ana.24620. [DOI] [PMC free article] [PubMed] [Google Scholar]
- 2.Bechler ME, Byrne L, Ffrench-Constant C. CNS Myelin Sheath Lengths Are an Intrinsic Property of Oligodendrocytes. Curr Biol. 2015;25:2411–2416. doi: 10.1016/j.cub.2015.07.056. [DOI] [PMC free article] [PubMed] [Google Scholar]
- 3.Marques S, et al. Oligodendrocyte heterogeneity in the mouse juvenile and adult central nervous system. Science. 2016;352:1326–1329. doi: 10.1126/science.aaf6463. [DOI] [PMC free article] [PubMed] [Google Scholar]
- 4.Falcão AM, et al. Disease-specific oligodendrocyte lineage cells arise in multiple sclerosis. Nature Medicine. 2018 doi: 10.1038/s41591-018-0236-y. [DOI] [PMC free article] [PubMed] [Google Scholar]
- 5.Zheng GX, et al. Massively parallel digital transcriptional profiling of single cells. Nat Commun. 2017;8:14049. doi: 10.1038/ncomms14049. [DOI] [PMC free article] [PubMed] [Google Scholar]
- 6.Lassmann H, Raine CS, Antel J, Prineas JW. Immunopathology of multiple sclerosis: report on an international meeting held at the Institute of Neurology of the University of Vienna. Journal of neuroimmunology. 1998;86:213–217. doi: 10.1016/s0165-5728(98)00031-9. [DOI] [PubMed] [Google Scholar]
- 7.Butler A, Hoffman P, Smibert P, Papalexi E, Satija R. Integrating single-cell transcriptomic data across different conditions, technologies, and species. Nat Biotechnol. 2018 doi: 10.1038/nbt.4096. [DOI] [PMC free article] [PubMed] [Google Scholar]
- 8.Cui QL, et al. Oligodendrocyte progenitor cell susceptibility to injury in multiple sclerosis. Am J Pathol. 2013;183:516–525. doi: 10.1016/j.ajpath.2013.04.016. [DOI] [PubMed] [Google Scholar]
- 9.Lake BB, et al. Integrative single-cell analysis of transcriptional and epigenetic states in the human adult brain. Nat Biotechnol. 2018;36:70–80. doi: 10.1038/nbt.4038. [DOI] [PMC free article] [PubMed] [Google Scholar]
- 10.Habib N, et al. Massively parallel single-nucleus RNA-seq with DroNc-seq. Nat Methods. 2017 doi: 10.1038/nmeth.4407. [DOI] [PMC free article] [PubMed] [Google Scholar]
- 11.Marques S, et al. Transcriptional Convergence of Oligodendrocyte Lineage Progenitors during Development. Dev Cell. 2018;46:504–517 e507. doi: 10.1016/j.devcel.2018.07.005. [DOI] [PMC free article] [PubMed] [Google Scholar]
- 12.Lock C, et al. Gene-microarray analysis of multiple sclerosis lesions yields new targets validated in autoimmune encephalomyelitis. Nat Med. 2002;8:500–508. doi: 10.1038/nm0502-500. [DOI] [PubMed] [Google Scholar]
- 13.Baranzini SE, et al. Transcriptional analysis of multiple sclerosis brain lesions reveals a complex pattern of cytokine expression. J Immunol. 2000;165:6576–6582. doi: 10.4049/jimmunol.165.11.6576. [DOI] [PubMed] [Google Scholar]
- 14.Chabas D, et al. The influence of the proinflammatory cytokine, osteopontin, on autoimmune demyelinating disease. Science. 2001;294:1731–1735. doi: 10.1126/science.1062960. [DOI] [PubMed] [Google Scholar]
- 15.Zeis T, Howell OW, Reynolds R, Schaeren-Wiemers N. Molecular pathology of Multiple Sclerosis lesions reveals a heterogeneous expression pattern of genes involved in oligodendrogliogenesis. Exp Neurol. 2018;305:76–88. doi: 10.1016/j.expneurol.2018.03.012. [DOI] [PubMed] [Google Scholar]
- 16.Dutta R, Trapp BD. Gene expression profiling in multiple sclerosis brain. Neurobiol Dis. 2012;45:108–114. doi: 10.1016/j.nbd.2010.12.003. [DOI] [PMC free article] [PubMed] [Google Scholar]
- 17.Boyd A, Zhang H, Williams A. Insufficient OPC migration into demyelinated lesions is a cause of poor remyelination in MS and mouse models. Acta neuropathologica. 2013;125:841–859. doi: 10.1007/s00401-013-1112-y. [DOI] [PMC free article] [PubMed] [Google Scholar]
- 18.Chang A, Nishiyama A, Peterson J, Prineas J, Trapp BD. NG2-positive oligodendrocyte progenitor cells in adult human brain and multiple sclerosis lesions. J Neurosci. 2000;20:6404–6412. doi: 10.1523/JNEUROSCI.20-17-06404.2000. [DOI] [PMC free article] [PubMed] [Google Scholar]
- 19.Lucchinetti C, et al. A quantitative analysis of oligodendrocytes in multiple sclerosis lesions. A study of 113 cases. Brain. 1999;122(Pt 12):2279–2295. doi: 10.1093/brain/122.12.2279. [DOI] [PubMed] [Google Scholar]
- 20.de Groot M, et al. Changes in normal-appearing white matter precede development of white matter lesions. Stroke. 2013;44:1037–1042. doi: 10.1161/STROKEAHA.112.680223. [DOI] [PubMed] [Google Scholar]
- 21.Huynh JL, et al. Epigenome-wide differences in pathology-free regions of multiple sclerosis-affected brains. Nat Neurosci. 2014;17:121–130. doi: 10.1038/nn.3588. [DOI] [PMC free article] [PubMed] [Google Scholar]
- 22.MS Y, et al. Remyelination by old oligodendrocytes in multiple sclerosis. Nature. 2018 In Press. [Google Scholar]
- 23.Duncan ID, et al. The adult oligodendrocyte can participate in remyelination. Proc Natl Acad Sci U S A. 2018;115:E11807–E11816. doi: 10.1073/pnas.1808064115. [DOI] [PMC free article] [PubMed] [Google Scholar]
- 24.Hochgerner H, et al. STRT-seq-2i: dual-index 5' single cell and nucleus RNA-seq on an addressable microwell array. Sci Rep. 2017;7:16327. doi: 10.1038/s41598-017-16546-4. [DOI] [PMC free article] [PubMed] [Google Scholar]
- 25.La Manno G, et al. RNA velocity of single cells. Nature. 2018;560:494–498. doi: 10.1038/s41586-018-0414-6. [DOI] [PMC free article] [PubMed] [Google Scholar]
- 26.Falcão AM, et al. Disease-specific oligodendrocyte lineage cells arise in multiple sclerosis. Nature Medicine. 2018 doi: 10.1038/s41591-018-0236-y. [DOI] [PMC free article] [PubMed] [Google Scholar]
- 27.Durinck S, Spellman PT, Birney E, Huber W. Mapping identifiers for the integration of genomic datasets with the R/Bioconductor package biomaRt. Nat Protoc. 2009;4:1184–1191. doi: 10.1038/nprot.2009.97. [DOI] [PMC free article] [PubMed] [Google Scholar]
- 28.Crow M, Paul A, Ballouz S, Huang ZJ, Gillis J. Characterizing the replicability of cell types defined by single cell RNA-sequencing data using MetaNeighbor. Nat Commun. 2018;9:884. doi: 10.1038/s41467-018-03282-0. [DOI] [PMC free article] [PubMed] [Google Scholar]
- 29.Lake BB, et al. Integrative single-cell analysis of transcriptional and epigenetic states in the human adult brain. Nat Biotechnol. 2018;36:70–80. doi: 10.1038/nbt.4038. [DOI] [PMC free article] [PubMed] [Google Scholar]
- 30.Habib N, et al. Massively parallel single-nucleus RNA-seq with DroNc-seq. Nat Methods. 2017 doi: 10.1038/nmeth.4407. [DOI] [PMC free article] [PubMed] [Google Scholar]
- 31.Marques S, et al. Transcriptional Convergence of Oligodendrocyte Lineage Progenitors during Development. Dev Cell. 2018;46:504–517 e507. doi: 10.1016/j.devcel.2018.07.005. [DOI] [PMC free article] [PubMed] [Google Scholar]
- 32.Angerer P, et al. destiny: diffusion maps for large-scale single-cell data in R. Bioinformatics. 2016;32:1241–1243. doi: 10.1093/bioinformatics/btv715. [DOI] [PubMed] [Google Scholar]
- 33.Gaujoux R, Seoighe C. A flexible R package for nonnegative matrix factorization. BMC Bioinformatics. 2010;11:367. doi: 10.1186/1471-2105-11-367. [DOI] [PMC free article] [PubMed] [Google Scholar]
- 34.Finak G, et al. MAST: a flexible statistical framework for assessing transcriptional changes and characterizing heterogeneity in single-cell RNA sequencing data. Genome Biol. 2015;16:278. doi: 10.1186/s13059-015-0844-5. [DOI] [PMC free article] [PubMed] [Google Scholar]
- 35.Bindea G, et al. ClueGO: a Cytoscape plug-in to decipher functionally grouped gene ontology and pathway annotation networks. Bioinformatics. 2009;25:1091–1093. doi: 10.1093/bioinformatics/btp101. [DOI] [PMC free article] [PubMed] [Google Scholar]
- 36.Schindelin J, et al. Fiji: an open-source platform for biological-image analysis. Nat Methods. 2012;9:676–682. doi: 10.1038/nmeth.2019. [DOI] [PMC free article] [PubMed] [Google Scholar]
- 37.Bankhead P, et al. QuPath: Open source software for digital pathology image analysis. Sci Rep. 2017;7:16878. doi: 10.1038/s41598-017-17204-5. [DOI] [PMC free article] [PubMed] [Google Scholar]
Associated Data
This section collects any data citations, data availability statements, or supplementary materials included in this article.


