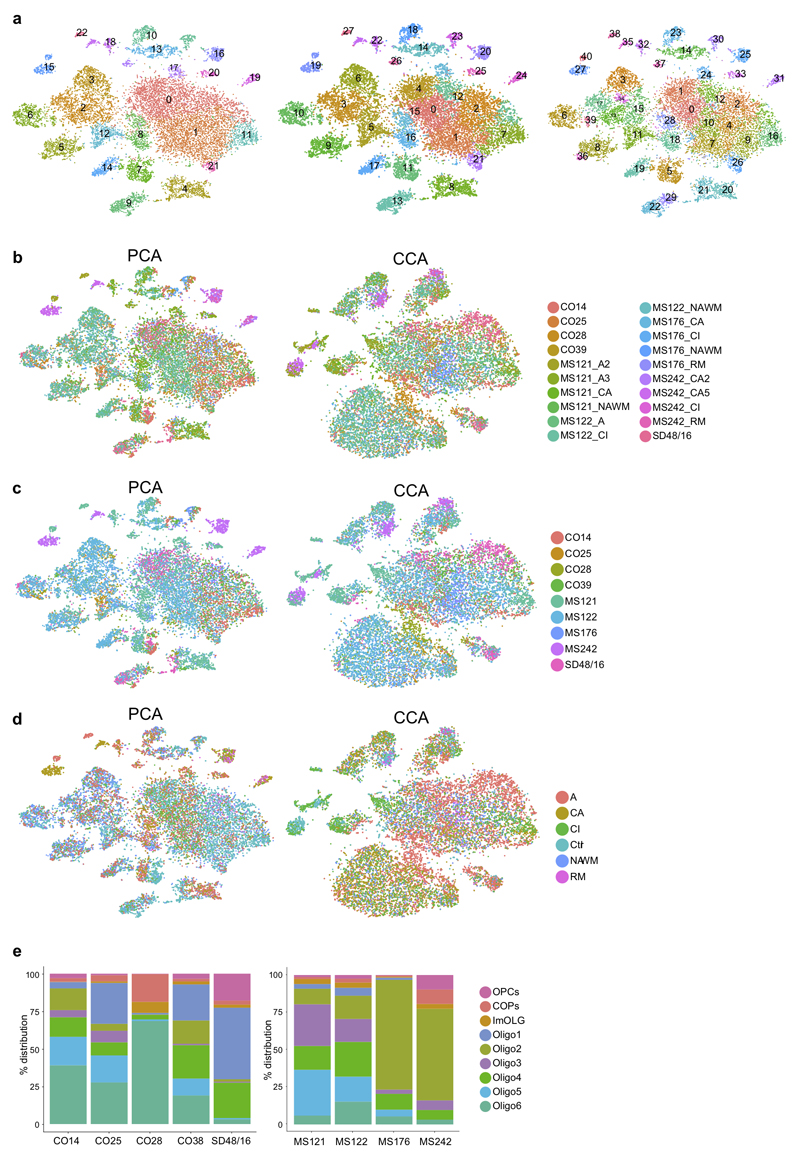
Extended Figure7. Clustering of snRNA-seq dataset by different origins.
a, tSNEs representing human Ctr and MS WM nuclei after dimensionality reduction with principal component analysis (PCA) at different resolutions. b-d, Clustering of snRNA-seq datasets by sample after dimensionality reduction with PCA (left) and canonical component analysis (CCA, right), highlighting Ctr/MS individual and lesion type combined (b), Ctr/MS individual (c) and lesion type (d) separately. e, Frequency distributions of OL sub-clusters by Ctr (left) and MS (right) individuals. (n=17799 cells derived from 5 Ctr and 4 MS patients).

