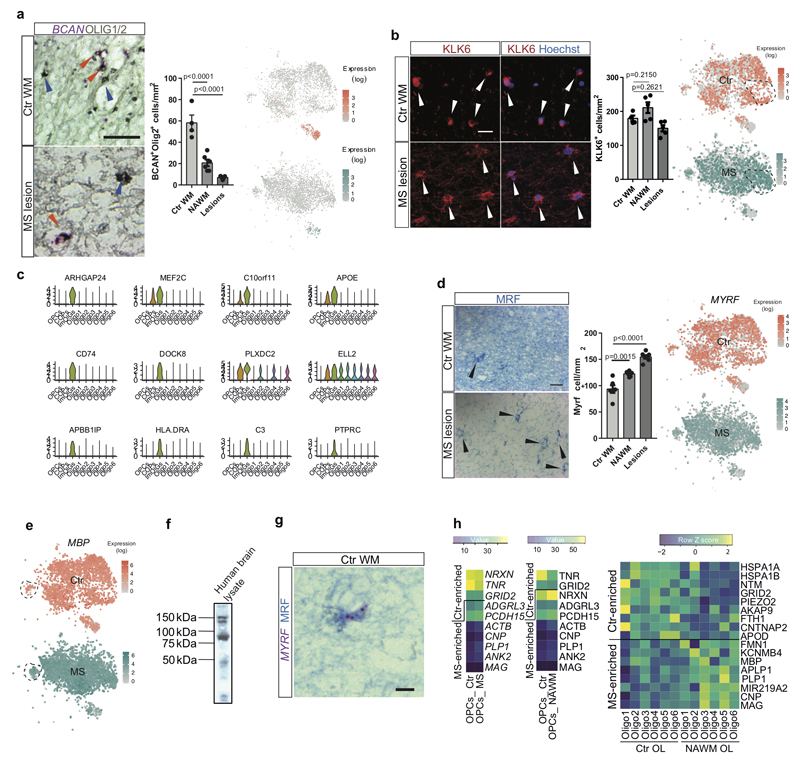
Extended Figure8. Validation of skewed MS heterogeneity and OL gene expression profiling in Ctr and NAWM.
a, Validation of BCAN-expressing OPCs in combination with OLIG1/2 IHC. Red arrowhead: BCAN+/OLIG1/2+ OPC, blue arrowhead: BCAN-/OLIG1/2+ OL (scale bar: 20µm) and tSNE overlay of BCAN expression in the snRNA-seq dataset in Ctr and MS, (scale bar: 20µm, data displayed as mean±SEM, n=4 samples from different control individuals, n=6 NAWM samples and n=5 MS lesion samples from different MS patients, ANOVA. b, KLK6-expressing OL in Ctr WM, NAWM and MS lesions (scale bar: 50µm, data displayed as mean±SEM, n=4 samples from different Ctr individuals and n=5 different MS individuals, ANOVA) and tSNE overlay of KLK6 expression in the Ctr and MS snRNA-seq dataset. c, Violin plots showing the normalized expression counts of genes enriched in ImOLG in the snRNA-seq dataset (nOPC=352, nCOP=242, nImOLG=207, nOligo1=1129, nOligo2=1839, nOligo3=775, nOligo4=1579, nOligo5=1167, nOligo6=1484). Violin plots are centered around the median with interquartile ranges, with shape representing cell distribution. d, MRF IHC in Ctr WM, NAWM and MS lesions (scale bar: 50µm, data displayed as mean±SEM, n=6 samples from different control individuals, and n=7 different MS patients, ANOVA) and tSNE overlay of MYRF expression in the snRNA-seq dataset. e, tSNE overlay of MBP expression in the Ctr and the MS snRNA-seq dataset (n=4037 OL in Ctr and n=4737 OL in MS). f, Western blot of the MYRF antibody on human brain lysate to validate the specificity of the antibody. For gel source data, see Supporting Fig.1 g, Combination of MYRF mRNA and protein labeling to confirm the specificity of the MYRF antibody in Ctr WM (scale bar: 10µm). h, Heatmaps representing the average gene expression of a subset of genes, including myelin-related genes, in Ctr vs. MS samples in OPCs (Ctr.vs. MS and Ctr. vs. NAWM) and mature OLs (Ctr vs. NAWM). a-b,d: each experiment was performed in 2 (3 for d) independent batches and p-values are only displayed compared to Ctr.; f,g: each experiment was performed twice on independent samples.

