Abstract
Objective
The objective of this study was to develop a physiologically based pharmacokinetic model for meropenem using a retrograde approach, which could serve as a basis for prediction of the systemic and infection-site drug exposures in different populations and indications. We intended this model to be a useful tool to inform (local) pharmacokinetic-based optimal dosing of meropenem in different settings.
Methods
We developed a reduced physiologically based pharmacokinetic model with NONMEM software using a top-down approach. We used historical (previously published) data for model development and qualification. We used steady-state systemic and infection-site concentrations from 60 adult patients diagnosed with severe lung infection for model development and internal evaluation. The data included rich plasma and sparse epithelial lining fluid samples. We based the internal validation of the model on successful numerical convergence, adequate precision in parameter estimation, acceptable goodness-of-fit plot with no indication of bias, and acceptable performance of visual predictive checks. We performed external validation by fitting the model to independent data from five previously published studies: four studies in patients with pneumonia, with different grades of renal impairment, and one study in morbidly obese patients.
Results
We successfully fitted a reduced physiologically based pharmacokinetic model with six compartments (arterial and venous pools, infection site [lungs], liver, kidneys and rest of the body) to the data and adequately estimated model parameters. We successfully qualified the model (internally and externally) using established methods. Estimated values for tissue-to-plasma partition coefficients were 0.2629 and 0.1946 for lungs and non-fat tissues (kidneys and liver), respectively. Estimated total clearance was 8.174 L/h for a typical patient with a glomerular filtration rate of 65 mL/min. Consistent with the known mechanism of meropenem elimination and previously published models, renal clearance accounted for 70% of total clearance. The model had good predictive performances on data from five different sources including populations with different characteristics with regard to body size, renal function and morbidity.
Conclusions
We successfully developed a physiologically based pharmacokinetic model for meropenem in adult patients to be used as a basis for prediction of concentrations in different groups of patients, and eventually for effective dose individualisation in different subgroups of the population.
Electronic supplementary material
The online version of this article (10.1007/s40268-019-0268-x) contains supplementary material, which is available to authorized users.
Key Points
| Several reports in the literature describe the pharmacokinetics of meropenem in patients with pneumonia. We developed these models using an empirical data-driven approach: there are therefore differences (inconsistencies) in the structure, parameter values and covariates included in the different models. |
| We successfully developed for the first time a physiologically based pharmacokinetic model for meropenem, whose structure and parameters are less dependent on the available data, originating from the pathophysiology and pharmacological properties of the drug. |
| We demonstrated the reliability, predictive performances and robustness of our physiologically based pharmacokinetic model by its ability to predict the previously published plasma and infection-site concentrations measured in different settings and populations (external validation data) with acceptable accuracy and precision. |
Introduction
Meropenem is a well-tolerated antibiotic with a broad antibacterial spectrum including Gram-negative bacteria. It is used in critical situations, such as in intensive care patients to treat severe nosocomial pneumonia. The approved summary of product characteristics recommends the use of 500 mg or 1 g every 8 h (every 12 h for patients with renal impairment) by intravenous infusion over 15–30 min for adult patients with pneumonia (including community-acquired pneumonia and nosocomial pneumonia) [1]. However, alternative dosing regimens and modes of administration would be more effective, or cost effective, in clinical practice [2, 3]. Optimal dosing of meropenem in different subpopulations and indications is therefore still not consensual, and tools to inform adequate and objective dosing should have further advantages for the clinical care of (critically ill) patients treated with meropenem.
Use of pharmacokinetic (PK)/pharmacodynamic modelling, i.e. integration of PK parameters with the minimum inhibitory concentration (MIC), is now recognised as a powerful tool to optimise antibiotic dosing regimens and has been successfully applied in different cases [4]. To optimise meropenem dosing, meropenem pharmacokinetics was described in different patient populations and indications, including neonates [5, 6], morbidly obese patients [7], adults with pneumonia (sepsis) [8–16], a healthy population [17] and patients with various degrees of renal functions [18].
All these models used a data-driven empirical top-down approach in their development, i.e. estimated PK model parameters based on concentrations collected in a particular group of patients. Consequently, the results are not consistent across studies given that the findings in each of these studies are only applicable to the population sample of collected concentrations. To date, there has been no exploration of the sources of differences in parameter values reported in the varying studies, and a basis for inference in yet unstudied populations is currently missing.
The fact that only plasma concentrations are described in most of these studies is another limitation with currently available models, while there is increasing evidence about the superiority of dosing based on local (infection-site) concentrations [9]. It is therefore important to characterise the time course of meropenem concentrations at sites of infection. To date, a very limited number of therapeutic studies assessed clinical outcomes based on epithelial lining fluid (ELF) drug concentrations [19, 20].
Physiologically based pharmacokinetic (PBPK) modelling can address these two issues (i.e. reconciliation of previously published results and descriptions of local concentrations even in the absence of measured values). In PBPK models, there is a distinction between drug- and systems (patient)-related parameters. The structural elements represent the tissue and organ spaces of a mammalian body, whole-body physiologically based modelling, and they provide a more mechanistic description of the time course of plasma and local concentrations as compared with traditional and empirical compartmental models. Physiologically based pharmacokinetic models are therefore mechanistic models that originate in both the pharmacological behaviour of the drug and human physiology. This modelling approach is much less dependent on the data and related limitations, and is used to predict data collected in different settings and explain (conflicting) results obtained in previous publications. The further advantage of a generic PBPK model is to propose a robust tool for the development of dosing algorithms.
The clinical application of whole-body physiologically based models has faced a number of limiting steps including the requirement for a large amount of patient- and drug-related data, as well as the need for methodological, numerical and computational resources. By either fixing a number of parameters or by reducing the complexity, we overcome these hurdles and therefore the number of parameters to estimate, resulting in reduced physiologically based pharmacokinetic models.
As no PBPK model has been published for meropenem so far, the aim of this article is to develop a model that permits the quantitative characterisation of the disposition of meropenem in different patient populations (i.e. description of systemic [plasma] and effect site [ELF] exposures) and that serves as a basis for the inference on (plasma and local) exposure in yet unstudied populations.
Patients and Methods
Patients
We used data from five previously published models for meropenem for model development and validation. Table 1 summarises the patients’ characteristics in the five different studies. Frippiat et al.’s data [10] (PROMESSE study) were used for model building. The data set consists of rich plasma and sparse ELF samples, measured at steady state, from 60 patients diagnosed with severe lung infection (late-onset ventilator-associated pneumonia or hospital-acquired pneumonia). Data from the PROMESSE study were available at the patient level and data from five additional patients that had become available after the data lock point for Frippiat et al. [10] have been included in our analysis. Patients received 1 g of meropenem every 8 h by intravenous infusion over either 0.5 h or 3 h. Figure 1 shows the plasma and ELF drug concentrations in each patient. As expected, we observed higher drug concentrations in patients with renal impairment. We further observed high inter-individual variability both in plasma and ELF concentrations, consistent with other studies [9]. Further information about patient demographics, study design, treatment and sampling are available in Frippiat et al. [10].
Table 1.
Demographic information from previously published studies
| Frippiat et al.a [10] | Lodise et al.b [9] | Karjagin et al.b [11] | Li et al.b [8] | Chimata et al.b [18] | Wittau et al.b [7] | ||
|---|---|---|---|---|---|---|---|
| 30-min infusion (n = 33) |
3-h infusion (n = 27) |
(n = 39) | (n = 4) | (n = 79) | (n = 13) | (n = 5) | |
| Type of patients | Late-onset ventilator associated pneumonia or hospital-acquired pneumonia (ICU) | Ventilator-associated pneumonia | Severe peritonitis associated with septic shock (ICU) | Intra-abdominal infections, community-acquired pneumonia or VAP | Various degrees of renal impairment | Hospitalised morbidly obese patients | |
| Sex (male/female) | 11/22 | 8/19 | 3/1 | 61/18 | 5/8 | 2/3 | |
| Age (years) | 15–18 | 41–84 | 20–85 | 52–81 | 18–93 | 30–76 | 31–49 |
| Height (cm) | 144–185 | 147–185.4 | 155–190 | ||||
| Weight (kg) | 49–128 | 45–108 | 46–140 | 50–70 | 40.6–127 | 34–85 | 116–203 |
| BSA (m2) | 2.23–3.19 | ||||||
| GFR (mL/min) | 19–401c | 20–212c | |||||
| Serum creatinine (µmol/L) | 47–123 | 35.37–610.1 | 44.21–618.94 | 64–80 | |||
| Creatinine clearance (mL/min) | 30–135 | 4.3–68.0 | |||||
Values are presented with the range
BSA body surface area, GFR glomerular filtration rate, ICU intensive care unit, VAP ventilator associated pneumonia
aData used for the model building
bData used for external validation
cGFR values were calculated according to the four-variable Modification of Diet in Renal Disease formula or by measurement of creatinine clearance based on 24-h urine [10]
Fig. 1.
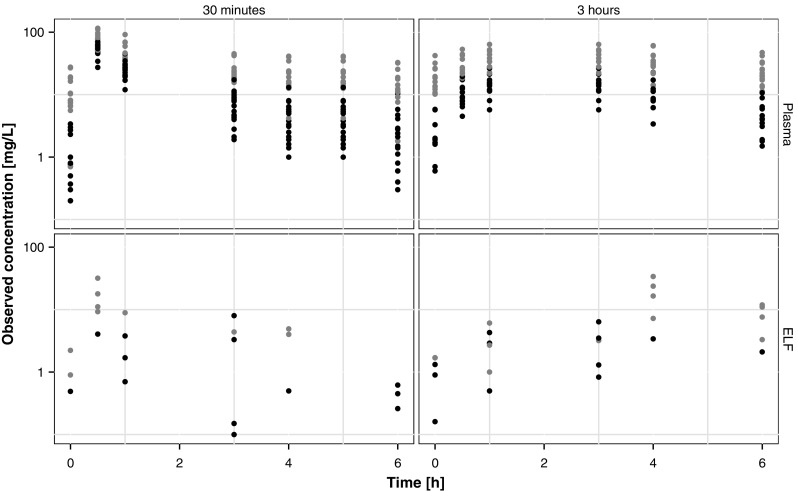
Observed plasma and epithelial lining fluid (ELF) meropenem concentrations in the 60 patients included in the model building data set (grey and black points represent patients with poor renal function [glomerular filtration rate < 60 mL/min] and good renal function [glomerular filtration rate > 60 mL/min], respectively)
Physiologically Based Pharmacokinetic Model Development
We used patient blood and ELF concentrations to estimate the tissue-to-blood partition coefficients and the total clearance (top-down approach). We used a non-linear mixed-effects approach for this purpose, as implemented in NONMEM software, Version 7.3 (Icon Development Solutions, Ellicott City, MD, USA) and the Perl-speaks-NONMEM toolkit, a programming library containing a collection of computer-intensive statistical methods for non-linear mixed-effects modelling [21]. We used the first-order conditional estimation with η–ε interaction. The Electronic Supplementary Material (ESM) provides the NONMEM code of the final model.
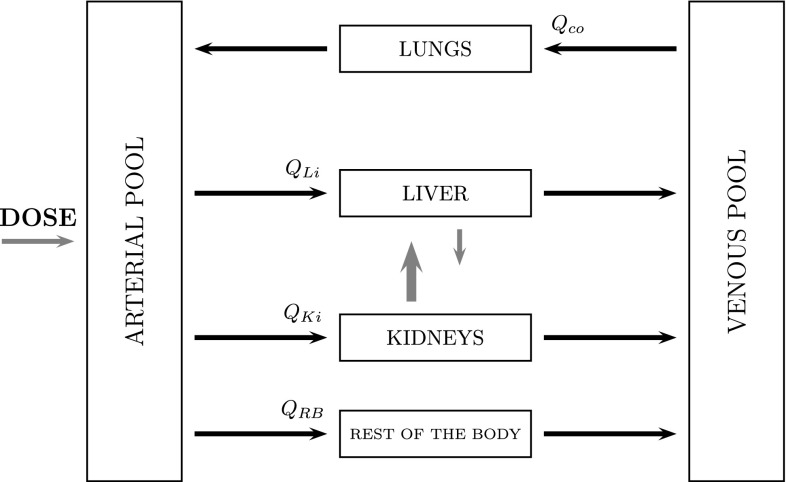
The reduced PBPK model for meropenem consists of six compartments, including three organs (lungs/site of effect, kidneys and liver) and two blood compartments to distinguish arterial and venous bloods. Figure 2 shows the schematic of the architecture of the structural PBPK model. In the model, all tissues were represented as single well-stirred compartments and the distribution of meropenem was assumed perfusion rate limited. We combined all the other tissues and organs (stomach, spleen, intestine, heart, muscles, bones) into one compartment called “rest of the body”. We connected the compartments representing different organs and tissues in parallel between those representing the arterial and venous circulations: the arterial circulation provided the blood supply to all organs and tissues and blood from the tissues flowed directly into the venous circulation. The lung compartment closed the circulation loop in the model and received blood at a flow rate equal to that of the cardiac output. The PBPK model was built on physiological considerations and included realistic organ blood flows and organ volumes, obtained from the literature [22] and presented in Table 2.
Fig. 2.
Schematic of the physiologically based pharmacokinetic model for meropenem
Table 2.
Physiological parameters used in the model, taken from Jones et al. [22]
| Organ/tissue | Volumea | Blood flow ratea |
|---|---|---|
| Arterial blood | 0.0257 | – |
| Lungs | 0.0076 | 1 |
| Venous blood | 0.0514 | – |
| Liver | 0.0257 | 0.25b |
| Kidneys | 0.0044 | 0.19 |
| “Rest of the body” |
aTissue volumes and blood flow rates are expressed as a fraction of total bodyweight (WT) and cardiac output (CO), respectively
bThe blood flow of the liver is the sum of the blood flows of the portal vein and the hepatic artery
Consistent with the known pharmacology of meropenem, we modelled the elimination of meropenem as occurring in the kidneys and the liver. We assumed renal elimination to represent approximately 70% of total clearance [1]. We assumed non-renal clearance as entirely hepatic (metabolism by hydrolysis) [1], and other tissues to have no effect on the drug clearance. We administered meropenem by intravenous perfusion.
The mathematical description of this model consists of a mass balance equation for each compartment. We modelled the affinity of each tissue for the drug as a tissue-to-plasma partition coefficient, , defined as the ratio between the organ concentration and the efferent plasma concentration.
We used the following differential equations to describe drug evolution in the different compartments:
-
(i)
Eliminating organs:
where , and denote drug concentrations in the arterial compartment, the liver and the kidneys, respectively, and denote the volumes of the liver and kidney compartments, respectively, and are the blood flow rates of the liver and the kidneys (the liver blood flow rate is the sum of the blood flows of the portal vein and the hepatic artery), CLR and CLH are the renal and hepatic clearances, and and are the concentration ratios between the liver and kidneys and the efferent plasma. We assumed the Kp values for non-fat tissues (liver and kidneys) were equivalent.
-
(ii)
Non-eliminating organs/tissues:
where and denote drug concentrations in the “rest of the body” and in the lungs compartments, respectively, and denote the corresponding volumes, and denote the blood flow rates of the lungs and the rest of the body, and and are the concentration ratios between the lung and the rest of the body, and the efferent plasma.
-
(iii)
Blood compartments:
where represents the intra-arterial rate of infusion, and denote drug concentrations in the arterial and venous pools, respectively, and denote drug concentrations in the lungs and in each of the other organ compartments, and denote the volumes of arterial and venous compartments, respectively, denotes the cardiac output, and and are the blood flow rates of the lungs, and each of the other organ compartments, respectively. The blood flow of the liver is the sum of the blood flows of the portal vein and the hepatic artery.
We described inter-individual variability by an exponential model, meaning that we assumed parameters ( and CL) to be log-normally distributed as exemplified below for total clearance:
where is the clearance value for the ith individual, TVCL is the population typical value (fixed effect) for the clearance, and is the individual realisation of the random variable (random effect).
We only retained inter-individual variability terms in the model when they improved the fitting performance of the model based on the result of likelihood ratio tests. We initially described the residual error models (on plasma and ELF observations) by a combined proportional and additive model:
where and stand for the jth observed and predicted concentrations in the ith individual, respectively, and and are the individual realisations of the random variables and , respectively.
We incorporated known physiological relationships into the covariate-parameter models. We described the changes in the total clearance as a function of renal function by an allometric model, as shown below:
where is the total clearance value for individual i, and was described as a function of typical clearance value in the population () and of the glomerular filtration rate (GFR) for individual i (), normalised by the median GFR (), which was 65 mL/min in the studied population. We estimated θGFR in a preliminary analysis step and described the normalised power function. We modelled the effect of body size on the volumes of distribution of the different compartments using a linear function: tissue/organ volumes were expressed as a fraction of total bodyweight [22].
Physiologically Based Pharmacokinetic Model Evaluation
Internal Validation
Assessment of parameter estimation adequacy was guided by model fitting performances, including (1) parameter plausibility, (2) successful convergence of the minimisation routine with at least two significant digits in parameter estimates, (3) visual inspection of diagnostic scatter plots (observed vs. predicted concentrations and conditional weighted residual vs. predicted concentration or time), (4) precision of parameter estimates (assessed by bootstrap) and (5) acceptable visual predictive checks (VPCs).
Internal evaluation consisted of validating the model by means of the data involved in parameter estimation. Standard methods [23] are the diagnosis scatter plots, the VPCs and the bootstrap. Using R, we performed graphical representations [24]. We used the following diagnosis scatter plots, also called goodness-of-fit plots, for model internal qualification: observed concentrations vs. predicted or individual-predicted concentrations, and conditional weighted residuals vs. predicted concentrations and vs. time.
We based VPC on the idea that a model derived from a data set should be able to simulate data similar to the original models. To generate the VPC scatter plot, we simulated the original data set 1000 times using the final model. We compared the 90% prediction interval of the simulated concentration time profiles to 90% of the observed concentrations. A good overlap between predicted and observed drug concentrations confirms that the model is adequately adjusted to the data.
Model bootstrapping is a method used to evaluate the precision of parameter estimations. It consists of generating a large number of new databases by sampling individuals with replacement from the original dataset. For each new dataset, parameters were re-estimated and this resulted in a bootstrap distribution of each model parameter [25]. We investigated the 90% confidence interval (between the 5th and 95th percentiles) for each of the model parameter distributions using 500 bootstraps [26].
External Validation
External evaluation consisted of comparing model predictions (90% prediction interval using the final model) with concentrations measured in patients in similar situations from the scientific literature. Data were generated (digitised) at patient levels using figures provided in the different papers. The good predictive performances of the model are established when the simulated data are consistent with observed concentrations in independent but similar settings. We used MATLAB2016b software (The MathWorks Inc., Natick, MA, USA) to perform simulations (using the analytical expression of the PK profiles). Using MATLAB, we made graphical representations. We designed MATLAB codes to determine PK profiles at a population level, or for a typical patient (based on weight and GFR values). The ESM provides an example of a MATLAB code used for this purpose.
We used data from four previously published studies for this purpose. Three of the studies described meropenem pharmacokinetics in (sepsis) patients with pneumonia [8, 9, 11], while the fourth study described meropenem pharmacokinetics in patients with variable renal functions [18]. However, the conclusions regarding the external validation are limited by the small size of the validation groups. We included in the validation data set all of the digitised data obtained from available and relevant publications in the scientific literature where meropenem was used to treat patients with pneumonia.
The first study by Karjagin et al. [11] contained six patients with severe peritonitis associated with septic shock. We only reported relevant information for the simulation process (dosing regimen, and matched bodyweight and renal function) for four of the six patients. Accordingly, we used digitised observed data from these four patients for external validation (1 g over a 20-min infusion, every 8 h). For each individual, we obtained information on sex, weight, age, serum creatinine and creatinine clearance.
In the study by Li et al. [8], we obtained data from three previously conducted clinical trials in patients with pneumonia (including patients with community-acquired pneumonia, or ventilator-associated pneumonia). We did not obtain individual characteristics, but presented mean values as part of the demographic characteristics (weight, height, sex, age, serum creatinine). We derived individual patient characteristics for simulations using online databases from the National Health and Nutrition Examination Survey website from 2005 to 2006 [27], taking into account the proportion of male and female individuals and the range of the different variables as described by the authors [8]. We used digitised observed data for external validation (six different dosing regimens: 0.5, 1 or 2 g over a 30-min or 3-h infusion, every 8 h).
The study by Lodise et al. [9] involved patients with ventilator-associated pneumonia. Demographic characteristics were provided (age, weight, height) at the summary level. We derived individual characteristics for simulations from the National Health and Nutrition Examination Survey 2005–2006, taking into account the proportion of male and female individuals and the range of available variables. Observed data were not reported in the publication, but the authors performed simulations of concentration–time profiles in plasma and ELF. Hence, we used the (digitised) simulation results for our external evaluation step (2 g over a 3-h infusion).
Finally, we also used the study by Chimata et al. [18], including patients with various renal functions, for external validation. We allocated patients to three groups: group 1 (four patients with ), group 2 (four patients with ) and group 3 (five patients with ). Groups 4 and 5, including patients with end-stage renal disease (), were not used for our external validation. For each individual, we obtained information on sex, weight, age, serum creatinine (mg/dL) and creatinine clearance. We used digitised observed data for external validation (0.5 g over a 30-min infusion).
Glomerular filtration rate was either approximated by the creatinine clearance consistently with the source article or computed using either the Cockcroft–Gault formula [28] or the Modification of Diet in Renal Disease formula [29]. We approximated the body surface area using the Du Bois formula [30].
Extrapolation in Morbidly Obese Individuals
We investigated the predictive performances of the model by fitting the model to (digitised) concentrations from a previously published study on meropenem in morbidly obese patients [7] (1 g over 15-min infusion, every 8 h). This study included five patients. Given that individual patients’ characteristics (sex, age, weight, height, body surface area, serum creatinine) were not reported in the publication, we generated relevant individual-level patients’ characteristics using the population tab of Simcyp, Version 16.0.113.0 (Certara Inc., Princeton, NJ, USA) that matched the summary-level characteristics in the publication. Simcyp virtual populations are created based on real patient populations: the actual covariance structure between patients’ characteristics in the population is therefore conserved in the simulations. Obese patients constitute an interesting population to consider, especially because weight is an important covariate of the model. This very different population with regard to bodyweight distribution is presented as an extrapolation group, compared to the other available data.
Results
Table 3 details the estimated PBPK parameter values and related bootstrap distribution results (confidence intervals). We assumed clearance as the sum of the renal clearance (fixed to 70% of the total clearance) and the metabolic clearance. We assumed partition coefficient values (ratio between systemic and tissue concentrations, Kps) for non-fat tissues (liver and kidneys) to be equivalent as described by Pilari and Huisinga [31]. Kps and clearance estimates were plausible and adequately estimated. Bootstrap results, also included in Table 3, gave satisfactory results. Estimated values for tissue-to-plasma partition coefficients were 0.2629 and 0.1946 for lungs and non-fat tissues (kidneys and liver), respectively. This implies that, when target concentrations are computed from in-vitro experiments where microbiological susceptibility is defined in terms of MIC, the dose should be optimised on the basis of the concentrations to reach in the target tissue rather than in plasma only.
Table 3.
Physiologically based pharmacokinetic model parameter estimates
| Parameter | Estimate | Bootstrap CI |
|---|---|---|
| TVCL | 8.174 | 7.684–8.940 |
| 0.2629 | 0.219–0.314 | |
| 0.1946 | 0.141–0.201 | |
| 0.2525 | 0.238–0.288 | |
| Allometric exponent of GFR effect on CL | 0.722 (fixed) | – |
| IIV on CL [ω2 (%CV)] | 0.109 (32.98) | 0.093–0.161 |
| (%, plasma concentrations) | 0.086 (29.37) | 0.076–0.112 |
| (mg/L, plasma concentrations) | 0.036 (0.19) | 0.032–0.049 |
| (%, ELF concentrations) | 0.482 (69.43) | 0.422–0.650 |
CI confidence interval, CL clearance, CV coefficient of variation, ELF epithelial lining fluid, GFR glomerular filtration rate, IIV inter-individual variability
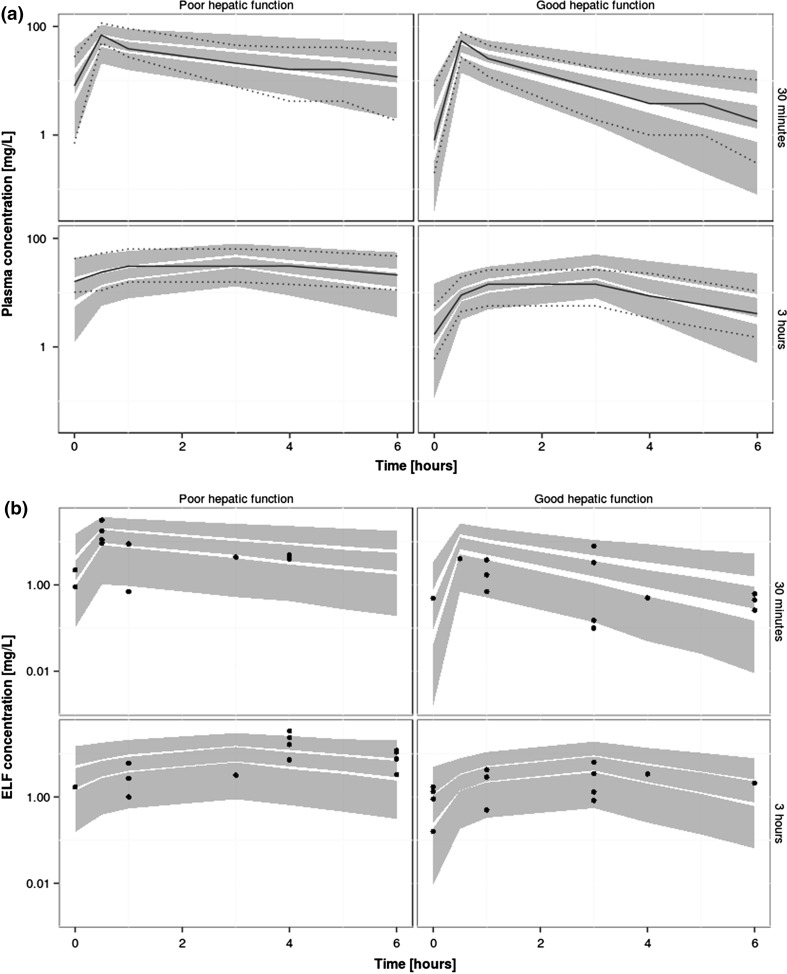
We internally validated the selected model by basic goodness-of-fit plots as shown in Fig. 3. The model fitted the data adequately, as shown by the absence of inadequate trends. Figure 4 shows the results of the PBPK model validation by VPCs. There were 1000 simulations of the original dataset performed and there was an acceptable agreement between the predicted and observed meropenem concentration–time data over the dosing interval for both ELF and plasma concentrations. The good overlapping effect between observed and predicted plasma and ELF concentrations indicates that the model displays good fitting performances and is therefore suitable for prediction purposes.
Fig. 3.
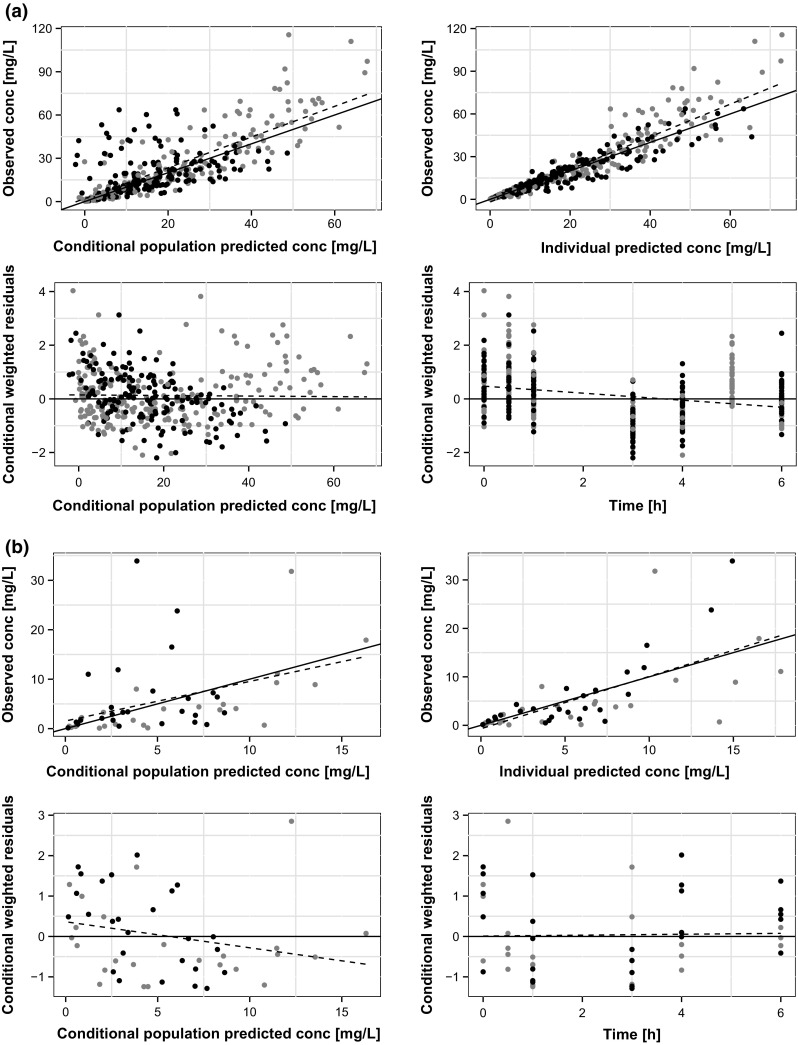
Diagnosis scatter plots for the plasma (a) and epithelial lining fluid (b) meropenem concentrations (conc) in patients included in the model building data set (grey and black points represent patients with administration over 30 min and 3 h, respectively, dashed lines are the linear regression lines, solid lines are either the line of identity [upper rows] or the line [low rows])
Fig. 4.
Visual predictive checks for the plasma (a) and epithelial lining fluid (ELF) (b) meropenem concentrations in patients included in the model building data set (grey areas are the 90% intervals of the medians and the 5th and 95th percentiles of predictions)
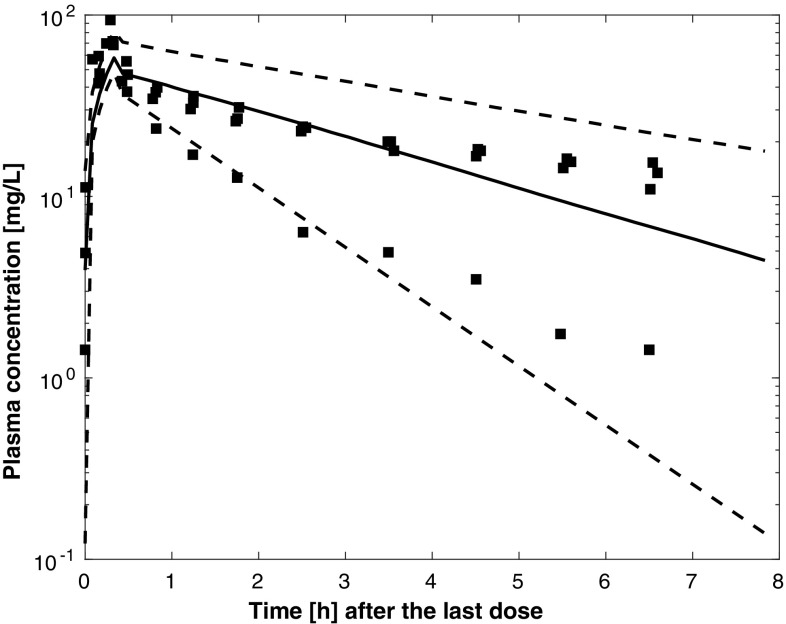
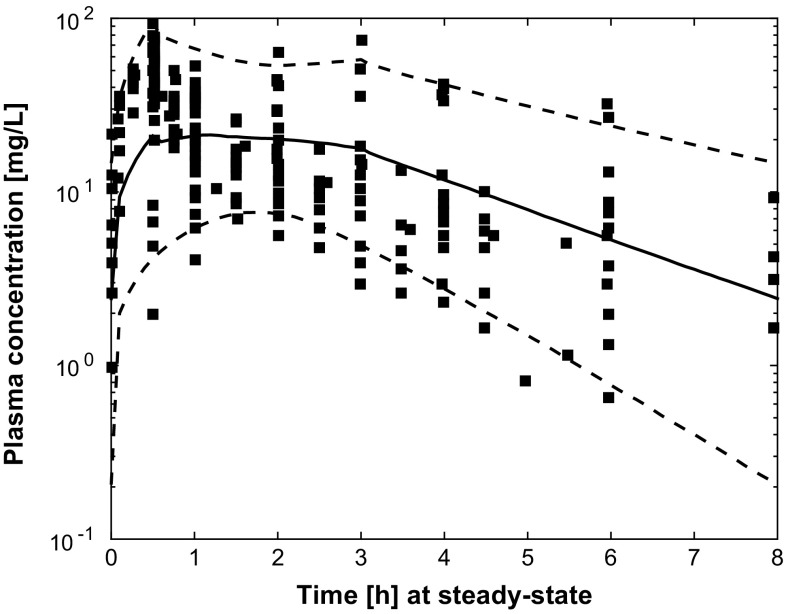
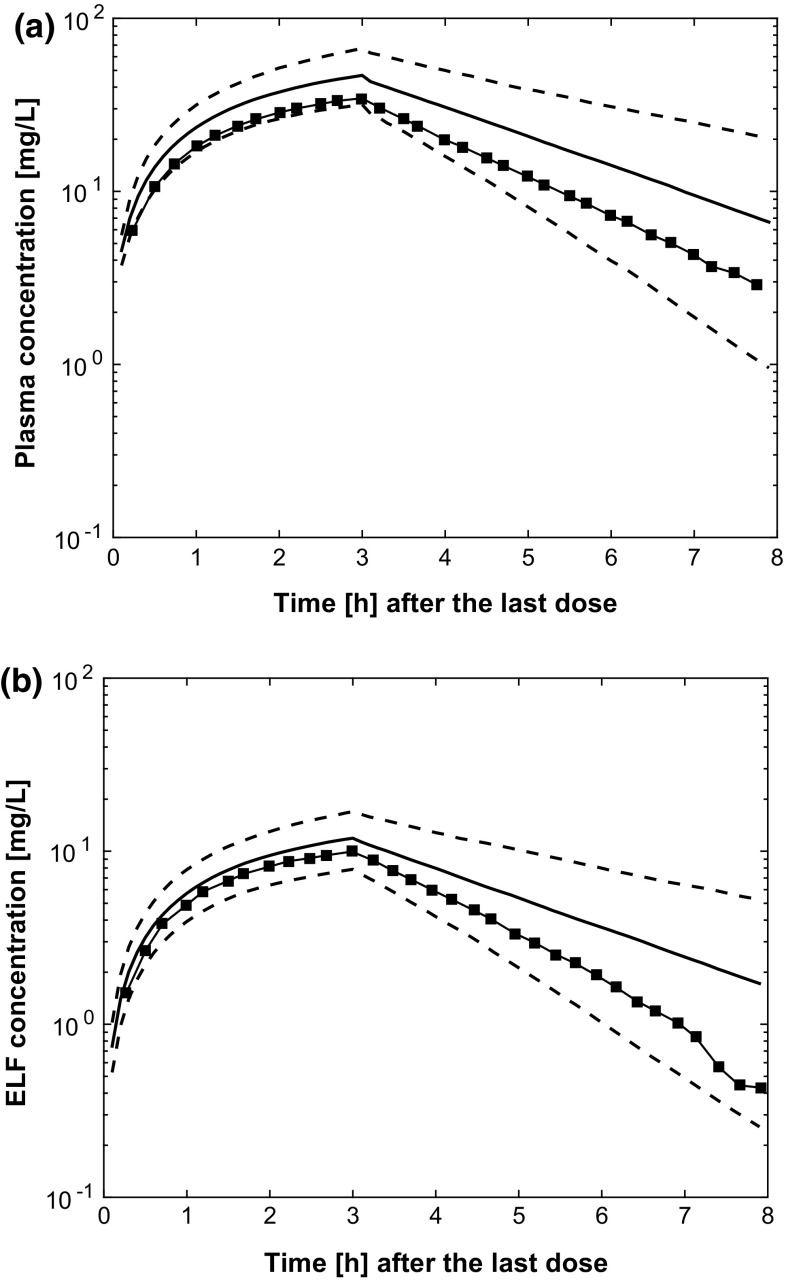
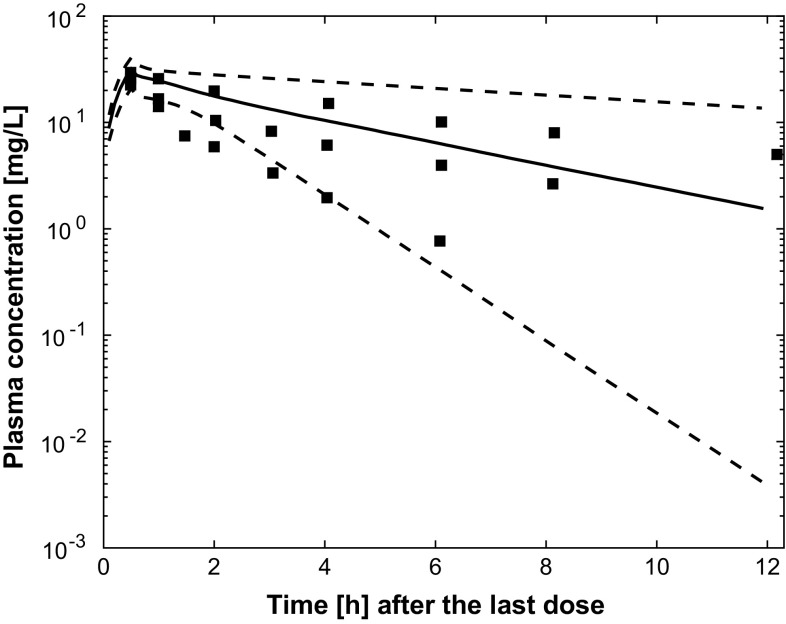
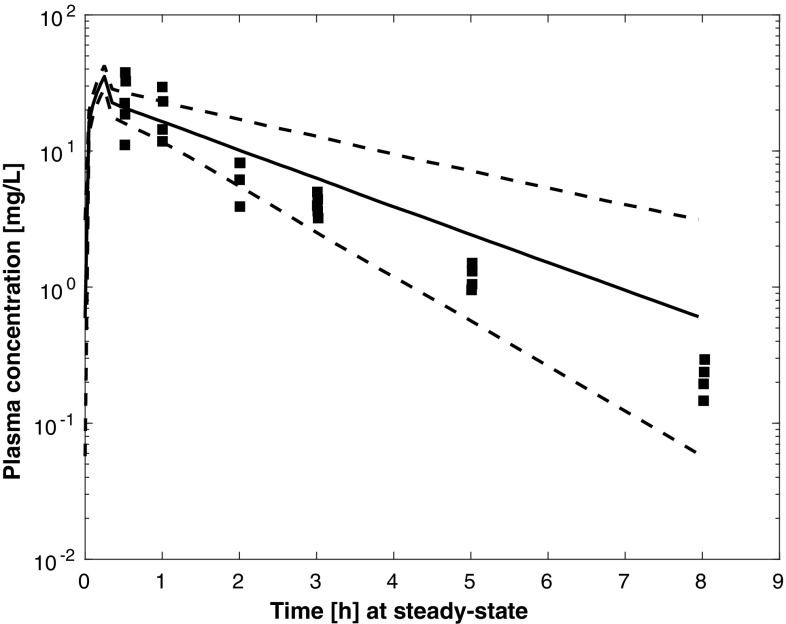
Results of external validation on data from independent patients with pneumonia [8, 9, 11] are shown in Figs. 5, 6 and 7. In all cases, the prediction of external data using the final PBPK model was acceptable. Figures S1–4 of the ESM provide individual plots for Karjagin et al.’s patients [11]. Separated plots for each dosing regimen reported in [8] are also provided in Figs. S5–10 of the ESM. Figure 8 shows the predictions for the patients taken from various degrees of renal function [18]. Simulations displayed good agreement between observed and predicted concentrations. Figures S11–13 of the ESM provide separated plots for each group. Figure 9 indicates that the developed PBPK model has good predictive performances for morbidly obese patients [7] and seems therefore acceptable for extrapolation in other groups of patients.
Fig. 5.
Simulated plasma pharmacokinetic profiles (median and 90% prediction interval) for four of the patients described in [11] (glomerular filtration rate was approximated by creatinine clearance, time is time after the second dose, square points are the observed plasma concentrations digitised from [11])
Fig. 6.
Simulated plasma pharmacokinetic profiles (median and 90% prediction interval) for 1000 patients from National Health and Nutrition Examination Survey databases and consistent with variable ranges described in [8] (glomerular filtration rate was computed with the Modification of Diet in Renal Disease formula, square points are observed plasma concentrations digitised from [8])
Fig. 7.
Simulated plasma and infection-site pharmacokinetic profiles (median and 90% prediction interval) for 1000 patients from National Health and Nutrition Examination Survey databases and consistent with variable ranges described in [9] (glomerular filtration rate was computed with the Modification of Diet in Renal Disease formula, time is time after the first dose, square points are simulated plasma (a) and epithelial lining fluid (ELF) (b) concentrations digitised from [9])
Fig. 8.
Simulated plasma pharmacokinetic profiles (median and 90% prediction interval) for 13 of the patients described in [18] (glomerular filtration rate was approximated by creatinine clearance, time is time after the first dose, square points are the observed plasma concentrations in the three groups digitised from [18])
Fig. 9.
Simulated plasma pharmacokinetic profiles (median and 90% prediction interval) for 1000 patients from Simcyp virtual populations and consistent with variable ranges described in the article [7] (glomerular filtration rate was computed with the Modification of Diet in Renal Disease formula, square points are the observed plasma concentrations digitised from [7])
Discussion
In this study, we developed a PBPK model for meropenem in patients with pneumonia with acceptable predictive performances and in line with the known pharmacokinetic properties of meropenem. Meropenem is a hydrophilic small molecule with a low volume of distribution and a very low level of protein binding (< 2%). These characteristics make meropenem a drug mainly eliminated by the kidneys, as the unbound fraction is available for glomerular filtration (major elimination pathway). Adequate characterisation of the impact of kidney function and body size on meropenem disposition is therefore crucial for adequate description/prediction of meropenem exposure in different populations and settings.
We quantitatively accounted for these two drivers of meropenem disposition in the PBPK model. Glomerular filtration rate (as a metric of kidney function) was included in the model as a significant covariate with an effect size estimated from Frippiat et al.’s data [10]. It was therefore described with an allometric exponent of 0.722. This is in good agreement with covariate effects in other papers on patients with pneumonia [8, 10]. As shown in Table 2, body size was included in the model as a linear covariate on the different organ volumes. This is consistent with the allometric theory and in line with PBPK models for other drugs [31, 32]. It should however be noted that organ volumes and organ blood flows are not consistently reported in previously published PBPK models [33–35]. A sensitivity analysis was therefore performed and revealed that organ volumes or organ blood flows had little influence on the final model predictions. The direct link of PBPK model parameters with (patho)physiology and drug pharmacology constitutes additional evidence of the model reliability as compared with the other models developed using a data-driven approach.
Estimated values for tissue-to-plasma partition coefficients were 0.2629 and 0.1946 for lungs and nonfat tissues (kidneys and liver), respectively. This implies that, when target concentrations are computed from in-vitro experiments where microbiological susceptibility is defined in terms of MIC, the dose should be optimised on the basis of the concentrations to reach in the target tissue rather than in plasma only.
For the purpose of meropenem dosing optimisation, an important number of population-PK models have been published, in different indications and populations [7–10, 13, 15, 18]. There are sometimes inconsistencies in the results from different groups with regard to final structural models [15], estimated parameter values, covariates selected [8, 13] and their effects on PK parameters [9]. This can be confusing and constitutes a limitation to the use of the modelling results by clinicians and users without a strong pharmacometrics background. These differences can probably be mostly related to the data-driven approach undertaken to develop these models, on the one hand, and to the differences in study designs and in particular, patients’ characteristics across studies, on the other hand. Furthermore, these models all aim at ensuring that patients’ exposure, i.e. PK concentrations, are within effective and safe margins with respect to the implemented dosing regimen. It should be noted that quantitative analysis and PBPK model development for the description of meropenem pharmacokinetics across indications and populations have not been explored so far, despite the large amount of available information on this topic in the scientific literature. There is therefore an unmet need to conciliate the current quantitative description of meropenem PK behavior across populations and indications, as well as the determinants of its PK variability. Meropenem pharmacokinetics in different populations and indications shares a drug-related component that can be quantitatively characterised and likewise the impact of different sources of variability such as renal function and body size. The PBPK model for meropenem developed in this study, whose (internal and external) qualification showed interesting results, may be considered as a good basis for dose optimisation in different situations where the drug is used. The good predictive performances of the proposed PBPK model on independent data collected in different settings constitute evidence of the model’s robustness and increase the confidence in its ability to predict yet unobserved concentrations. It should however be noted that this model still needs to be tested with additional external data and that its extrapolation to other populations such as children and patients without pneumonia still deserves investigation and will be the topic of future work. Extrapolation in morbidly obese patients supports the advantage of a PBPK model as a generic tool in comparison with a population-PK model developed by using a data-driven approach.
The ability of the proposed model to predict local (infection-site) concentrations is an interesting feature, which is increasingly considered as a better predictor of antibiotic efficacy than systemic concentrations [9]. This model can therefore be used to reliably compare different dosing options in different indications based on local concentrations. This is particularly important for meropenem given that there exists in the scientific literature a current lack of consensus in drug dosing. Recent publications report the superiority (in terms of cost effectiveness) of using smaller doses with shorter dosing intervals, as compared with the standard dosing regimen [3] whereas others state that the pharmacodynamic target (%T > MIC) is improved by extended or continuous infusion (see e.g. [19]). However, other studies proved that continuous infusion may fail to achieve 100% T > MIC at the site of infection [12, 36]. Therefore, tools to inform adequate and objective dosing should have further advantages for the clinical care of (critically ill) patients treated with meropenem.
Our aim is not to argue in favour of one approach over another for dosing of meropenem but to provide the pharmacologist and/or prescriber with a robust tool to test the efficiency of, and optimise, the dosing regimen given the considered target PK/pharmacodynamic parameter and the particularities and constraints applicable to the concerned patient. The developed robust PBPK model can be used to derive a dosing algorithm based on these considerations. Any lack of robustness or any limitation of the model will propagate it in the dose computed using the algorithm.
Conclusion
We proposed a reduced PBPK model to describe meropenem plasma and ELF concentrations in patients with pneumonia. This model can be used for simulations in such patients with varying degrees of renal function, and we obtained satisfactory results in another group of patients (morbidly obese population). This model can be used as a starting point to design individualised drug dosing strategies in these populations.
Electronic supplementary material
Below is the link to the electronic supplementary material.
Supplementary material 1 Final PBPK model: NONMEM model file (MOD 5 kb)
Supplementary material 2 Simulations and comparison with external digitised data: an example of MATLAB code (M 12 kb)
Supplementary material 3 External validation: additional figures (PDF 1180 kb)
Compliance with Ethical Standards
Funding
No sources of funding were received for the preparation of this article.
Conflict of interest
Pauline Thémans, Pierre Marquet, Joseph Winkin and Flora Musuamba have no conflicts of interest that are directly relevant to the content of this article.
References
- 1.Medicines and Healthcare Products Regulatory Agency. Meropenem trihydrate. In: Medicines information: SPC & PILs. 2017. http://www.mhra.gov.uk/spc-pil. Accessed 5 Apr 2018.
- 2.Perrott J, Mabasa VH, Ensom MHH. Comparing outcomes of meropenem administration strategies based on pharmacokinetic and pharmacodynamic principles: a qualitative systematic review. Ann Pharmacother. 2010;44:557–564. doi: 10.1345/aph.1M339. [DOI] [PubMed] [Google Scholar]
- 3.Chow I, Mabasa V, Chan C. Meropenem assessment before and after implementation of a small-dose, short-interval standard dosing regimen. Can J Hosp Pharm. 2018;71:14–21. [PMC free article] [PubMed] [Google Scholar]
- 4.Musuamba FT, Manolis E, Holford N, Cheung SYA, Friberg LE, Ogungbenro K, et al. Advanced methods for dose and regimen finding during drug development: summary of the EMA/EFPIA workshop on dose finding (London 4-5 December 2014) CPT Pharmacometr Syst Pharmacol. 2017;6:418–429. doi: 10.1002/psp4.12196. [DOI] [PMC free article] [PubMed] [Google Scholar]
- 5.Du X, Li C, Kuti JL, Nightingale CH, Nicolau DP. Population pharmacokinetics and pharmacodynamics of meropenem in pediatric patients. J Clin Pharmacol. 2006;46:69–75. doi: 10.1177/0091270005283283. [DOI] [PubMed] [Google Scholar]
- 6.Padari H, Metsvaht T, Kõrgvee LT, Germovsek E, Ilmoja ML, Kipper K, et al. Short versus long infusion of meropenem in very-low-birth-weight neonates. Antimicrob Agents Chemother. 2012;56:4760–4764. doi: 10.1128/AAC.00655-12. [DOI] [PMC free article] [PubMed] [Google Scholar]
- 7.Wittau M, Scheele J, Kurlbaum M, Brockschmidt C, Wolf AM, Hemper E, et al. Population pharmacokinetics and target attainment of meropenem in plasma and tissue of morbidly obese patients after laparoscopic intraperitoneal surgery. Antimicrob Agents Chemother. 2015;59:6241–6247. doi: 10.1128/AAC.00259-15. [DOI] [PMC free article] [PubMed] [Google Scholar]
- 8.Li C, Kuti JL, Nightingale CH, Nicolau DP. Population pharmacokinetic analysis and dosing regimen optimization of meropenem in adult patients. J Clin Pharmacol. 2006;46:1171–1178. doi: 10.1177/0091270006291035. [DOI] [PubMed] [Google Scholar]
- 9.Lodise TP, Sorgel F, Melnick D, Mason B, Kinzig M, Drusano GL. Penetration of meropenem into epithelial lining fluid of patients with ventilator-associated pneumonia. Antimicrob Agents Chemother Am Soc Microbiol. 2011;55:1606–1610. doi: 10.1128/AAC.01330-10. [DOI] [PMC free article] [PubMed] [Google Scholar]
- 10.Frippiat F, Musuamba FT, Seidel L, Albert A, Denooz R, Charlier C, et al. Modelled target attainment after meropenem infusion in patients with severe nosocomial pneumonia: the PROMESSE study. J Antimicrob Chemother. 2015;70:207–216. doi: 10.1093/jac/dku354. [DOI] [PubMed] [Google Scholar]
- 11.Karjagin J, Lefeuvre S, Oselin K, Kipper K, Marchand S, Tikkerberi A, et al. Pharmacokinetics of meropenem determined by microdialysis in the peritoneal fluid of patients with severe peritonitis associated with septic shock. Clin Pharmacol Ther. 2008;83:452–459. doi: 10.1038/sj.clpt.6100312. [DOI] [PubMed] [Google Scholar]
- 12.Goncalves-Pereira J, Silva NE, Mateus A, Pinho C, Povoa P. Assessment of pharmacokinetic changes of meropenem during therapy in septic critically ill patients. BMC Pharmacol Toxicol. 2014;15:15–21. doi: 10.1186/2050-6511-15-21. [DOI] [PMC free article] [PubMed] [Google Scholar]
- 13.Mattioli F, Fucile C, Del Bono V, Marini V, Parisini A, Molin A, et al. Population pharmacokinetics and probability of target attainment of meropenem in critically ill patients. Eur J Clin Pharmacol. 2016;72:839–848. doi: 10.1007/s00228-016-2053-x. [DOI] [PubMed] [Google Scholar]
- 14.Binder L, Schwörer H, Hoppe S, Streit F, Neumann S, Beckmann A, et al. Pharmacokinetics of meropenem in critically ill patients with severe infections. Ther Drug Monit. 2013;35:63–70. doi: 10.1097/FTD.0b013e31827d496c. [DOI] [PubMed] [Google Scholar]
- 15.Jaruratanasirikul S, Thengyai S, Wongpoowarak W, Wattanavijitkul T, Tangkitwanitjaroen K, Sukarnjanaset W, et al. Population pharmacokinetics and Monte Carlo dosing simulations of meropenem during the early phase of severe sepsis and septic shock in critically ill patients in intensive care units. Antimicrob Agents Chemother. 2015;59:2995–3001. doi: 10.1128/AAC.04166-14. [DOI] [PMC free article] [PubMed] [Google Scholar]
- 16.Ikawa K, Morikawa N, Ohge H, Ikeda K, Sueda T, Taniwaki M, et al. Pharmacokinetic-pharmacodynamic target attainment analysis of meropenem in Japanese adult patients. J Infect Chemother. 2010;16:25–32. doi: 10.1007/s10156-009-0022-3. [DOI] [PubMed] [Google Scholar]
- 17.Krueger WA, Bulitta J, Kinzig-Schippers M, Landersdorfer C, Holzgrabe U, Naber KG, et al. Evaluation by Monte Carlo simulation of the pharmacokinetics of two doses of meropenem administered intermittently or as a continuous infusion in healthy volunteers. Antimicrob Agents Chemother. 2005;49:1881–1889. doi: 10.1128/AAC.49.5.1881-1889.2005. [DOI] [PMC free article] [PubMed] [Google Scholar]
- 18.Chimata M, Nagase M, Suzuki Y, Shimomura M, Kakuta S. Pharmacokinetics of meropenem in patients with various degrees of renal function, including patients with end-stage renal disease. Antimicrob Agents Chemother. 1993;37:229–233. doi: 10.1128/AAC.37.2.229. [DOI] [PMC free article] [PubMed] [Google Scholar]
- 19.Veiga RP, Paiva JA. Pharmacokinetics-pharmacodynamics issues relevant for the clinical use of beta-lactam antibiotics in critically ill patients. Crit Care. 2018;22:233. doi: 10.1186/s13054-018-2155-1. [DOI] [PMC free article] [PubMed] [Google Scholar]
- 20.Gonçalves-Pereira J, Póvoa P. Antibiotics in critically ill patients: a systematic review of the pharmacokinetics of β-lactams. Crit Care. 2011;15:R206. doi: 10.1186/cc10441. [DOI] [PMC free article] [PubMed] [Google Scholar]
- 21.Lindbom L, Pihlgren P, Jonsson N. PsN-Toolkit: a collection of computer intensive statistical methods for non-linear mixed effect modeling using NONMEM. Comput Methods Progr Biomed. 2005;79:241–257. doi: 10.1016/j.cmpb.2005.04.005. [DOI] [PubMed] [Google Scholar]
- 22.Jones HM, Parrott N, Jorga K, Lavé T. A novel strategy for physiologically based predictions of human pharmacokinetics. Clin Pharmacokinet. 2006;45:511–542. doi: 10.2165/00003088-200645050-00006. [DOI] [PubMed] [Google Scholar]
- 23.Owen JS, Fiedler-Kelly J. Introduction to population pharmacokinetic/pharmacodynamic analysis with nonlinear mixed effects models. New York: Wiley; 2014. [Google Scholar]
- 24.The R Foundation. The R Project for Statistical Computing. https://www.r-project.org. Accessed 24 May 2018.
- 25.Efron B, Tibshirani RJ. An introduction to the bootstrap. Boca Raton: CRC Press; 1994. [Google Scholar]
- 26.Pearl speaks NONMEM. Bootstrap user guide. In: Documentation. 2018. https://uupharmacometrics.github.io/PsN/docs.html. Accessed 26 Apr 2019.
- 27.Questionnaires, datasets, and related documentation. In: National Health and Nutrition Examination Survey. Centers for Disease Control and Prevention. http://www.cdc.gov/nchs/nhanes. Accessed 17 Apr 2018.
- 28.Cockcroft DW, Gault H. Prediction of creatinine clearance from serum creatinine. Nephron. 1976;16:31–41. doi: 10.1159/000180580. [DOI] [PubMed] [Google Scholar]
- 29.Levey A, Greene T, Kusek J, Beck G. A simplified equation to predict glomerular filtration rate from serum creatinine. J Am Soc Nephrol. 2000;11:155A. [Google Scholar]
- 30.Verbraecken J, de Heyning P, De Backer W, Van Gaal L. Body surface area in normal-weight, overweight, and obese adults: a comparison study. Metabolism. 2006;55:515–524. doi: 10.1016/j.metabol.2005.11.004. [DOI] [PubMed] [Google Scholar]
- 31.Pilari S, Huisinga W. Lumping of physiologically-based pharmacokinetic models and a mechanistic derivation of classical compartmental models. J Pharmacokinet Pharmacodyn. 2010;37:365–405. doi: 10.1007/s10928-010-9165-1. [DOI] [PubMed] [Google Scholar]
- 32.Sadiq MW, Nielsen EI, Khachman D, Conil JM, Georges B, Houin G, et al. A whole-body physiologically based pharmacokinetic (WB-PBPK) model of ciprofloxacin: a step towards predicting bacterial killing at sites of infection. J Pharmacokinet Pharmacodyn. 2017;44:69–79. doi: 10.1007/s10928-016-9486-9. [DOI] [PMC free article] [PubMed] [Google Scholar]
- 33.Edginton AN, Schmitt W, Willmann S. Development and evaluation of a generic physiologically based pharmacokinetic model for children. Clin Pharmacokinet. 2006;45:1013–1034. doi: 10.2165/00003088-200645100-00005. [DOI] [PubMed] [Google Scholar]
- 34.Nestorov IA, Aarons LJ, Arundel PA, Rowland MR. Lumping of whole-body physiologically based pharmacokinetic models. J Pharmacokinet Biopharm. 1998;26:21–46. doi: 10.1023/A:1023272707390. [DOI] [PubMed] [Google Scholar]
- 35.Li GF, Wang K, Chen R, Zhao HR, Yang J, Zheng QS. Simulation of the pharmacokinetics of bisoprolol in healthy adults and patients with impaired renal function using whole-body physiologically based pharmacokinetic modeling. Acta Pharmacol Sin. 2012;33:1359–1371. doi: 10.1038/aps.2012.103. [DOI] [PMC free article] [PubMed] [Google Scholar]
- 36.Heffernan AJ, Sime FB, Lipman J, Roberts JA. Individualising therapy to minimize bacterial multidrug resistance. Drugs. 2018;78:621–641. doi: 10.1007/s40265-018-0891-9. [DOI] [PubMed] [Google Scholar]
Associated Data
This section collects any data citations, data availability statements, or supplementary materials included in this article.
Supplementary Materials
Supplementary material 1 Final PBPK model: NONMEM model file (MOD 5 kb)
Supplementary material 2 Simulations and comparison with external digitised data: an example of MATLAB code (M 12 kb)
Supplementary material 3 External validation: additional figures (PDF 1180 kb)


