Fig. 5.
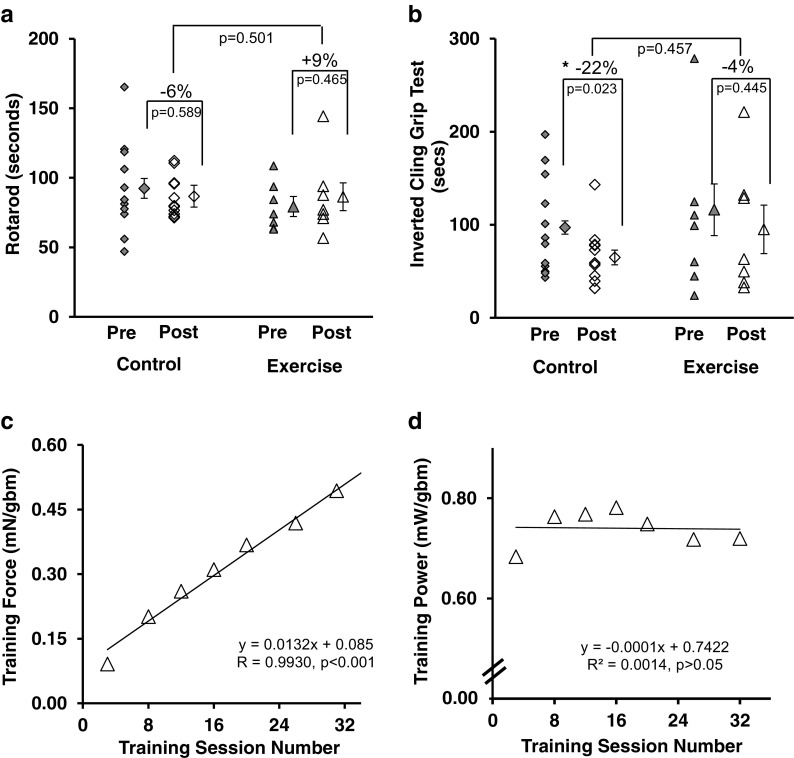
Exercise preserved functional performance. a While training did not improve rotarod performance in older mice, function was preserved. b Grip function preserved with exercise and grip function was lost in control mice. c Training force, the amount of force produced/gram of body mass, increased over the course of the training. d Training power, the amount of power produced/gram of body mass remained static over the course of the training. Symbols: *p < 0.05, each symbol in scatter plots is the result from an individual mouse (except for “means”). Filled symbols are before the training intervention period and open symbols are after the intervention period. Individual symbols to the right of the data spread represent the mean ± SE. Lines delineate significance. Diamonds = control mice; triangles = trained mice. Statistics: a, b 2 × 2 repeated measures ANCOVA, adjusted for body mass of mice. c, d Each symbol in the regression plots is the mean of all mice at the given session. mN = millinewtons, gbm = grams body mass, mW = milliwatts, equation is simple linear regression

