Abstract
Piscivorous birds have a unique suite of adaptations to forage under the water. One method aerial birds use to catch fish is the plunge dive, wherein birds dive from a height to overcome drag and buoyancy in the water. The kingfishers are a well-known clade that contains both terrestrially foraging and plunge-diving species, allowing us to test for morphological and performance differences between foraging guilds in an evolutionary context. Diving species have narrower bills in the dorsoventral and sagittal plane and longer bills (size-corrected data, n = 71 species, p < 0.01 for all). Although these differences are confounded by phylogeny (phylogenetically corrected ANOVA for dorsoventral p = 0.26 and length p = 0.14), beak width in the sagittal plane remains statistically different (p < 0.001). We examined the effects of beak morphology on plunge performance by physically simulating dives with three-dimensional printed models of beaks coupled with an accelerometer, and through computational fluid dynamics (CFD). From physically simulated dives of bill models, diving species have lower peak decelerations, and thus enter the water more quickly, than terrestrial and mixed-foraging species (ANOVA p = 0.002), and this result remains unaffected by phylogeny (phylogenetically corrected ANOVA p = 0.05). CFD analyses confirm these trends in three representative species and indicate that the morphology between the beak and head is a key site for reducing drag in aquatic species.
Keywords: plunge diving, avian hydrodynamics, beak, bow wave, Alcedinidae
1. Introduction
Plunge diving has evolved in multiple flying species to facilitate transitioning between the air and water—two mediums of vastly different densities. Birds including gannets, terns and boobies have mastered diving from air into water to access fish metres below the surface. Morphological adaptations likely complement this foraging strategy in order to both improve dive efficiency and avoid damage on water entry. The shape of the kingfisher's bill has served as inspiration as a drag-reducing structure for the Japanese Shinkansen Bullet train [1,2]. However, these functions have yet to be directly tested.
The conversion of gravitational potential energy to kinetic energy during the dive provides momentum for the bird to overcome body drag and buoyancy in order to dive deeper [3]. Birds are particularly buoyant due to the layer of air trapped between the body and the feathers, typically used for insulation [4], as well as body fat and the avian system of air sacs [5]. In the diving species the lesser scaup (presumably already adapted to reduce drag), over 80% of work during a dive is to overcome the significant costs of body buoyancy [6].
Minimizing the energetic costs of drag has led to streamlined bauplans in swimming and flying animals [7–11]. Bird beaks appear well-adapted to avoid both aerodynamic and hydrodynamic drag. Most beaks are relatively cone-shaped, with a small initial surface area relative to the direction of oncoming flow—thus reducing immediate profile drag. The gradual increase in the cross-sectional area allows flow to remain laminar as it travels toward the wide middle section of the animal.
While much work has focused on how shape influences drag across flying and swimming animals, less work exists examining morphological function at the air–water interface. Diving involves the animal rapidly transitioning between two fluids of different physical properties—from air, a relatively low density and viscosity fluid, to water, a higher density and viscosity fluid. Owing to the high speed of entry, diving comes at the cost of an initial impact at the water's surface. Gannets reportedly dive from a height of 30 m in the air—a fall resulting in a speed of 22 m s−1 when impacting the water [3]. While these impact speeds could seriously damage a human entering feet-first [12], an avian injury due to water entry has not been reported. The neck musculature coupled with streamlined beak and skull help the gannet avoid injury by reducing impact forces [12]. In fact, large decelerations due to water impact during diving may not occur in birds. Accelerometers mounted to free-living Cape gannets sampling at 16–32 Hz detected no or minimal deceleration due to impact during foraging dives [3]. Drag reduction due to morphology may help reduce immediate impact forces. The hydrodynamic shape of the avian bill may also reduce turbulence during the initial dive, which may help avoid visual or vibrational detection by the prey [13].
Recent work examining water piercing by geometric cones [14] leads us to predict that beak morphology may be selected on to reduce impact force, and thus drag on entry. The lower the opening angle of the cone (or the tip angle), the lower the impact forces and more smooth the transition between air and water [14]. The opening angle of a cone (a) can be calculated as a = 2 × arcsin(r/s), where r is the radius of the base, and s is the length of the side from base to tip (also called ‘slant height’). Thus, to decrease the angle of a cone, either the radius of the base (r) must decrease, or the length (s) must increase. If diving species of kingfisher are morphologically adapted to minimize drag, we would expect them to have longer bills with a narrower base relative to terrestrial species.
Kingfishers (Alcedinidae) are an ideal clade in which to explore morphological adaptations for diving. They comprise 114 species that encompass terrestrial, aquatic and mixed (both terrestrial and aquatic) foraging strategies [15], allowing us to test function and morphology in an evolutionary context. Here, we examine beak morphology to elucidate patterns of streamlining in diving species. We test the hydrodynamic properties of bird beak shape by simulating dives with scaled three-dimensional printed plastic models of the birds. Printed models allow us for the first time to isolate shape from size. Lastly, we use computational fluid dynamics (CFD) to explore flow around the beak and head.
2. Material and methods
2.1. Morphometrics
Three-dimensional digital models of bird beaks were generously provided by the Mark My Bird project as three-dimensional scans of specimens housed in the Natural History Museum at Tring and the Manchester Museum (see electronic supplementary material, appendix S1, for museum details and specimen IDs). See information in the appendix of [16] for details pertaining to scanning methodologies. The scans are available for download by request from markmybird.org. The scan of a forest kingfisher (Todiramphus macleayii) was obtained from a specimen in the Bangor University Brambell Natural History Museum. This scan was produced by Rowan Howe at the Pontio Innovation Centre with an Artec Spider (Artec Group, Luxembourg), with a standard resolution of 0.05 mm and mesh resolution of 0.1 mm. Mesh generation was accomplished with Artec Studio 9 (Artec Group, Luxembourg).
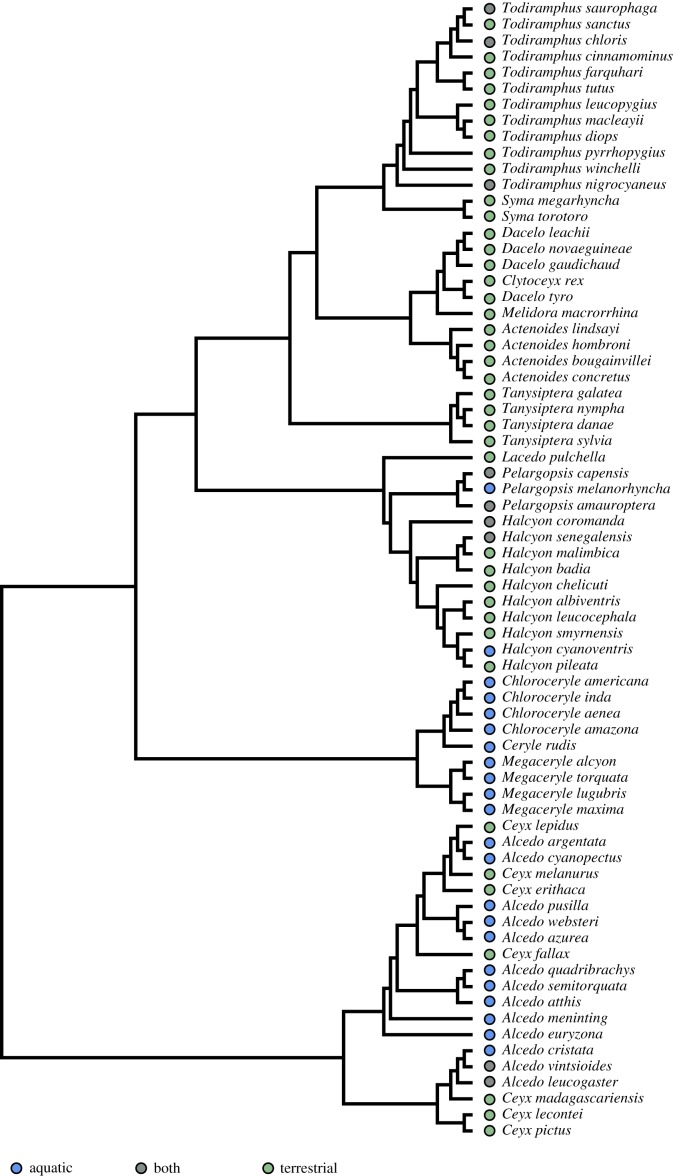
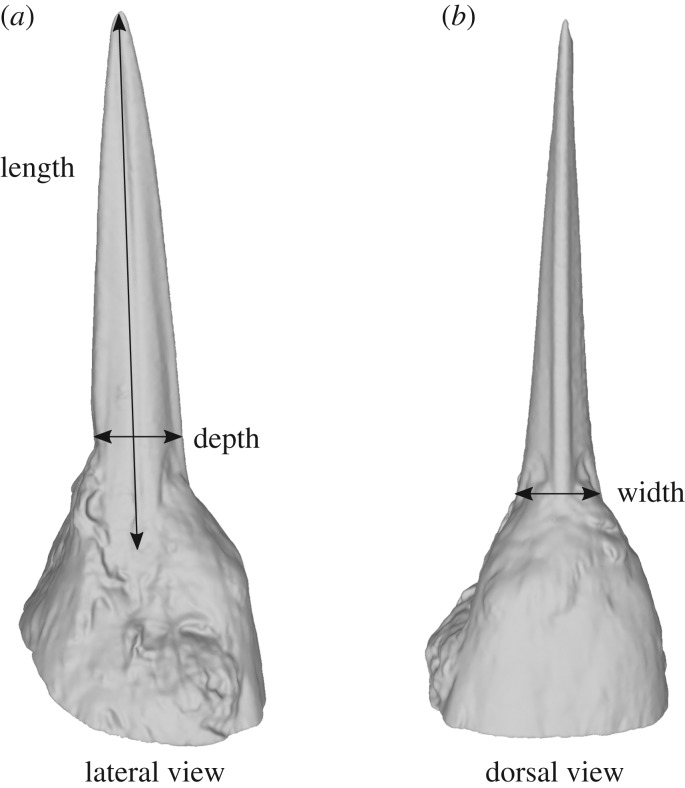
Morphometrics were measured directly from specimen scans, representing 71 species (electronic supplementary material, appendix 1; figure 1). Beak width was measured as the linear distance between either end of the lower and upper mandible external hinge. Beak height was measured from the linear distance between the most dorsal and most ventral points where the beak meets the feathered portion of the head along the sagittal plane. Beak length was measured from the tip of the bill to the end of the mandible hinge (figure 2).
Figure 1.
The phylogeny of 71 kingfishers (Alcedinidae) used for morphometric analysis in this study, constructed as a subsample of Anderson et al. [17]. Coloured circles represent classified foraging group: blue are aquatic foraging (diving) species, grey are mixed (aquatic and terrestrial) and green are terrestrially foraging species. See text for details. (Online version in colour.)
Figure 2.
Morphometric variables collected for each species on the common kingfisher, Alcedo atthis. (a) Lateral view. (b) Dorsal view. Beak length measurements were scaled to 9 cm in all three-dimensional models to standardize for body size. See text for additional details.
The mass of the individual museum specimen prior to preservation is unknown. Body size from the literature was used as an estimation of representative body size for each specimen. Masses for each species were found in the CRC Handbook of Avian Masses [18]. When available, the average mass for a species was used. If the male and female masses were reported separately, the two were averaged for subsequent analyses. Any species for which mass data were not available were excluded from this study.
2.2. Three-dimensional model manufacturing
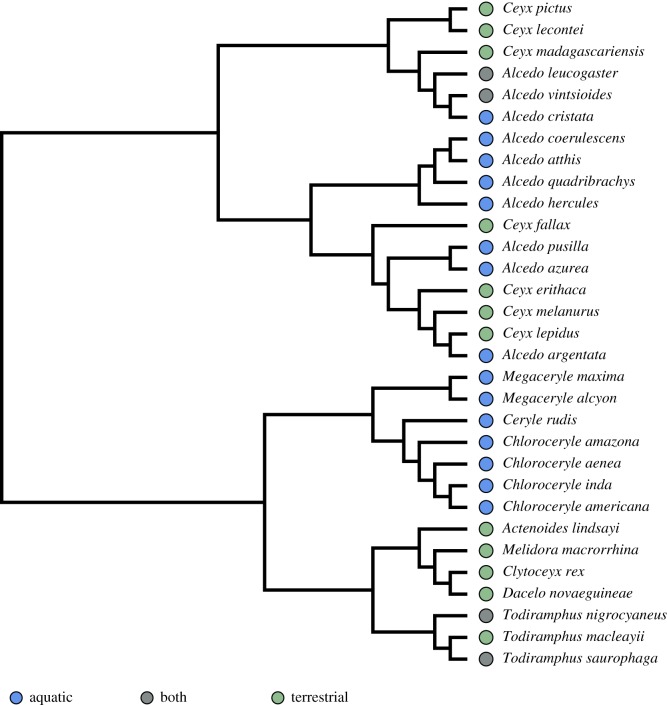
Thirty-one species were subsampled for functional testing, representing a variety of foraging strategies and body sizes across the kingfisher phylogeny (figure 3). One beak model was printed for each of 31 species (electronic supplementary material, appendix 1).
Figure 3.
Phylogeny of 31 species of kingfishers used for performance testing, subsampled from the phylogeny in figure 1 (Anderson et al. [17]). Coloured circles represent classified foraging group: blue are aquatic foraging (diving) species, grey are mixed (aquatic and terrestrial) and green are terrestrially foraging species. (Online version in colour.)
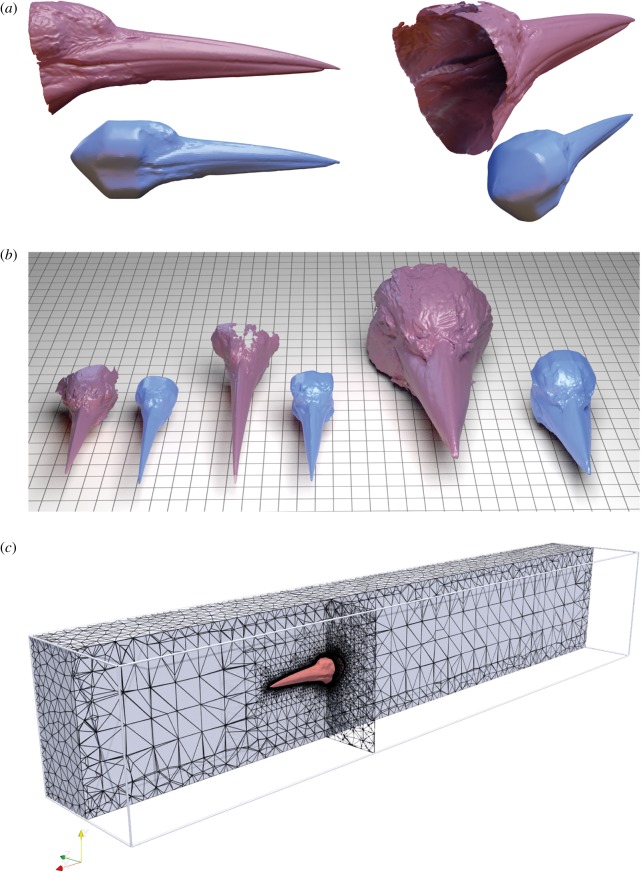
Prior to three-dimensional printing, scans were post-processed in Ultimaker Cura 3 to remove holes. To account for differences in drag due to body size, all scans were geometrically scaled to 9 cm from the tip to the posterior of the beak (figure 2). Scans were finished by a transverse cut across the head of the animal at the end of the beak. This cut allowed us to incorporate the entire morphology of the beak alongside the joint where the beak meets the head.
Three-dimensional prints were produced on an Ultimaker 3+ (Ultimaker, Cambridge, MA, USA) with a 0.4 mm nozzle size. Prints were produced with a layer height of 0.1 mm, infill density of 20% and four gradual infill steps. Beaks were printed with biodegradable plastic polylactic acid filament (RS Components Ltd, Northants, UK).
2.3. Physically simulated dives
Beak models were attached to a closed 50 ml Falcon conical centrifuge tube. The models were mounted to a 9 cm long wooden or plastic dowel to increase the distance between the beak and Falcon tube ‘dive body’, thus minimizing any effects of the tube shape and buoyancy during the initial entry phase of the dive. The tube contained an Axivity AX-3 triaxial accelerometer (Axivity Ltd, Newcastle, UK) sampling at 1600 Hz with a maximum value of ±16 G. The accelerometer was oriented to the beak model with the negative x-axis aligned with gravity, and the positive z-axis oriented dorsally. The Falcon tube was weighted to equalize the weight of every model and support beam to that of the largest model. The mass of each of the total structure including models totalled 71.1 g.
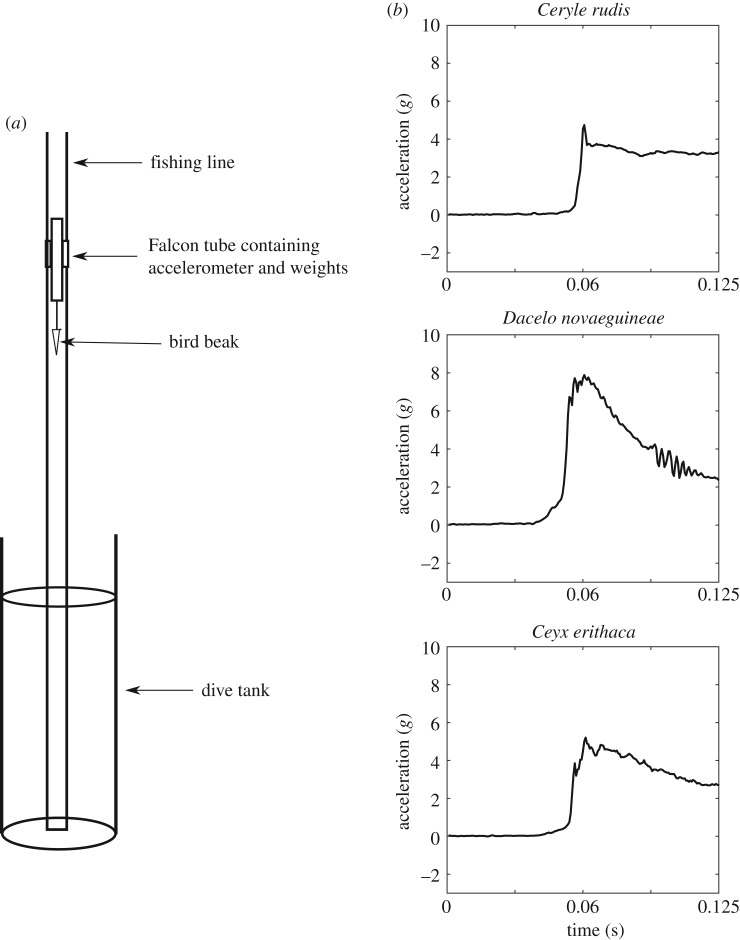
A fishing line track mounted perpendicular to the water surface was used to maintain model orientation during the dive. The tube was fitted with plastic drinking straws on either side lengthwise and threaded on to the fishing line. The dive tank was a 60 cm tall flower vase with an opening of 25 cm (figure 4a). A simulated dive was performed by dropping the model (beak pointed down) into the tank along the fishing wire track from 75 cm above the surface of the water. To confirm acceleration was not impacted by the trackway, and the accelerometer gave a reliable reading, the accelerometer gravity axis during the fall was double integrated, and resulted in the correct 75 cm.
Figure 4.
(a) Diagram of the diving tank set-up. Dive tank was 60 cm tall with an opening of 25 cm. The dive body consists of a 50 ml Falcon tube containing the accelerometer and additional weights as needed. The accelerometer was mounted with the negative x-axis aligned with gravity, and the positive z-axis oriented perpendicular to the bird dorsally. The Falcon tube was fitted with plastic drinking straws on either side, and the straws were threaded along the fishing line to maintain the dive orientation perpendicular to the water surface. (b) Exemplar accelerometer data from three representative species: Ceryle rudis (Pied kingfisher), Dacelo novaeguineae (laughing kookaburra) and Ceyx erithaca (black backed kingfisher). Data are smoothed by taking a running average for 3 points and are truncated before cavitation.
The fishing line maintained orientation of the models vertically, although slight differences in entry angle along the dorsoventral plane were apparent, leading to slight variation in deceleration values. To account for this, 10 drops were performed for each model. All acceleration analyses were done only on the vertical (orthogonal to the water surface) component. All accelerometer outputs were analysed in a custom written Matlab script. For the purposes of this study, only the initial deceleration phase was analysed—the time between when the beak has entered the water and has become fully submerged. At the time of submergence, the model experiences a maximum deceleration (figure 4b).
Any outliers above 3 s.d. were removed from subsequent analyses. Resulting analyses for inter-species comparisons used the average maximum deceleration for each model.
2.4. Statistical analyses
Each species was assigned to a foraging group based on behaviour and diet descriptions in the Handbook of Birds of the World Alive [19]. Three foraging groups were used: terrestrial, aquatic or both. If a species could not be readily assigned to one of these groups, it was not included in the study.
For analyses of morphological characters, in order to meet assumptions of normality and homoscedasticity, all measurements were log-10 transformed prior to analyses. Morphometric characters were tested for size dependence with a linear regression between character and reported body size (all p < 0.01). All three were adjusted for size by regressing log-10 adjusted values against log-10 adjusted body mass and calculating the residuals. The residuals were used for subsequent comparisons. An analysis of variance (ANOVA) tested for differences between foraging groups.
In order to account for phylogenetic effects, a phylogenetic tree was constructed based on Anderson et al. [17] (figure 1). Binomial names according to the Jetz et al. [20] phylogeny were used. Alcedo euryzona was placed as sister taxa to its conspecific A. peninsulae [19]. To explore the relationship between foraging guild and performance, a subsampled phylogeny of the 31 tested species was constructed from the first phylogeny (figure 3). These 31 species were selected to encompass a range of foraging guilds and body sizes across the phylogeny. In both phylogenies, branch lengths were set using arbitrary lengths using a Grafen transformation [21]. We tested for differences in morphology and hydrodynamic function between foraging groups with a phylogenetically corrected ANOVA according to Garland et al.'s method [22]. The phylogenetic ANOVA was implemented via the phytools package in R [23]. Both morphometric and performance phylogenetic ANOVAs were calculated with 10 000 simulations. To elucidate differences between groups, a pairwise post hoc test was performed using a Holm correction.
2.5. Computational fluid dynamics
To simulate flow over the beak and head, a virtual flume was simulated using Autodesk CFD 2019. Digital models of Ceyx, Dacelo and Ceryle were used as representative taxa; two attributed to terrestrial and one to aquatic feeding strategies. To create suitable, watertight meshes for CFD, the scan data were manipulated via a combination of Autodesk Maya 2019 and Autodesk Meshmixer. First, models were aligned to world axes (anterior aligned to +x, dorsal to +y, and right-lateral aligned to +z) and scaled such that beak length equalled 9 cm in all specimens, so as to match the physical models used above and to remove size effects. Models were then cropped posterior to the beak, but anterior to the eye sockets, before holes were filled and the models made solid. A smoothing pass was applied to remove erroneous spikes in the laser scan data or to remove small sharp topography caused by errant feathers when the specimens were scanned. To avoid flow artefacts from a flat surface at the back of the head, the filled surface was extruded and then deformed into a cone-shape consistent with the edges of the head (figure 5a). This avoided any abrupt or complex transitions from a laser scan to reconstructed posterior. The now watertight meshes were then downsampled using InstantMeshes (https://github.com/wjakob/instant-meshes) [24] to approximately 20 000 triangles (figure 5a,b).
Figure 5.
Kingfisher beak models and CFD domain. (a) Original scan data (above), and cleaned, smoothed and scaled model (below) of Ceryle presented in lateral and posterior–lateral views. Models were cropped at the posterior most portion of the beak, then holes were filled, surfaces extruded and final model then smoothed. (b) Original and cleaned meshes for Ceyx, Ceryle and Dacelo, left to right. Grid represents 1 cm squares. (c) Meshed CFD domain. (Online version in colour.)
The downsampled meshes were imported into Autodesk CFD 2019, where simulations were constructed in a similar manner to [25]. A fluid volume was generated around the mesh, so as to create a virtual flume with walls sufficiently far from the mesh to avoid edge effects. Using standard materials in Autodesk CFD, properties of fresh water (density = 998.2 kgm−3, viscosity = 0.001003 Pa s−1) were applied to the fluid volume. Kingfisher models were given properties of ABS polycarbonate, though as the models were stationary and mass-less, the material properties of the kingfisher beaks had little to no impact on results. The anterior end of the flume was set as an input flow of 5 ms−1, approximately the same as for the physical simulations. A zero-pressure boundary condition was applied to the opposing, posterior end allowing flow through the flume at a uniform 5 ms−1. All other fluid boundaries were set to a slip/symmetry condition. Gravity was not included in the simulation. Meshing of the domain was carried out automatically prior to the simulation process (figure 5c). A steady-state simulation was run until convergence, using the SST k-Omega turbulence model. Results were calculated and visualized using Paraview 5.6, and are presented vertically for consistency with physical simulations above. We also calculated the coefficient of drag: Cd = 2F/ρ v2 a2, where ρ = 998.78, v2 is velocity, and a2 is cross-sectional area at the widest point of the model.
3. Results
3.1. Morphology
Diving, terrestrial and both foraging groups differ significantly in beak morphology, but these results are confounded by phylogeny for beak length and depth.
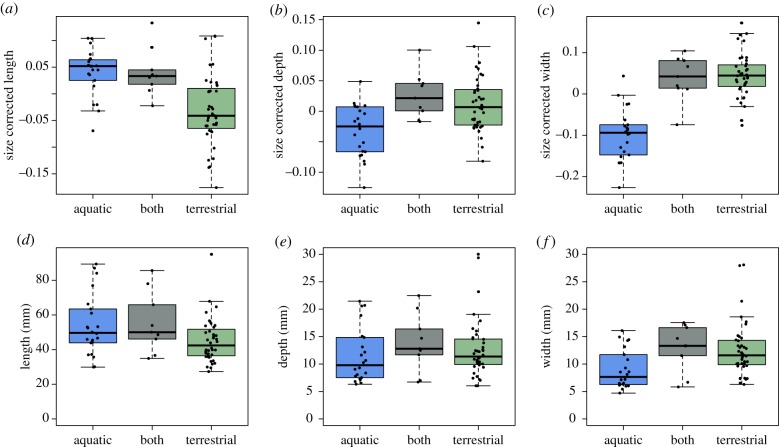
After adjusting for body size, beak length differs between foraging groups (figure 6a; ANOVA F2,68 = 13.67, p < 0.001). Aquatic foraging kingfishers have longer beaks than terrestrial kingfishers (Tukey HSD p < 0.001), but aquatic foragers do not differ from birds that forage in both (p = 0.99). Terrestrial kingfishers have shorter beaks than birds found in the ‘both’ category (p = 0.003). These relationships are confounded by phylogeny—foraging guilds are not statistically significantly different in beak length (phylogenetic ANOVA F = 13.67, p = 0.14).
Figure 6.
(a–c) Residuals of morphological characters regressed against body mass, resulting in size-corrected beak morphometrics for kingfisher species classified as aquatic foragers (blue), mixed foragers (grey), and terrestrial foragers (green). (d–f) Uncorrected measurements for morphological characters (in mm). Size-corrected (a) beak length, (b) beak depth and (c) beak width are all statistically significantly different between foraging guilds (ANOVA F2,68 = 48.97, p < 0.001). Once phylogeny is accounted for, only beak width (c) remains significantly different between size-corrected aquatic and terrestrial species (phylogenetically corrected p < 0.001). (Online version in colour.)
Size-corrected beak depth differs significantly between foraging groups (figure 6b; ANOVA F2,68 = 8.98, p < 0.001). Aquatic foraging birds have shallower bills than terrestrial (p < 0.001) and both (p = 0.003) foraging groups, but terrestrial birds do not differ from birds that forage with both strategies (p = 0.64). These significances are not resilient to phylogeny (phylogenetic ANOVA F = 8.79, p = 0.255).
Lastly, the size-corrected beak width differs between foraging groups (figure 6c; ANOVA F2,68 = 48.97, p < 0.001). Aquatic beaks are narrower than terrestrial (p < 0.001) and both (p < 0.001) groups. Terrestrial beaks do not differ significantly from birds that forage in both methods (p = 0.944). After accounting for phylogenetic relatedness, beak width remains significantly different between groups (phylogenetic ANOVA F = 48.97; p < 0.001). Aquatic beaks remain significantly more narrow than terrestrial (pairwise phylogenetically corrected p < 0.001) and mixed (p = 0.003) foraging groups. Terrestrial species do not differ significantly from birds that forage with both strategies (p = 0.79).
3.2. Performance—physical simulations
Beaks from aquatic foraging species exhibited lower average peak decelerations during water entry than both terrestrial and aquatic–terrestrial foraging species (figure 7; ANOVA F28,2 = 7.645, p = 0.002). Aquatic and terrestrially foraging species' dive decelerations were significantly different (Tukey HSD, p = 0.002), while aquatic (p = 0.92) and terrestrial (p = 0.92) were not significantly different from foraging strategies that used both aquatic and terrestrial styles.
Figure 7.
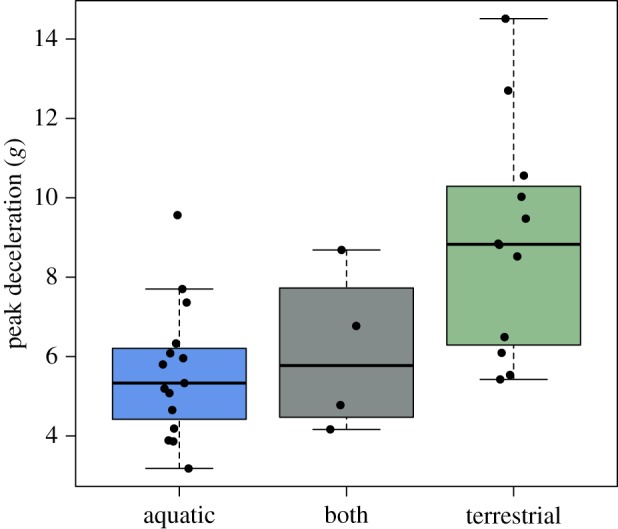
Average peak deceleration values measured for three-dimensional printed scaled models of kingfisher beaks classified as aquatic foragers (blue), mixed foragers (grey) and terrestrial foragers (green). Aquatic and terrestrially foraging species' dive decelerations are significantly different (ANOVA F28,2 = 7.645, p = 0.002, Tukey HSD, p = 0.002). This result is not affected by phylogenetic relatedness (phylogenetic ANOVA, F = 7.64, p = 0.047). (Online version in colour.)
When phylogeny was accounted for, the difference in performance between foraging guilds remains significant (phylogenetic ANOVA, F = 7.64, p = 0.047). However, a pairwise post hoc test with a Holm correction [26] found marginal differences between aquatic and terrestrial foraging groups (p = 0.084), terrestrial and both foraging groups (p = 0.084), and no difference between aquatic and both foraging groups (p = 0.78).
3.3. Performance—computational fluid dynamics
The CFD simulations indicate a higher anterior–posterior drag force in the terrestrially foraging taxa Ceyx erithaca and Dacelo novaeguineae than the aquatic forager Ceryle rudis. However, while this drag force was particularly high in Dacelo (6.86 N, Cd = 0.23), the terrestrial Ceyx (2.98 N, Cd = 0.17) experienced only slightly more drag force than the aquatic Ceryle (2.27 N, Cd = 0.23). The three simulated kingfishers also exhibited differences in dorsoventral drag force. Dacelo and Ceyx both experience force in the negative horizontal direction (i.e. force pushing the head ventrally) of 1.54 N and 0.68 N respectively. The aquatic foraging Ceryle, however, experienced 0.14 N of force in a positive horizontal direction (i.e. a force acting to lift the head). Lateral forces were generally low, as would be expected, but were not zero due to asymmetries in the scan data.
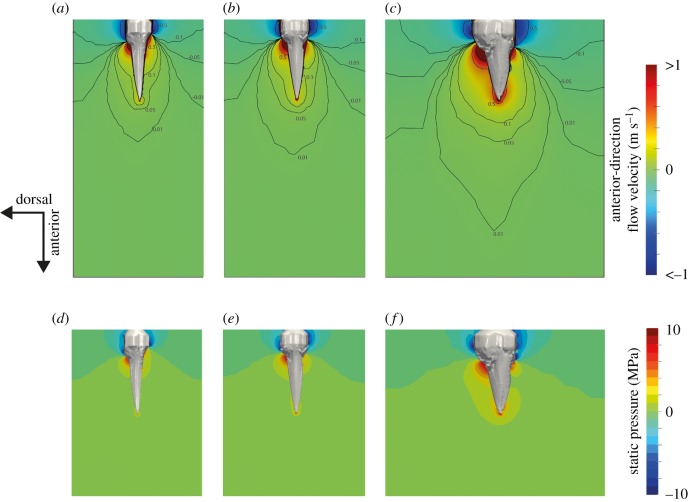
Visualization of fluid velocity indicates that anterior to the head, at the posterior beak, is where the most fluid is pushed forwards, generating pressure (or form) drag. The bow waves are smallest in Ceryle, and then Ceyx, extending only a limited distance in front of the beak. The Dacelo model produces a significant bow wave approximately twice the magnitude of the other models. This is most notable in the extensive areas of water being pushed forwards in front of the tip of the beak (figure 8).
Figure 8.
Water velocity in the anterior–posterior direction in front of the head of (a) Ceryle, (b) Ceyx and (c) Dacelo. Velocity scale is truncated to illustrate areas of high and low velocity. Note the much larger bow wave in front of the highly terrestrial Dacelo. (d–f) Static pressure around (d) Ceryle, (e) Ceyx and (f) Dacelo. (Online version in colour.)
4. Discussion
Our data show that diving kingfishers have morphological adaptations associated with aquatic foraging. Further, aquatic foraging species' beak shapes produce less hydrodynamic drag than terrestrial species, measured as lower peak deceleration during the impact with the water, and as drag force in CFD simulations. Collectively, we find evidence that supports adaptations for improved diving performance in aquatically foraging kingfishers relative to terrestrial and mixed-foraging species. While the exact values for deceleration and drag of our models have been normalized to size and are therefore not directly applicable to individual taxa, they do provide valuable relative information regarding potential selection for drag-reducing shape.
Beak width in aquatically foraging species is less than in terrestrially foraging species. Both length and depth also differ between foraging groups, but these patterns were not significant once phylogeny was taken into consideration. Our study aligns with hydrodynamic expectations based on water piercing studies using geometrically perfect cones [12,14]. Diving species have beaks of lower base width and tend toward longer beaks with lower base depth (figure 6). Additional morphological details not measured in this study likely contribute to dive performance, including the morphology of the head, body and wings of the bird. In Vincent et al.'s [14] recent work, the larger the radius of the cone base (r, corresponding to depth and width on our kingfishers), the higher the initial impact forces, due to increased frontal and surface area [12], which increase both pressure and friction drag, respectively. This suggests that not only the shape of the beak, but the shape of the frontal area of the bird (which is generally wider than the beak) likely plays a role in plunge diving. Our CFD analyses demonstrate that it is the rapid increase of frontal area at the beak–head transition that generates the largest drag forces, and this transition is smoothest in the diving species Ceryle rudis relative to terrestrial species—where a larger volume of water is accelerated in the direction of travel by the beak–head transition (figure 8).
Our CFD models were similar, but not entirely in agreement with our physical experiments. Dacelo novaeguineae's physical model dive force was 107% that of the CFD model (physical model = 7.4 versus CFD = 6.9 N), Ceyx erithaca was 142% (4.2 versus 2.3) and Ceryle rudis was 159% (3.6 versus 2.3). Our CFD analysis was performed on models with hydrodynamically smoothed ends, unlike the physical models mounted to a pole and accelerometer, and was also tested at slightly different velocities (4.5 physical models versus 5 ms−1 CFD). Most notably, the CFD was performed in a closed boundary, simulating movement within water, rather than transitioning between low density (air) and high density (water) fluid. The mechanics of such transitions are complex [14], including cavitation and splash, and are thus difficult to simulate. Thus, our CFD is likely not a precise measure of the initial water entry phase but is useful for comparing general hydrodynamic form between taxa.
Notably, no apparent bow wave, where water is pushed forward in front of the animal [27,28], appears at the tip of the Ceyx or Ceryle kingfisher bills in the CFD simulations (figure 8a,b). However, a notable bow wave does appear at the beak–head joint (figure 8c). The elongated beaks of diving birds, coupled with apparent beak–head streamlined morphologies, may delay the effects of this bow wave long enough to avoid detection by the prey. The larger, highly terrestrial forager Dacelo displayed significantly greater bow waves, both in front of the beak–head joint and even in front of the beak tip, which is broader and deeper than the other two taxa simulated.
Of interest are the resulting dorsoventral drag forces in our CFD results produced by each beak, with the terrestrial forms Ceyx and Dacelo generating forces that push the head ventrally. Ceryle, meanwhile, generated only very small dorsoventral forces, acting in the opposite direction. This may be the result of the more curved beak, in comparison with the straighter beaks of the other two models. The lower forces acting orthogonally to the direction of movement may be necessary for the bird to travel straight when diving into the water. Reducing these dorsoventral forces may be more important during diving, in a more viscous fluid, than in flight through air.
Further work examining the hydrodynamics of living birds may illuminate additional patterns. For example, our study examined only kingfisher dives with closed beaks, with particular interest at the air–water boundary. However, the kingfisher must open the bill to catch prey. At that point, the hydrodynamics of the bird are likely to be very different. CFD modelling of aquatic striking snakes suggests that prey could become dislodged by a bow wave created by the open jaw of the snake [27]. However, the shape of the kingfisher bill, particularly in aquatic foragers, is much longer, and would likely open to a lesser angle, than a striking snake, which may reduce any emergent bow wave. CFD models in aquatic snakes suggest that larger prey sizes can offset the bow wave-induced movements of the prey. Behavioural studies have shown that captive Pied kingfishers tend to select the larger available prey items [29], and the common kingfisher selects prey within a discrete size range of 5–6 cm in length [30]. This size selection may impede the hydrodynamic effects of displacement from the open bill. Size selection could also be due to prey availability, depth [31] or visual limitations, such as contrast or light refraction [32], during foraging.
Selection may act not only on the beak but the entire frontal area of diving birds. Unlike the plunge-diving gannets and terns, the kingfisher neck is notably shorter and the feathers appear to smoothly taper from the head to the body in the dive posture—potentially ensuring an entirely streamlined body. Further work examining entire body morphology in live animals is necessary to better understand the potential for streamlining across species.
While we adjusted the overall shape of the models in order to test questions pertaining to shape, not size, we can use our deceleration values to estimate if the dive itself is enough to overcome buoyancy with a rough calculation. Buoyancy (N) is calculated as Fb = ρ × Vbird × g, where ρ is the change between air and water density (998.78 kg m−3), Vbird is the volume of water displaced by the bird (i.e. the volume of the bird, m3) and g is gravity (9.81 m s−2). As a rough estimate, we can consider a spherical bird with a radius of 6 cm, which would have a buoyancy force of 2.1 N that must be overcome to submerge the bird. Our prints were scaled to the beak length of the largest species in the sample, the diving bird Megaceryle maxima, which weighs 325 g and had a deceleration value of 7.36 m s−2. By F = ma, the impact force of the bird would be 2.392 N—a force larger than the estimated buoyancy of our spherical bird, allowing total submergence. By contrast, the smallest diving species, Alcedo pusilla, has a mass of 13.3 g and had a deceleration value of 5.95 m s−2, resulting in an impact force of 0.43 N—not enough to overcome buoyancy for a 6 cm radius bird. Our calculation of buoyancy force is very rough and does not account for the density of the animal or actual volumes. Diving species may be less buoyant than their terrestrial counterparts in part due to differences in body mass and ability to retain air under feathers [5,33,34], although this has not been tested in kingfishers. Birds can actively adjust their buoyancy by changing the amount of air stored in the respiratory system during a dive [35]. Birds may use leg- or wing-produced thrust to help counter buoyancy during a dive following initial submergence [36,37].
Conflicting evolutionary demands are placed on beaks. For example, a higher mechanical advantage in relation to more leaf-based diets appears to be a primary driver of beak shape in Anseriformes [38]. Shape changes associated with increased bite force in the beaks of Darwin's finches also limit the use of the jaw during song production [39]. Thus, it is important to keep in mind that the beak shapes tested here are likely also under selection for other behaviours, including bite force, burrow excavation or territorial defence. Additionally, morphological variables not measured here likely contribute to aquatic diving performance, including beak surface structure [40] and position of the nares.
In conclusion, we showed that diving kingfishers have narrower beaks and a tendency toward longer and more shallow beaks once phylogeny is accounted for when comparing to terrestrial species. Our physical simulations show that diving species' beak shapes experience markedly less deceleration when entering the water, corroborated by CFD models. This repeated evolution of functionally and morphologically more hydrodynamic beaks across the kingfisher phylogeny suggests convergence on morphology to improve foraging success in diving birds. Our work may help further inspire engineering solutions, including robotics working at the air–water interface.
Supplementary Material
Acknowledgements
The authors extend a sincere thank you to Chris Cooney, Gavin Thomas and the MarkMyBird.org team at Sheffield University for the generous access to the digital three-dimensional models of most of the birds used in this study. We subsequently thank the Manchester Museum, Brambell Museum at Bangor University and the Natural History Museum at Tring for access to original specimens. We also thank the FabLab Pontio Innovation Centre at Bangor University for training, assistance and access to laser scanning and three-dimensional printing technologies: Wyn Griffith, John Story and Sara Roberts. The manuscript was improved thanks to discussions at the 2018 London regional SICB DVM meeting with Dr Jim Usherwood (who suggested modelling buoyancy) and Dr Sam Van Wassenbergh at the 2019 SICB annual meeting (who suggested exploring bow waves). P.L.F. would like to thank Dr Pernille Troelsen for useful discussions regarding CFD software. The authors also wish to thank Charlotte Cannon for assistance with experiments, and Charles Bishop and Tom Brekke for helpful discussions. Lastly, we thank two anonymous reviewers for their insight on a draft of the manuscript.
Data accessibility
Data are available as electronic supplementary material.
Authors' contributions
K.E.C. conceived of the study. K.E.C., R.O.H. and P.L.F. contributed to the design of the study and drafting the manuscript. K.E.C. and R.O.H. acquired the data for the physical tests and performed statistical analyses. P.L.F. carried out computational fluid dynamics analyses. All authors gave final approval for publication and agree to be held accountable for all aspects of the work.
Competing interests
We declare we have no competing interests.
Funding statement
K.E.C. is funded by a Leverhulme Early Career Fellowship.
References
- 1.Wolpert H. 2013. Engineered biomimicry: the world's top Olympians. In Engineered biomimicry (eds A Lakhtakia, RJ Martín-Palma), pp. xix–xxiv. Waltham, MA: Elsevier. [Google Scholar]
- 2.Foo CT, Omar B, Taib I. 2017. Shape optimization of high-speed rail by biomimetic. MATEC Web Conf 135, 00019 ( 10.1051/matecconf/201713500019) [DOI] [Google Scholar]
- 3.Ropert-Coudert Y, Grémillet D, Ryan P, Kato A, Naito Y, Le Maho Y. 2004. Between air and water: the plunge dive of the Cape Gannet Morus capensis. Ibis 146, 281–290. ( 10.1111/j.1474-919x.2003.00250.x) [DOI] [Google Scholar]
- 4.Stephenson R. 1994. Diving energetics in lesser scaup (Aythyta affinis Eyton). J. Exp. Biol. 190, 155–178. [DOI] [PubMed] [Google Scholar]
- 5.Lovvorn JR, Jones DR. 1991. Effects of body size, body fat, and change in pressure with depth on buoyancy and costs of diving in ducks (Aythya spp.). Can. J. Zool. 69, 2879–2887. ( 10.1139/z91-406) [DOI] [Google Scholar]
- 6.Stephenson R, Lovvorn J, Heieis M, Jones D, Blake R. 1989. A hydromechanical estimate of the power requirements of diving and surface swimming in lesser scaup (Aythya affinis). J. Exp. Biol. 147, 507–518. [Google Scholar]
- 7.Hedenstrom A, Liechti F. 2001. Field estimates of body drag coefficient on the basis of dives in passerine birds. J. Exp. Biol. 204, 1167–1175. [DOI] [PubMed] [Google Scholar]
- 8.Feldkamp SD. 1987. Swimming in the California sea lion: morphometrics, drag and energetics. J. Exp. Biol. 131, 117–135. [DOI] [PubMed] [Google Scholar]
- 9.Bannasch R.1993. Drag minimisation on bodies of revolution in nature and engineering. In Proc. Int. Airship Conf., Stuttgart, Germany, 24–25 June 1993, pp. 79–87.
- 10.Bannasch R. 1995. Hydrodynamics of penguins—an experimental approach. In The penguins: ecology and management (eds P Dann, I Norman, P Reily), pp. 141–176. Chipping Norton, Australia: Surrey Beatty & Sons. [Google Scholar]
- 11.Lovvorn J, Liggins GA, Borstad MH, Calisal SM, Mikkelsen J. 2001. Hydrodynamic drag of diving birds: effects of body size, body shape and feathers at steady speeds. J. Exp. Biol. 204, 1547–1557. [DOI] [PubMed] [Google Scholar]
- 12.Chang B, Croson M, Straker L, Gart S, Dove C, Gerwin J, Jung S. 2016. How seabirds plunge-dive without injuries. Proc. Natl Acad. Sci. USA 113, 12 006–12 011. ( 10.1073/pnas.1608628113) [DOI] [PMC free article] [PubMed] [Google Scholar]
- 13.Katzir G, Camhi JM. 1993. Escape response of black mollies (Poecilia sphenops) to predatory dives of a pied kingfisher (Ceryle rudis). Copeia 1993, 549–553. ( 10.2307/1447160) [DOI] [Google Scholar]
- 14.Vincent L, Xiao T, Yohann D, Jung S, Kanso E. 2018. Dynamics of water entry. J. Fluid Mech. 846, 508–535. ( 10.1017/jfm.2018.273) [DOI] [Google Scholar]
- 15.Fry CH, Fry K. 2010. Kingfishers, bee-eaters and rollers. London, UK: A&C Black. [Google Scholar]
- 16.Cooney CR, Bright JA, Capp EJ, Chira AM, Hughes EC, Moody CJ. 2017. Mega-evolutionary dynamics of the adaptive radiation of birds. Nature 542, 344–347. ( 10.1038/nature21074) [DOI] [PMC free article] [PubMed] [Google Scholar]
- 17.Andersen MJ, McCullough JM, Mauck WM III, Smith BT, Moyle RG. 2018. A phylogeny of kingfishers reveals an Indomalayan origin and elevated rates of diversification on oceanic islands. J. Biogeogr. 45, 269–281. ( 10.1111/jbi.13139) [DOI] [Google Scholar]
- 18.Dunning JB., Jr 2007. CRC handbook of avian body masses. Boca Raton, FL: CRC Press. [Google Scholar]
- 19.del Hoyo J, Elliot A, Sargatal J, Christie D, de Juana E. 2018. Handbook of the birds of the world alive. Barcelona, Spain: Lynx Edicions. [Google Scholar]
- 20.Jetz W, Thomas G, Joy J, Hartmann K, Mooers A. 2012. The global diversity of birds in space and time. Nature 491, 444–448. ( 10.1038/nature11631) [DOI] [PubMed] [Google Scholar]
- 21.Grafen A. 1989. The phylogenetic regression. Phil. Trans. R. Soc. Lond. B 326, 119–157. ( 10.1098/rstb.1989.0106) [DOI] [PubMed] [Google Scholar]
- 22.Garland T Jr, Dickerman AW, Janis CM, Jones JA. 1993. Phylogenetic analysis of covariance by computer simulation. Syst. Biol. 42, 265–292. ( 10.1093/sysbio/42.3.265) [DOI] [Google Scholar]
- 23.Revell LJ. 2012. phytools: an R package for phylogenetic comparative biology (and other things). Methods Ecol. Evol. 3, 217–223. ( 10.1111/j.2041-210X.2011.00169.x) [DOI] [Google Scholar]
- 24.Jakob W, Tarini M, Panozzo D, Sorkine-Hornung O. 2015. Instant field-aligned meshes. ACM Trans. Graph. 34, 189 ( 10.1145/2816795.2818078) [DOI] [Google Scholar]
- 25.Troelsen P, Wilkinson D, Seddighi M, Allanson D, Falkingham P. Functional morphology and hydrodynamics of plesiosaur necks: does size matter? J. Vertebr. Paleontol. In press. [Google Scholar]
- 26.Holm S. 1979. A simple sequentially rejective multiple test procedure. Scand. J. Stat. 1, 65–70. [Google Scholar]
- 27.Van Wassenbergh S, Brecko J, Aerts P, Stouten I, Vanheusden G, Camps A, Van Damme R, Herral A. 2009. Hydrodynamic constraints on prey-capture performance in forward-striking snakes. J. R. Soc. Interface 7, 773–785. ( 10.1098/rsif.2009.0385) [DOI] [PMC free article] [PubMed] [Google Scholar]
- 28.Herrel A, Vincent S, Alfaro M, Van Wassenbergh S, Vanhooydonck B, Irschick D. 2008. Morphological convergence as a consequence of extreme functional demands: examples from the feeding system of natricine snakes. J. Evol. Biol. 21, 1438–1448. ( 10.1111/j.1420-9101.2008.01552.x) [DOI] [PubMed] [Google Scholar]
- 29.Labinger Z, Katzir G, Benjamini Y. 1991. Prey size choice by captive pied kingfishers, Ceryle rudis L. Anim. Behav. 42, 969–975. ( 10.1016/S0003-3472(05)80149-6) [DOI] [Google Scholar]
- 30.Vilches A, Miranda R, Arizaga J. 2012. Fish prey selection by the Common Kingfisher Alcedo atthis in Northern Iberia. Acta Ornithol. 47, 167–175. ( 10.3161/000164512X662278) [DOI] [Google Scholar]
- 31.Vilches A, Arizaga J, Salvo I, Miranda R. 2013. An experimental evaluation of the influence of water depth and bottom color on the common kingfisher's foraging performance. Behav. Process. 98, 25–30. ( 10.1016/j.beproc.2013.04.012) [DOI] [PubMed] [Google Scholar]
- 32.Katzir G, Lotem A, Intrator N. 1989. Stationary underwater prey missed by reef herons, Egretta gularis: head position and light refraction at the moment of strike. J. Comp. Physiol. A 165, 573–576. ( 10.1007/BF00611243) [DOI] [Google Scholar]
- 33.Dove CJ, Agreda A. 2007. Differences in plumulaceous feather characters of dabbling and diving ducks. Condor 109, 192–199. ( 10.1650/0010-5422(2007)109[192:DIPFCO]2.0.CO;2) [DOI] [Google Scholar]
- 34.Lovvorn JR, Jones DR. 1994. Biomechanical conflicts between adaptations for diving and aerial flight in estuarine birds. Estuaries 17, 62 ( 10.2307/1352335) [DOI] [Google Scholar]
- 35.Sato K, et al. 2002. Buoyancy and maximal diving depth in penguins: do they control inhaling air volume? J. Exp. Biol. 205, 1189–1197. [DOI] [PubMed] [Google Scholar]
- 36.Ribak G, Weihs D, Arad Z. 2004. How do cormorants counter buoyancy during submerged swimming? J. Exp. Biol. 207, 2101–2114. ( 10.1242/jeb.00997) [DOI] [PubMed] [Google Scholar]
- 37.Clifton GT, Biewener AA. 2018. Foot-propelled swimming kinematics and turning strategies in common loons. J. Exp. Biol. 221, jeb168831 ( 10.1242/jeb.168831) [DOI] [PubMed] [Google Scholar]
- 38.Olsen AM. 2017. Feeding ecology is the primary driver of beak shape diversification in waterfowl. Funct. Ecol. 31, 1985–1995. ( 10.1111/1365-2435.12890) [DOI] [Google Scholar]
- 39.Herrel A, Podos J, Vanhooydonck B, Hendry A. 2009. Force–velocity trade-off in Darwin's finch jaw function: a biomechanical basis for ecological speciation? Funct. Ecol. 23, 119–125. ( 10.1111/j.1365-2435.2008.01494.x) [DOI] [Google Scholar]
- 40.Martin S, Bhushan B. 2016. Discovery of riblets in a bird beak (Rynchops) for low fluid drag. J. Phil. Trans. R. Soc. A 374, 20160134 ( 10.1098/rsta.2016.0134) [DOI] [PMC free article] [PubMed] [Google Scholar]
Associated Data
This section collects any data citations, data availability statements, or supplementary materials included in this article.
Supplementary Materials
Data Availability Statement
Data are available as electronic supplementary material.


