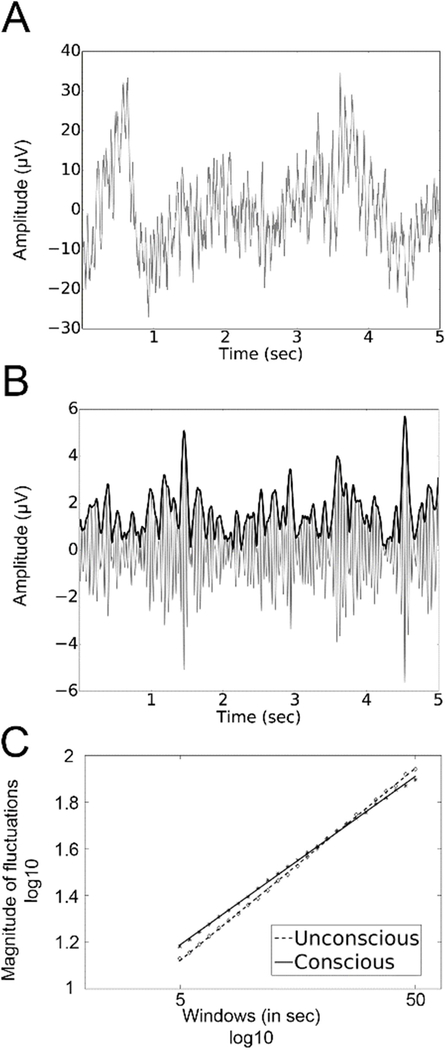
Figure 2. Estimating scaling behavior in oscillatory amplitude using DFA.
(A) A 5-second sample of raw signal from electrode Cz. (B) The filtered signal (continuous grey line) and instantaneous amplitude (bold black line) of neuronal oscillations in the beta frequency range. (C). The DFA method measures the root-mean-square fluctuation of the integrated and linearly detrended signals as a function of time-window size. The slope of the fluctuation function for consciousness (continuous line) and unconsciousness (dotted line) for all subject on electrode Cz

