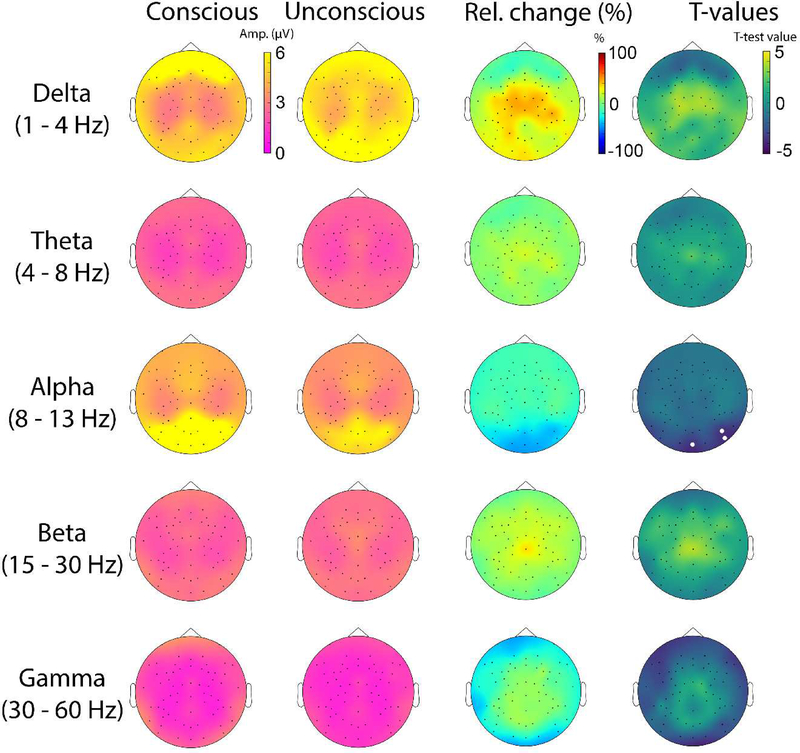
Figure 4.
Topographical plots showing the spatial distribution of mean values for delta, theta, alpha, beta and gamma amplitudes for conscious and unconscious conditions, and the percent relative change (Relative = [Unconsc-Consc]/Consc). Topographical maps of statistical differences between consciousness and unconsciousness at the group level are also shown. White dots represent the statistical significance derived for the sample size using exhaustive permutations corrected with maximum statistics at p<0.05.

