Abstract
Introduction
In Ghana, trans‐abdominal ultrasonography is the main sonographic method of prostatic volume evaluation. The examinations are done when the patient's bladder is full. However, the delay and the discomforting experiences associated with a full bladder have been well documented. In an attempt to investigate other less discomforting options, this study was undertaken to determine if sonographic transabdominal prostatic evaluations performed at urinary bladder volumes of 50–99 mL differ significantly to evaluations done at volumes of 100–199, 200–299 and 300–399 mL.
Methods
A prostatic study of adult patients was undertaken in Accra, from 2014 to 2015. Using an ultrasound machine, 79 sets of prostatic measurements were recorded at a urinary bladder volume of 50–99 mL (V1 as our reference volume), and at least one of three other urinary bladder volumes (V2 = 100–199 mL, V3 = 200–299 mL and V4 = 300–399 mL), in 66 males. Twelve of the participants had multiple sets of prostate volume measurements. SPSS was used to analyse the data. T‐test, Bland‐Altman plots and linear regression were used to compare and test for the existence of proportional biases in measurements.
Results
There was a statistically significant difference in prostatic volumes recorded at V1 and V2 (P = 0.017). However, the prostatic volume differences recorded for V1/V3, and V1/V4 groups of data were all not statistically significant (P > 0.05). The limits of agreement for the set of measurements spread from approximately −29 to +18 mL for V1/V2, −48 to +36 mL for V1/V3 and −12 to +12 mL for V1/V4 variables. There was no proportional bias in the V1/V2 (P = 0.55) and V1/V4 (P = 0.463) measurements.
Conclusion
Urinary bladder volume of 50–99 mL produces prostatic volume measurements comparable to volumes measured in patients with a full (300–399 mL), or nearly full urinary bladder (200–299 mL). A urinary bladder volume of 50–99 mL may therefore be adequate for scanning the prostate gland, and is likely to be tolerated much better by patients.
Keywords: Hypertrophy, prostate, sonography, urinary‐tract
Introduction
Prostate scanning is commonly requested by physicians for male patients above the age of 40 years for both diagnostic and screening purposes.1 The accurate determination of prostatic volume is important in determining the degree of hyperplastic enlargement, the resultant tendency toward urinary‐tract outflow obstruction, and the preferred surgical treatment option. It is also important in determining which prostatic cancer patients are suitable for brachytherapy, as prostates with volumes above 50 mL are usually excluded.2, 3 Whilst other non‐ionising imaging methods such as magnetic resonance imaging (MRI) are expensive and not readily available, others such as digital rectal examination (DRE) are inadequate for prostate size determination, and produce inaccurate measurements with increasing prostate sizes.2, 3 Prostate‐specific antigen density has been found to be a significant predictor of adverse pathological features and recurrence in prostate cancer. Since this density is calculated by dividing the serum prostate‐specific antigen level by the prostate volume, accurate determination of prostatic volume is necessary.4 Available literature for transabdominal prostatic scanning instructs scanning to be conducted with the urinary bladder full, and the transducer angled 15° toward the feet.5
In Ghana, trans‐abdominal ultrasonography (TAUS) is likely the main sonographic method of prostatic volume evaluation. This may be due to the higher cost to service providers involved in purchasing a dedicated transrectal ultrasonography (TRUS) transducer when compared to the few numbers of prostatic scan referrals likely to be received in a year, even though transrectal measurements are considered the gold standard for measuring prostatic volume. Some studies6, 7 have shown a good correlation between TAUS and TRUS. Currently in Ghana, using this method of prostate volume evaluation has required patients to be scanned with a full urinary bladder. This often creates some inconvenience for elderly patients who are unable to hold urine for long periods while the study is being conducted, or while waiting for their turn to be scanned. Patients are unable to hold their urine, and have to bear the inconvenience of wet clothes and the pungent smell while waiting for their report after the study, and during the journey back home. For some the journey home is by public transport, thereby compounding their embarrassment. Our experience over the past 13 years has shown that the prostate can often be adequately visualised and measured with smaller urinary bladder volumes (150 mL or less) than the full bladder (300–400 mL) stated in available instruction manuals. This fact has been partly confirmed by Bapat et al.1 They showed that a minimal urinary bladder volume of 100–200 mL is essential for near accurate estimation of prostate volume by TAUS. The study also revealed that with increasing bladder volume, the volume of the prostate increases disproportionately to its actual volume.1 A study has also recorded inaccurate prostatic volume measurements during TRUS with volumes being underestimated 80% of the time by greater than 30% in 55% of the patients studied.8 Other studies also show a high correlation between suprapubic TAUS measurements and post‐operative specimen weight, as well as with TRUS.6, 7, 8, 9 Volume calculations using MRI have also been suggested as alternatives but this will be rather expensive for most individuals in developing nations, especially in sub‐Saharan Africa.2, 6, 7, 8, 9
Published guidelines state that urethrocystoscopy or transabdominal bladder/prostate ultrasonography can help surgeons plan prostate surgery or balloon dilatation, by determining prostate size and configuration, and recommend them as appropriate tests to conduct in this setting.10 Though TRUS is considered the most accurate sonographic method of measuring prostate size, due to setbacks such as its cost, unavailability, invasiveness, low pain threshold of some patients with pelvic pain, anal fissure, haemorrhoids and anal fistulae, TAUS is a more commonly used modality and choice for prostatic scanning.6, 11
This current study aimed to determine if sonographic transabdominal prostatic evaluations performed at urinary bladder volumes of 50–99 mL differ significantly to evaluations done at volumes of 100–199, 200–299 and 300–399 mL.
Method
This was a prospective study of adult males aged 18 years and older, who reported for transabdominal pelvic and abdominopelvic ultrasonography for either screening or diagnostic evaluations in an imaging facility in Accra, Ghana from 2014 to 2015. Prior to the study an ethical approval was obtained from the Ethics and Review Committee of the hospital where the study took place. The analytical tool used in the study was an ultrasound machine and all adult males who reported for prostatic evaluation were included in the study, regardless of the prostatic pathology, which included benign prostatic hyperplasia (BPH), prostate cancer, prostatitis, urine retention or incontinence and urolithiasis. The minimal sample size needed for this study was determined with a STATA software version 11. The software command “sampsi 04, sd(4) a(0.05) p(0.80)” was used. The 0.4 represented the effect value desirable to detect a difference in response. The effect value was chosen based on Bapat et al.'s1 study. The a(0.05) represented 95% confidence level while the p(0.80) represented 80% power for estimating sample size for hypothesis testing. From the software, 32 samples (16 for control and another 16 for test) were considered the smallest desirable sample size. Subsequently, 66 participants were conveniently selected.
The procedure was explained to the patients, following which informed consent was obtained from all patients to anonymously include their data in future studies, in compliance with the Helsinki declaration. The inclusion criterion was all males (symptomatic and asymptomatic) aged 18 years and above. The patients were asked to drink between 1.2–1.5 L of water prior to evaluation. They were scanned at intervals of (15, 25, 35 and 45) min after drinking the water for the study in order to achieve approximate urinary bladder volumes of 50–99 mL (V1), 100–199 mL (V2), 200–299 mL (V3) and 300–399 mL (V4). Each patient's prostate was assessed when the VI was achieved and then asked to wait for subsequent scans at other bladder volumes (V2, V3, and V4). However, since the bladder filled at different times in different patients, not all the other volumes (V2, V3, and V4) were achieved in each patient for all the participants. In some patients a set of V1 and V2 were achieved while in other patients a set of V1 and V3 or V4 measurements were recorded. We defined a set of prostatic measurements as two prostate volume recordings in the same individual, with one recording done at a urinary bladder volume of V1, and the other done at a urinary bladder volume of V2, V3 or V4. In total, 79 sets of measurements were made. Fifty‐four males had single sets of measurements. Twelve males had multiple sets of prostatic volume measurements as follows: nine men had two sets of measurements (V1/V2 and V1/V3), one man had two sets of measurements (V1/V3 and V1/V4), one man had two sets of measurements (V1/V2 and V1/V4) and one man had three sets of measurements (V1/V2, V1/V3 and V1/V4). Depending on whether the set recorded was comparing V1 to V2, V3 or V4, three different comparative groups were formed as follows: a V1–V2 group consisting of 31 prostatic volume sets, a V1–V3 group consisting of 30 prostatic volume sets and a V1–V4 group consisting of 18 prostatic volume sets.
During the scan, the urinary bladder and prostatic volumes were determined using the ellipsoid volume formula (antero‐posterior × cranio‐caudal × transverse) dimensions × 0.52, by scanning both structures in the longitudinal and transverse planes to obtain the maximum dimensions of the two organs. The ultrasound machine used was a SS5000 Sonoscape doppler ultrasound machine, with a 3.5–5.5 MHz multifrequency curvilinear transducer. The evaluations were done independently by two qualified radiologists with over 8 years experience in transabdominal abdominopelvic sonography. Each radiologist performed the scan and made at least two sets of prostatic volume measurements for the same patient at different urinary bladder volumes without zooming the images in all cases. Each set of measurements consisted of measuring the length‐L (cranio‐caudal distance) and height‐H (antero‐posterior distance) on a sagittal image, and the breadth‐B (axial distance) in the transverse image. When the appropriate images were obtained during the pelvic scan (in terms of the prostate and urinary bladder length, breadth and height), the images were paused on the ultrasound machine screen, and the length, breadth and height were measured with electronic callipers on the equipment. The three linear measurements and the volume, calculated automatically by the ultrasound unit, were displayed on the unit's monitor. The displayed images were printed onto a Sony HD sonographic film as hard copy pictures with all the measurements and a picture of the prostate and urinary bladder. Data were recorded in a manner to ensure absolute anonymity of all individuals included in the study. The data were transferred to the same excel spreadsheet on a computer after each examination by the radiologists.
Prior to this, inter‐rater agreement between the radiologists was calculated using kappa on a scale which ranged from 0 (no agreement) to 1 (total agreement). To measure the inter‐rater agreement, random selection of 15 patients who had been assessed by the first consultant radiologist were scanned blindly by the second consultant radiologist and vice versa. The results were then compared and kappa was then found to be 0.89 which was considered very good.
Statistical package for social sciences (SPSS) version 24 was used to analyse the data and a P < 0.05 was interpreted as significant. Since the data obtained in the various groups were mostly from different individuals (54 of the 66 males in the study had single sets of measurements, either V1/V2, V1/V3 or V1/V4), the mean of the prostate volume at V1 for each group was found separately, and the mean for prostate volumes recorded at V2, V3 and V4 were also determined. A histogram analysis of the data which showed a normal distribution of the variables of each group led to the use of a paired‐sample t‐test to compare prostate volumes in each group. To test for any possible relationship of the discrepancies between the measurements and the true values (or test for existence of proportional bias), Bland‐Altman plots12 and subsequently linear regression analyses were undertaken. The Bland‐Altman plot analysis is a simple way to assess a bias between the mean differences, and to estimate an agreement interval, within which 95% of the differences of the second method, compared to the first one, fall.12, 13 To utilise the Bland‐Altman plots, the difference in measurements between each data set were plotted against the mean values, and the upper and lower 95% confidence levels were derived.12
Results
Table 1 shows the prostatic volumes measured at VI and V2 and a comparative analysis indicates that there was a statistically significant difference (P = 0.017) between the prostatic volumes measured at V1 and V2. Table 2 also shows the prostatic volumes measured at VI and V3, however, no statistically significant difference (P = 0.124) between the prostatic volumes at V1 and V3 was observed in a comparative analysis. Table 3 also indicates the prostatic volumes measured at VI and V4. The comparative analysis showed no statistically significant difference between the prostatic volumes measured at V1 and V4 (P = 0.899). Figures 1 and 2 indicate pelvic ultrasound examinations done with urine volumes and their corresponding prostate volumes while Figure 3 shows the difference in prostate volume measured at urinary bladder V1 versus V2, V3, V4. A chart comparing percentage volume difference of prostate measurements taken at urinary bladder volumes of V1 versus V2, V3, V4 is also presented as Figure 4. Bland‐Altman plots undertaken for V1 versus V2, V3, V4 are displayed in Figures 5, 6, 7, and the corresponding linear regressional analyses are presented in Table 4. On the Bland‐Altman plot for measurements undertaken for V1 and V2, the limits of agreement spread from approximately −29 to +18 mL. In the case of measurements undertaken at V1 and V3 the limits of agreement spread from approximately −48 to +36 mL, while for V1 and V4 the limits of agreement spread from approximately −12 to +12 mL.
Table 1.
Comparison of prostate volume at bladder volume V1 and V2
| Number of cases | Prostatic volume(mL) at 50–99 mL urine volume (V1a) | Prostatic volume(mL) at 100–199 mL urine volume (V2) | Volume diff/mL V1a–V2 |
|---|---|---|---|
| 1. | 16.08 | 15.79 | 0.29 |
| 2. | 67.61 | 80.09 | −12.48 |
| 3. | 22.98 | 22.55 | 0.43 |
| 4. | 40.48 | 41.22 | −0.74 |
| 5. | 76.82 | 98.69 | −21.87 |
| 6. | 26.86 | 24.82 | 2.04 |
| 7. | 82.03 | 105.68 | −23.65 |
| 8. | 23.67 | 24.00 | −0.33 |
| 9. | 31.00 | 21.00 | 10 |
| 10. | 117.02 | 141.15 | −24.13 |
| 11. | 28.37 | 32.13 | −3.76 |
| 12. | 41.45 | 59.66 | −18.21 |
| 13. | 86.37 | 92.03 | −5.66 |
| 14. | 36.45 | 38.67 | −2.22 |
| 15. | 22.8 | 31.90 | −9.1 |
| 16. | 23.59 | 17.96 | 5.63 |
| 17. | 53.10 | 59.2 | −6.1 |
| 18. | 43.60 | 32.0 | 11.6 |
| 19. | 50.1 | 57.5 | −7.4 |
| 20. | 25.5 | 26.8 | −1.3 |
| 21. | 67.8 | 69.7 | −1.9 |
| 22. | 73.57 | 75.0 | −1.43 |
| 23. | 40.86 | 61.20 | −20.34 |
| 24. | 34.59 | 37.42 | −2.83 |
| 25. | 54.04 | 90.75 | −36.71 |
| 26. | 23.83 | 39.18 | −15.35 |
| 27. | 23.36 | 25.79 | −2.43 |
| 28. | 121.96 | 101.76 | 20.2 |
| 29. | 59.63 | 47.33 | 12.3 |
| 30. | 55.13 | 57.08 | −1.95 |
| 31. | 46.80 | 60.20 | −13.4 |
| Mean | 48.95 | 54.46 | P = 0.017 |
Table 2.
Comparison of prostate volume at bladder volume V1 and V3
| Number of cases | Prostatic volume(mL) at 50–99 mL urine volume (V1b) | Prostatic volume (mL) at 200–299 mL urine volume (V3) | Volume diff/mL V1b–V3 |
|---|---|---|---|
| 1. | 36.39 | 38.97 | −2.58 |
| 2. | 67.61 | 70.54 | −2.93 |
| 3. | 26.86 | 24.32 | 2.54 |
| 4. | 34.10 | 28.02 | 6.08 |
| 5. | 14.01 | 16.58 | −2.57 |
| 6. | 30.34 | 27.96 | 2.38 |
| 7. | 42.36 | 42.76 | −0.4 |
| 8. | 82.03 | 111.64 | −29.61 |
| 9. | 14.34 | 16.39 | −2.05 |
| 10. | 26.28 | 24.00 | 2.28 |
| 11. | 44.92 | 55.03 | −10.11 |
| 12. | 31.00 | 19.00 | 12 |
| 13. | 117.02 | 149.23 | −32.21 |
| 14. | 28.37 | 37.69 | −9.32 |
| 15. | 31.12 | 29.61 | 1.51 |
| 16. | 27.64 | 23.18 | 4.46 |
| 17. | 22.24 | 27.00 | −4.76 |
| 18. | 41.20 | 31.38 | 9.82 |
| 19. | 30.14 | 23.61 | 6.53 |
| 20. | 64.01 | 63.24 | 0.77 |
| 21. | 69.25 | 65.22 | 4.03 |
| 22. | 62.29 | 63.50 | −1.21 |
| 23. | 25.50 | 28.20 | −2.7 |
| 24. | 67.80 | 75.30 | −7.5 |
| 25. | 63.30 | 169.90 | −106.6 |
| 26. | 40.86 | 63.20 | −22.34 |
| 27. | 23.83 | 22.04 | 1.79 |
| 28. | 40.12 | 38.49 | 1.63 |
| 29. | 41.40 | 41.16 | 0.24 |
| 30. | 32.60 | 37.80 | −5.2 |
| Mean | 42.63 | 48.83 | P = 0.124 |
Table 3.
Comparison of prostate volume at bladder volume V1 and V4
| Number of cases | Prostatic volume(mL) at 50–99 mL urine volume (V1c) | Prostatic volume (mL) at 300–399 mL urine volume (V4) | Volume diff/mL V1c–V4 |
|---|---|---|---|
| 1. | 14.66 | 18.63 | −3.97 |
| 2. | 31.99 | 32.34 | −0.35 |
| 3. | 23.67 | 19.86 | 3.81 |
| 4. | 17.30 | 14.31 | 2.99 |
| 5. | 36.36 | 36.06 | 0.3 |
| 6. | 26.72 | 42.40 | −15.68 |
| 7. | 62.35 | 61.10 | 1.25 |
| 8. | 31.47 | 31.22 | 0.25 |
| 9. | 26.86 | 24.32 | 2.54 |
| 10. | 14.34 | 16.06 | −1.72 |
| 11. | 27.35 | 22.38 | 4.97 |
| 12. | 23.36 | 24.70 | −1.34 |
| 13. | 23.68 | 27.74 | −4.06 |
| 14. | 38.70 | 36.46 | 2.24 |
| 15. | 33.30 | 17.49 | 15.81 |
| 16. | 36.43 | 36.39 | 0.04 |
| 17. | 33.40 | 32.60 | 0.8 |
| 18. | 63.90 | 68.50 | −4.6 |
| Mean | 31.44 | 31.25 | P = 0.899 |
Figure 1.
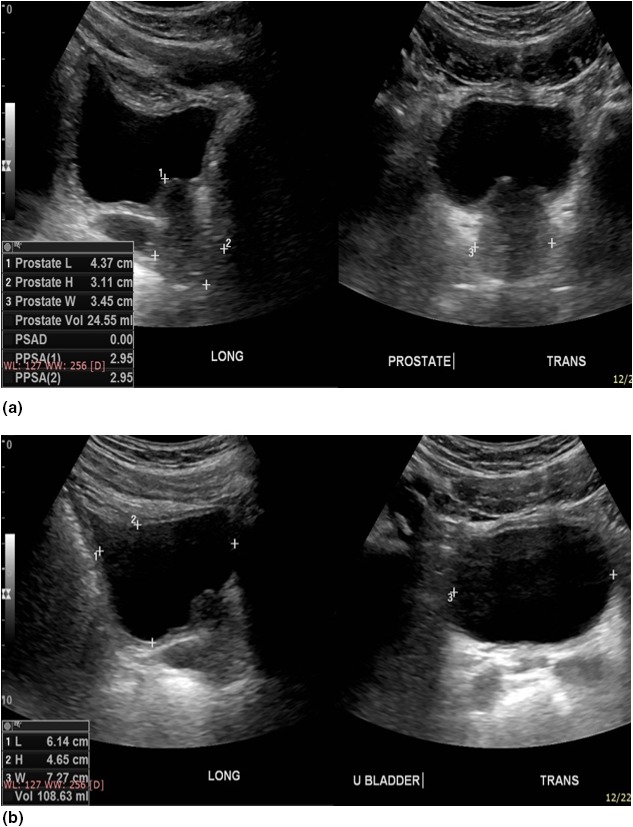
Pelvic ultrasound done with a urine volume of 108.6 mL shows a prostate volume of 24.5 mL. The images on the left are both longitudinal whilst the images on the right are transverse. The margins of the prostate are well demonstrated in image (A) for optimum prostate volume measurement, whilst the urinary bladder is well‐centred in image (B) for optimum urine volume measurement. Three pairs of callipers 1+, 2+ are shown on the longitudinal image for the cranio‐caudal and antero‐posterior images, and 3+ for the transverse measurements.
Figure 2.
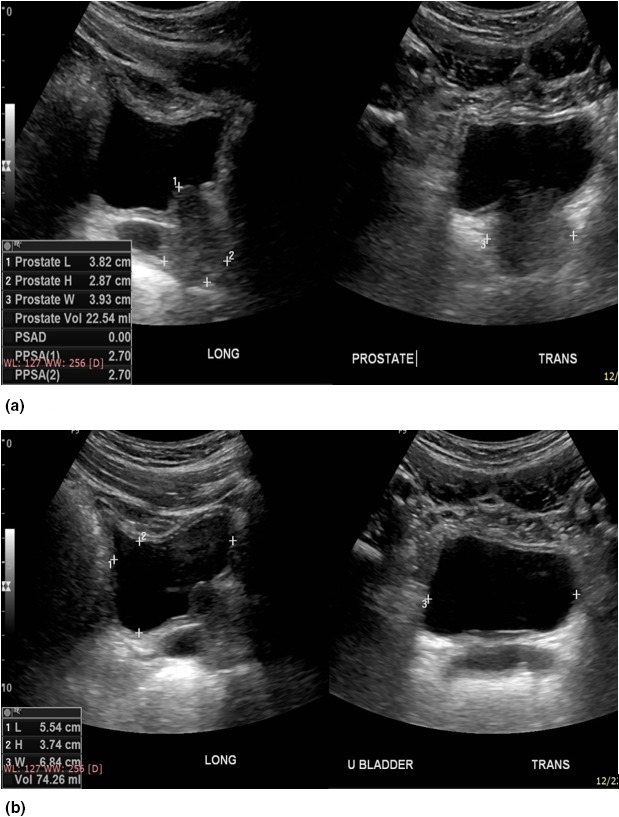
Pelvic ultrasound of the same patient in Figure 1, done with a urine volume of 74.3 mL shows a prostate volume of 22.5 mL. The images on the left of Figure 2 are the longitudinal images whilst the images on the right are transverse images. The margins of the prostate are again well demonstrated in image (A) for optimum prostate volume measurement, whilst the urinary bladder is well‐centred in image (B) for optimum urine volume measurement. The three pairs of callipers, 1+, 2+ are again shown on the longitudinal image for the cranio‐caudal and antero‐posterior images, and 3+ for the transverse measurements.
Figure 3.
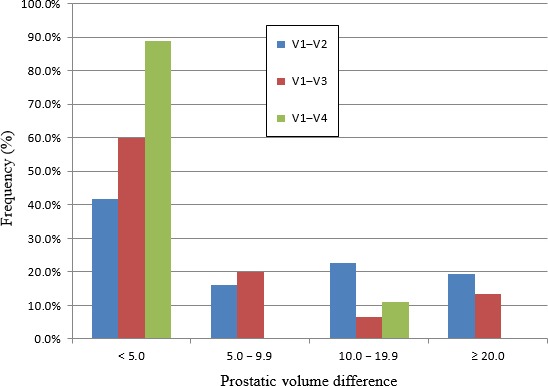
Chart showing difference in prostate volume measured at urinary bladder V1 versus V2, V3, V4. The chart shows the percentages of males who had differences in prostate volumes of <5.0, 5.0–9.9, 10.0–19.9 and ≥20 mL, measured at V1 and one of three other urinary bladder volumes V2, V3 and V4.
Figure 4.
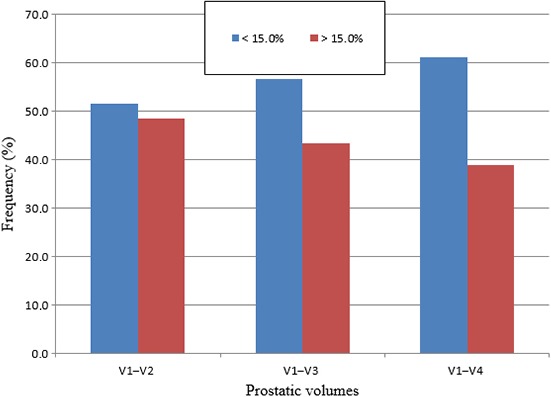
Chart comparing percentage volume difference of prostate measurements taken at urinary bladder volumes of V1 versus V2, V3, V4. The chart shows the percentage of males who had percentage volume differences of <15% and >15%, when prostate volumes were measured at V1 and compared to three other urinary bladder volumes V2, V3 and V4.
Figure 5.
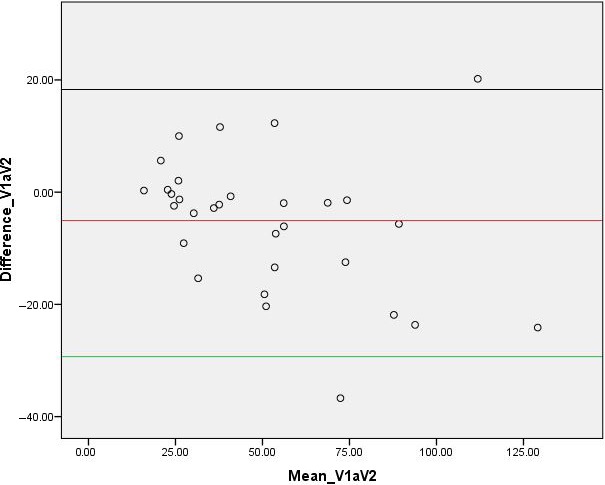
Chart showing Bland‐Altman plot for prostate volume measurements taken at urine volumes of 50–99 and 100–199 mL.
Figure 6.
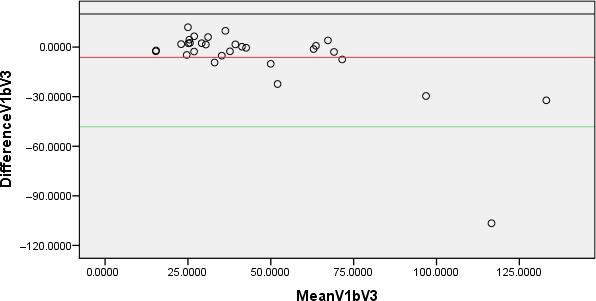
Chart showing Bland‐Altman plot for prostate volume measurements taken at urine volumes of 50–99 and 200–299 mL.
Figure 7.
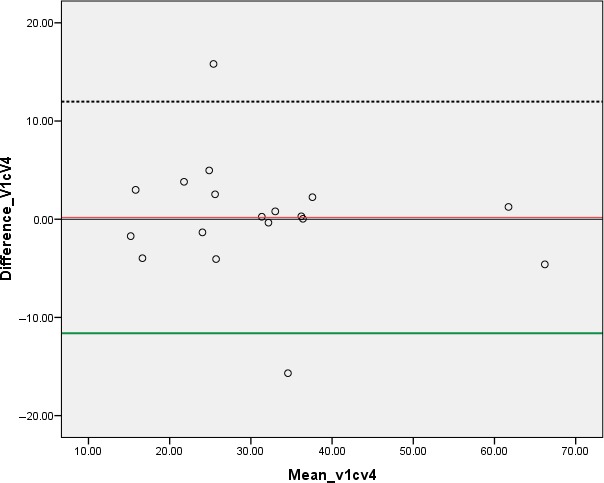
Chart showing Bland‐Altman plot for prostate volume measurements taken at urine volumes of 50–99 and 300–399 mL.
Table 4.
Linear regressional result for assessing level of proportional biases in measurements
| Measurements | Beta‐value | P‐value |
|---|---|---|
| 50–99 and 100–199 mL | −0.147 | 0.55 |
| 50–99 and 200–299 mL | −0.525 | 0.001 |
| 50–99 and 300–399 mL | −1.040 | 0.001 |
The regressional analyses further indicated that there was no evidence of proportional bias in the measurements of V1 and V2 (Beta = −0.147, P = 0.55) and V1 and V4 (Beta = −0.08, P = 0.463). However, there were some existence of proportional biases in measurements at V1 and V3 (Beta = −0.525, P = 0.001).
Discussion
The general teaching in Ghana regarding prostatic or pelvic TAUS is that it should be done with a full urinary bladder, which is generally defined as a urinary bladder with a urine volume of between 300 to 500 mL.5, 14 Over the last 13 years, we have observed that adequate prostate visualisation was possible and more tolerable for patients having TAUS without a full bladder. Bapat et al1 stated a volume of 100–200 mL was adequate for optimum TAUS for prostate size evaluation. In our study bladder volumes of 50–99 and 100–199 mL did not produce similar prostate sizes since there was a statistically significant difference in prostatic volume measurements. A Bland‐Altman plot (Fig. 5) and a subsequent linear regression analyses (Beta = −0.147, P = 0.55) show that there was no existence of proportional bias in measurements undertaken in V1 and V2. These results further indicate that generally, 95% of people measured under both bladder volumes will have a difference in estimated prostate volumes that is within the limits of agreement spread from approximately −29 to +18 mL of the other measurement, but there is no bias that lower/higher bladder volume leads to over or underestimate prostate volume.
Moreover, the study shows (Tables 2 and 3) that a urinary bladder volume of 50–99 mL produces prostatic volume measurements comparable to volumes measured in patients with a full (V4), or nearly full urinary bladder (V3). In the case of comparing prostatic volumes at bladder volumes of V1 versus V4, Bland‐Altman plots and regressional analysis suggest that under a pragmatic point of view, 95% of people measured under both bladder volumes will have a difference in estimated prostate volumes that is within 12 mL of the other measurement and there is no bias that lower/higher bladder volume leads to over or underestimation of prostatic volume. Therefore, when this information is applied in practice, it may help to reduce the discomforting experiences associated with scanning of the prostate on a full bladder. It is however worth noting that since a paired‐sample t‐test was used in comparing the data variables, there is a slightly inflated risk of at least one type‐one error.
As indicated earlier, urinary bladder volumes of 50–99 mL also generate prostatic volume measurements comparable to volumes measured in patients with nearly full bladder (V3), however, statistically, it is clear that 95% of people measured under both bladder volumes (V1 and V3) will have a difference in estimated prostate volumes that is within the limits of agreement spread from approximately −48 to +36 mL of the other measurement. In addition, there was also a proportional bias that lower/higher bladder volume leads to over or underestimate prostate volume in these sets of measurements and this particular finding has been applied with caution.
Figure 3 showed that the measured prostatic volume at 50–99 and 100–199 mL differed by less than 5 mL in 41.9% of patients. This percentage increased to 60.0% and 88.9% for comparative scans done at bladder volumes of 50–99 and 200–299, and 50–99 and 300–399 mL respectively. Also, Tables 1, 2 and 3 showed that most prostate sizes measured at 50–99 mL tended to be smaller than those measured at 100–199 and 200–299 mL, but larger than that measured at 300–399 mL. As explained by Snell's law a more globular shape of the moderately distended urinary bladder is likely to cause a greater degree of magnification than the flatter surfaces noted with the under‐filled urinary bladder. This may be due to a lesser degree of magnifying properties of the smaller urinary bladder volume of 50–99 mL when compared to a larger, more globular bladder volume of 100–199 mL, which is likely to exhibit more pronounced effects of ultrasound wave refraction, and hence magnification.14, 15 This supports the finding of Bapat et al1 that prostate size appears to increase with increasing urinary bladder volume. In contrast, very large urinary bladder volumes of 300–399 mL or more are likely to create a large distance from the probe to the prostate gland such that, mainly ultrasound waves close to the normal reach the prostate, as compared to refracted waves which are usually associated with mild image magnification.15, 16, 17 The difference in prostate size measurements at different urinary bladder volumes, however, does not appear to be influenced by the actual size of the prostate.
The percentage volume differences observed when prostate volumes measured at 50–99 mL were compared to prostate volumes measured at 100–199, 200–299 and 300–399 mL showed more people had a percentage volume difference of less than 15%. The study also indicated that the number of individuals with percentage volume differences <15% increased from 51.6% to 56.7% and then 61.1%, as the comparative urinary bladder volumes increased from 100 to 199 mL and 200 to 299 mL, and then to 300–399 mL respectively. This suggests that a 15% variation of the mean prostate volume in this study (42.9 mL) could vary from 36.5 to 49.3 mL. Such a variation would not significantly affect the decision to treat a patient seeking brachytherapy for malignant prostatic disease, where 50 mL is the cutoff prostatic volume for consideration of treatment.
Conclusion
The study shows that a urinary bladder volume of 50–99 mL produces prostatic volume measurements comparable to volumes measured in patients with a full (300–399 mL), or nearly full (200–299 mL) urinary bladder. A urinary bladder volume of 50–99 mL may therefore be adequate for scanning the prostate gland, and is likely to be tolerated much better by patients as it could reduce the discomfort associated with ultrasound scanning of the prostate on a full urinary bladder. However, there were statistical evidence of proportional biases in the measurements at 50–99 and 200–299 mL, and therefore the findings have to be used with caution. Moreover, prostatic measurements taken at a urinary bladder volume of 50–99 mL (V1) vary significantly from measurements taken at urinary bladder volume of 100–199 mL.
Conflict of Interest
The authors declare that they have no competing interests.
J Med Radiat Sci 66 (2019) 81–90
Funding Information
No funding information provided.
References
- 1. Bapat SS, Purnapatre SS, Pai KV, Yadav P, Padhye A, Bodhe YG. Does estimation of prostate volume by abdominal ultrasonography vary with bladder volume: A prospective study with transrectal ultrasonography as a reference? Indian J Urol 2006; 22: 322–5. [Google Scholar]
- 2. Cheah NL, Michaelides D, Kong PK, Wyatt R, El‐Modir A. Magnetic resonance imaging prostate volumes could be used as a surrogate for transrectal ultrasound volumes in estimating iodine‐125 seeds required in brachytherapy. Clin Oncol (R Coll Radiol) 2009; 21: 76. [DOI] [PubMed] [Google Scholar]
- 3. Roehrborn CG, Boyle P, Gould AL, Waldstreicher J. Serum prostate‐specific antigen as a predictor of prostate volume in men with benign prostatic hyperplasia. Urology 1999; 53: 581–9. [DOI] [PubMed] [Google Scholar]
- 4. Mac Mahon PJ, Kennedy AM, Murphy DT, Maher M, Mc Nichlolas MM. Modified prostate volume algorithm improves transrectal US volume estimation in men presenting for prostate brachytherapy. Radiology 2009; 250: 273–80. [DOI] [PubMed] [Google Scholar]
- 5. Roger C. Prostate. Clinical Sonography. A Practical Guide, 3rd edn. Lippincott Saunders, Philadelphia, 1998. [Google Scholar]
- 6. Ozden E, Gogus C, Kilic O, Yaman O, Ozdiler E. Analysis of suprapubic and transrectal measurements in assessment of Prostate dimensions and volume. Is transrectal ultrasonography really necessary for prostate measurements? Urol J 2009; 6: 208–13. [PubMed] [Google Scholar]
- 7. Chung JWHF, de Vries SH, Raaijmakers R, Postma R, Bosch JL, van Mastrgt R. Prostate volume ultrasonography: The influence of transabdominal versus transrectal approach, device type and operator. Eur Urol 2004; 46: 352–3526. [DOI] [PubMed] [Google Scholar]
- 8. Rodriques E Jr, Skarecky D, Narula N, Ahlering TE. Prostate volume estimation using the ellipsoid formula consistently underestimates actual gland size. J Urol 2008; 179: 501–3. [DOI] [PubMed] [Google Scholar]
- 9. Henneberry M, Carter MF, Neiman HL. Estimation of prostatic size by suprapubic ultrasonography. J Urol 1979; 121: 615–6. [DOI] [PubMed] [Google Scholar]
- 10. Mc Connell JD, Barry MJ, Bruskewitz RC, et al. Clinical Practice Guideline Number 8: Benign Prostatic Hyperplasia: Diagnosis and Treatment. US Dept of Health and Human Services Agency for Health Care Policy and Research, Maryland, MD, 1994. AHCPR publication 94‐0582. [PubMed] [Google Scholar]
- 11. Marchie TT, Onuora VC. Determination of normal range of ultrasonic sizes of prostate in our local environment. West Afr J Radiol 2001; 8: 54–64. [Google Scholar]
- 12. Altman DG, Bland JM. Measurement in medicine: The analysis of method comparison studies. Statistician 1983; 32: 307–17. [Google Scholar]
- 13. Giavarina D. Understanding Bland Altman analysis. Biochem Med 2015; 25: 141–51. [DOI] [PMC free article] [PubMed] [Google Scholar]
- 14. Boron WF, Boulpaep EL. Medical Physiology. Elsevier, Philadelphia, 2016. [Google Scholar]
- 15. Ross HE, Nawaz S. Why do objects appear enlarged under water? Arq Bras Oftalmol 2003; 66: 69–76. [Google Scholar]
- 16. Wikipedia . Refraction [cited 2017 March 14]. Available from: https://en.m.wikipedia.org.
- 17. Farr RF, Allissy‐Roberts PJ. Specular (mirror) Reflection. Imaging with Ultrasound. Physics for Medical Imaging. WB Saunders Company Ltd, Philadelphia. Great Britain. 1998. ISBN 0‐7020‐1770‐1. [Google Scholar]


