

SUMMARY
Current machine learning techniques enable robust association of biological signals with measured phenotypes, but these approaches are incapable of identifying causal relationships. Here we develop an integrated “white-box” biochemical screening, network modeling and machine learning approach for revealing causal mechanisms and apply this approach towards understanding antibiotic efficacy. We counter-screen diverse metabolites against bactericidal antibiotics in Escherichia coli and simulate their corresponding metabolic states using a genome-scale metabolic network model. Regression of the measured screening data on model simulations reveals that purine biosynthesis participates in antibiotic lethality, which we validate experimentally. We show that antibiotic-induced adenine limitation increases ATP demand, which elevates central carbon metabolism activity and oxygen consumption, enhancing the killing effects of antibiotics. This work demonstrates how prospective network modeling can couple with machine learning to identify complex causal mechanisms underlying drug efficacy.
Keywords: machine learning, network modeling, antibiotics, metabolism, purine biosynthesis, ATP, adenylate energy charge, NADPH/NADP+ ratio, LC-MS/MS, biochemical screen
In brief
A machine-learning approach that explores and illuminates pathways involved in bacterial metabolic responses to antibiotic treatment informs new strategies for exploiting weaknesses
Graphical Abstract
INTRODUCTION
Recent advances in high-throughput experimental technologies and data analyses have enabled unprecedented observation, quantification and association of biological signals with cellular phenotypes. Data-driven machine learning activities are poised to transform biological discovery and the treatment of human disease (Camacho et al., 2018; Wainberg et al., 2018; Webb, 2018; Yu et al., 2018a); however, existing techniques for extracting biological information from large datasets frequently encode relationships between perturbation and phenotype in opaque “black-boxes” that are mechanistically uninterpretable, and consequently can only identify correlations as opposed to causal relationships (Ching et al., 2018). In natural systems, biological molecules are biochemically organized in networks of complex interactions underlying observable phenotypes; biological network models may therefore harbor the potential to provide mechanistic structure to machine learning activities, yielding transparent “whitebox” causal insights (Camacho et al., 2018; Yu et al., 2018b).
Chemical and genetic screens are workhorses in modern drug discovery, but frequently suffer from poor (1–3%) hit rates (Roses, 2008). Such low hit rates often underpower the bioinformatic analyses used for causal inference due to limitations in biological information content. Experimentally validated network models possess the potential to expand the biological information content of sparse screening data; however, biological screening experiments are typically performed independently from network modeling activities, limiting subsequent analyses to either post hoc bioinformatic enrichment from screening hits or experimental validation of existing models. There is therefore a need to develop biological discovery approaches that integrate biochemical screens with network modeling and advanced data-analytical techniques, so as to enhance our understanding of complex drug mechanisms (Camacho et al., 2018; Wainberg et al., 2018; Xie et al., 2017). Here we develop one such approach and apply it towards understanding antibiotic mechanisms of action.
Antibiotics, a cornerstone of modern medicine, are threatened by the increasing burden of drug resistance, which is compounded by a diminished antimicrobial discovery pipeline (Brown and Wright, 2016). Although the primary targets and mechanisms of action for conventional antibiotics are well studied (Kohanski et al., 2010), there is growing appreciation that secondary processes such as altered metabolism actively participate in antibiotic efficacy (Yang et al., 2017a), and that extracellular metabolites may either potentiate (Allison et al., 2011; Meylan et al., 2017) or suppress (Yang et al., 2017b) the lethal activities of bactericidal antibiotics. While features of central metabolism (Kohanski et al., 2007) and cellular respiration (Gutierrez et al., 2017; Lobritz et al., 2015) are implicated in antibiotic lethality across diverse microbial species (Dwyer et al., 2015), the biological mechanisms underlying antibiotic-induced changes to metabolism (Belenky et al., 2015; Dwyer et al., 2014) remain unclear. Deeper understanding into how bacterial metabolism interfaces with antibiotic lethality has the potential to open new drug discovery paradigms (Bald et al., 2017; Murima et al., 2014), making antibiotic-induced cellular death physiology an attractive topic to investigate with white-box machine learning.
Here we integrate biochemical screening, network modeling and machine learning to form a white-box machine learning approach for revealing drug mechanisms of action. We apply this approach towards elucidating metabolic mechanisms of action for bactericidal antibiotics. We discover that metabolic processes related to purine biosynthesis, driven by antibiotic-induced adenine limitation, participate in antibiotic lethality. We show that adenine limitation increases ATP demand via purine biosynthesis, resulting in elevated central carbon metabolism activity and oxygen consumption, thereby enhancing the killing effects of antibiotics. This work demonstrates how network models can facilitate machine learning activities for biological discovery and provide insights into complex causal mechanisms underlying drug efficacy.
RESULTS
A white-box machine learning approach for revealing metabolic mechanisms of antibiotic lethality
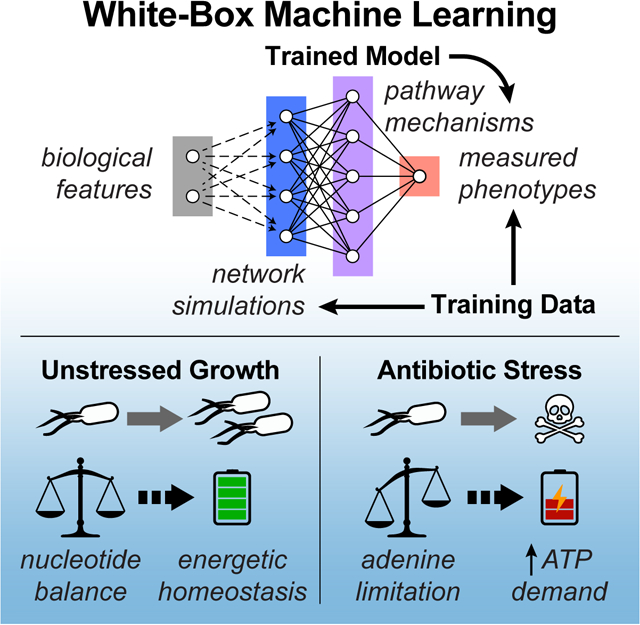
Machine learning aims to generate predictive models from sets of training data; such activities are typically comprised of three parts: input data, output data, and the predictive model trained to compute output data from input data (Figure 1A) (Camacho et al., 2018). While modern machine learning methods can assemble high-fidelity input-output associations from training data, the functions comprising the resulting trained models often do not possess tangible biochemical analogs, rendering them mechanistically uninterpretable. Consequently, predictive models generated by such (black-box) machine learning activities are unable to provide direct mechanistic insights into how biological molecules are interacting to give rise to observed phenomena. In order to address this limitation, we developed a whitebox machine learning approach, leveraging carefully curated biological network models to mechanistically link input and output data (Yu et al., 2018b).
Figure 1. A white-box machine learning approach for revealing metabolic mechanisms of antibiotic lethality.

(A) Machine learning activities are typically comprised of three parts: input data (blue), output data (red), and a predictive model trained to compute output data from input data (purple).
(B) An overall framework for white-box machine learning. Input screening perturbations (e.g., metabolite conditions; gray) are first transformed into enriched biological network states by prospective network modeling (e.g., metabolic fluxes; blue). These network simulations are then used as machine learning inputs to train a predictive model (purple), revealing mechanisms underlying the output data (e.g., antibiotic lethality measurements; red). Because biological networks are mechanistically constructed, features comprising the predictive models trained by machine learning are, by definition, mechanistically causal.
(C) E. coli MG1655 cells were treated with three bactericidal antibiotics at ≥ 13 different concentrations. Antibiotic IC50s were quantified following supplementation with 206 diverse metabolites and normalized by their on-plate controls. Metabolic network states corresponding to each metabolite were prospectively simulated using the iJO1366 model of E. coli metabolism (Orth et al., 2011). For each antibiotic, changes in IC50 were regressed on the simulated fluxes and pathway mechanisms were identified by hypergeometric testing on metabolic pathways curated by Ecocyc (Keseler et al., 2017). Identified pathways were validated experimentally.
Our approach integrates biochemical screening with prospective network modeling to provide mechanistically linked training data for machine learning (Figure 1B). In contrast to existing approaches, which generate predictive models from only the variables/perturbations available in a screen, we first use prospective network modeling to quantitatively transform screening perturbations into biologically enriched network states. Biological information from experimental screens are applied as boundary conditions for the network simulations, computing a network representation of each perturbation in the screen (e.g., metabolic fluxes following metabolite perturbations). These network representations are then used as input data to train predictive models with the empirical screening measurements (e.g., quantified cellular phenotypes in response to screening perturbations) as output data. Because biological networks are mechanistically constructed, the features comprising the predictive models trained by machine learning are, by definition, mechanistically causal and represent tangible biochemical species that can be directly tested experimentally.
Here we applied this integrated screening-modeling-learning approach towards investigating metabolic mechanisms of antibiotic lethality, demonstrating the ability of this workflow to reveal new mechanistic insights (Figure 1C). Specifically, we designed biochemical screens to measure the effects of diverse metabolite supplementations on the lethality of three bactericidal antibiotics: ampicillin (AMP, a β-lactam), ciprofloxacin (CIP, a fluoroquinolone) and gentamicin (GENT, an aminoglycoside). We screened combinations of these antibiotics and metabolites in Escherichia coli, measuring their antibiotic half-maximal inhibitory concentrations (IC50s) after four hours of treatment. Next, we prospectively simulated metabolic network states corresponding to each metabolite perturbation using the iJO136 genome-scale model of E. coli metabolism (Orth et al., 2011) with quantitative information from the biochemical screens as modeling constraints. These simulations comprehensively yield flux estimates for each metabolic reaction in E. coli, under each screening condition. For each antibiotic, we applied machine learning regression analyses to train a predictive model that could reveal pathway mechanisms underlying differences in antibiotic lethality measured in our screen. These pathways were identified by regularizing the simulated metabolic network states, regressing the measured IC50s and performing enrichment analyses from metabolic pathway annotations curated in Ecocyc v. 22.0 (Keseler et al., 2017).
Exogenous metabolites exert pathway-specific effects on antibiotic lethality
Input-output relationships between E. coli metabolism and antibiotic lethality were systematically quantified by measuring antibiotic IC50s following supplementation with metabolites known to participate in E. coli metabolism (Figure 2A). In order to avoid the potentially confounding effects of stationary phase physiology on antibiotic tolerance, we performed experiments using exponentially growing E. coli MG1655 cells. These cells were grown in MOPS defined minimal medium (Neidhardt et al., 1974) and were systematically screened with an unbiased and semi-comprehensive library of metabolites, against AMP, CIP and GENT. Screened metabolites were derived from the Biolog phenotype microarrays (PMs) 1–4 (Bochner, 2009), which are comprised of diverse carbon, nitrogen, phosphorus and sulfur species. These PMs contain 206 unique amino acids, carbohydrates, nucleotides and organic acids that are included in the iJO1366 genome-scale model of E. coli metabolism. Antibiotic responses to these 206 metabolites were used for subsequent analyses (Table S1).
Figure 2. Exogenous metabolites exert pathway-specific effects on antibiotic lethality.

(A) Overall experimental design for measuring metabolite effects on antibiotic lethality. Overnight cultures of E. coli MG1655 were inoculated into MOPS minimal medium, grown to early exponential phase, and back-diluted to OD600 = 0.1. Cells were dispensed into Biolog phenotype microarray plates (PMs) 1–4 (Bochner, 2009) with different concentrations of ampicillin (AMP), ciprofloxacin (CIP) or gentamicin (GENT) added. OD600 was measured after 4 hours of incubation at 37°C and 900 rpm shaking. Antibiotic IC50s were estimated for each antibiotic-metabolite combination.
(B) Antibiotic IC50 responses to metabolite supplementation. Metabolically-induced sensitivity profiles differ by antibiotic, but several metabolites commonly protect (red) or sensitize (blue) cells to multiple antibiotics. Carbon metabolites were screened using Biolog PMs 1 and 2; nitrogen metabolites were screened using Biolog PM 3; phosphorus and sulfur metabolites were screened using Biolog PM 4.
Data are represented as mean from n ≥ 3 independent biological replicates.
Changes in antibiotic IC50s were modest – in most cases, less than two-fold (Figure 2B and Table S2). Hierarchical clustering of the measured IC50s revealed that the metabolite response profiles differed between AMP, CIP and GENT, highlighting their different biochemical targets. However, several metabolites appeared to commonly potentiate or inhibit efficacy across multiple antibiotics, indicating shared metabolic mechanisms of action. Interestingly, many nitrogen, phosphorus and sulfur metabolites increased antibiotic IC50s, while many carbon metabolites decreased IC50s, similar to previous observations (Yang et al., 2017b). These raw data indicate that the measured antibiotic lethality responses to metabolite perturbations occurred through specific metabolic pathways, rather than generically as a response to medium enrichment.
Conventional bioinformatic analyses do not provide novel mechanistic insights
In order to test the capabilities of conventional bioinformatic analyses for yielding mechanistic insights into how the screened metabolites alter antibiotic lethality, we first performed an enrichment analysis on metabolites that elicited a ≥ 2-fold change in IC50 – a conventional definition for a screening “hit” (Table S3). For each antibiotic, a metabolite set enrichment analysis was performed in Ecocyc. For AMP (2 metabolites ≥ 2-fold change in IC50) and GENT (8 metabolites ≥ 2-fold change in IC50), no pathways were enriched with less than a 5% false discovery rate (FDR) (q ≤ 0.05). For CIP (19 metabolites ≥ 2-fold change in IC50), several non-specific pathways related to protein translation were identified, with top enrichments including ‘aminoacyl-tRNA charging’ (p = 1.98e-6), ‘proteinogenic amino acids biosynthesis’ (p = 2.50e-6) and ‘amino acids degradation’ (p = 1.27e-5) (Table S4). These findings are consistent with previous observations that protein translation inhibitors generally exert antagonistic effects on antibiotic lethality (Lobritz et al., 2015; Ocampo et al., 2014). Collectively, these results illustrate two common weaknesses in conventional bioinformatic approaches for analyzing biochemical screens: statistical power limitations and low specificity associations.
White-box machine learning reveals known and new antibiotic mechanisms of action
We next applied our white-box machine learning approach and prospectively modeled metabolic network states corresponding to supplementation with each metabolite used in the screen. For each metabolite, metabolic states were simulated by first adding exchange reactions to the E. coli metabolic model, which enabled uptake of each metabolite from the extracellular environment. We then performed parsimonious flux balance analysis (pFBA) (Lewis et al., 2010) in conditions simulating MOPS minimal medium and optimized for the biomass objective function (Table S5). Although this approach does not explicitly model contributions by gene expression towards changes in metabolism, benchmarking studies demonstrate that principles of growth maximization and parsimony are sufficient for accurately predicting metabolism in defined metabolic environments (Machado and Herrgard, 2014).
For each antibiotic, metabolic pathway mechanisms were identified by first conducting a dimension-reducing machine learning regression task, and then performing hypergeometric statistical testing on metabolic reactions comprising the outputted predictive model using pathway-reaction sets curated by Ecocyc. The measured changes in antibiotic IC50 were jointly learned on the set of simulated metabolic network states using multitask elastic net (Caruana, 1997; Zou and Hastie, 2005), yielding 477 reactions predicted to alter antibiotic lethality. For each antibiotic, reactions with coefficients whose magnitude were less than or equal to half the standard deviation of all coefficients were removed to exclude spurious reactions selected by joint learning. For AMP, CIP and GENT, this yielded 189, 208 and 204 reactions, respectively (Table S6). Next, hypergeometric statistics were performed on Ecocyc-curated pathways. Of the 431 metabolic pathways curated by Ecocyc, only 13 were found to be statistically significant with less than 5% FDR for at least one antibiotic (Table S7).
Because our white-box machine learning approach yields pathway mechanisms, we can quantify the relative contributions of each metabolic pathway to the lethal mechanisms of each antibiotic. We computed pathway scores for each pathway and antibiotic by performing least squares regression on the changes in antibiotic IC50 and then log-transforming the average non-zero regression coefficients for all reactions in each pathway. Identified pathways primarily clustered into three groups, based on their pathway scores (Figure 3). One cluster possessed central carbon metabolism pathways (‘Superpathway of glycolysis, pyruvate dehydrogenase, TCA, and glyoxylate bypass’; ‘Superpathway of glyoxylate bypass and TCA’; ‘TCA Cycle I (prokaryotic)’) with similar pathway directionality for AMP, CIP and GENT (indicated by the sign of the pathway score). These findings are consistent with several studies demonstrating the TCA cycle to be a shared mechanism in antibiotic lethality (Kohanski et al., 2007; Meylan et al., 2017; Nandakumar et al., 2014) and validate the fidelity of our white-box machine learning approach.
Figure 3. White-box machine learning reveals known and new antibiotic mechanisms of action.

Pathways scores for metabolic pathways identified by white-box machine learning. Identified pathways include several central carbon metabolism and nucleotide biosynthesis pathways and these cluster into three groups, based on pathway score. Central metabolism pathways primarily exhibit similar pathway directionality for ampicillin (AMP), ciprofloxacin (CIP), gentamicin (GENT), while purine biosynthesis pathways exhibit different pathway score directionality for GENT from AMP or CIP. Pathway scores were computed for each antibiotic by log-transforming the average regression coefficient for all non-zero reactions annotated in a given pathway.
Interestingly, a second cluster appeared possessing purine biosynthesis pathways (‘Superpathway of histidine, purine, and pyrimidine biosynthesis’; ‘Superpathway of purine nucleotides de novo biosynthesis II’) with shared directionality between AMP and CIP, and opposite directionality for GENT. To our knowledge, purine biosynthesis has not previously been implicated as a mechanism of antibiotic lethality from any biochemical or chemogenomic screen. In order to better understand these differences in pathway directionality, we examined the regression coefficients for each reaction and computed a reaction score by log-transforming their magnitudes. These analyses identified early steps in the purine biosynthesis pathway as being primarily responsible for the predicted differences for AMP and CIP from GENT (Figure S1). These findings illustrate how white-box machine learning can reveal new mechanisms of action with high biochemical specificity.
Purine biosynthesis activity participates in antibiotic lethality
Motivated by the above model-guided machine learning predictions, we next sought to test whether perturbations to purine biosynthesis would alter antibiotic lethality. From the predictions, we hypothesized that genetic deletion of enzymes involved in purine metabolism would exert differential effects on AMP and CIP lethality compared to GENT lethality. Indeed, E. coli mutants deficient for purD (glycinamide ribonucleotide synthetase), purE (N5-carboxyaminoimidazole ribonucleotide mutase), purK (5-(carboxyamino)imidazole ribonucleotide synthase), or purM (phosphoribosylformylglycinamide cycloligase), early steps in purine biosynthesis (Figure 4A), exhibited significant decreases in AMP and CIP lethality, but increased GENT lethality, compared to wildtype (Figure 4B). Similarly, biochemical inhibition of purine biosynthesis with 6-mercaptopurine, a PurF (amidophosphoribosyltransferase) inhibitor, decreases AMP and CIP lethality, but increases GENT lethality (Figure 4C). These effects appear to be specific to purine metabolism, as genetic deletion of enzymes involved in pyrimidine biosynthesis did not elicit significant differences in AMP, CIP or GENT lethality (Figure S2A).
Figure 4. Purine biosynthesis participates in antibiotic lethality.

(A) Purine biosynthesis pathway. Purine biosynthesis begins with phosphoribosyl pyrophosphate (prpp) and contains several ATP consuming steps (purple).
(B) Antibiotic lethality in purine biosynthesis deletion mutants. Genetic inhibition of purine biosynthesis by purD (glycinamide ribonucleotide synthetase), purE (N5-carboxyaminoimidazole ribonucleotide mutase), purK (5-(carboxyamino)imidazole ribonucleotide synthase), or purM (phosphoribosylformylglycinamide cyclo-ligase) deletion decreases ampicillin (AMP) and ciprofloxacin (CIP) lethality, but increases gentamicin (GENT) lethality.
(C) Antibiotic lethality following biochemical inhibition of purine biosynthesis. Biochemical inhibition of PurF (amidophosphoribosyltransferase) by 6-mercaptopurine (6-MP) decreases AMP and CIP lethality, but increases GENT lethality.
(D) Antibiotic lethality in a glyA (serine hydroxymethyltransferase) deletion mutant. Genetic inhibition of glycine (gly) and N10-formyl-tetrahydrofolate (10fthf) by glyA deletion decreases AMP and CIP lethality, but increases GENT lethality.
(E) Antibiotic lethality following enhanced purine biosynthesis. Substrate-level stimulation of purine biosynthesis with phosphoribosyl pyrophosphate (prpp) and glutamine (gln) supplementation increases AMP and CIP lethality, but decreases GENT lethality.
Data are represented as mean ± SEM from n ≥ 3 independent biological replicates.
Cells deficient for glyA (serine hydroxymethyltransferase), which participates in producing tetrahydrofolate co-factors through the folate cycle, also exhibited decreased AMP and CIP lethality, but increased GENT lethality (Figure 4D). Similar phenotypes were observed under combination treatment with trimethoprim, a potent biochemical inhibitor of FolA (dihydrofolate reductase) (Figure S2B), consistent with previous findings (Lobritz et al., 2015; Ocampo et al., 2014; Paisley and Washington, 1978).
We further hypothesized that stimulation of purine biosynthesis would elicit opposite effects on antibiotic lethality than inhibition by these genetic and biochemical perturbations. Indeed, biochemical supplementation with the purine biosynthesis substrates phosphoribosyl pyrophosphate (prpp) and glutamine (gln) (Figure 4A, blue) led to increased AMP and CIP lethality, and decreased GENT lethality (Figure 4E). Collectively, these data support the model-driven hypothesis that purine biosynthesis participates in antibiotic lethality and demonstrate how model-guided machine learning can provide reductive, hypothesis-driven mechanistic insights into drug efficacy.
Adenine limitation contributes to antibiotic lethality
Bactericidal antibiotics significantly alter bacterial metabolism as part of their lethality, increasing the abundance of intracellular central carbon metabolites and disrupting the nucleotide pool (Belenky et al., 2015; Nandakumar et al., 2014; Zampieri et al., 2017). Nucleotide pool disruptions include rapid depletion of free intracellular adenine, guanine and cytosine, and marked accumulation of intracellular uracil (Figure S3). Additionally, nucleotide biosynthesis pathways auto-regulate with internal feedback inhibition biochemically driven by their nucleotide end-products (Figure 5A) (Lehninger et al., 2013). Based on the predictions from our white-box machine learning approach and the above observations, we hypothesized that purine supplementation would rescue antibiotic-induced purine depletion, and consequently decrease the demand for purine biosynthesis, thereby reducing antibiotic lethality. Of note, supplementation with adenine (Figure 5B, red), but not guanine, decreased antibiotic lethality in wildtype cells; these results suggest that adenine limitation rather than guanine limitation drives purine biosynthesis activity under antibiotic stress. We also hypothesized that pyrimidine supplementation would inhibit pyrimidine biosynthesis and promote purine biosynthesis activity via prpp accumulation, and consequently increase antibiotic lethality. Indeed, supplementation with uracil or cytosine potentiated antibiotic lethality (Figure 5C, blue). Collectively, these data support the hypothesis that purine biosynthesis participates in antibiotic lethality and suggest that antibiotic-induced purine biosynthesis is driven by adenine limitation.
Figure 5. Adenine limitation contributes to antibiotic lethality.

(A) Feedback inhibition in the purine and pyrimidine biosynthesis pathways. Purine and pyrimidine biosynthesis auto-regulate through internal feedback inhibition by nucleotide end-products.
(B) Antibiotic lethality following purine supplementation. Adenine supplementation (red) decreases ampicillin (AMP), ciprofloxacin (CIP) and gentamicin (GENT) lethality.
(C) Antibiotic lethality following pyrimidine supplementation. Uracil supplementation (dark blue) increases AMP, CIP and GENT lethality.
Data are represented as mean ± SEM from n = 3 independent biological replicates.
Adenine supplementation reduces ATP demand and central carbon metabolism activity
Purine biosynthesis is energetically expensive, costing eight ATP molecules to synthesize one adenine molecule from one glucose molecule (Lehninger et al., 2013). In order to better understand the mechanistic basis for the observed differences in antibiotic lethality under adenine or uracil supplementation, we examined the simulated metabolic network states corresponding to these perturbations (Table S5). Model simulations predicted that adenine supplementation would decrease purine biosynthesis and consequently decrease ATP utilization by nucleotide synthesis and salvage reactions, while uracil supplementation would not (Figure 6A). Model simulations also predicted that as a result of these changes, overall flux through central carbon metabolism pathways would decrease, reducing the activity of enzymes involved in cellular respiration and oxidative phosphorylation, such as succinate dehydrogenase (Figure S4). These modeling results are consistent with previous observations that glycolytic flux is controlled by ATP demand (Koebmann et al., 2002).
Figure 6. Adenine supplementation reduces ATP demand and central carbon metabolism activity.

(A) Metabolic modeling predictions. Adenine supplementation decreases activity through purine biosynthesis, consequently decreasing ATP utilization by purine biosynthesis, central carbon metabolism and oxidative phosphorylation (Figure S4), in comparison to simulated control (CTL). E. coli metabolism under adenine (ADE) or uracil (URA) supplementation was simulated by parsimonious flux balance analysis (pFBA) in the iJO1366 metabolic model with exchange reactions for adenine or uracil opened, respectively. Nucleotide biosynthesis activity was computed by summing fluxes through reactions in the Purine and Pyrimidine Biosynthesis subsystem (left). ATP consumption was summed across all reactions in the Purine and Pyrimidine Biosynthesis and Nucleotide Salvage Pathway subsystems (center left). Central carbon metabolism activity was computed by summing fluxes through reactions in the Glycolysis and TCA Cycle subsystems (center right). Oxidative phosphorylation is proxied by the Succinate Dehydrogenase reaction (right); additional oxidative phosphorylation reactions are depicted in Figure S4. All fluxes were normalized by the biomass objective function.
(B) Intracellular adenine or uracil concentrations following adenine or uracil supplementation. Intracellular metabolite concentrations were measured by targeted LC-MS/MS.
(C) Intracellular succinate or fumarate concentrations following adenine or uracil supplementation. Adenine supplementation increases intracellular succinate and decreases intracellular fumarate, consistent with model predictions for inhibited succinate dehydrogenase activity (A, right).
(D) ATP synthesis following adenine or uracil supplementation. Metabolic modeling simulations predict a decrease in ATP synthesis following adenine supplementation (left), reported by the ATP Synthase reaction. Metabolomic measurements of intracellular ATP, ADP and AMP (Figure S5B) reveal a similar decrease in adenylate energy charge following adenine supplementation (right).
(E) NADPH/NADP+ and NADH/NAD+ ratios following adenine or uracil supplementation. Metabolomic measurements of intracellular NADPH, NADP+, NADH and NAD+ (Figure S5C) reveal modest decreases in the NADPH/NADP+ ratio following adenine supplementation (left), indicating reduced anabolic metabolism. The NADH/NAD+ ratio is largely unchanged (right), indicating preserved catabolic metabolism.
(F) Cellular respiration following adenine or uracil supplementation during antibiotic treatment. Metabolic modeling simulations predict a decrease in oxygen consumption following adenine supplementation (left), reported by the Oxygen Exchange reaction. Adenine supplementation (red) reduces respiratory activity, while uracil (blue) increases respiratory activity. Changes in oxygen consumption rate following treatment with ampicillin (AMP), ciprofloxacin (CIP) or gentamicin (GENT) and adenine or uracil supplementation were measured using the Seahorse Extracellular Flux Analyzer.
Data are represented as mean ± SEM from n = 3 independent biological replicates. Significance reported as FDR-corrected p-values in comparison with control: †: p ≤ 0.1, *: p ≤ 0.05, **: p ≤ 0.01, ****: p ≤ 0.0001.
We tested these metabolic modeling predictions by quantifying the intracellular concentrations of central carbon metabolism and energy currency metabolites from E. coli cells grown in MOPS minimal medium and supplemented with either adenine or uracil (Figure 6B) (Table S8). Under these conditions, cell growth did not significantly change within the first hour of supplementation (Figure S5A), but intracellular adenine nucleotides did accumulate under exogenous adenine addition (Figure S5B). Consistent with model predictions that adenine supplementation would inhibit succinate dehydrogenase activity, intracellular succinate increased, while intracellular fumarate decreased (Figure 6C). Model simulations additionally predicted that ATP synthesis would decrease under adenine supplementation (Figure 6D, left). Consistent with this, we observed a modest decrease in the adenylate energy charge (Figure 6D, right), an index for the energy state of a cell (Chapman and Atkinson, 1977). We also examined the relative changes in intracellular nicotinamide adenine dinucleotides under adenine or uracil supplementation (Figure S5C) and observed a modest decrease in the NADPH/NADP+ ratio, but not the NADH/NAD+ ratio, following exogenous adenine addition (Figure 6E). Together, these results support the model predictions that adenine supplementation decreases central carbon metabolism activity (decreased adenylate energy charge) and cell anabolism (decreased NADPH/NADP+ ratio) without significantly changing cell catabolism (unchanged NADH/NAD+ ratio) (Figure S5D) (Andersen and von Meyenburg, 1977; Chapman and Atkinson, 1977).
The metabolic modeling simulations further predicted that decreases in oxidative phosphorylation under adenine supplementation lead to decreases in cellular oxygen consumption (Figure 6F, left). We tested these modeling predictions using a Seahorse XF Analyzer and measured changes in the oxygen consumption rate (OCR) following antibiotic treatment, with or without adenine or uracil supplementation. Antibiotic treatment with AMP, CIP or GENT increased cellular OCR (Figure 6F, black), in contrast to control conditions (Figure S5E), supporting previous observations that cellular respiration is important for antibiotic lethality (Gutierrez et al., 2017; Lobritz et al., 2015). Importantly, adenine supplementation significantly repressed cellular OCR under antibiotic treatment (Figure 6F, red), consistent with model predictions, while uracil enhanced cellular OCR (Figure 6F, blue). These results directly support the hypothesis that central carbon metabolism activity and cellular respiration are increased under antibiotic stress to satisfy the elevated ATP demand resulting from purine biosynthesis. Collectively, our data and simulations indicate that adenine limitation resulting from antibiotic treatment drives purine biosynthesis, which increases ATP demand, fueling the redox-associated metabolic alterations involved in antibiotic lethality (Dwyer et al., 2014) (Figure 7).
Figure 7. Antibiotic-induced adenine limitation induces purine biosynthesis, increasing ATP demand and driving central carbon metabolic activity.

In addition to the lethal effects of inhibiting their primary targets, bactericidal antibiotics disrupt the nucleotide pool, depleting intracellular purines and inducing adenine limitation. Adenine limitation triggers purine biosynthesis, increasing ATP demand, which drives increased activity through central carbon metabolism and cellular respiration. Toxic metabolic byproducts generated by this increased metabolic activity damage DNA and exacerbate antibiotic-mediated killing. Futile cycles and other stressinduced phenomena may also elevate ATP demand.
DISCUSSION
Recent advances in high-throughput experimental technologies and data science have stimulated considerable interest in the potential for artificial intelligence to transform biological discovery and healthcare (Gil et al., 2014; Topol, 2019; Webb, 2018; Yu et al., 2018a). Important for such pursuits will be the necessary transition from correlation-based machine learning to causality-based “machine reasoning” (Bottou, 2014). Identifying causal mechanisms by modern machine learning approaches is challenging due to the mechanistic inaccessibility of computationally derived, black-box associations between perturbations and phenotypes. In this study, we show how biological network models can be utilized to overcome this mechanistic uncertainty and help uncover biological mechanisms (Camacho et al., 2018; Yu et al., 2018b).
Network modeling has long provided a foundation for systems biology (Ideker et al., 2001) and researchers are now beginning to integrate machine learning with retrospective network modeling for improving the fidelity of genotype-to-phenotype predictions (Ma et al., 2018). Such activities demonstrate how hierarchically organized prior knowledge can deconvolve complex biological data; however, these efforts rely on post hoc analyses of experimental data and can only perform inductive association of phenotypes with perturbations rather than deductive identification of the causal mechanisms driving phenotypes. Here we presented a complementary approach, combining machine learning with prospective network modeling to infer biological mechanisms based on their combined information content.
We demonstrate how this approach can be integrated with biochemical screening and applied towards understanding mechanisms underlying antibiotic efficacy. Antibiotics are conventionally understood to work by inhibiting processes involved in bacterial cell replication (Kohanski et al., 2010). However, recent work has shown that processes downstream of target inhibition, including bacterial metabolism, actively participate in antibiotic lethality (Cho et al., 2014; Dwyer et al., 2015; Gruber and Walker, 2018; Zhao and Drlica, 2014). An important knowledge gap has been in understanding the biological mechanisms underlying antibiotic-mediated changes in metabolism. Our results here suggest that altered metabolism resulting from bactericidal antibiotic treatment is driven, in part, by the increased ATP demand required to restore homeostasis to a disrupted nucleotide pool (Belenky et al., 2015). It is likely that antibiotic-induced insults to the nucleotide pool are further exacerbated by nucleotide oxidation (Fan et al., 2018; Foti et al., 2012; Gruber and Walker, 2018), resulting in a positive feedback loop of increased nucleotide biosynthesis, elevated central carbon metabolism and toxic metabolic byproduct generation that is lethally detrimental to the cell (Figure 7). Because nucleotide analogues are commonly used as FDA-approved anticancer and antiviral chemotherapeutics, it will be interesting to explore their potential as antimicrobial agents or adjuvants (El Zahed and Brown, 2018; Serpi et al., 2016).
Adenine nucleotides are important mediators of cellular homeostasis (Andersen and von Meyenburg, 1977; Chapman and Atkinson, 1977), universally coupling cellular metabolism, DNA/RNA replication, and other physiological processes. In the context of infection, adenylate metabolites such as ATP, ADP and adenosine are important components of the damage-associated molecular patterns used by the host to activate the immune system (Cekic and Linden, 2016). We previously observed that adenine metabolites such as AMP accumulate at a site of infection during antibiotic treatment and, consistent with our data here, can inhibit antibiotic lethality (Yang et al., 2017b). Given our results, it is likely that interpatient differences in the concentrations of extracellular nucleotides contribute to variable antibiotic treatment outcomes for infection (Lee and Collins, 2011). Moreover, our finding that uracil potentiates antibiotic lethality (Figures 5), suggests that pyrimidine nucleotides may potentially also be useful as antimicrobial adjuvants.
Evolution has optimized bacteria for efficient resource allocation under unstressed growth (Basan et al., 2015; Hui et al., 2015; Scott et al., 2014), and insults to the ATP pool and other energy currencies are sufficient for stimulating central carbon metabolism (Holm et al., 2010; Koebmann et al., 2002) and sensitizing cells to oxidative stress (Adolfsen and Brynildsen, 2015). Additionally, intracellular ATP and the adenylate energy charge are tightly regulated across the tree of life, and robustly maintained across environmental changes and cellular insults (Chapman and Atkinson, 1977). Under antibiotic stress, increases to ATP demand are likely to arise from multiple sources (Yang et al., 2017a). Consistent with these notions, pharmacological suppression of oxidative phosphorylation (Shetty and Dick, 2018) and metabolic conditions inhibiting intracellular ATP (Shan et al., 2017) protect cells against antibiotics, supporting a critical role for ATP dynamics in antibiotic-mediated lethality. Additionally, futile cycling in cell wall synthesis and degradation was recently reported to be a component of β-lactam lethality (Cho et al., 2014). Our findings support a new, fundamental concept in understanding antibiotic death physiology – namely, that stress-induced changes in ATP utilization and demand, as a homeostatic response, critically drive lethal metabolic alterations. Because antibiotic stress increases the abundance of central carbon metabolism intermediates (Belenky et al., 2015; Nandakumar et al., 2014) and TCA cycle protein expression (Babin et al., 2017), central carbon metabolism is worth exploring as a target for antimicrobial drug discovery (Bald et al., 2017; Murima et al., 2014).
The growing, global crisis of antibiotic resistance has created a clear imperative for expanded efforts in antimicrobial drug discovery and investigations into bacterial cellular death physiology (Brown and Wright, 2016). As experimental and computational technologies mature, new techniques and resources are becoming available for studying the biological mechanisms underlying antibiotic responses in complex and dynamic environments (Certain et al., 2017; Dunphy and Papin, 2017; Mack et al., 2018; Yang et al., 2017a). While the work described here has specifically focused on bacterial metabolism, several other aspects of bacterial physiology are known to be relevant to antibiotic efficacy, including bacterial stress responses, DNA repair mechanisms, and macromolecular processes such as transcription and translation (Dwyer et al., 2015; Gruber and Walker, 2018; Yang et al., 2017a). Investigation into these other physiological systems will require new and different modeling approaches (Carrera and Covert, 2015; Ma et al., 2018; Oberhardt et al., 2013; Yang et al., 2018), curated knowledge bases (Karr et al., 2012; Keseler et al., 2017; Monk et al., 2017), and screening innovations (French et al., 2018; French et al., 2016). Integration of such resources with machine learning could advance antibiotic discovery by revealing novel mechanisms that can be targeted with next-generation adjuvants, boosting our existing antibiotic arsenal (Tyers and Wright, 2019).
White-box machine learning can be broadly extended across diverse biological systems and, as demonstrated here, be impactful for revealing drug mechanisms of action for treating human diseases. For instance, cell metabolism is increasingly recognized as being important in cancer pathogenesis (Vander Heiden and DeBerardinis, 2017) and histidine metabolism was recently demonstrated to participate in the efficacy of some cancer therapeutics (Kanarek et al., 2018). Similar to the present work on antibiotics, cancer drugs may be counter-screened against a library of metabolites in human cancer cells and coupled with network simulations using models of human metabolism (Brunk et al., 2018) to discover metabolic mechanisms of action for existing cancer drugs. Insights gained by such an approach may help guide the design of cancer treatment regimen accounting for a tumor’s local metabolic microenvironment, leveraging metabolic perturbations to optimize treatment outcomes.
Moreover, our integrated screening-modeling-learning approach is agnostic to the experimental datasets and network models used to train machine learning models. NIH Common Fund programs such as “Library of Integrated Network-Based Cellular Signatures” (LINCS) and “Big Data to Knowledge” are providing increasingly comprehensive measurements of cellular physiology in response to genetic or small molecule perturbations (Keenan et al., 2018). Our white-box machine learning approach could be extended to such datasets to reveal molecular mechanisms mediating cellular responses to biochemical stimuli. For instance, simulations may be performed on human signaling networks to transform LINCS small molecule perturbations into signaling network configurations, which can be utilized as input data to learn signaling mechanisms of epigenetic regulation from measured chromatin signatures (Litichevskiy et al., 2018). Similarly, prospective network simulations may be performed on gene regulatory networks to interpret CRISPR screening perturbations (Wang et al., 2014) and reveal transcriptional programs underlying screened phenotypes.
Finally, white-box machine learning will be important for realizing the transformative promises of translational precision medicine activities such as NIH’s “All of Us” research program. Simulations may be performed on biological networks curated in databases such as BioGRID (Stark et al., 2006) to transform human data from repositories such as the UK Biobank (Bycroft et al., 2018) into gene regulatory, signaling or metabolic network states customized for each individual patient in a diverse population. These customized network states may be applied as inputs to machine learning models to identify mechanistically interpretable biomarkers and molecular mechanisms of disease pathogenesis from relevant clinical metadata, using classification and regression techniques. Such analyses could be impactful for treating human disease by enabling stratified, personalized treatment strategies based on an individual’s gene regulatory, signaling or metabolic network state and by providing new targets for drug discovery programs (Yu et al., 2018a). Reaching such endpoints will require continued high-quality characterization of human specimens and curation of human biological networks. However, white-box machine learning will reward such efforts with deep, new insights that could enable truly personalized medicine.
STAR METHODS
Contact for Reagent and Resource Sharing
Further information and requests for resources and reagents should be directed to and will be fulfilled by the Lead Contact, James J. Collins (jimjc@mit.edu).
Experimental Model and Subject Details
Bacterial Strains, Media, Growth Conditions, Reagents.
Escherichia coli strain K-12 MG1655 (ATCC 700926) was used for all experiments in this study. For metabolite supplementation experiments, cells were cultured in MOPS minimal medium with 0.2% glucose (Teknova; Hollister, CA). For experiments involving gene deletions, cells were cultured in MOPS EZ Rich defined medium (Teknova). For all experiments, cells were grown at 37°C either on a rotating shaker at 300 rpm in baffled flasks or 14 mL test tubes or on a rotating shaker at 900 rpm in Biolog 96-well phenotype microarrays (Bochner, 2009) (Biolog; Hayward, CA). All experiments were performed with n ≥ 3 biological replicates from independent overnight cultures. Uniformly labeled 13C glucose was purchased from Cambridge Isotope Laboratories, Inc. (Tewksbury, MA). LC-MS reagents were purchased from Honeywell Burdick & Jackson® (Muskegon, MI) and Sigma-Aldrich (St. Louis, MO).
Method Details
Metabolite Screen and IC50 Determination.
An overnight culture of E. coli cells in MOPS minimal medium was diluted 1:500 and grown to mid-exponential phase at 37°C with 300 rpm shaking in 2 L baffled flasks. 13 mL cultures were then back-diluted to OD600 = 0.1 and dispensed into 14 mL test tubes containing 100x concentrated AMP, CIP or GENT over the following concentration gradients: for AMP, 10 mg/mL, 1 mg/mL and 1.5-fold dilutions from 20 – 0.35 g/mL; for CIP, 10 g/mL, 1 μg/mL and 1.5fold dilutions from 100 – 0.4 ng/mL; for GENT, 10 μg/mL, 1 μg/mL and 1.5-fold dilutions from 200 – 2.6 ng/mL. 100 L from each antibiotic-treated subculture was dispensed into each well of a Biolog PM 1–4 compound plate. Plates were sealed with breathable membranes and incubated in a 37°C shaking incubator with 900 rpm shaking. After 4 h incubation, OD600 was measured on a SpectraMax M5 Microplate Reader (Molecular Devices; San Jose, CA). IC50s were estimated from each set of n ≥ 3 independent biological replicates by fitting logistic functions to each set of OD600 measurements for each well in MATLAB (Mathworks; Natick, MA). In the case of CIP, some metabolite conditions exhibited a biphasic dose-response. For those conditions, a logistic function was fit to only the phase at the lower concentration.
Gene Knockout Strain Construction.
E. coli ΔglyA, ΔpurD, ΔpurE, ΔpurK, ΔpurM, ΔpurC and ΔpyrE gene deletion mutants were constructed by P1 phage transduction using the Keio collection (Baba et al., 2006), as previously described (Gutierrez et al., 2017). Briefly, P1 phage lysates corresponding to each gene deletion were produced by incubating overnight cultures of Keio donor strains with P1 phage. For each gene deletion, an overnight culture of E. coli MG1655 was pelleted and resuspended in a 10 mM MgCl2 and 5 mM CaCl2 salt solution in a 15 mL test tube, and then incubated with the corresponding P1 phage at 37°C for 30 min. Media containing 1 M sodium citrate was added to each tube and incubated at 37°C for an additional 60 min in a 300 rpm shaking incubator. Cells were pelleted, resuspended on fresh media, and then plated on kanamycin-selective agar plates containing 5 mM sodium citrate and incubated overnight at 37°C. Colonies were selected from each plate and their kanamycin-resistance cassettes cured by transducing pCP20 plasmid with electroporation, inducing recombination by overnight growth at 43°C, and then screening resulting colonies for genomic recombination and plasmid loss on kanamycinand ampicillin-selective agar plates. Overnight cultures of each knockout strain were checked for accuracy by PCR amplification and gel electrophoresis with custom oligonucleotides (Table S9).
Time-Kill Experiments.
Time-kill experiments were performed as previously described (Dwyer et al., 2014). An overnight culture of E. coli cells in MOPS minimal medium was diluted 1:500 and grown to mid-exponential phase at 37°C with 300 rpm shaking in 125 mL baffled flasks. 1 mL cultures were then back-diluted to OD600 = 0.1, dispensed into 14 mL test tubes and treated with AMP, CIP or GENT, with biochemical supplementation where indicated. For all metabolite supplementation experiments in minimal media, time-kill experiments were performed using 4 μg/mL AMP, 16 ng/mL CIP or 48 ng/mL GENT. For all gene knockout experiments in rich media, time-kill experiments were performed using 4 μg/mL AMP, 16 ng/mL CIP or 96 ng/mL GENT. Hourly samples were collected and serially diluted in PBS for colony enumeration 24 h later.
Intracellular Metabolite Quantification.
Intracellular metabolites quantified on an AB SCIEX Qtrap® 5500 mass spectrometer (AB SCIEX; Framingham, MA), as previously described (McCloskey et al., 2018), and processed using in house scripts. An overnight culture of E. coli cells in MOPS minimal medium was diluted 1:500 and grown to mid-exponential phase at 37°C with 300 rpm shaking in 1 L baffled flasks. 25 mL cultures were then back-diluted to OD600 = 0.1, dispensed into 250 mL baffled flasks and treated with either 1 mM adenine, 1 mM uracil or a non-supplemented control. Samples were collected 1 hr after supplementation, and aliquots with biomass equivalents to 10 mL of cell culture at OD600 = 0.1 were subjected to metabolite extraction using a 40:40:20 mixture of acetonitrile, methanol and LC-MS grade water. Uniformly labeled 13C-standards were generated by growing E. coli in uniformly labeled Glucose M9 minimal media in aerated shake flasks, as previously described (McCloskey et al., 2014). Calibration mixes of standards were split across several mixes, aliquoted, and lyophilized to dryness. All samples and calibrators were equally spiked with the same internal standards. Samples were quantified using isotope-dependent mass spectrometry. Calibration curves were run before and after all biological and analytical replicates. Consistency of quantification between calibration curves was checked by running a Quality Control sample composed of all biological replicates. Values reported are derived from the average of the biological triplicates, analyzed in duplicate (n = 6).
Oxygen Consumption Rate Quantification.
Bacterial respiratory activity was quantified using the Seahorse XFe96 Extracellular Flux Analyzer (Seahorse Bioscience; North Billerica, MA), as previously described (Dwyer et al., 2014; Lobritz et al., 2015). XF Cell Culture Microplates were pre-coated with 100 ng/mL poly-D-lysine. An overnight culture of E. coli cells in MOPS minimal medium was diluted 1:500 and grown to mid-exponential phase at 37°C with 300 rpm shaking in 125 mL baffled flasks. Cells were back-diluted to OD600 = 0.01 and 90 L diluted cells were dispensed to each well of the coated XF Microplates. Microplates were centrifuged for 10 min at 4,000 rpm and an additional 90 L fresh media with or without 1 mM adenine or uracil was added to each well. Antibiotics were added to injection ports and measurements taken at 5 min intervals with 2.5 min measurements cycles and 2.5 min mixing.
Quantification and Statistical Analysis
Hierarchical Clustering.
Hierarchical clustering for the measured antibiotic IC50s and identified pathways was performed in MATLAB using the standardized euclidean distance metric.
Metabolite Set Enrichment Analysis.
Metabolite Set Enrichment Analysis was performed in Ecocyc (v. 22.0) (Keseler et al., 2017). A SmartTables was created comprised of metabolites eliciting a ≥ 2-fold change in IC50 for at least one antibiotic (Table S4). Pathways were identified using the “Enrichment” analysis type. The Fisher Exact test was performed for each enrichment analysis with false discovery rate (FDR) correction by the Benjamini-Hochberg method.
Genome-Scale Metabolic Modeling.
Metabolic simulations were performed using the COBRA Toolbox v. 2.0 (Schellenberger et al., 2011) in MATLAB and Gurobi Optimizer v. 6.0.4 (Gurobi Optimization; Beaverton, OR). Reversible reactions in the iJO1366 E. coli model (Orth et al., 2011) were replaced with pairs of forward and backward reactions. In order to simulate growth in MOPS minimal medium, reaction bounds from the exchange reactions corresponding to each metabolite present in MOPS minimal medium were set to a value of ‘1,000’, to permit uptake. Reaction bounds for oxygen exchange, glucose exchange and cobalamin exchange were as set to values of ‘18.5’, ‘10’ and ‘0.1’, respectively, as previously described (Orth et al., 2011). For each metabolite screening condition, additional exchange reactions were added to represent supplementation with each metabolite on the Biolog phenotype microarray plates (Table S1), with reaction bounds set to ‘1,000’ to permit uptake. Parsimonious flux balance analysis (Lewis et al., 2010) was performed on each metabolite condition-specific model 10,000 times with sampling by optGpSampler (Megchelenbrink et al., 2014). For each reaction in the condition-specific models, the mean flux across all 10,000 samples was computed and used to represent flux in each condition.
Multitask Elastic Net Regularization.
Metabolic reactions for each antibiotic were selected using a twostage multitask elastic net regularization (Yuan et al., 2016; Zou and Hastie, 2005) in the open-source Spyder IDE v. 3.3.0 (Spyder Project Contributors) Python environment. First, IC50s from each screening condition were normalized by their on-plate controls and log2-transformed. Multitask elastic net was jointly performed on the transformed antibiotic IC50s and the simulated metabolic states using the MultitaskElasticNetCV function in the scikit-learn toolbox v. 0.17.0 (Pedregosa et al., 2011) with 50-fold cross-validation, 1e4 max iterations and tolerance of 1e-6. Second, for each antibiotic, the standard deviation of elastic net coefficients was computed. Reactions whose coefficients possessed magnitude less than half the standard deviation were filtered and removed. Exchange and transport reactions were excluded from this analysis.
Hypergeometric Pathway Identification.
Pathways mechanisms were identified by performing hypergeometric statistical testing on metabolic pathways curated in Ecocyc (v. 22.0) (Keseler et al., 2017). For each antibiotic, reactions selected by multitask elastic net regularization were converted to their Ecocyc counterparts and hypergeometric p-values were computed for each pathway-reaction set in Spyder. For each antibiotic-pathway combination, FDR statistics were estimated using the BenjaminiHochberg method. Pathways that exhibited p ≤ 0.05 and q ≤ 0.05 for at least one antibiotic were selected.
Pathway and Reaction Score Computation.
For each antibiotic, log2-transformed IC50s were regressed on the reactions selected by multitask elastic net by linear squares using scikit-learn in Spyder. For each pathway, pathway scores were computed by first computing the average of the non-zero regression coefficients for all reactions in each pathway. The magnitudes for these pathway scores were then log10-transformed and normalized by the largest magnitude of all pathway scores. Reaction scores were computed by taking the log10-transformation of each regression coefficient for each antibiotic. The magnitudes of these reaction scores were then normalized by the largest magnitude of all reaction scores.
Metabolite Quantification.
Metabolite concentrations were estimated from LC-MS/MS peak heights using previously generated calibration curves. Metabolites found to have a quantifiable variability (RSD ≥ 50%) in the Quality Control samples or possessing individual components with a RSD ≥ 80% were excluded from analysis. Metabolites in blanks with a concentration greater than 80% of that found in the biological samples were similarly excluded. Missing values were imputed by bootstrapping using the R package Amelia II (v. 1.7.4, 1,000 imputations) (Honaker et al., 2011). Remaining missing values were approximated as 1/2 the lower limit of quantification for the metabolite normalized to the biomass of the sample. Intracellular metabolite concentrations were calculated based on an estimated cell density of 7⋅107 CFU/mL at OD600 = 0.1 (Figure 5) and an estimated cell volume of 1.3 fL for non-stressed exponential phase E. coli cells (Milo and Phillips, 2016).
Statistical Analysis.
Statistical significance testing was performed in Prism v8.0.2 (GraphPad; San Diego, CA). One-way ANOVA was performed on intracellular ATP measurements. Reported p-values reflect false-discovery correction by the Holm-Šídák multiple comparisons test, with comparisons only between adenine or uracil supplementation with control. Although ANOVA is generally robust against lack of normality in the data, statistical tests were not specifically performed to determine if all of the assumptions of ANOVA had been met.
Supplementary Material
Figure S1. Antibiotic reaction scores for purine biosynthesis; related to Figures 3 and 4.
Differences in purine biosynthesis pathway scores for ampicillin (AMP) and ciprofloxacin (CIP) from gentamicin (GENT) are primarily explained by early reactions in the purine biosynthesis pathway (gray box).
Table S5. Simulated metabolic flux states associated with each metabolite screening condition; related to Figure 3
Table S6. Metabolic reactions identified by multitask elastic net regularization to be enriched for in antibiotic lethality; related to Figure 3.
Figure S2. Purine biosynthesis participates in antibiotic lethality; related to Figure 4.
(A) Antibiotic lethality in pyrimidine biosynthesis deletion mutants. Genetic inhibition of pyrimidine biosynthesis by pyrC (dihydroorotase) or pyrE (orotate phosphoribosyltransferase) deletion does not significantly change ampicillin (AMP), ciprofloxacin (CIP) or gentamicin (GENT) lethality.
(B) Biochemical disruption of the folate cycle by trimethoprim (TRI) decreases AMP and CIP lethality, but increases GENT lethality.
Data are represented as mean ± SEM from n = 3 independent biological replicates.
Figure S3. Antibiotic stress rapidly disrupts intracellular nucleotide pools; related to Figure 5.
Purine nucleic acid bases (A: adenine, G: guanine) are depleted (red), while pyrimidine nucleic acid bases (C: cytosine, T: thymine, U: uracil) accumulate (blue) in E. coli cells treated with ampicillin (AMP), norfloxacin (NOR) or kanamycin (KAN). Data reanalyzed from Belenky et al., 2015.
Figure S4. Model simulations predict exogenous adenine supplementation decreases oxidative phosphorylation; related to Figure 6.
Figure S5. Adenine or uracil supplementation alters energy currencies and central carbon metabolism; related to Figure 6.
(A) Exogenous adenine (red) or uracil (blue) supplementation does not significantly alter unstressed growth in MOPS minimal medium.
(B) Intracellular AMP, ADP and ATP concentrations following adenine (ADE) or uracil (URA) supplementation.
(C) Relative intracellular NADPH, NADP+, NADH and NAD+ concentrations following adenine or uracil supplementation.
(D) Intracellular tricarboxylic acid cycle metabolite concentrations following adenine or uracil supplementation.
(E) Cellular respiration following adenine or uracil supplementation in the absence of antibiotic treatment.
Data are represented as mean ± SEM from n ≥ 3 independent biological replicates. Significance reported as FDR-corrected p-values in comparison with control: †: p ≤ 0.1, *: p ≤ 0.05, **: p ≤ 0.01, ***: p ≤ 0.001.
Table S3. Metabolites eliciting a ≥ 2-fold change in IC50 for each antibiotic; related to Figure 2.
Table S4. Metabolic pathways enriched from metabolites that elicited ≥ 2-fold change in ciprofloxacin (CIP) IC50, identified by Metabolite Set Enrichment Analysis in Ecocyc; related to Figure 2
Table S7. Metabolic pathways predicted to participate in ampicillin (AMP), ciprofloxacin (CIP) or gentamicin (GENT) lethality; related to Figure 3.
Table S8. Measured intracellular metabolite concentrations under adenine or uracil supplementation. Data are reported as mean ± SD and computed from LC-MS/MS measurements from n = 3 biological replicates; related to Figure 6.
Table S9. Oligonucleotides used for verifying E. coli gene deletions; related to STAR Methods.
Table S1. Metabolite mappings from Biolog PMs 1–4 to iJO1366 E. coli model; related to Figure 2.
Table S2. Measured antibiotic IC50s from metabolite screens on Biolog PMs 1–4. Data are computed from fitting logistic functions to 4 h OD600 measurements from n ≥ 3 biological replicates; related to Figure 2.
Key Resources Table
| REAGENT or RESOURCE | SOURCE | IDENTIFIER |
|---|---|---|
| Bacterial and Virus Strains | ||
| Eschehchia coli K-12 MG1655 | ATCC | ATCC 700926 |
| Chemicals, Peptides, and Recombinant Proteins | ||
| 6-Mercaptopurine | Sigma-Aldrich | Cat# 852678-1G-A; CAS: 6112-76-1 |
| 13C-Glucose | Cambridge Isotope Laboratories, Inc. | Cat# CLM-1396-1; CAS: 110187-42-3 |
| Adenine | Sigma-Aldrich | Cat# A8626-5G; CAS: 73-24-5 |
| Ampicillin | Sigma-Aldrich | Cat# A9518-5G; CAS: 69-52-3 |
| Ciprofloxacin | Sigma-Aldrich | Cat# 17850-25G-F; CAS: 85721-33-1 |
| Cytosine | Sigma-Aldrich | Cat# C3506-1G; CAS: 71-30-7 |
| Gentamicin | Sigma-Aldrich | Cat# G1914-5G; CAS: 1405-41-0 |
| Glutamine | Sigma-Aldrich | Cat# G8540-25G; CAS: 56-85-9 |
| Guanine | Sigma-Aldrich | Cat# G11950-10G; CAS: 73-40-5 |
| MOPS EZ Rich Defined Medium Kit | Teknova | Cat# M2105 |
| MOPS Minimal Media Kit | Teknova | Cat# M2106 |
| Phenotype Microarray 1 MicroPlate | Biolog (Bochner, 2009) | Cat# 12111 |
| Phenotype Microarray 2 MicroPlate | Biolog (Bochner, 2009) | Cat# 12112 |
| Phenotype Microarray 3 MicroPlate | Biolog (Bochner, 2009) | Cat# 12121 |
| Phenotype Microarray 4 MicroPlate | Biolog (Bochner, 2009) | Cat# 12131 |
| Phosphoribosyl pyrophosphate | Sigma-Aldrich | Cat# P8296-100MG; CAS: 108321-05-7 |
| Thymine | Sigma-Aldrich | Cat# T0376-100G; CAS: 65-71-4 |
| Trimethoprim | Sigma-Aldrich | Cat# T7883-5G; CAS: 738-70-5 |
| Uracil | Sigma-Aldrich | Cat# U0750-100G; CAS: 66-22-8 |
| Oligonucleotides | ||
| See Table S9 | This paper | |
| Software and Algorithms | ||
| MATLAB 2018a | Mathworks | https://www.mathworks.com/ |
| COBRA Toolbox v. 2.0 | (Schellenberger et al., 2011) | https://opencobra.github.io/cobratoolbox/ |
| Gurobi Optimizer v. 6.0.4 | Gurobi Optimization | http://www.gurobi.com/ |
| optGpSampler | (Megchelenbrink et al., 2014) | http://cs.ru.nl/~wmegchel/optGpSampler/ |
| Spyder IDE v. 3.3.0 | Spyder Project Contributors | https://www.spyderide.org/ |
| scikit-learn v. 0.17.0 | (Pedregosa et al., 2011) | https://scikitlearn.org/ |
| Ecocyc v. 22.0 | (Keseler et al., 2017) | https://ecocyc.org/ |
| Prism v. 8.0.2 | GraphPad | https://www.graphpad.com/ |
| AB SCIEX MultiQuant v. 3.0.1 | SCIEX | https://sciex.com/products/software/multiquant-software |
| Amelia II v. 1.7.4 | (Honaker et al., 2011) | https://cran.r-project.org/web/packages/Amelia/index.html |
| LMGene v. 3.3 | (Lu et al., 2008) | http://www.bioconductor.org/packages/release/bioc/html/LMGene.html |
HIGHLIGHTS.
A white-box machine learning approach is developed for antibiotics research.
Network modeling is coupled to a biochemical screen to identify pathway mechanisms.
Antibiotic-induced adenine limitation increases purine biosynthesis and ATP demand.
Increased ATP demand drives central carbon metabolism and oxygen consumption.
ACKNOWLEDGMENTS
The authors thank Ian Andrews, Sarah Bening and Charley Gruber from MIT; Eric Brown and Madeline Tong from McMaster University; Eytan Ruppin from the National Cancer Institute; Ahmed Badran, Eachan Johnson and Keren Yizhak from the Broad Institute; Sylvie Manuse from Northeastern University; and Xilin Zhao from New Jersey Medical School for helpful discussions. This work was supported by grant HDTRA1-15-1-0051 from the Defense Threat Reduction Agency to J.J.C.; grant K99-GM118907 from the National Institutes of Health to J.H.Y.; a National Science Foundation Graduate Research Fellowship 1122374 to M.A.A.; grant U01-AI124316 from the National Institutes of Health to B.O.P.; the Novo Nordisk Foundation to B.O.P.; grants R01-CA021615 and R35-ES028303 from the National Institutes of Health to G.C.W.; grant U19-AI111276 from the National Institutes of Health to J.J.C.; and support by the Paul G. Allen Frontiers Group, the Broad Institute at MIT and Harvard, and the Wyss Institute for Biologically Inspired Engineering to J.J.C. G.C.W. is an American Cancer Society Professor.
Footnotes
Publisher's Disclaimer: This is a PDF file of an unedited manuscript that has been accepted for publication. As a service to our customers we are providing this early version of the manuscript. The manuscript will undergo copyediting, typesetting, and review of the resulting proof before it is published in its final citable form. Please note that during the production process errors may be discovered which could affect the content, and all legal disclaimers that apply to the journal pertain.
DECLARATION OF INTERESTS
J.J.C. is scientific co-founder and scientific advisory board chair of Enbiotix, an antibiotics startup company.
REFERENCES
- Adolfsen KJ, and Brynildsen MP (2015). Futile cycling increases sensitivity toward oxidative stress in Escherichia coli. Metab Eng 29, 26–35. [DOI] [PMC free article] [PubMed] [Google Scholar]
- Allison KR, Brynildsen MP, and Collins JJ (2011). Metabolite-enabled eradication of bacterial persisters by aminoglycosides. Nature 473, 216–220. [DOI] [PMC free article] [PubMed] [Google Scholar]
- Andersen KB, and von Meyenburg K (1977). Charges of nicotinamide adenine nucleotides and adenylate energy charge as regulatory parameters of the metabolism in Escherichia coli. J Biol Chem 252, 4151–4156. [PubMed] [Google Scholar]
- Baba T, Ara T, Hasegawa M, Takai Y, Okumura Y, Baba M, Datsenko KA, Tomita M, Wanner BL, and Mori H (2006). Construction of Escherichia coli K-12 in-frame, single-gene knockout mutants: the Keio collection. Mol Syst Biol 2, 2006 0008. [DOI] [PMC free article] [PubMed] [Google Scholar]
- Babin BM, Atangcho L, van Eldijk MB, Sweredoski MJ, Moradian A, Hess S, Tolker-Nielsen T, Newman DK, and Tirrell DA (2017). Selective Proteomic Analysis of Antibiotic-Tolerant Cellular Subpopulations in Pseudomonas aeruginosa Biofilms. MBio 8. [DOI] [PMC free article] [PubMed] [Google Scholar]
- Bald D, Villellas C, Lu P, and Koul A (2017). Targeting Energy Metabolism in Mycobacterium tuberculosis, a New Paradigm in Antimycobacterial Drug Discovery. MBio 8. [DOI] [PMC free article] [PubMed] [Google Scholar]
- Basan M, Hui S, Okano H, Zhang Z, Shen Y, Williamson JR, and Hwa T (2015). Overflow metabolism in Escherichia coli results from efficient proteome allocation. Nature 528, 99–104. [DOI] [PMC free article] [PubMed] [Google Scholar]
- Belenky P, Ye JD, Porter CB, Cohen NR, Lobritz MA, Ferrante T, Jain S, Korry BJ, Schwarz EG, Walker GC, et al. (2015). Bactericidal Antibiotics Induce Toxic Metabolic Perturbations that Lead to Cellular Damage. Cell Rep 13, 968–980. [DOI] [PMC free article] [PubMed] [Google Scholar]
- Bochner BR (2009). Global phenotypic characterization of bacteria. FEMS Microbiol Rev 33, 191–205. [DOI] [PMC free article] [PubMed] [Google Scholar]
- Bottou L (2014). From machine learning to machine reasoning. Machine Learning 94, 133–149. [Google Scholar]
- Brown ED, and Wright GD (2016). Antibacterial drug discovery in the resistance era. Nature 529, 336–343. [DOI] [PubMed] [Google Scholar]
- Brunk E, Sahoo S, Zielinski DC, Altunkaya A, Drager A, Mih N, Gatto F, Nilsson A, Preciat Gonzalez GA, Aurich MK, et al. (2018). Recon3D enables a three-dimensional view of gene variation in human metabolism. Nat Biotechnol 36, 272–281. [DOI] [PMC free article] [PubMed] [Google Scholar]
- Bycroft C, Freeman C, Petkova D, Band G, Elliott LT, Sharp K, Motyer A, Vukcevic D, Delaneau O, O’Connell J, et al. (2018). The UK Biobank resource with deep phenotyping and genomic data. Nature 562, 203–209. [DOI] [PMC free article] [PubMed] [Google Scholar]
- Camacho DM, Collins KM, Powers RK, Costello JC, and Collins JJ (2018). Next-Generation Machine Learning for Biological Networks. Cell 173, 1581–1592. [DOI] [PubMed] [Google Scholar]
- Carrera J, and Covert MW (2015). Why Build Whole-Cell Models? Trends Cell Biol 25, 719–722. [DOI] [PMC free article] [PubMed] [Google Scholar]
- Caruana R (1997). Multitask Learning. Machine Learning 28, 41–75. [Google Scholar]
- Cekic C, and Linden J (2016). Purinergic regulation of the immune system. Nat Rev Immunol 16, 177–192. [DOI] [PubMed] [Google Scholar]
- Certain LK, Way JC, Pezone MJ, and Collins JJ (2017). Using Engineered Bacteria to Characterize Infection Dynamics and Antibiotic Effects In Vivo. Cell Host Microbe 22, 263–268 e264. [DOI] [PubMed] [Google Scholar]
- Chapman AG, and Atkinson DE (1977). Adenine nucleotide concentrations and turnover rates. Their correlation with biological activity in bacteria and yeast. Adv Microb Physiol 15, 253–306. [DOI] [PubMed] [Google Scholar]
- Ching T, Himmelstein DS, Beaulieu-Jones BK, Kalinin AA, Do BT, Way GP, Ferrero E, Agapow PM, Zietz M, Hoffman MM, et al. (2018). Opportunities and obstacles for deep learning in biology and medicine. J R Soc Interface 15. [DOI] [PMC free article] [PubMed] [Google Scholar]
- Cho H, Uehara T, and Bernhardt TG (2014). Beta-lactam antibiotics induce a lethal malfunctioning of the bacterial cell wall synthesis machinery. Cell 159, 1300–1311. [DOI] [PMC free article] [PubMed] [Google Scholar]
- Dunphy LJ, and Papin JA (2017). Biomedical applications of genome-scale metabolic network reconstructions of human pathogens. Curr Opin Biotechnol 51, 70–79. [DOI] [PMC free article] [PubMed] [Google Scholar]
- Dwyer DJ, Belenky PA, Yang JH, MacDonald IC, Martell JD, Takahashi N, Chan CT, Lobritz MA, Braff D, Schwarz EG, et al. (2014). Antibiotics induce redox-related physiological alterations as part of their lethality. Proc Natl Acad Sci U S A 111, E2100–2109. [DOI] [PMC free article] [PubMed] [Google Scholar]
- Dwyer DJ, Collins JJ, and Walker GC (2015). Unraveling the physiological complexities of antibiotic lethality. Annu Rev Pharmacol Toxicol 55, 313–332. [DOI] [PubMed] [Google Scholar]
- El Zahed SS, and Brown ED (2018). Chemical-Chemical Combinations Map Uncharted Interactions in Escherichia coli under Nutrient Stress. iScience 2, 168–181. [DOI] [PMC free article] [PubMed] [Google Scholar]
- Fan XY, Tang BK, Xu YY, Han AX, Shi KX, Wu YK, Ye Y, Wei ML, Niu C, Wong KW, et al. (2018). Oxidation of dCTP contributes to antibiotic lethality in stationary-phase mycobacteria. Proc Natl Acad Sci U S A 115, 2210–2215. [DOI] [PMC free article] [PubMed] [Google Scholar]
- Foti JJ, Devadoss B, Winkler JA, Collins JJ, and Walker GC (2012). Oxidation of the guanine nucleotide pool underlies cell death by bactericidal antibiotics. Science 336, 315–319. [DOI] [PMC free article] [PubMed] [Google Scholar]
- French S, Coutts BE, and Brown ED (2018). Open-Source High-Throughput Phenomics of Bacterial Promoter-Reporter Strains. Cell Syst. [DOI] [PubMed] [Google Scholar]
- French S, Mangat C, Bharat A, Cote JP, Mori H, and Brown ED (2016). A robust platform for chemical genomics in bacterial systems. Mol Biol Cell 27, 1015–1025. [DOI] [PMC free article] [PubMed] [Google Scholar]
- Gil Y, Greaves M, Hendler J, and Hirsh H (2014). Artificial Intelligence. Amplify scientific discovery with artificial intelligence. Science 346, 171–172. [DOI] [PubMed] [Google Scholar]
- Gruber CC, and Walker GC (2018). Incomplete base excision repair contributes to cell death from antibiotics and other stresses. DNA Repair. [DOI] [PMC free article] [PubMed] [Google Scholar]
- Gutierrez A, Jain S, Bhargava P, Hamblin M, Lobritz MA, and Collins JJ (2017). Understanding and Sensitizing Density-Dependent Persistence to Quinolone Antibiotics. Mol Cell 68, 1147–1154 e1143. [DOI] [PubMed] [Google Scholar]
- Holm AK, Blank LM, Oldiges M, Schmid A, Solem C, Jensen PR, and Vemuri GN (2010). Metabolic and transcriptional response to cofactor perturbations in Escherichia coli. J Biol Chem 285, 17498–17506. [DOI] [PMC free article] [PubMed] [Google Scholar]
- Honaker J, King G, and Blackwell M (2011). Amelia II: A Program for Missing Data. J Stat Softw 45, 1–47. [Google Scholar]
- Hui S, Silverman JM, Chen SS, Erickson DW, Basan M, Wang J, Hwa T, and Williamson JR (2015). Quantitative proteomic analysis reveals a simple strategy of global resource allocation in bacteria. Mol Syst Biol 11, 784. [DOI] [PMC free article] [PubMed] [Google Scholar]
- Ideker T, Galitski T, and Hood L (2001). A new approach to decoding life: systems biology. Annu Rev Genomics Hum Genet 2, 343–372. [DOI] [PubMed] [Google Scholar]
- Kanarek N, Keys HR, Cantor JR, Lewis CA, Chan SH, Kunchok T, Abu-Remaileh M, Freinkman E, Schweitzer LD, and Sabatini DM (2018). Histidine catabolism is a major determinant of methotrexate sensitivity. Nature 559, 632–636. [DOI] [PMC free article] [PubMed] [Google Scholar]
- Karr JR, Sanghvi JC, Macklin DN, Gutschow MV, Jacobs JM, Bolival B Jr., Assad-Garcia N, Glass JI, and Covert MW (2012). A whole-cell computational model predicts phenotype from genotype. Cell 150, 389–401. [DOI] [PMC free article] [PubMed] [Google Scholar]
- Keenan AB, Jenkins SL, Jagodnik KM, Koplev S, He E, Torre D, Wang Z, Dohlman AB, Silverstein MC, Lachmann A, et al. (2018). The Library of Integrated Network-Based Cellular Signatures NIH Program: System-Level Cataloging of Human Cells Response to Perturbations. Cell Syst 6, 13–24. [DOI] [PMC free article] [PubMed] [Google Scholar]
- Keseler IM, Mackie A, Santos-Zavaleta A, Billington R, Bonavides-Martinez C, Caspi R, Fulcher C, Gama-Castro S, Kothari A, Krummenacker M, et al. (2017). The EcoCyc database: reflecting new knowledge about Escherichia coli K-12. Nucleic Acids Res 45, D543–D550. [DOI] [PMC free article] [PubMed] [Google Scholar]
- Koebmann BJ, Westerhoff HV, Snoep JL, Nilsson D, and Jensen PR (2002). The glycolytic flux in Escherichia coli is controlled by the demand for ATP. J Bacteriol 184, 3909–3916. [DOI] [PMC free article] [PubMed] [Google Scholar]
- Kohanski MA, Dwyer DJ, and Collins JJ (2010). How antibiotics kill bacteria: from targets to networks. Nat Rev Microbiol 8, 423–435. [DOI] [PMC free article] [PubMed] [Google Scholar]
- Kohanski MA, Dwyer DJ, Hayete B, Lawrence CA, and Collins JJ (2007). A common mechanism of cellular death induced by bactericidal antibiotics. Cell 130, 797–810. [DOI] [PubMed] [Google Scholar]
- Lee HH, and Collins JJ (2011). Microbial environments confound antibiotic efficacy. Nat Chem Biol 8, 6–9. [DOI] [PMC free article] [PubMed] [Google Scholar]
- Lehninger AL, Nelson DL, and Cox MM (2013). Lehninger principles of biochemistry, 6th edn (New York: W.H. Freeman; ). [Google Scholar]
- Lewis NE, Hixson KK, Conrad TM, Lerman JA, Charusanti P, Polpitiya AD, Adkins JN, Schramm G, Purvine SO, Lopez-Ferrer D, et al. (2010). Omic data from evolved E. coli are consistent with computed optimal growth from genome-scale models. Mol Syst Biol 6, 390. [DOI] [PMC free article] [PubMed] [Google Scholar]
- Litichevskiy L, Peckner R, Abelin JG, Asiedu JK, Creech AL, Davis JF, Davison D, Dunning CM, Egertson JD, Egri S, et al. (2018). A Library of Phosphoproteomic and Chromatin Signatures for Characterizing Cellular Responses to Drug Perturbations. Cell Syst 6, 424–443 e427. [DOI] [PMC free article] [PubMed] [Google Scholar]
- Lobritz MA, Belenky P, Porter CB, Gutierrez A, Yang JH, Schwarz EG, Dwyer DJ, Khalil AS, and Collins JJ (2015). Antibiotic efficacy is linked to bacterial cellular respiration. Proc Natl Acad Sci U S A 112, 8173–8180. [DOI] [PMC free article] [PubMed] [Google Scholar]
- Lu R, Lee GC, Shultz M, Dardick C, Jung K, Phetsom J, Jia Y, Rice RH, Goldberg Z, Schnable PS, et al. (2008). Assessing probe-specific dye and slide biases in two-color microarray data. BMC Bioinformatics 9, 314. [DOI] [PMC free article] [PubMed] [Google Scholar]
- Ma J, Yu MK, Fong S, Ono K, Sage E, Demchak B, Sharan R, and Ideker T (2018). Using deep learning to model the hierarchical structure and function of a cell. Nat Methods 15, 290–298. [DOI] [PMC free article] [PubMed] [Google Scholar]
- Machado D, and Herrgard M (2014). Systematic evaluation of methods for integration of transcriptomic data into constraint-based models of metabolism. PLoS Comput Biol 10, e1003580. [DOI] [PMC free article] [PubMed] [Google Scholar]
- Mack SG, Turner RL, and Dwyer DJ (2018). Achieving a Predictive Understanding of Antimicrobial Stress Physiology through Systems Biology. Trends Microbiol 26, 296–312. [DOI] [PubMed] [Google Scholar]
- McCloskey D, Gangoiti JA, King ZA, Naviaux RK, Barshop BA, Palsson BO, and Feist AM (2014). A model-driven quantitative metabolomics analysis of aerobic and anaerobic metabolism in E. coli K-12 MG1655 that is biochemically and thermodynamically consistent. Biotechnol Bioeng 111, 803–815. [DOI] [PubMed] [Google Scholar]
- McCloskey D, Xu J, Schrubbers L, Christensen HB, and Herrgard MJ (2018). RapidRIP quantifies the intracellular metabolome of 7 industrial strains of E. coli. Metab Eng 47, 383–392. [DOI] [PubMed] [Google Scholar]
- Megchelenbrink W, Huynen M, and Marchiori E (2014). optGpSampler: an improved tool for uniformly sampling the solution-space of genome-scale metabolic networks. PLoS One 9, e86587. [DOI] [PMC free article] [PubMed] [Google Scholar]
- Meylan S, Porter CB, Yang JH, Belenky P, Gutierrez A, Lobritz MA, Park J, Kim SH, Moskowitz SM, and Collins JJ (2017). Carbon Sources Tune Antibiotic Susceptibility in Pseudomonas aeruginosa via Tricarboxylic Acid Cycle Control. Cell Chem Biol 24, 195–206. [DOI] [PMC free article] [PubMed] [Google Scholar]
- Milo R, and Phillips R (2016). Cell biology by the numbers (New York, NY: Garland Science, Taylor & Francis Group; ). [Google Scholar]
- Monk JM, Lloyd CJ, Brunk E, Mih N, Sastry A, King Z, Takeuchi R, Nomura W, Zhang Z, Mori H, et al. (2017). iML1515, a knowledgebase that computes Escherichia coli traits. Nat Biotechnol 35, 904–908. [DOI] [PMC free article] [PubMed] [Google Scholar]
- Murima P, McKinney JD, and Pethe K (2014). Targeting bacterial central metabolism for drug development. Chem Biol 21, 1423–1432. [DOI] [PubMed] [Google Scholar]
- Nandakumar M, Nathan C, and Rhee KY (2014). Isocitrate lyase mediates broad antibiotic tolerance in Mycobacterium tuberculosis. Nat Commun 5, 4306. [DOI] [PubMed] [Google Scholar]
- Neidhardt FC, Bloch PL, and Smith DF (1974). Culture medium for enterobacteria. J Bacteriol 119, 736–747. [DOI] [PMC free article] [PubMed] [Google Scholar]
- Oberhardt MA, Yizhak K, and Ruppin E (2013). Metabolically re-modeling the drug pipeline. Curr Opin Pharmacol 13, 778–785. [DOI] [PubMed] [Google Scholar]
- Ocampo PS, Lazar V, Papp B, Arnoldini M, Abel zur Wiesch P, Busa-Fekete R, Fekete G, Pal C, Ackermann M, and Bonhoeffer S (2014). Antagonism between bacteriostatic and bactericidal antibiotics is prevalent. Antimicrob Agents Chemother 58, 4573–4582. [DOI] [PMC free article] [PubMed] [Google Scholar]
- Orth JD, Conrad TM, Na J, Lerman JA, Nam H, Feist AM, and Palsson BO (2011). A comprehensive genome-scale reconstruction of Escherichia coli metabolism−−2011. Mol Syst Biol 7, 535. [DOI] [PMC free article] [PubMed] [Google Scholar]
- Paisley JW, and Washington JA 2nd (1978). Synergistic activity of gentamicin with trimethoprim or sulfamethoxazole-trimethoprim against Escherichia coli and Klebsiella pneumoniae. Antimicrob Agents Chemother 14, 656–658. [DOI] [PMC free article] [PubMed] [Google Scholar]
- Pedregosa F, Varoquaux G, Gramfort A, Michel V, Thirion B, Grisel O, Blondel M, Prettenhofer P, Weiss R, Dubourg V, et al. (2011). Scikit-learn: Machine Learning in Python. J Mach Learn Res 12, 2825–2830. [Google Scholar]
- Roses AD (2008). Pharmacogenetics in drug discovery and development: a translational perspective. Nat Rev Drug Discov 7, 807–817. [DOI] [PubMed] [Google Scholar]
- Schellenberger J, Que R, Fleming RM, Thiele I, Orth JD, Feist AM, Zielinski DC, Bordbar A, Lewis NE, Rahmanian S, et al. (2011). Quantitative prediction of cellular metabolism with constraint-based models: the COBRA Toolbox v2.0. Nat Protoc 6, 1290–1307. [DOI] [PMC free article] [PubMed] [Google Scholar]
- Scott M, Klumpp S, Mateescu EM, and Hwa T (2014). Emergence of robust growth laws from optimal regulation of ribosome synthesis. Mol Syst Biol 10, 747. [DOI] [PMC free article] [PubMed] [Google Scholar]
- Serpi M, Ferrari V, and Pertusati F (2016). Nucleoside Derived Antibiotics to Fight Microbial Drug Resistance: New Utilities for an Established Class of Drugs? J Med Chem 59, 10343–10382. [DOI] [PubMed] [Google Scholar]
- Shan Y, Brown Gandt A, Rowe SE, Deisinger JP, Conlon BP, and Lewis K (2017). ATPDependent Persister Formation in Escherichia coli. MBio 8. [DOI] [PMC free article] [PubMed] [Google Scholar]
- Shetty A, and Dick T (2018). Mycobacterial Cell Wall Synthesis Inhibitors Cause Lethal ATP Burst. Front Microbiol 9, 1898. [DOI] [PMC free article] [PubMed] [Google Scholar]
- Stark C, Breitkreutz BJ, Reguly T, Boucher L, Breitkreutz A, and Tyers M (2006). BioGRID: a general repository for interaction datasets. Nucleic Acids Res 34, D535–539. [DOI] [PMC free article] [PubMed] [Google Scholar]
- Topol EJ (2019). High-performance medicine: the convergence of human and artificial intelligence. Nat Med 25, 44–56. [DOI] [PubMed] [Google Scholar]
- Tyers M, and Wright GD (2019). Drug combinations: a strategy to extend the life of antibiotics in the 21st century. Nat Rev Microbiol 17, 141–155. [DOI] [PubMed] [Google Scholar]
- Vander Heiden MG, and DeBerardinis RJ (2017). Understanding the Intersections between Metabolism and Cancer Biology. Cell 168, 657–669. [DOI] [PMC free article] [PubMed] [Google Scholar]
- Wainberg M, Merico D, Delong A, and Frey BJ (2018). Deep learning in biomedicine. Nat Biotechnol 36, 829–838. [DOI] [PubMed] [Google Scholar]
- Wang T, Wei JJ, Sabatini DM, and Lander ES (2014). Genetic screens in human cells using the CRISPR-Cas9 system. Science 343, 80–84. [DOI] [PMC free article] [PubMed] [Google Scholar]
- Webb S (2018). Deep learning for biology. Nature 554, 555–557. [DOI] [PubMed] [Google Scholar]
- Xie L, Draizen EJ, and Bourne PE (2017). Harnessing Big Data for Systems Pharmacology. Annu Rev Pharmacol Toxicol 57, 245–262. [DOI] [PMC free article] [PubMed] [Google Scholar]
- Yang JH, Bening SC, and Collins JJ (2017a). Antibiotic efficacy-context matters. Curr Opin Microbiol 39, 73–80. [DOI] [PMC free article] [PubMed] [Google Scholar]
- Yang JH, Bhargava P, McCloskey D, Mao N, Palsson BO, and Collins JJ (2017b). AntibioticInduced Changes to the Host Metabolic Environment Inhibit Drug Efficacy and Alter Immune Function. Cell Host Microbe 22, 757–765 e753. [DOI] [PMC free article] [PubMed] [Google Scholar]
- Yang L, Yurkovich JT, King ZA, and Palsson BO (2018). Modeling the multi-scale mechanisms of macromolecular resource allocation. Curr Opin Microbiol 45, 8–15. [DOI] [PMC free article] [PubMed] [Google Scholar]
- Yu K-H, Beam AL, and Kohane IS (2018a). Artificial intelligence in healthcare. Nature Biomedical Engineering 2, 719–731. [DOI] [PubMed] [Google Scholar]
- Yu MK, Ma J, Fisher J, Kreisberg JF, Raphael BJ, and Ideker T (2018b). Visible Machine Learning for Biomedicine. Cell 173, 1562–1565. [DOI] [PMC free article] [PubMed] [Google Scholar]
- Yuan H, Paskov I, Paskov H, Gonzalez AJ, and Leslie CS (2016). Multitask learning improves prediction of cancer drug sensitivity. Sci Rep 6, 31619. [DOI] [PMC free article] [PubMed] [Google Scholar]
- Zampieri M, Zimmermann M, Claassen M, and Sauer U (2017). Nontargeted Metabolomics Reveals the Multilevel Response to Antibiotic Perturbations. Cell Rep 19, 1214–1228. [DOI] [PubMed] [Google Scholar]
- Zhao X, and Drlica K (2014). Reactive oxygen species and the bacterial response to lethal stress. Curr Opin Microbiol 21, 1–6. [DOI] [PMC free article] [PubMed] [Google Scholar]
- Zou H, and Hastie T (2005). Regularization and variable selection via the elastic net. Journal of the Royal Statistical Society: Series B (Statistical Methodology) 67, 301–320. [Google Scholar]
Associated Data
This section collects any data citations, data availability statements, or supplementary materials included in this article.
Supplementary Materials
Figure S1. Antibiotic reaction scores for purine biosynthesis; related to Figures 3 and 4.
Differences in purine biosynthesis pathway scores for ampicillin (AMP) and ciprofloxacin (CIP) from gentamicin (GENT) are primarily explained by early reactions in the purine biosynthesis pathway (gray box).
Table S5. Simulated metabolic flux states associated with each metabolite screening condition; related to Figure 3
Table S6. Metabolic reactions identified by multitask elastic net regularization to be enriched for in antibiotic lethality; related to Figure 3.
Figure S2. Purine biosynthesis participates in antibiotic lethality; related to Figure 4.
(A) Antibiotic lethality in pyrimidine biosynthesis deletion mutants. Genetic inhibition of pyrimidine biosynthesis by pyrC (dihydroorotase) or pyrE (orotate phosphoribosyltransferase) deletion does not significantly change ampicillin (AMP), ciprofloxacin (CIP) or gentamicin (GENT) lethality.
(B) Biochemical disruption of the folate cycle by trimethoprim (TRI) decreases AMP and CIP lethality, but increases GENT lethality.
Data are represented as mean ± SEM from n = 3 independent biological replicates.
Figure S3. Antibiotic stress rapidly disrupts intracellular nucleotide pools; related to Figure 5.
Purine nucleic acid bases (A: adenine, G: guanine) are depleted (red), while pyrimidine nucleic acid bases (C: cytosine, T: thymine, U: uracil) accumulate (blue) in E. coli cells treated with ampicillin (AMP), norfloxacin (NOR) or kanamycin (KAN). Data reanalyzed from Belenky et al., 2015.
Figure S4. Model simulations predict exogenous adenine supplementation decreases oxidative phosphorylation; related to Figure 6.
Figure S5. Adenine or uracil supplementation alters energy currencies and central carbon metabolism; related to Figure 6.
(A) Exogenous adenine (red) or uracil (blue) supplementation does not significantly alter unstressed growth in MOPS minimal medium.
(B) Intracellular AMP, ADP and ATP concentrations following adenine (ADE) or uracil (URA) supplementation.
(C) Relative intracellular NADPH, NADP+, NADH and NAD+ concentrations following adenine or uracil supplementation.
(D) Intracellular tricarboxylic acid cycle metabolite concentrations following adenine or uracil supplementation.
(E) Cellular respiration following adenine or uracil supplementation in the absence of antibiotic treatment.
Data are represented as mean ± SEM from n ≥ 3 independent biological replicates. Significance reported as FDR-corrected p-values in comparison with control: †: p ≤ 0.1, *: p ≤ 0.05, **: p ≤ 0.01, ***: p ≤ 0.001.
Table S3. Metabolites eliciting a ≥ 2-fold change in IC50 for each antibiotic; related to Figure 2.
Table S4. Metabolic pathways enriched from metabolites that elicited ≥ 2-fold change in ciprofloxacin (CIP) IC50, identified by Metabolite Set Enrichment Analysis in Ecocyc; related to Figure 2
Table S7. Metabolic pathways predicted to participate in ampicillin (AMP), ciprofloxacin (CIP) or gentamicin (GENT) lethality; related to Figure 3.
Table S8. Measured intracellular metabolite concentrations under adenine or uracil supplementation. Data are reported as mean ± SD and computed from LC-MS/MS measurements from n = 3 biological replicates; related to Figure 6.
Table S9. Oligonucleotides used for verifying E. coli gene deletions; related to STAR Methods.
Table S1. Metabolite mappings from Biolog PMs 1–4 to iJO1366 E. coli model; related to Figure 2.
Table S2. Measured antibiotic IC50s from metabolite screens on Biolog PMs 1–4. Data are computed from fitting logistic functions to 4 h OD600 measurements from n ≥ 3 biological replicates; related to Figure 2.