Abstract
Lymphocytic bronchitis (LB) precedes chronic lung allograft dysfunction (CLAD). The relationships of LB (classified here as Endobronchial or E-grade rejection) to small airway (A- and B-grade) pathologies are unclear. We hypothesized that gene signatures common to allograft rejection would be present in LB. We studied LB in two partially overlapping lung transplant recipient cohorts: Cohort 1 included large airway brushes (6 LB cases and 18 post-transplant referents). Differential expression using DESeq2 was used for pathway analysis and to define an LB-associated metagene. In Cohort 2, eight biopsies for each pathology subtype were matched with pathology-free biopsies from the same subject (totaling 48 samples from 24 subjects). These biopsies were analyzed by multiplexed digital counting of immune transcripts. Metagene score differences were compared by paired t-tests. Compared to referents in Cohort 1, LB demonstrated upregulation of allograft rejection pathways, and upregulated genes in these cases characterized an LB-associated metagene. We observed statistically increased expression in Cohort 2 for this LB-associated metagene and four other established allograft rejection metagenes in rejection vs. paired non-rejection biopsies for both E-grade and A-grade subtypes, but not B-grade pathology. Gene expression-based categorization of allograft rejection may prove useful in monitoring lung allograft health.
INTRODUCTION
Chronic lung allograft dysfunction (CLAD), manifested as obstruction or restrictive defects in lung function, affects approximately half of all lung transplant recipients within five years and is the major limitation to quality of life and survival in this population (1). By the time CLAD is diagnosed by spirometry, it may be too late to initiate certain interventions. Because acute cellular rejection (ACR) pathologies have been associated with increased CLAD risk, biomarkers of ACR may help identify incipient CLAD prior to frank lung function decline (2).
Established ACR pathologies include histopathologic evidence of peri-vascular and peri-bronchial lymphocytosis on transbronchial biopsies, denoted A-grade and B-grade ACR, respectively. Lymphocytic inflammation on endobronchial (large airway) biopsies, which we classify here by E-grade, has more recently been established as an important risk factor for CLAD, with a 2-fold increased risk of prospectively developing obstructive CLAD observed in two independent cohorts (3, 4). Given common mechanism of ACR across organ types, it is important to delineate whether the A-, B-, and E- rejection subtypes reflect pathways common to solid organ transplant rejection or a distinct pathway of rejection unique to lung allografts (5). The degree of pathway overlap might suggest the extent to which therapies to block rejection might translate.
Gene expression studies in solid organ transplant have demonstrated common signatures of rejection, but the performance of these gene signatures across lung transplant rejection pathologies has not been well described (6-8). We hypothesized that LB would be associated with increased expression of gene sets associated with solid organ transplant rejection.
MATERIALS AND METHODS
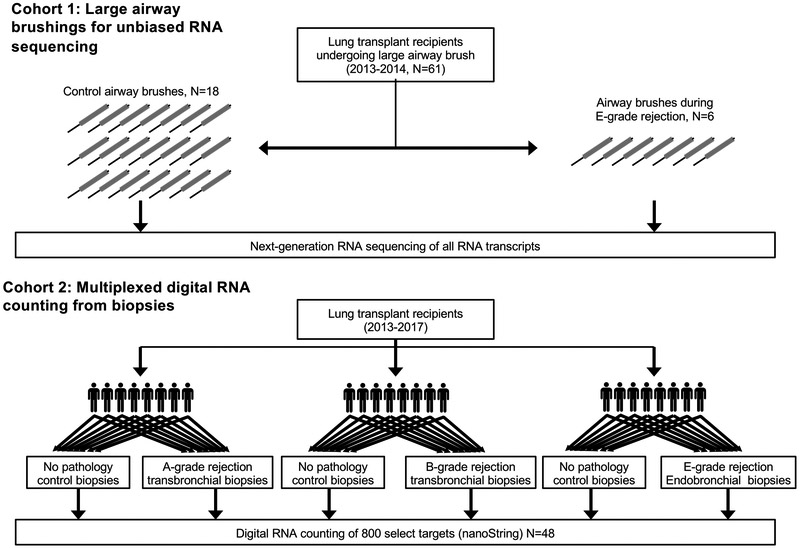
As illustrated in Figure 1, we examined ACR pathologies in two cohorts. Detailed methods are described in the supplement. Briefly, we prospectively collected large airway brushings and performed RNA sequencing on all available cases matched 1:3 to controls. We examined differential pathways and derived a metagene list of differentially expressed transcripts for Cohort 1. In Cohort 2, we performed digital RNA counting on 8 paired biopsies from subjects with and without A-, B-, and E-grade rejection. We evaluated the metagene from Cohort 1 in comparison with other published metagenes of solid organ rejection.
Figure 1: Study design.
In cohort 1, 6 LB cases, as defined by histopathologic examination of concurrent endobronchial biopsy, and 18 referents were selected from 71 large airway brushes performed sequentially on 61 subjects from 2013-2014. Unbiased RNA sequencing was performed on these brushes. In cohort 2, 8 subjects with each of A-, B-, or E-grade rejection were selected. RNA was extracted from tissue blocks with and without pathology and digital RNA was counted for immune-related genes.
RESULTS
Overall Characteristics.
The subject characteristics for both cohorts (Table 1) were well matched. The A-grade rejection biopsies from Cohort 2 were later post-transplant than for other rejection grades or for the brushes in Cohort 1. The neutrophil percentages in BAL were statistically greater in for LB cases than referents in Cohort 1 (p <0.001). There was no statistically significant difference in BAL neutrophil percentage between the case and control timepoints for the subjects in Cohort 2 subgroups. Finally, concurrent infection, manifest as positive bacterial cultures or viral PCR, were present in Cohort 1, but excluded by design from Cohort 2. It should be noted that more than 80% of subjects in both cohorts were receiving azithromycin prophylaxis. Biopsies from two subjects in the LB group of Cohort 2 were also included in Cohort 1.
Table 1:
Subject characteristics
| Cohort 1 - Airway Brush | Cohort 2 - Biopsies | ||||||
|---|---|---|---|---|---|---|---|
| Control | LB | P-value | A-grade | B-grade | E-grade | P- value |
|
| Total subjects | 18 | 6 | 8 | 8 | 8 | ||
| Pathology grade | |||||||
| 1 - minimal | 18 (100%) | 1 (17 %) | 0 (0 %) | - | 0 (0 %) | ||
| 2/1R - mild | 5 (83 %) | 5 (62 %) | 7 (88 %) | 7 (88 %) | |||
| 3 - moderate | 0 (0 %) | 2 (25 %) | - | 1 (12 %) | |||
| 4/2R - severe | 0 (0 %) | 1 (12 %) | 1 (12 %) | 0 (0 %) | |||
| Recipient age | 55 (10) | 58 (11) | 0.45 | 51 (21) | 61 (10) | 59 (7) | 0.34 |
| Donor age | 30 (13) | 28 (16) | 0.85 | 28 (16) | 37 (16) | 29 (14) | 0.49 |
| Male recipient | 9 (50 %) | 4 (67 %) | 0.81 | 4 (50 %) | 6 (75 %) | 5 (62 %) | 0.59 |
| Male donor | 11 (61 %) | 4 (67 %) | 1.00 | 5 (62 %) | 6 (75 %) | 4 (50 %) | 0.59 |
| Indication group | |||||||
| A - Obstructive | 3 (17 %) | 2 (33 %) | 0.66 | 2 (25 %) | 0 (0 %) | 2 (25 %) | 0.41 |
| B - Pulmonary vascular | 1 (6 %) | 0 (0 %) | 0 (0 %) | 0 (0 %) | 0 (0 %) | ||
| C - Cystic Fibrosis | 2 (11 %) | 0 (0 %) | 1 (12 %) | 0 (0 %) | 1 (12 %) | ||
| D - Restrictive | 12 (67 %) | 4 (67 %) | 5 (62 %) | 8 (100 %) | 5 (62 %) | ||
| Transplant Procedure | |||||||
| Double | 13 (72 %) | 5 (83 %) | 0.79 | 6 (75 %) | 7 (88 %) | 7 (88 %) | 0.74 |
| Heart-Lung | 1 (6 %) | 0 (0 %) | 0 (0 %) | 0 (0 %) | 0 (0 %) | ||
| Single | 4 (22 %) | 1 (17 %) | 2 (25 %) | 1 (12 %) | 1 (12 %) | ||
| Recipient Ethnicity | |||||||
| White, non-Hispanic | 12 (67 %) | 4 (67 %) | 1 | 6 (86 %) | 6 (75 %) | 6 (75 %) | 0.85 |
| Other | 6 (33 %) | 2 (33 %) | 1 (14 %) | 2 (25 %) | 2 (25 %) | ||
| Donor Ethnicity | |||||||
| White, non-Hispanic | 10 (56 %) | 2 (33 %) | 0.64 | 4 (57 %) | 4 (50 %) | 2 (25 %) | 0.41 |
| Other | 8 (44 %) | 4 (67 %) | 3 (43 %) | 4 (50 %) | 6 (75 %) | ||
| CMV D+/R− | 0 (1) | 0 (1) | 0.65 | 0 (0) | 0 (1) | 0 (0) | 0.63 |
| HLA mismatches | 5 (1) | 4 (1) | 0.07 | 5 (1) | 5 (1) | 5 (1) | 0.95 |
| BAL neutrophil % | 4 (5) | 14 (6) | 0.0002 | 7 (8) | 4 (7) | 6 (8) | 0.72 |
| BAL lymphocyte % | 5 (7) | 9 (9) | 0.25 | 11 (18) | 5 (6) | 6 (7) | 0.58 |
| Years post-transplant | 0.9 (0.6) | 0.8 (1.5) | 0.82 | 3.2 (3.2) | 0.8 (0.6) | 0.5 (0.5) | 0.02 |
| Days after control biopsy | 19 (272) | 240 (262) | 80 (69) | 0.14 | |||
| Azithromycin | 16 (89 %) | 5 (83 %) | 1.00 | 8 (100 %) | 7 (88 %) | 6 (75 %) | 0.32 |
| dose (mg/day) | 118 (52) | 104 (51) | 0.58 | 125 (0) | 109 (44) | 97 (60) | 0.44 |
| Mycophenolate | 13 (72 %) | 5 (83 %) | 1.00 | 6 (75 %) | 6 (75 %) | 5 (62 %) | 0.82 |
| dose (mg/day) | 896 (806) | 750 (742) | 0.70 | 880 (590) | 812 (832) | 838 (852) | 0.98 |
| Prednisone | 18 (100 %) | 6 (100 %) | 1.00 | 8 (100 %) | 8 (100 %) | 8 (100 %) | 1.00 |
| dose (mg/day) | 13 (6) | 12 (6) | 0.85 | 10 (5) | 11 (5) | 14 (7) | 0.32 |
| Tacrolimus | 17 (94 %) | 6 (100 %) | 1.00 | 7 (88 %) | 8 (100 %) | 8 (100 %) | 0.35 |
| dose (mg/day) | 6 (5) | 4 (3) | 0.48 | 2 (1) | 5 (4) | 4 (4) | 0.31 |
| CLAD-free survival (restricted mean years ± SE) | 4.02 ± 0.39 | 3.43 ± 1.15 | 0.77 | 5.51 ± 0.45 | 4.61 ± 0.64 | 4.73 ± 0.77 | 0.52 |
| No Infection | 9 (50 %) | 2 (33 %) | 0.81 | 8 (100 %) | 8 (100 %) | 8 (100 %) | 1.00 |
| Pathogen | |||||||
| Aspergullus | 4 | 1 | |||||
| Penicillium | 4 | 1 | |||||
| Haemophilus parainfluenzae | 0 | 3 | |||||
| Rhinovirus | 2 | 1 | |||||
| Staphylococcus aureus | 2 | 1 | |||||
| Other pathogens | Fusarium, Syncephalastrum spp. | Mucorales, Parainfluenza | |||||
P-values results are based on chi-square and ANOVA tests (for categorical and continuous variables, respectively) compared across the 5 groups.
Cohort 1:
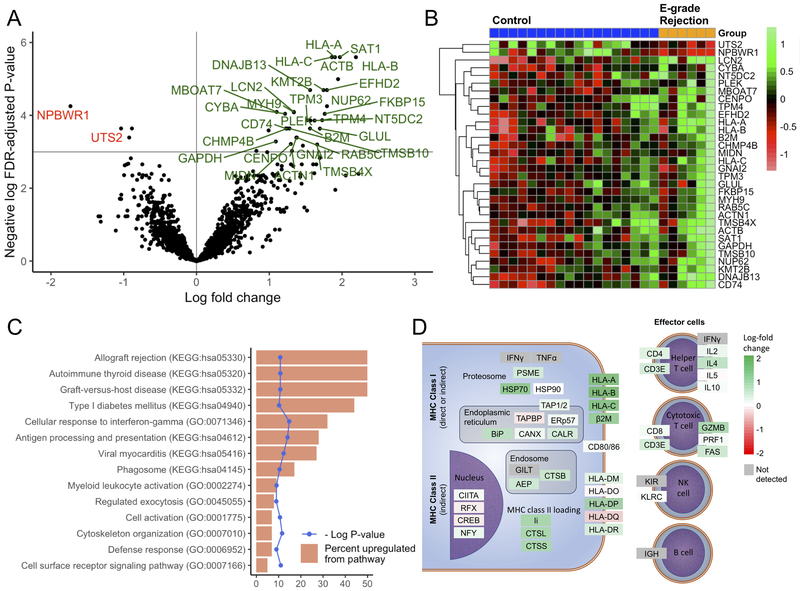
We assessed which genes were most differentially expressed in LB samples compared to referents. As shown in Figure 2A, expression was increased for 30 genes and decreased for 2 genes by at least 2-fold in subjects with LB as compared to controls at a 5% FDR. The normalized counts for these genes across individual samples are visualized by heat map in Figure 2B. We assessed for overrepresentation of KEGG pathways and gene ontology (GO) biological process terms for the 61 genes upregulated at a 10% FDR in LB cases. Stratifying by infection, there were no differentially expressed genes (FDR > 0.99). Figure 2C shows the pathways upregulated at an FDR of <5%. Notable processes included the GO “Cellular response to interferon-gamma”; KEGG “allograft rejection”; and “antigen processing and presentation” pathways. To visualize the upregulation of genes within these KEGG pathways, we mapped the observed log-fold change of these transcripts to the KEGG metabolic pathway map (Figure 2D). Again, class I antigen presentation stood out as the most upregulated, with increases in cytotoxic and helper T cell genes, but no substantive change in B or NK cell genes. Of note, LB was not associated with induction of antibodies to MHC molecules (Supplemental Figure 1S).
Figure 2: Differential gene expression analysis of large airway brushings from subjects with lymphocytic bronchitis (LB) versus controls (Cohort 1).
Transcripts upregulated (green) or downregulated (red) in the LB cohort with a false-discovery rate (FDR)-adjusted p-value <0.05 and a log2 fold-change greater than 1 are shown by volcano plot (A) and heatmap (B). Pathway analysis was performed on 61 genes upregulated at an FDR-adjusted p-value of <0.1 using the Gene Ontology (GO) and Kyoto Encyclopedia of Genes and Genomes (KEGG) databases. For these 61 genes, pathways upregulated (at an FDR-adjusted p-value of <0.05) are shown (C) as the percent of upregulated genes of total genes in the pathway (orange) with the unadjusted log p-value (blue). (D) Genes in the KEGG antigen presentation and allograft rejection KEGG metabolic pathway maps are shown colored by the observed log2 fold change in gene expression, with upregulated genes in green and downregulated genes in red.
Cohort 2:
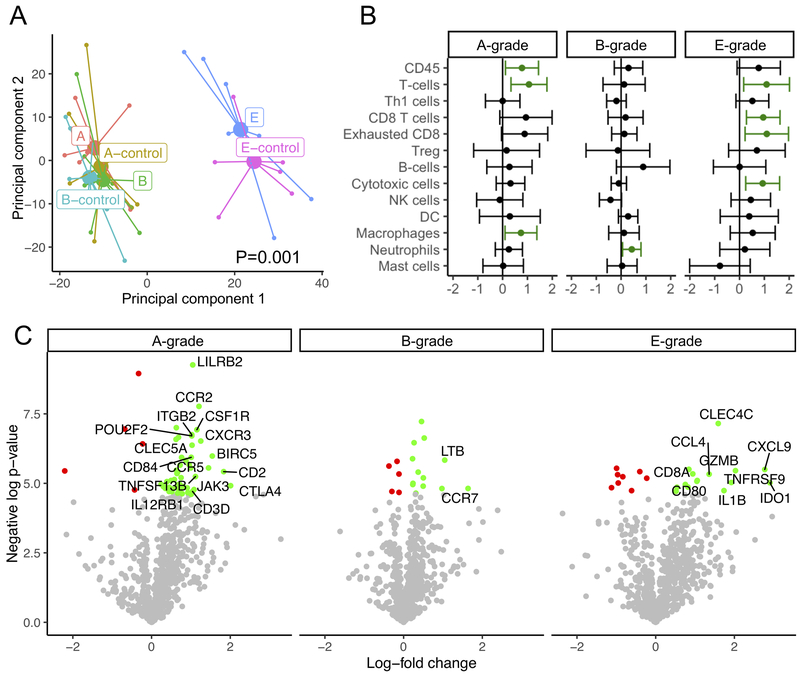
To understand the relation among the three graded types of ACR, we compared gene expression changes across RNA extracted from paired biopsy tissue samples. We performed principal component analysis (Figure 3A), which showed that the most significant determinant in gene expression across the panel was biopsy type, with endobronchial biopsies segregating from transbronchial biopsies. Clustering according to group was confirmed by PERMANOVA, with a p-value of 0.001. There was some segregation of A- and E-score (but not B-score) cases from controls along the second principal component.
Figure 3: Differential gene expression in paired biopsies from subjects with A-, B-, or E-grade rejection as compared with biopsies from the same subject showing no pathology, as determined by digital RNA counting (Cohort 2).
(A) Principal component analysis shows that samples clustered by endobronchial vs transbronchial biopsy type (P=0.001 by PERMANOVA). (B) Gene signatures specific to leukocyte subtypes were compared between samples using paired t-tests, with a dot and whiskers showing the mean and 95% confidence intervals of the difference in metagene score. Increased expression is shown in green. (C) Volcano plots demonstrate differential gene expression for each pathology type between cases and paired controls with an unadjusted p-value threshold of 0.01, with increased and decreased expression in green and red, respectively. Labeled genes had an absolute log fold change >1.
We compared metagenes scores for transcripts previously identified to be indicative of specific cell types between cases and paired controls of pathology subtypes (Figure 3B). E-grade rejection was associated with increases in cytotoxic T cells. A-grade rejection showed increased macrophages and also showed increases in T cells, but not a specific T cell type. By contrast, the only cell type upregulated in B-grade rejection was neutrophils.
We also evaluated the most differentially expressed transcripts in this cohort (Figure 3C). No genes were differentially expressed at an FDR-adjusted p-value threshold of 0.05. At an unadjusted p-value threshold of 0.01, A-grade rejection had the most differentially expressed genes, followed by E-grade rejection. By inspection, many of genes most upregulated in A- and E-grade rejection are genes previously described as upregulated during renal allograft rejection, including (7).
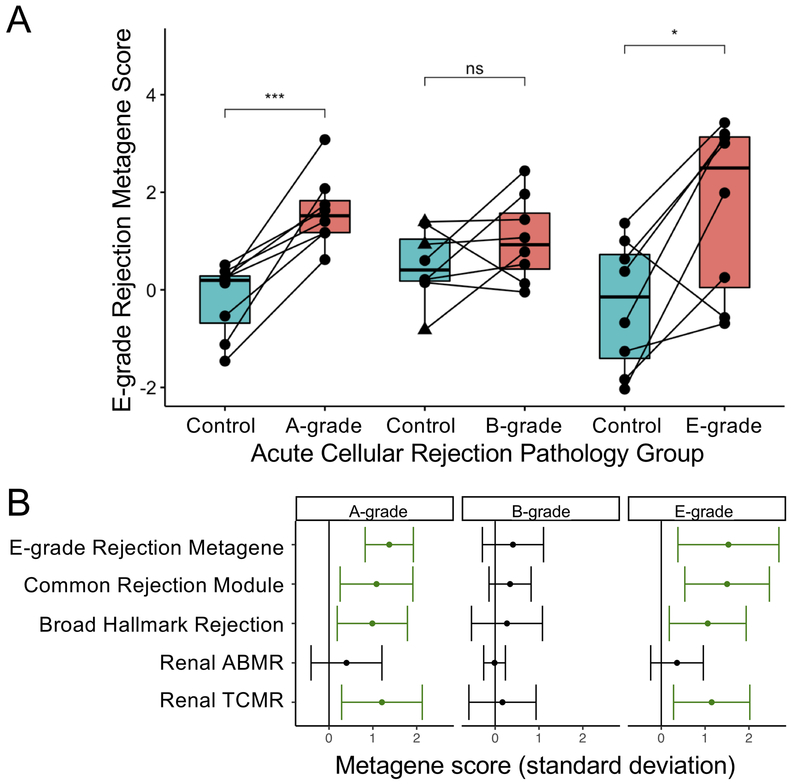
We sought to assess the performance of a metagene based on Cohort 1 or other solid organ transplant rejection metagenes in identifying rejection in any of the lung transplant rejection subtypes. Figure 4A shows paired comparisons across the three pathology subtypes for the LB metagene score, equivalent to standard deviation change in the sum of the counts for the 61 genes identified in cohort 1. This LB score was increased in E- and A-grade rejection, but not B-grade rejection. Although half of the A-grade samples were obtained >1.5 years post-transplant, we observed a statistically significant increase in LB metagene score limiting analysis to either before or after 1.5-years (P=0.03 and P=0.04, respectively). To assess whether pathology in the control groups might bias towards the null hypothesis, we regraded these H&E-stained sections for these controls. BALT was identified in 3 controls from the B-grade group and 1 control from the A-grade group, which also had borderline venule lymphocytes that otherwise did not meet criteria for A-grade rejection. One of the B group controls with BALT had evidence of resolving organizing pneumonia and a fourth control in the B group had scattered eosinophils. Excluding samples with BALT did not affect which metagenes were significantly different with a P=0.05 threshold from what is shown in Figure 4B.
Figure 4: Comparison of solid organ rejection metagenes in lung transplant tissue rejection studies.
(A) A metagene based on the 61 genes upregulated with an FDR p-value <0.1 in Cohort 1 was used to compare paired cases and controls in Cohort 2 across the three pathology types. Statistical significance was determined by and denoted as ***, p<0.001 and *, p<0.05. Control samples with bronchus-associated lymphoid tissue (BALT) are indicated by triangles. (B) Changes in metagene scores for the Lymphocytic Bronchitis metagene are shown in comparison with previously identified signatures of rejection. Estimates for the mean and 95% confidence intervals from the difference in metagene score between case and control time points are shown as determined by paired t-test, with statistically significant increases shown in green. ABMR: Antibody-mediated rejection, TCMR: T cell-mediated rejection.
We also compared the LB metagene with previously described gene signatures of solid organ transplant rejection. As shown in Figure 4B, for A-grade and E-grade rejection there were statistically significant increases in the Common Rejection Module, the Hallmark Rejection gene signature, and the T cell-mediated renal transplant rejection (TCMR) gene signature (6-8). In a sensitivity analysis excluding cases of overlap between the two cohorts, we observed similar increases in these metagenes.
No group had an increase in the antibody-mediated renal transplant rejection (ABMR) gene signature and there were no statistically significant differences observed for the B-grade pathology cohort.
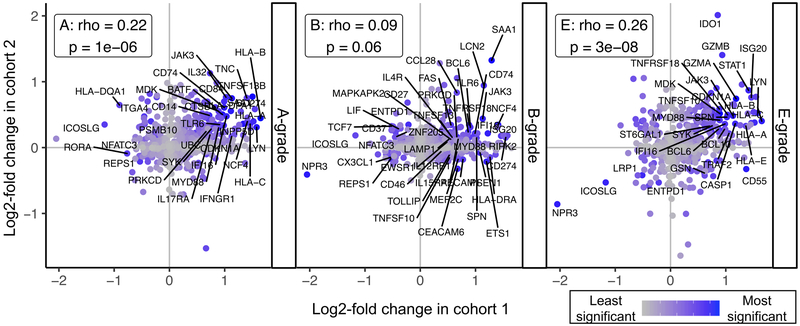
Finally, we sought to visualize commonalities in differential expression between the two cohorts. For each pathology subtype, we plotted the log-fold change in expression as determined in cohort 2 versus the log-fold change from cohort 1 (Figure 5). We observed a statistically significant correlation between the rank of log fold change in Cohort 1 with Cohort 2 A- and E-grade rejection, but not B-grade rejection.
Figure 5: Correlations between results from Cohorts 1 and 2. Log fold change in differential expression for genes detected by RNAseq from large airway brushes (cohort 1, x-axis) and detected by digital RNA counting analysis of biopsies with A-, B-, or E-grade rejection (y-axes).
Increasing maximum rank for statistical significance across the two assays is shown in blue and the top 10% most significant genes across the two cohorts labeled. Spearman’s rank order correlation coefficient (rho) and associated p-values are shown for each rejection type.
DISCUSSION
We compared differential gene expression associated with LB in two cohorts both from airway brushings and stored tissue blocks, and related these changes with those observed in A- and B-grade acute cellular lung transplant rejection. We found agreement between unbiased sequencing of large airway brushes and results from digital counting of RNA probes, a technology that allows robust quantification of transcripts despite the RNA degradation that is observed in FFPE tissue blocks.
Importantly, we also found that A- and E-grade rejection each were associated with upregulation of multiple gene sets previously associated with rejection in other solid organ transplant populations. While we observed upregulation of class I MHC molecules within Cohort 1, and A- and B- grades within Cohort 2, class I HLA genes are not part of the common rejection module, suggesting multiple pathways are affected. Further, the lack of change in the antibody-mediated rejection (ABMR) metagene supports the notion that this common pathology is specific to T cell-mediated rejection. One notable gene upregulated across all groups was JAK3, inhibition of which has been shown to prevent allograft rejection in multiple randomized controlled clinical trials, albeit with increased incidence of infection (9). The most unifying signal we observed is cellular response to interferon, which is upstream of many of the observed upregulated transcripts from both cohorts, including IDO1 (10), HLA Class I (11), JAK3 (12), and the CXCL9–11 chemokine family, also known as monokines induced by gamma interferon (MIG) (13). Upregulation of HLA and cytotoxic mediators are also characteristic of autoimmune diabetes and viral myocarditis, which may explain the upregulation of these pathways in Cohort 1. Together, these findings suggest that genes induced by interferon signaling are common to lung transplant pathologies, and may be responsible for cytotoxic lymphocyte recruitment to airways.
There are multiple potential explanations for why findings for B-grade pathology differed from A- and E-grade pathologies. Although we selected the most severe pathology cases available, the pathology severity in the B-group was generally lower than in the A- and E-groups. Further, the control samples within the B-group had more BALT than was observed in controls from the other groups and B-group cases did not display BAL neutrophilia. Multiple studies have shown that inter-observed reliability for B-grade rejection is substantially worse than that for A-grade rejection, with a kappa of 0.26 vs 0.65 in one study (14). B-grade rejection can overlap with infection pathology and is dependent on the presence of sufficient airway tissue. Indeed, a prominent commonality between B-grade rejection in cohort 2 and cohort 1 was the epithelial cell injury and neutrophil-associated gene LCN2, which has also been identified in the BAL of patients with interstitial pulmonary fibrosis (15). Whether the neutrophil, CCR7+, and/or type-2 inflammation pathways seen in the B-grade group indicate distinct rejection pathology or reflect idiosyncrasies of this cohort will require further studies. On the other hand, the agreement between allograft rejection metagene and E-grade pathology scores may help explain the more statistically significant association with E-grade scores with time to CLAD (3).
This study has important limitations. The small size of both cohorts limits the power to identify less differentially expressed genes. Thus, there could be multiple other gene pathways that are differentially expressed during LB and transbronchial rejection pathologies that were not detected here. Further, there may be subtypes of rejection beyond the major histopathologic categories that would only become apparent from analysis of substantially larger data sets. Also, degree of correlation in differential gene expression between the two cohorts might increase with larger sample sizes. On the other hand, the use of 3:1 matching including control samples with infection should minimize the impact of infection as a confounder of the observed metagene. Because cases were generally collected after controls in Cohort 2, there also is a potential for a time-effect, which would likely bias inflammatory signals towards the null. The use of different techniques between Cohorts 1 and 2 can be seen as a strength, as it demonstrates these findings are not dependent on a given technical approach. Differences between the cohorts, make comparison between these techniques challenging, however.
In summary, we identified differentially expressed genes associated with LB. LB had transcriptional changes common to other lung and non-lung allograft rejection pathologies. These findings suggest a common biology of allograft rejection that may present despite heterogeneous histopathologic findings. Thus, gene expression-based adjuncts could reduce misclassification, potentially leading to improved outcomes.
Supplementary Material
Acknowledgements:
We acknowledge the study participants and their families for their generous contributions, and Dr. George Caughey for his mentorship and input into prior versions of this manuscript.
Project funding came from award IK2CX001034 (JRG) from the Clinical Sciences Research & Development Service of the Veterans Affairs Office of Research and Development, the UCSF Department of Pathology (NYG).
Abbreviations:
- ABMR
antibody-mediated rejection (gene signature)
- ACR
acute cellular rejection
- BAL
bronchoalveolar lavage
- BALT
bronchus-associated lymphoid tissue
- cDNA
complementary DNA
- CLAD
chronic lung allograft dysfunction
- CMV
cytomegalovirus
- CRM
common rejection module (gene signature)
- FDR
false discovery rate
- FeNO
fraction of exhaled nitric oxide
- FEV1
forced expiratory volume in 1 second
- FFPE
formalin-fixed paraffin-embedded
- FVC
Forced vital capacity
- GO
Gene Ontology
- H&E
Hematoxylin and eosin
- KEGG
Kyoto Encyclopedia of Genes and Genomes
- LB
lymphocytic bronchitis
- NK
natural killer
- NRAD
neutrophilic reversible allograft dysfunction
- TCMR
T-cell mediated rejection (gene signature)
- UCSF
University of California, San Francisco
References:
- 1.Vermeulen KM, Groen H, van der Bij W, Erasmus ME, Koeter GH, TenVergert EM. The effect of bronchiolitis obliterans syndrome on health related quality of life. Clin Transplant 2004; 18: 377–383. [DOI] [PubMed] [Google Scholar]
- 2.Benzimra M, Calligaro GL, Glanville AR. Acute rejection. J Thorac Dis 2017; 9: 5440–5457. [DOI] [PMC free article] [PubMed] [Google Scholar]
- 3.Greenland JR, Jones KD, Hays SR, Golden JA, Urisman A, Jewell NP, Caughey GH, Trivedi NN. Association of large-airway lymphocytic bronchitis with bronchiolitis obliterans syndrome. Am J Respir Crit Care Med 2013; 187: 417–423. [DOI] [PMC free article] [PubMed] [Google Scholar]
- 4.Verleden SE, Scheers H, Nawrot TS, Vos R, Fierens F, Geenens R, Yserbyt J, Wauters S, Verbeken EK, Nemery B, Dupont LJ, Van Raemdonck DE, Verleden GM, Vanaudenaerde BM. Lymphocytic bronchiolitis after lung transplantation is associated with daily changes in air pollution. Am J Transplant 2012; 12: 1831–1838. [DOI] [PubMed] [Google Scholar]
- 5.Ingulli E Mechanism of cellular rejection in transplantation. Pediatr Nephrol 2010; 25: 61–74. [DOI] [PMC free article] [PubMed] [Google Scholar]
- 6.Khatri P, Roedder S, Kimura N, De Vusser K, Morgan AA, Gong Y, Fischbein MP, Robbins RC, Naesens M, Butte AJ, Sarwal MM. A common rejection module (CRM) for acute rejection across multiple organs identifies novel therapeutics for organ transplantation. J Exp Med 2013; 210: 2205–2221. [DOI] [PMC free article] [PubMed] [Google Scholar]
- 7.Halloran PF, Venner JM, Madill-Thomsen KS, Einecke G, Parkes MD, Hidalgo LG, Famulski KS. Review: The transcripts associated with organ allograft rejection. Am J Transplant 2018; 18: 785–795. [DOI] [PubMed] [Google Scholar]
- 8.Liberzon A, Birger C, Thorvaldsdottir H, Ghandi M, Mesirov JP, Tamayo P. The Molecular Signatures Database (MSigDB) hallmark gene set collection. Cell Syst 2015; 1: 417–425. [DOI] [PMC free article] [PubMed] [Google Scholar]
- 9.Baan CC, Kannegieter NM, Felipe CR, Tedesco Silva H Jr. Targeting JAK/STAT Signaling to Prevent Rejection After Kidney Transplantation: A Reappraisal. Transplantation 2016; 100: 1833–1839. [DOI] [PubMed] [Google Scholar]
- 10.Liu R, Merola J, Manes TD, Qin L, Tietjen GT, Lopez-Giraldez F, Broecker V, Fang C, Xie C, Chen PM, Kirkiles-Smith NC, Jane-Wit D, Pober JS. Interferon-gamma converts human microvascular pericytes into negative regulators of alloimmunity through induction of indoleamine 2,3-dioxygenase 1. JCI Insight 2018; 3. [DOI] [PMC free article] [PubMed] [Google Scholar]
- 11.Mitchell C, Provost K, Niu N, Homer R, Cohn L. IFN-gamma acts on the airway epithelium to inhibit local and systemic pathology in allergic airway disease. J Immunol 2011; 187: 3815–3820. [DOI] [PMC free article] [PubMed] [Google Scholar]
- 12.Musso T, Johnston JA, Linnekin D, Varesio L, Rowe TK, O’Shea JJ, McVicar DW. Regulation of JAK3 expression in human monocytes: phosphorylation in response to interleukins 2, 4, and 7. J Exp Med 1995; 181: 1425–1431. [DOI] [PMC free article] [PubMed] [Google Scholar]
- 13.Koper OM, Kaminska J, Sawicki K, Kemona H. CXCL9, CXCL10, CXCL11, and their receptor (CXCR3) in neuroinflammation and neurodegeneration. Adv Clin Exp Med 2018; 27: 849–856. [DOI] [PubMed] [Google Scholar]
- 14.Chakinala MM, Ritter J, Gage BF, Aloush AA, Hachem RH, Lynch JP, Patterson GA, Trulock EP. Reliability for grading acute rejection and airway inflammation after lung transplantation. J Heart Lung Transplant 2005; 24: 652–657. [DOI] [PubMed] [Google Scholar]
- 15.Ikezoe K, Handa T, Mori K, Watanabe K, Tanizawa K, Aihara K, Tsuruyama T, Miyagawa-Hayashino A, Sokai A, Kubo T, Muro S, Nagai S, Hirai T, Chin K, Mishima M. Neutrophil gelatinase-associated lipocalin in idiopathic pulmonary fibrosis. Eur Respir J 2014; 43: 1807–1809. [DOI] [PubMed] [Google Scholar]
Associated Data
This section collects any data citations, data availability statements, or supplementary materials included in this article.


