Venous thromboembolism (VTE), including pulmonary embolism and deep venous thrombosis, is more common in cancer patients than in the general population.1,2 Multiple mechanisms underlie the association between cancer and thrombosis, including the interaction of the tumor cells with platelets and monocytes, activation of the host hemostatic system, and production of procoagulant proteins (e.g., procoagulant A, tissue factor, cancer procoagulants, factor VII, and plasminogen-activator inhibitors 1 and 2).3,4 These mechanisms are controlled by the same oncogenes that drive neoplastic transformation.3 In addition to the intrinsic thrombogenicity of cancer, the co-existence of multiple VTE risk factors, including chemotherapy, surgery, immobility, and prolonged hospitalization, magnifies the risk of VTE.2
With an annual incidence of 1 in 200,2 cancer-associated thrombosis is a leading cause of death among cancer patients. Accurate diagnosis and treatment of VTE in cancer patients is important to avoid significant morbidities and mortality. Clinical presentation and laboratory data help physicians to identify patients with a high probability of developing VTE, for whom diagnostic imaging studies are required.5
Upon activation of the coagulation cascade, D-dimer is formed apace with thrombus formation.6 This allows D-dimer to be used as a highly sensitive biomarker for detecting VTE. In the general population, D-dimer is useful in excluding VTE by virtue of its high negative predictive value (NPV), avoiding unnecessary diagnostic imaging studies if D-dimer tests are negative.7 Unfortunately, baseline D-dimer levels are often elevated in cancer patients, especially those with advanced disease.8 However, it remains unclear whether different diagnostic cutoff values for D-dimer can be applied for different types of cancer. Current guidelines9 for the general population provide best practice advice for physicians, but there have been no data from a large number of cancer patients to validate the performance of D-dimer in the prediction of VTE at the cutoff points currently in use. We sought to determine whether cancer type-specific cutoff values for D-dimer can improve diagnostic accuracy and which D-dimer cutoff point performs best in each type of cancer.
All patients who visited the emergency department of The University of Texas MD Anderson Cancer Center (Houston, Texas, USA) between January 1, 2009, and December 31, 2012, with a laboratory request for measurement of D-dimer were identified. Patients’ demographic, clinical and laboratory data, including D-dimer levels, were collected. The presence or absence of VTE was determined by reviewing the imaging reports. A second cohort of patients who presented to the emergency department of King Hussein Cancer Center (Amman, Jordan) between January 1, 2009, and December 31, 2015 was used as a validation cohort. D-dimer levels were analyzed for each cancer type and similar results were grouped together. Receiver operating characteristic (ROC) curve analysis of each group was performed, and the area under the curve (AUC) was calculated. The performances of the current conventional cutoff point (0.5 μg/mL), the age-adjusted cutoff point,10 and the 75th percentile of the study population11 were analyzed for their usefulness in detecting VTE and compared for different cancer groups.
VTE was confirmed by diagnostic imaging studies in 900 of the 4700 patients in the MD Anderson cohort (19.15%) and 101 of the 508 patients in the King Hussein cohort (19.88%). Of the 900 patients with VTE in the MD Anderson cohort, 506 had pulmonary embolism, 219 had lower limb deep venous thrombosis, and 42 had other venous thromboses; 133 (14.8%) had more than one site of VTE at the same time. In the King Hussein cohort, 32 patients had pulmonary embolism, 58 had lower limb deep venous thrombosis, one had another type of venous thrombosis, and ten had VTE in more than one site at the same time (Online Supplementary Figure S1).
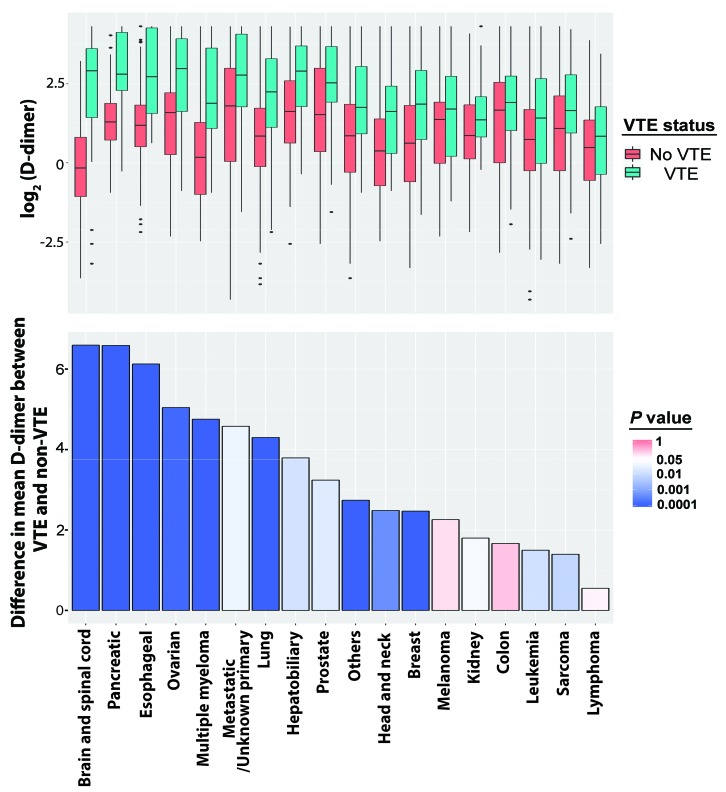
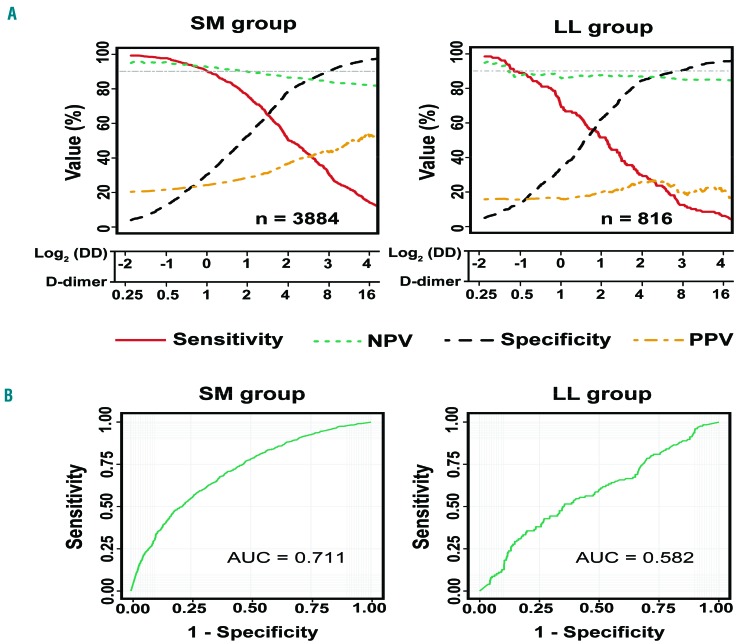
D-dimer levels were significantly higher in patients with VTE than in those without VTE across many different types of malignancy (Figure 1). The difference in mean D-dimer levels between the VTE and non-VTE groups was highest in patients with brain and spinal cord cancer (6.59 μg/mL), and lowest in patients with lymphoma (0.55 μg/mL). Among the other hematologic malignancies, the difference was 1.50 μg/mL in leukemia patients but 4.75 μg/mL in multiple myeloma patients. The sensitivity, specificity, NPV, and positive predictive value of D-dimer for a range of D-dimer values were different among various types of cancers (Online Supplementary Figure S2). Obvious differences can be seen in the curves for sensitivity and NPV for lymphoma and leukemia compared with other cancer types (Figure 2A); hence, leukemia and lymphoma were considered together in one group (LL), and multiple myeloma together with solid tumors in another group (SM) for further analysis.
Figure 1.
Comparison of D-dimer levels between patients who had or did not have venous thromboembolism among different types of cancer. Upper panel: boxplots showing the distribution of log2 D-dimer levels for each cancer type in the presence or absence of venous thromboembolism (VTE). Lower panel: bar graph showing the differences in mean D-dimer levels between patients who had VTE and patients who did not have VTE for each cancer type. The median differences were compared using the Mann–Whitney U test and P values are plotted as a color scale representing the significance of differences between the two groups.
Figure 2.
Performance of D-dimer levels in the prediction of venous thromboembolism in the group with solid cancers and multiple myeloma and in the group with lymphoma and leukemia. (A) Sensitivity, specificity, negative predictive value (NPV), and positive predictive value (PPV) of D-dimer for the group with solid cancers and multiple myeloma (SM) and the group with lymphoma and leukemia (LL). (B) Receiver operating characteristic curve analysis of D-dimer for the prediction of venous thromboembolism in the SM and LL groups. AUC: area under the curve.
The AUC for the ROC curve for all solid tumors was 0.708 [95% confidence interval (95% CI): 0.687-0.729], which was not significantly different (P=0.111) from the 0.782 (95% CI: 0.694-0.870) AUC for multiple myeloma. Likewise, no significant difference (P=0.63) was observed between leukemia and lymphoma; the AUC for leukemia was 0.595 (95% CI: 0.521-0.669) and the AUC for lymphoma was 0.567 (95% CI: 0.482-0.652) (Online Supplementary Figure S3). After grouping, a significant difference was observed between the 0.582 (95% CI: 0.526-0.638) AUC for the LL group and the 0.711 (95% CI: 0.691-0.731) AUC for the SM group (P<0.001) (Figure 2B).
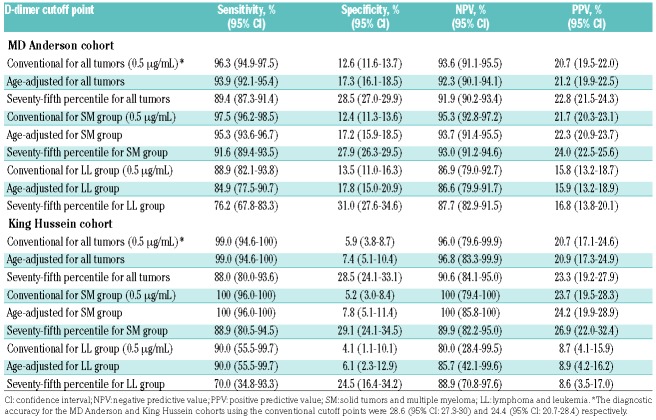
Different methods for determining D-dimer cutoff points were compared to test the usefulness of each method in predicting VTE for each of the two cohorts (Table 1). For all cancer types, the sensitivity and NPV were highest when the current conventional cutoff was used. In the MD Anderson cohort, the sensitivity of the current conventional cutoff was 96.3% (95% CI: 94.9%-97.5%). This was significantly higher than the sensitivity of 93.9% (95% CI: 92.1%-95.4%) for the age-adjusted cutoff and 89.4% (95% CI: 87.3%-91.4%) for the 75th percentile cutoff (P<0.001 for both comparisons). Upon stratifying the cancer types into the LL and SM groups, D-dimer performed poorly in the LL group. All three methods had poor sensitivity and NPV (all <90%) (Table 1). For the SM group, the sensitivity was 97.5% (95% CI: 96.2%-98.5%) for the current conventional cutoff, which was significantly higher (P<0.001) than that of the other two cutoffs (age-adjusted: 95.3%, 95% CI: 93.6%-96.7%; 75th percentile: 91.6%, 95% CI: 89.4%-93.5%). The NPV for the SM group was 95.3% (95% CI: 92.8%-97.2%), which was also significantly higher than the NPV of the age-adjusted cutoff (93.7%, 95% CI: 91.4%-95.5%, P=0.032) and 75th percentile cutoff (93.0%, 95% CI: 91.2%-94.6%, P=0.013).
Table 1.
Performance of current conventional and alternative D-dimer cutoff points for different cancer groups.
Similar observations were made in the King Hussein cohort. The sensitivity and NPV were poor for the LL group for all three cutoffs (all ≤90%) (Table 2). For the SM group, both the current conventional cutoff and the age-adjusted cutoff achieved 100% sensitivity and NPV, which were much higher than those for the 75th percentile cutoff, which achieved 88.9% sensitivity and 89.9% NPV in this group.
Our data suggest that the diagnostic accuracy of D-dimer in excluding VTE in cancer patients presenting to the emergency department varies significantly by cancer type. Variation in D-dimer levels was observed among different cancer types; patients with lymphoma and leukemia had the lowest difference in mean D-dimer levels between patients with VTE and patients without VTE. This was confirmed by the low AUC of the ROC curve, which was significantly lower for the LL group than for the SM group. Different D-dimer cutoff points achieved different diagnostic success; the current conventional cutoff (0.5 μg/mL) was superior to both the age-adjusted cutoff10 and the 75th percentile cutoff11 in detecting VTE in the SM group. However, the three cutoff points cannot safely exclude VTE in lymphoma or leukemia patients.
Improving the VTE diagnostic approach for cancer patients may optimize the cost/risk-to-benefit ratios of diagnostic studies.12 Current guidelines9 provide best practice advice for evaluating patients with suspected acute pulmonary embolism. These guidelines are of great importance in preventing the overuse of tests in the evaluation of patients, including computed tomography imaging and plasma D-dimer measurement, minimizing unnecessary exposure of patients to radiation and decreasing their expenses.12 However, the usefulness of some of these guidelines in cancer patients requires further study. It is possible that a significant portion of the patients in our study who had not undergone appropriate diagnostic imaging studies within 2 days of the visit were deemed to have low pretest probabilities for VTE, and imaging studies were not indicated. However, the validated clinical prediction rules in combination with D-dimer (American College of Physicians guideline for suspected pulmonary embolism)9 are based on findings in the general population. We have unpublished data indicating that the American College of Physicians guideline was not followed in 44% of patients with suspected pulmonary embolism in our comprehensive cancer center, as this guideline is not based on cancer patients.
Different types of cancer may modulate the host hemostatic system differently, and hence activation of the coagulation cascade, and the formation of D-dimer may vary among different cancer types. Pulmonary microthrombosis as a result of the dual effect of tumorigenesis and thrombogenesis of cancer metastasis13 may lead to alterations in baseline D-dimer levels in cancer patients, especially in those with advanced-stage disease.8 This phenomenon was also observed in liquid tumors; patients at the initial onset or in a relapsed phase of acute leukemia were found to have significantly higher D-dimer plasma levels than patients in complete remission.14 Disseminated intravascular coagulation is a common complication among cancer patients. Patients with hematologic malignancies, especially patients with acute leukemia, have a high risk of developing disseminated intravascular coagulation upon presentation or during induction therapy.15 All of these factors may affect the performance of D-dimer in predicting VTE.
Here we showed that the diagnostic accuracy of D-dimer in detecting VTE in cancer patients presenting to the emergency department varied significantly by cancer type. D-dimer performed poorly in excluding VTE among patients with lymphoma or leukemia. Negative D-dimer results using any of the three cutoff points investigated in this study cannot safely exclude VTE in these patients, and the possibility of lower D-dimer threshold levels should be considered for this population.
Supplementary Material
Acknowledgments
The authors acknowledge Erica Goodoff, ELS, for editorial support.
Footnotes
Funding: the University of Texas MD Anderson Cancer Center is supported in part by the National Institutes of Health through Cancer Center Support Grant P30CA016672.
Information on authorship, contributions, and financial & other disclosures was provided by the authors and is available with the online version of this article at www.haematologica.org.
References
- 1.Chew HK, Wun T, Harvey D, Zhou H, White RH. Incidence of venous thromboembolism and its effect on survival among patients with common cancers. Arch Intern Med. 2006;166(4):458–464. [DOI] [PubMed] [Google Scholar]
- 2.Lee AY, Levine MN. Venous thromboembolism and cancer: risks and outcomes. Circulation. 2003;107(23 Suppl 1):I17–21. [DOI] [PubMed] [Google Scholar]
- 3.Magnus N, D’Asti E, Meehan B, Garnier D, Rak J. Oncogenes and the coagulation system--forces that modulate dormant and aggressive states in cancer. Thromb Res. 2014;133 Suppl 2:S1–9. [DOI] [PubMed] [Google Scholar]
- 4.Falanga A, Russo L, Milesi V, Vignoli A. Mechanisms and risk factors of thrombosis in cancer. Crit Rev Oncol Hematol. 2017;118:79–83. [DOI] [PubMed] [Google Scholar]
- 5.Pabinger I, Thaler J, Ay C. Biomarkers for prediction of venous thromboembolism in cancer. Blood. 2013;122(12):2011–2018. [DOI] [PubMed] [Google Scholar]
- 6.Adam SS, Key NS, Greenberg CS. D-dimer antigen: current concepts and future prospects. Blood. 2009;113(13):2878–2887. [DOI] [PubMed] [Google Scholar]
- 7.Righini M, Perrier A, De Moerloose P, Bounameaux H. D-dimer for venous thromboembolism diagnosis: 20 years later. J Thromb Haemost. 2008;6(7):1059–1071. [DOI] [PubMed] [Google Scholar]
- 8.Dirix LY, Salgado R, Weytjens R, et al. Plasma fibrin D-dimer levels correlate with tumour volume, progression rate and survival in patients with metastatic breast cancer. Br J Cancer. 2002;86(3):389–395. [DOI] [PMC free article] [PubMed] [Google Scholar]
- 9.Raja AS, Greenberg JO, Qaseem A, et al. Evaluation of patients with suspected acute pulmonary embolism: best practice advice from the Clinical Guidelines Committee of the American College of Physicians. Ann Intern Med. 2015;163(9):701–711. [DOI] [PubMed] [Google Scholar]
- 10.Righini M, Van Es J, Den Exter PL, et al. Age-adjusted D-dimer cutoff levels to rule out pulmonary embolism: the ADJUST-PE study. JAMA. 2014;311(11):1117–1124. [DOI] [PubMed] [Google Scholar]
- 11.Ay C, Vormittag R, Dunkler D, et al. D-dimer and prothrombin fragment 1 + 2 predict venous thromboembolism in patients with cancer: results from the Vienna Cancer and Thrombosis study. J Clin Oncol. 2009;27(25):4124–4129. [DOI] [PubMed] [Google Scholar]
- 12.Woo JK, Chiu RY, Thakur Y, Mayo JR. Risk-benefit analysis of pulmonary CT angiography in patients with suspected pulmonary embolus. AJR Am J Roentgenol. 2012;198(6):1332–1339. [DOI] [PubMed] [Google Scholar]
- 13.Evans CE, Palazon A, Sim J, et al. Modelling pulmonary microthrombosis coupled to metastasis: distinct effects of thrombogenesis on tumorigenesis. Biol Open. 2017;6(5):688–697. [DOI] [PMC free article] [PubMed] [Google Scholar]
- 14.Hu W, Wang X, Yang R. Evaluation of D-dimer and lactate dehydrogenase plasma levels in patients with relapsed acute leukemia. Oncol Lett. 2016;12(1):591–596. [DOI] [PMC free article] [PubMed] [Google Scholar]
- 15.Dixit A, Chatterjee T, Mishra P, et al. Disseminated intravascular coagulation in acute leukemia at presentation and during induction therapy. Clin Appl Thromb Hemost. 2007;13(3):292–298. [DOI] [PubMed] [Google Scholar]
Associated Data
This section collects any data citations, data availability statements, or supplementary materials included in this article.


