

Abstract
Hepatocytes are the major source of hepatic lipocalin‐2 (LCN2), which is up‐regulated in response to inflammation, injury, or metabolic stress. So far, the role of hepatocyte‐derived LCN2 in the development of nonalcoholic fatty liver disease (NAFLD) remains unknown. Herein we show that overexpression of human LCN2 in hepatocytes protects against high fat/high cholesterol/high fructose (HFCF) diet–induced liver steatosis and nonalcoholic steatohepatitis by promoting lipolysis and fatty acid oxidation (FAO) and inhibiting de novo lipogenesis (DNL), lipid peroxidation, and apoptosis. LCN2 fails to reduce triglyceride accumulation in hepatocytes lacking sterol regulatory element‐binding protein 1. In contrast, Lcn2−/− mice have defective lipolysis, increased lipid peroxidation and apoptosis, and exacerbated NAFLD after being fed an HFCF diet. In primary hepatocytes, Lcn2 deficiency stimulates de novo lipogenesis but inhibits FAO. Conclusion: The current study indicates that hepatocyte LCN2 protects against diet‐induced NAFLD by regulating lipolysis, FAO, DNL, lipid peroxidation, and apoptosis. Targeting hepatocyte LCN2 may be useful for treatment of NAFLD.
Abbreviations
- AAV
adeno‐associated virus
- ACC
acetyl‐CoA carboxylase
- ALT
alanine aminotransferase
- AST
aspartate aminotransferase
- β‐HB
beta‐hydroxybutyrate
- CASP3
caspase 3
- CES
carboxylesterase
- COL1A
collagen type 1 alpha
- CPT
carnitine palmitoyltransferase
- CXCL10
chemokine (C‐X‐C motif) ligand 10
- DNL
de novo lipogenesis
- FAO
fatty acid oxidation
- FFA
free fatty acid
- GC‐MS
gas chromatography–mass spectrometry
- H&E
hematoxylin and eosin
- HFC
high fat/high cholesterol
- HFCF
high fat/high cholesterol/high fructose
- IL
interleukin
- LCN2
lipocalin‐2
- LXR
liver X receptor
- MCD
methionine‐ and choline‐deficient
- MCP1
monocyte chemoattractant protein 1
- MDA
malondialdehyde
- MPO
myeloperoxidase
- mRNA
messenger RNA
- NAFLD
nonalcoholic fatty liver disease
- NASH
nonalcoholic steatohepatitis
- ORO
Oil Red O
- PA
palmitate
- PPARα
peroxisome proliferator–activated receptor α
- ROS
reactive oxygen species
- RXR
retinoid X receptor
- SMA
smooth muscle actin
- SREBP‐1
sterol regulatory element‐binding protein 1
- TG
triglyceride
- TGF
transforming growth factor
- TGH
triglyceride hydrolase
- TIMP
tissue inhibitor of metalloproteinase
- TNF
tumor necrosis factor
Nonalcoholic fatty liver disease (NAFLD) is one of the most common chronic liver diseases worldwide, which includes simple steatosis and nonalcoholic steatohepatitis (NASH). NASH may further progress to liver cirrhosis and liver carcinoma. So far, no US Food and Drug Administration–approved drugs are available for treatment of NAFLD, in part because the mechanisms underlying the pathogenesis of NAFLD have not been elucidated. NAFLD is often associated with obesity, diabetes and insulin resistance, which are accompanied by increased de novo lipogenesis (DNL) and inflammation. In addition, accumulating data have indicated that defective lipolysis plays a central role in the pathogenesis of NAFLD.1, 2, 3
Lipocalin‐2 (LCN2), also known as neutrophil gelatinase–associated lipocalin, is a 25‐kDa secretory glycoprotein that was initially purified from neutrophil granules. In addition to neutrophils, LCN2 can also be secreted by a number of other cell types, such as hepatocytes, adipocytes, and endothelia.4 Hepatocytes are responsible for 25% of low basal serum LCN2 levels and contribute to more than 90% of serum LCN proteins after bacterial infection due to activation of the IL‐6‐STAT3 signaling pathway.5 LCN2 plays a role in iron homeostasis by forming a ternary complex with iron‐containing siderophores, and therefore plays a critical role in host defense against bacterial infection.4, 6 Mice lacking Lcn2 in hepatocytes are susceptible to infection from K. pneumoniae or E. coli.2
The promoter of LCN2 has a consensus site for nuclear factor κB (NF‐κB); therefore, it can be induced by various cytokines (e.g., tumor necrosis factor α [TNFα], interleukin [IL]‐1β, IL‐6).4 In addition, fasting, cold exposure, insulin, and nutrients (palmitate, oleate) have been shown to up‐regulate LCN2 expression.7 Consistent with these findings, LCN2 levels in serum, liver, and adipose tissue are elevated in db/db or high‐fat diet–fed mice, obese individuals, or NASH patients.4, 8
Two major membrane‐bound receptors for LCN2, 24p3R (SLC22A17) and megalin (also known as LRP2), have been identified.9 The binding of LCN2 to its receptor may promote iron uptake and regulate diverse signaling pathways.4 Global loss of Lcn2 is shown to aggravate methionine‐ and choline‐deficient (MCD) diet–induced steatosis and liver injury.10 In contrast, Ye et al. show that global loss of Lcn2 in Apoe−/− mice attenuates high fat/high cholesterol (HFC) or MCD diet–induced liver injury and inflammation.8 The inconsistent observations may result in part from different backgrounds used, as the latter study used mice lacking Apoe. So far, the role of hepatocyte‐derived LCN2 in the development of NAFLD has not been investigated.
In this report, we show that adeno‐associated virus 8 (AAV8)–mediated overexpression of human LCN2 in hepatocytes protects against high fat/high cholesterol/high fructose (HFCF)–induced hepatosteatosis, inflammation, and fibrosis. In contrast, Lcn2−/− mice have deteriorated NAFLD after being fed an HFCF or HFC diet. Mechanistically, we show that LCN2 promotes triglyceride hydrolysis (TGH; lipolysis) and fatty acid oxidation (FAO), and inhibits DNL, lipid peroxidation, and apoptosis. We also show that LCN2 reduces triglyceride (TG) levels in hepatocyte by reducing nuclear levels of sterol regulatory element‐binding protein 1 (nSREBP‐1). Thus, hepatocyte‐derived LCN2 plays a key role in protection against diet‐induced NAFLD by regulating lipid metabolism, lipid peroxidation, and apoptosis.
Materials and Methods
Human Liver Tissues, Mice, and Diets
C57BL/6 mice and Srebp1−/− mice were purchased from the Jackson Laboratories (Bar Harbor, ME). Lcn2−/− mice, which have been backcrossed with C57BL/6 mice for more than 10 generations, have been described previously.11 The HFCF diet contains 40% fat (including 12% saturated fat)/0.2% cholesterol (AIN‐76A; TestDiet, St. Louis, MO), and 4.2% fructose (in drinking water). The HFC diet, containing 42% fat and 0.2% cholesterol, was purchased from Envigo (TD.88137; Huntingdon, United Kingdom). Mice were fed an HFCF or HFC diet for 16‐20 weeks. Unless otherwise stated, male mice were used and were fasted for 5‐6 hours before euthanization. Human liver samples were obtained from the Liver Tissue Cell Distribution System at the University of Minnesota.12 All animal experiments were approved by the Institutional Animal Care and Use Committee at Northeast Ohio Medical University (NEOMED). The use of human tissue samples was approved by the institutional review board at NEOMED.
Adeno‐associated Viruses and Adenoviruses
The human LCN2 coding sequence was cloned into an adeno‐associated virus (AAV) vector under the control of a mouse albumin promoter (AAV‐ALB‐hLCN2). AAV8‐ALB‐hLCN2 or AAV8‐ALB‐null (control) was produced by packaging into serotype 8 and titrated by Vector Biolabs (Malvern, PA). Each mouse was injected intravenously with 3 × 10¹¹ gas chromatography AAV and then fed an HFCF diet for 20 weeks. Adenoviruses expressing human LCN2 were purchased from ViGene Biosciences (VH879687; Rockville, MD).
Western Blot Assays
Western blot assays were performed using whole liver lysates13 or nuclear extracts of the liver samples,14, 15 as described previously. LCN2 antibodies were purchased from R&D Systems (AF1757 and AF1857; Minneapolis, MN). SREBP‐1 antibody was purchased from Santa Cruz Biotechnology (SC‐8984; Dallas, TX). Acetyl‐CoA carboxylase (ACC) antibody (3662S) and caspase 3 (CASP3) antibodies (cleaved and total (9661 or 9662) were purchased from Cell Signaling Technology (Danvers, MA). Carboxylesterase 1 (CES1; ab45957), carboxylesterase 2 (CES2; ab56528), and Tubulin (ab4074) antibodies were purchased from Abcam (Cambridge, United Kingdom).
Analysis of Plasma or Hepatic Levels of Lipids, Hydroxyproline, Malondialdehyde, Reactive Oxygen Species, Aspartate Aminotransferase, Alanine Aminotransferase, β‐Hydroxybutyrate, and Apoptosis
Approximately 100 mg of liver tissue was homogenized in methanol, and lipids were extracted in chloroform/methanol (2:1 vol/vol) as described.16 Triglycerides (TGs) and cholesterol in the liver and plasma alanine aminotransferase (ALT) or aspartate aminotransferase (AST) levels were measured using Infinity reagents from Thermo Scientific (Waltham, MA). Hepatic hydroxyproline level was quantified using a kit from Cell Biolabs (STA675; San Diego, CA). Hepatic malondialdehyde (MDA) levels were measured using a TBARS assay kit (STA‐330), and reactive oxygen species (ROS) was measured using an OxiSelect in vitro ROS/RNS Assay kit (STA‐347) from Cell Biolabs as described.17 Plasma β‐hydroxybutyrate (β‐HB) level was determined using a kit from Pointe Scientific (Canton, MI). Apoptosis was determined using a kit from Abcam (Cat # ab206386).
Hepatic DNL
Mice were fasted for 4 hours and then injected intraperitoneally with 2H2O (30 µl/g). After 4 hours, liver and plasma were snap‐frozen in liquid nitrogen. The newly synthesized fatty acids or TGs were measured by gas chromatography–mass spectrometry (GC‐MS) (Agilent 5977B Inert Plus MSC Turbo EI/CI Bundle) as described.18
TGH Activity Assays
Hepatic microsome proteins were isolated and TGH activity was measured using 3H‐triolein as substrate as described.19
Cell Culture, Transient Transfection, and Luciferase Assays
Mouse primary hepatocytes were isolated and cultured as described.12 Four hours after plating, primary mouse hepatocytes were infected with adenoviruses for 48 hours before harvest. HepG2 cells were cultured in Dulbecco’s modified Eagle’s medium (DMEM) containing 10% fetal bovine serum (FBS). Transient transfections were performed as described.20 Briefly, pGL3‐SREBP1 luciferase reporter constructs were transfected into HepG2 cells together with plasmids expressing liver X receptor α (LXRα) and retinoid X receptor (RXR), followed by treatment with either vehicle or T0901317 (10 μM). After 48 hours, luciferase activity was determined and normalized to β‐galactosidase activity. To determine the effect of overexpression of LCN2 on peroxisome proliferator–activated receptor α (PPARα) activity, an LCN2 overexpression plasmid was co‐transfected with the pTK‐3xPPRE‐luc plasmid, and luciferase activity was determined as described previously.
Fatty Acid Oxidation
Primary hepatocytes were cultured in DMEM containing 10% FBS in 12‐well dishes. Some wild‐type primary hepatocytes were infected with either Ad‐empty or Ad‐LCN2, or treated with phosphate‐buffered saline or recombinant LCN2 protein (500 ng/mL; R&D Systems). FAO was performed using [3H]palmitate as substrate as described.15, 21
Oil Red O, Hematoxylin and Eosin, or Sirius Red Staining
Livers were fixed in 10% formalin and then embedded in optimal cutting temperature or paraffin. Oil Red O (ORO), hematoxylin and eosin (H&E), or sirius red staining was performed as described.15
Myeloperoxidase or F4/80 Immunohistochemical Staining
Immunohistochemical staining of myeloperoxidase (MPO) (PP023AA; Biocare Medical, LLC, Concord, CA) or F4/80 (Abcam, ab6640) was performed using Vectastain Elite ABC Staining Kit and DAB Peroxidase Substrate Kit (Vector Laboratories, Inc., Burlingame, CA) according to the manufacturer’s instructions. The F4/80+ area (%) was quantified using ImagePro (Media Cybernetics, Rockville, MD).
Fatty Acid Analysis
Hepatic total free fatty acids (FFAs) were measured using a kit from Wako Chemicals USA (Richmond, VA). Hepatic fatty acid composition was analyzed by GC‐MS as described.19
Body Fat Content Measurement
Body fat content was determined using Echo‐MRI (Echo‐MRI, LLC, Houston, TX) as described.22
Statistical Analysis
Statistical significance was analyzed using unpaired Student t test or analysis of variance (GraphPad Prism, CA). All values are expressed as mean ± SEM. Differences were considered statistically significant at P < 0.05.
Results
Overexpression of Human LCN2 in Hepatocytes Protects Against HFCF Diet–Induced NAFLD
Previous studies have shown that LCN2 expression and secretion are increased in response to infection, injury, or metabolic stress.7 When mice were fed an HFC diet or HFCF diet, hepatic Lcn2 messenger (mRNA) levels were induced by more than 27 fold (Supporting Fig. S1A), and LCN2 protein levels were increased by more than 5 fold (Supporting Fig. S1B,C). In patients with simple steatosis (NAFL) or NASH, hepatic LCN2 mRNA levels were increased by more than 2 fold (Supporting Fig. S1D), and LCN2 protein levels were increased by more than 1.7 fold (Supporting Fig. S1E,F).
Hepatocytes are an important source of plasma LCN2 levels. We therefore generated an AAV8‐expressing human LCN2 under the control of the albumin promoter (AAV8‐ALB‐hLCN2) and the control AAV8 (AA8‐ALB‐null). These AAVs were injected into C57BL/6 mice, which were then fed an HFCF diet for 20 weeks. Overexpression of human LCN2 in hepatocytes had no effect on body fat content (Supporting Fig. S2A), but reduced plasma ALT and AST levels (Fig. 1A) as well as hepatic levels of TGs (Fig. 1B), FFAs (Fig. 1C), and MDA (Fig. 1D). MDA is an important end product of lipid peroxidation by ROS. Analysis of hepatic fatty acid composition by GC‐MS shows that LCN2 reduced C16:0 and C18:1 fatty acids by about 50% (Table 1).
Figure 1.
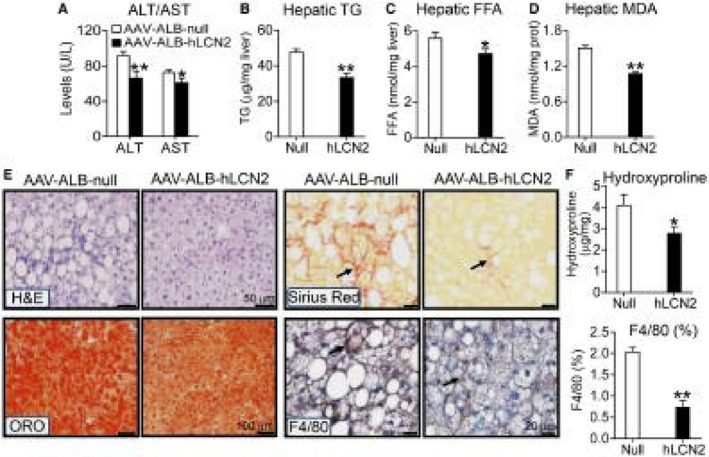
AAV‐mediated overexpression of human LCN2 in hepatocytes protects against HFCF diet–induced steatohepatitis. C57BL/6 mice were intravenously injected with AAV8‐ALB‐null or AAV8‐ALB‐hLCN2 (n = 8). The mice were then fed an HFCF diet for 20 weeks. (A) Plasma ALT and AST levels. (B) Hepatic TG levels. (C) Hepatic FFA levels. (D) Hepatic MDA levels. (E) Liver sections were used for H&E staining (left top panel), ORO (left bottom panel), sirius red staining (right top panel) or immunostaining with an antibody against F4/80 (right bottom panel) (arrows point to fibrosis [sirius red staining] or macrophages [F4/80 staining]). (F) Hepatic hydroxyproline levels (top panel) or F4/80 staining–positive area (%) (bottom panel) were quantified. In (E). *P < 0.05, **P < 0.01.
Table 1.
Hepatic Fatty Acid Composition (µg/mg)
| AAV‐ALB‐Null | AAV‐ALB‐LCN2 | Lcn2 +/+ | Lcn2 −/− | |
|---|---|---|---|---|
| C14:0 | 0.09 ± 0.01 | 0.06 ± 0.01 | 0.09 ± 0.01 | 0.13 ± 0.02 |
| C16:0 | 30.45 ± 7.19 | 14.51 ± 1.83* | 51.91 ± 5.36 | 70.43 ± 5.76* |
| C16:1 | 0.79 ± 0.06 | 0.71 ± 0.18 | 0.89 ± 0.13 | 1.23 ± 0.20 |
| C18:0 | 1.38 ± 0.32 | 1.12 ± 0.24 | 3.17 ± 0.24 | 4.81 ± 0.48* |
| C18:1 | 62.82 ± 14.29 | 31.50 ± 2.49* | 146.76 ± 13.95 | 194.96 ± 16.33* |
| C18:2 | 4.48 ± 0.72 | 4.15 ± 0.89 | 13.15 ± 0.97 | 15.39 ± 1.18 |
| C20:4 | 0.01 ± 0.00 | 0.01 ± 0.00 | 0.01 ± 0.00 | 0.02 ± 0.00 |
| C20:6 | 0.08 ± 0.01 | 0.06 ± 0.01 | 0.15 ± 0.02 | 0.36 ± 0.09 |
C57BL/6 mice were infected with AAV‐ALB‐null or AAV‐ALB‐hLCN2 and fed an HFCF diet for 20 weeks (n = 8). Lcn2+/+ mice or Lcn2−/− mice were fed an HFCF diet for 16 weeks (n = 8) (AAV‐ALB‐null versus AAV‐ALB‐LCN2 [n = 8], or Lcn2+/+ versus Lcn2−/− [n = 8]). Hepatic fatty acid composition was analyzed by GC‐MS.
P < 0.05.
In addition, H&E or ORO staining shows that overexpression of human LCN2 improved liver histology and reduced hepatic neutral lipid accumulation (Fig. 1E, left panels). LCN2 overexpression also reduced liver fibrosis or macrophage infiltration (Fig. 1E, right panels). Consistent with the latter data, LCN2 overexpression significantly reduced hepatic levels of hydroxyproline (Fig. 1F, top panel) and F4/80 protein (Fig. 1F, bottom panel). Taken together, the data of Fig. 1 demonstrate that overexpression of human LCN2 in hepatocytes protects against diet‐induced NAFLD.
Overexpression of Human LCN2 in Hepatocytes Regulates Genes Involved in Lipid Metabolism and Inflammation
To understand the mechanisms by which human LCN2 improves steatohepatitis, we analyzed hepatic gene expression. Overexpression of human LCN2 in hepatocytes significantly reduced hepatic mRNA levels of genes implicated in lipogenesis (Srebp‐1c, Scd1, Fasn, Acc, Lxrα, Lxrβ) (Fig. 2A, left panel), but induced genes involved in lipolysis (Ces1, Ces2)15, 19 or FAO (Pparα, Carnitine palmitoyltransferase 1 [Cpt1], Carnitine palmitoyltransferase 2 [Cpt2], Pdk4) (Fig. 2A, right panel). We have previously shown that CES1 and CES2 have TGH activity, which can hydrolyze TG to release FFAs.15, 19 In addition, human LCN2 inhibited a number of genes involved in inflammation (Tnfα, Il‐6, Il‐1β, Mcp1 [monocyte chemoattractant protein 1], Cxcl10 [chemokine (C‐X‐C motif) ligand 10], F4/80, Cd68) (Fig. 2B, left panel) or fibrogenesis (Tgfβ [transforming growth factor β], α‐Sma [α smooth muscle actin], Timp1 [tissue inhibitor of metalloproteinase], Col1a1 [collagen type 1 alpha 1], Col1a2 [collagen type 1 alpha 2]) (Fig. 2B, right panel).
Figure 2.
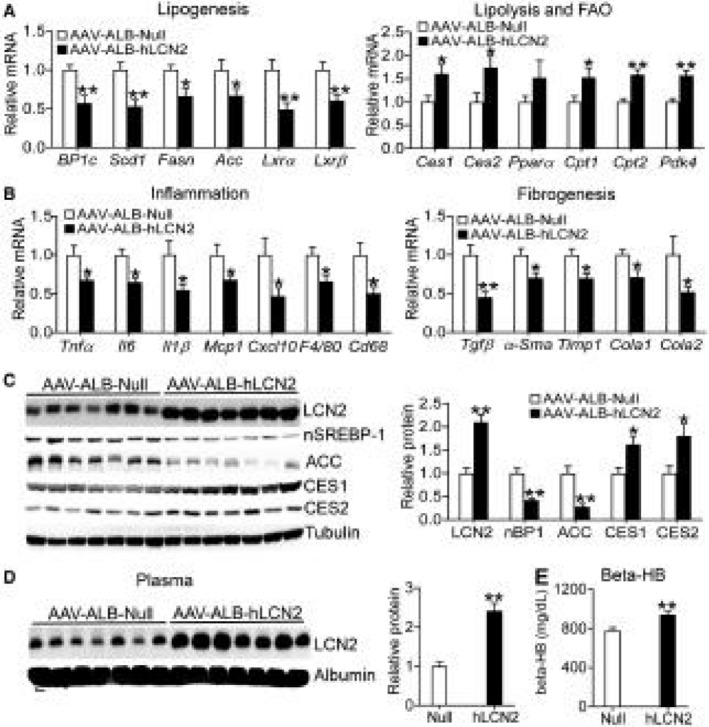
Overexpression of human LCN2 in hepatocytes regulates the hepatic genes implicated in lipogenesis, lipolysis, FAO, inflammation, and fibrogenesis. Mice have been described in the legend of Fig. 1 (n = 8). Real‐time quantitative polymerase chain reaction (PCR) was used to quantify hepatic genes involved in lipogenesis, lipolysis, FAO (A), inflammation, or fibrogenesis (B). (C) Hepatic proteins were detected by western blotting (left panel) and then quantified (right panel). (D) Plasma proteins were analyzed by western blotting (left panel) and then quantified (right panel). (E) Plasma β‐HB levels. *P < 0.05, **P < 0.01. Abbreviations: BP1c, Srebp‐1c.
The data of Fig. 2C (left and right panels) show that AAV‐mediated overexpression of human LCN2 led to an approximate 2‐fold increase in hepatic LCN2 protein levels. The extent of increase in hepatic LCN2 protein levels was similar to that found in NAFL or NASH patients (Supporting Fig. S1E,F). Human LCN2 also significantly reduced hepatic protein levels of nuclear/mature SREBP‐1 (nSREBP‐1) and ACC, but increased hepatic CES1 and CES2 protein levels (Fig. 2C, left and right panels). In the plasma, overexpression of human LCN2 increased LCN2 protein levels by approximately 2 fold (Fig. 2D, left and right panels) and raised plasma β‐HB levels (Fig. 2E). Plasma β‐HB is an indicator of hepatic FAO. The relative low induction of LCN2 expression by AAVs in the liver or plasma may be explained by the fact that LCN2 protein is already highly abundant in the liver or plasma. These data suggest that hepatocyte‐derived LCN2 may play an important role in lipid metabolism and inflammation.
Human LCN2 Promotes Lipolysis and FAO but Inhibits DNL
So far, little is known about how LCN2 regulates lipid metabolism. The finding that LCN2 regulates hepatic CES1 and CES2 expression (Fig. 2) led us to investigate whether LCN2 regulates lipolysis. Indeed, overexpression of human LCN2 in hepatocytes significantly increased hydrolysis of 3H‐triolein (Fig. 3A), indicating that LCN2 promotes lipolysis. Freshly released FFAs from TGH may serve as ligands for PPARα to activate FAO15, 19 and/or antagonize LXR activity to suppress lipogenesis.23, 24 Overexpression of human LCN2 significantly increased PPARα activity in transient transfection assays (Fig. 3B) and FAO in primary hepatocytes (Fig. 3C), but inhibited the Srebp‐1c promoter activity in the presence or absence of the LXR agonist T‐0901317 (Fig. 3D).
Figure 3.
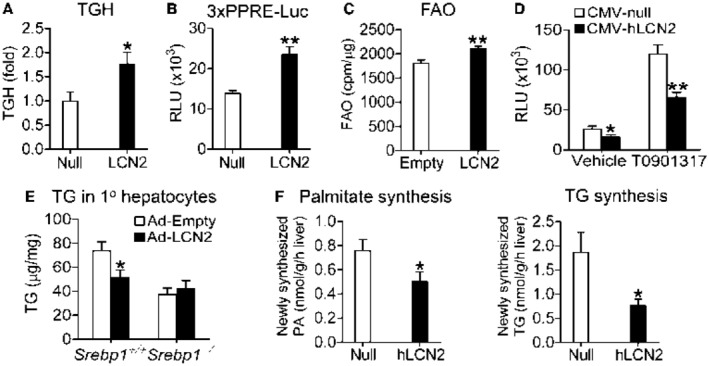
Human LCN2 induces lipolysis and FAO and inhibits DNL in an LXR‐SREBP‐1‐dependent manner. (A) C57BL/6 mice were infected with AAV8‐ALB‐null or AAV8‐ALB‐hLCN2 and then fed an HFCF diet for 20 weeks (n = 8). TGH activity was determined using [3H]Triolein as substrate. (B) HepG2 cells were co‐transfected with pTK‐3 × PPRE‐luc, pCMV‐β‐gal, pCMV‐hLCN2, or pCMV‐empty. Relative luciferase activity units (RLUs) were determined after 36 hours (n = 7). (C) Primary hepatocytes were infected with Ad‐Empty or Ad‐hLCN2 for 36 hours. FAO was determined using [3H]palmitic acid as substrate (n = 6). (D) HepG2 cells were co‐transfected with pGL3‐SREBP‐1‐luc, CMV‐β‐gal, CMV‐hLCN2, or CMV‐empty in the presence or absence of the LXRα ligand T0901317 (10 µM). After 36 hours, RLUs were determined (n = 6). (E) Primary hepatocytes were isolated from Srebp1+/+ or Srebp1−/− mice, and then infected with Ad‐Empty or Ad‐hLCN2 for 48 hours. TG levels were quantified. (F) C57BL/6 mice were intravenously injected with AAV8‐ALB‐null (Null) or AAV8‐ALB‐hLCN2 (hLCN2) and then fed an HFCF diet for 20 weeks (n = 8). Four hours before euthanization, mice were intraperitoneally injected with 2H2O. Newly synthesized palmitate (PA) (left panel) or TG (right panel) levels were quantified by GC‐MS. *P < 0.05, **P < 0.01.
To investigate the role of SREBP‐1 in LCN2‐regulated TG metabolism, we isolated primary hepatocytes from Srebp1+/+ or Srebp1−/− mice. Overexpression of human LCN2 significantly reduced TG accumulation, but such a reduction was abolished when Srebp1 was deleted (Fig. 3E). Finally, we investigated whether LCN2 affected DNL by intraperitoneally injecting mice with heavy water (2H2O), followed by GC‐MS analysis. Consistent with the data shown previously, overexpression of human LCN2 reduced newly synthesized levels of PA and TG by 35% and 59%, respectively (Fig. 3F, left and right panels). Thus, the data of Fig. 3 suggest that human LCN2 reduces hepatic fatty acid and TG levels by inducing lipolysis and FAO and inhibiting DNL.
Loss of LCN2 Exacerbates Diet‐Induced NAFLD
To investigate whether loss of LCN2 affected the development of NAFLD, we fed Lcn2+/+ mice and Lcn2−/− mice an HFCF diet for 16 weeks. These mice have been backcrossed to the C57BL/6 background for at least 10 generations.11 Lcn2−/− mice had higher body fat content (Supporting Fig. S2B) and plasma levels of ALT and AST (Fig. 4A). Although there was no change in body weight, Lcn2−/− mice had an increase in liver weight (Fig. 4B). In addition, Lcn2−/− mice had higher hepatic levels of total cholesterol and TG (Fig. 4C) as well as MDA (Fig. 4D).
Figure 4.
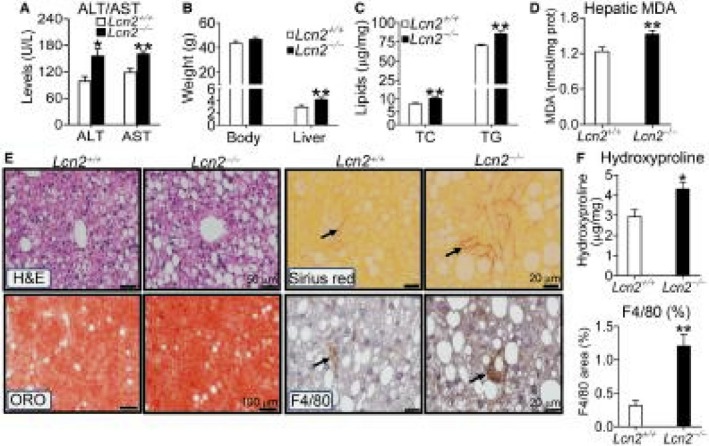
Loss of LCN2 exacerbates diet‐induced NAFLD. Lcn2+/+ or Lcn2−/− mice were fed an HFCF diet for 16 weeks (n = 6‐9). (A) Plasma ALT or AST levels. (B) Body or liver weight. (C) Hepatic total cholesterol or TG levels. (D) Hepatic MDA levels. (E) Representative images of H&E, ORO, or sirius red staining or immunostaining using an antibody against F4/80. (F) Hepatic hydroxyproline levels (top panel) or F4/80 staining–positive area (%) (bottom panel). Arrows point to fibrosis (sirius red staining) or macrophages (immunostaining with F4/80 antibody). *P < 0.05, **P < 0.01. Abbreviations: TC, total cholesterol.
Data from histological staining show that loss of Lcn2 increased hepatic neutral lipid accumulation, fibrosis, and macrophage infiltration (Fig. 4E). Consistent with these data, Lcn2−/− mice had increased hepatic levels of hydroxyproline (Fig. 4F, top panel) and F4/80 protein (Fig. 4F, bottom panel).
In addition, we fed Lcn2+/+ mice and Lcn2−/− mice an HFC diet for 16 weeks, and similar results were collected (Supporting Fig. S3A‐F). Taken together, our data demonstrate that loss of LCN2 exacerbates diet‐induced NAFLD.
Loss of LCN2 Up‐regulates Genes Implicated in Lipogenesis and Inflammation
In Lcn2−/− mice, hepatic genes involved in lipogenesis (Srebp‐1c, Scd1, Fasn, Acc) (Fig. 5A) were induced, whereas those implicated in lipolysis (Ces1, Ces2) or FAO (Pdk4) were repressed (Fig. 5B). Lcn2−/− mice also had higher levels of hepatic genes implicated in inflammation (Tnfα, Il‐6, Il‐1β, Mcp1, Cxcl10, F4/80, Cd68) (Fig. 5C) or fibrogenesis (Tgfβ, α‐Sma, Timp1, Col1a1, Col1a2) (Fig. 5D). Consistent with the changes in mRNA levels, hepatic protein levels of nuclear SREBP‐1 and ACC were significantly increased (Fig. 5E, left and right panels), whereas plasma β‐HB levels were significantly reduced (Fig. 5F, left panel). Consistent with these data, hepatic FFA levels were significantly increased (Fig. 5F, right panel). These loss‐of‐function data support those collected from mice overexpressing human LCN2 in hepatocytes (Fig. 2).
Figure 5.
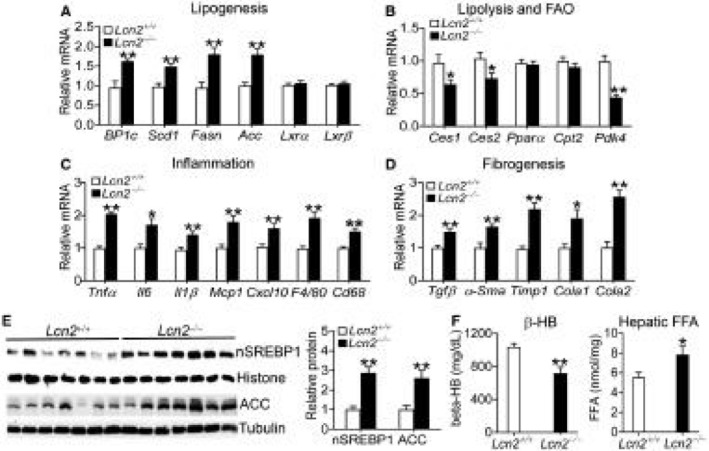
Loss of LCN2 induces genes involved in lipogenesis, inflammation, and fibrogenesis. Lcn2+/+ or Lcn2−/− mice were fed an HFCF diet for 16 weeks (n = 6‐9). (A‐D) Hepatic mRNA levels involved in lipogenesis (A), lipolysis or FAO (B), inflammation (C), or fibrogenesis (D) were quantified by real‐time quantitative polymerase PCR. (E) Hepatic proteins were analyzed by western blotting (left panel) and quantified (right panel). (F) Plasma β‐HB levels (left panel) and hepatic FFA levels (right panel). *P < 0.05, **P < 0.01.
Loss of LCN2 Inhibits Lipolysis and FAO but Induces Lipogenesis in Hepatocytes
The data of Fig. 5 suggest that loss of LCN2 might regulate lipolysis, FAO, and lipogenesis. Consistent with this hypothesis, loss of Lcn2 reduced hepatic TGH activity by 45% (Fig. 6A). In primary hepatocytes, loss of Lcn2 significantly inhibited FAO (Fig. 6B), but induced mRNA levels of lipogenic genes (Srebp‐1c, Fasn, Acc, Lxrα) (Fig. 6C). In line with these data, loss of Lcn2 led to increased hepatic levels of C16:0 and C18:1 fatty acids (Table 1). Because hepatocytes are the principal cells that can hydrolyze TG in the liver, the data of Fig. 6A‐C suggest that loss of LCN2 in hepatocytes can cause inhibition of lipolysis and FAO and induction of lipogenesis.
Figure 6.
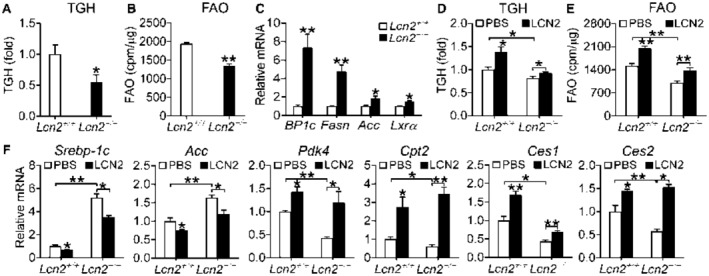
Loss of LCN2 or treatment with recombinant LCN2 protein regulates lipolysis, FAO, and lipogenesis in hepatocytes. (A) Lcn2+/+ or Lcn2−/− mice were fed an HFCF diet for 16 weeks. Hepatic TGH activity was determined (n = 7‐8). (B) FAO was determined using [3H]palmitic acid as substrate in primary hepatocytes isolated from Lcn2+/+ mice or Lcn2−/− mice (n = 6). (C) mRNA levels were quantified in primary hepatocytes isolated from Lcn2+/+ mice or Lcn2−/− mice (n = 4). (D‐F) Primary hepatocytes were isolated from Lcn2+/+ or Lcn2−/− mice and then treated with phosphate‐buffered saline (control) or 500 ng/mL LCN2 for 30 hours (n = 4‐5 per group). TGH (D) and FAO (E) were determined. The mRNA levels of genes involved in lipogenesis, FAO, or lipolysis were determined. *P < 0.05, **P < 0.01. Abbreviations: PBS, phosphate‐buffered saline.
Recombinant LCN2 Protein Induces Lipolysis and FAO but Inhibits Lipogenic Genes in Primary Hepatocytes
To further determine whether LCN2 functions by directly targeting hepatocytes, we treated primary hepatocytes with recombinant LCN2 protein. LCN2 treatment significantly induced TGH activity/lipolysis (Fig. 6D) and FAO (Fig. 6E) in Lcn2+/+ hepatocytes, and restored TGH activity and FAO in Lcn2−/− hepatocytes (Fig. 6D,E). In addition, LCN2 also repressed lipogenic genes (Srebp1c, Acc), but induced genes involved in lipolysis (Ces1, Ces2) or FAO (Pdk4, Cpt2) in Lcn2+/+ hepatocytes (Fig. 6F). Importantly, LCN2 completely or partially restored the expression of these genes in Lcn2−/− hepatocytes (Fig. 6F). These data indicate that LCN2 can directly target hepatocytes to regulate lipolysis, FAO, and lipogenesis.
LCN2 Regulates Apoptosis
Hepatocyte damage may be caused by lipid peroxidation and apoptosis. We have shown that LCN2 regulates hepatic levels of MDA (Figs. 1D and 4D), an end product of lipid peroxidation. Consistent with these data, over‐expression of LCN2 reduced whereas loss of LCN2 increased ROS production (Fig. 7A). Therefore, we determined whether LCN2 also regulated apoptosis. As shown in Fig. 7B,C, overexpression of human LCN2 in hepatocytes reduced hepatic levels of cleaved/activated CASP3 by 65%, whereas loss of Lcn2 increased hepatic levels of cleaved/activated CASP3 by more than 2 fold. Consistent with these data, TUNEL assays showed that overexpression of human LCN2 inhibited apoptosis, whereas loss of Lcn2 induced apoptosis in the liver (Fig. 7D,E). The changes in the levels of MDA, ROS and apoptosis may account, at least in part, for LCN2‐mediated pathogenesis of steatohepatitis.
Figure 7.
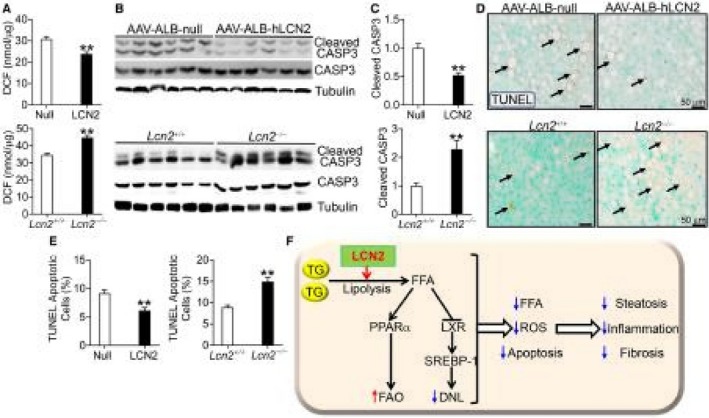
LCN2 inhibits apoptosis. (A‐E) C57BL/6 mice were injected intravenously with AAV8‐ALB‐null or AAV8‐ALB‐hLCN2 (n = 8), and then fed an HFCF diet for 20 weeks. Lcn2+/+ or Lcn2−/− mice were fed an HFCF diet for 16 weeks (n = 6‐9). Hepatic DCF (ROS) levels were quantified (A). Hepatic protein levels were determined by western blotting (B) and then quantified (C) (top and bottom panels). Apoptosis was analyzed by TUNEL assays (D) and then quantified (E) (top and bottom panels). (F) A model for hepatocyte LCN2 to regulate the development of NAFLD. LCN2 stimulates lipolysis to release FFAs from TGH. Freshly released FFAs act as ligands for PPARα to stimulate FAO, and antagonize LXR activity to inhibit DNL. As a result, hepatic levels of FFAs, ROS, and apoptosis are reduced, leading to decreased steatosis, inflammation, and fibrosis in the liver. *P < 0.05, **P < 0.01. Abbreviations: DCF, 2′,7′‐dichlorofluorescein.
Neutrophils are reported to play a role in LCN2‐mediated steatohepatitis in Apoe−/− mice.8 When fed an HFCF diet, overexpression of human LCN2 in hepatocytes increased hepatic mRNA levels of MPO (Supporting Fig. S4A), whereas Lcn2−/− mice had a reduction in hepatic MPO mRNA levels (Supporting Fig. S4B). However, the mRNA levels of MPO were very low (Ct = 35) (Supporting Fig. S4A,B). Consistent with the very low mRNA levels, there was little neutrophil infiltration in the liver (Supporting Fig. S4C,D). Thus, neutrophils are unlikely to play an important role in LCN2‐mediated pathogenesis of NAFLD.
Discussion
We and others have shown that hepatic LCN2 levels are increased in mice or humans with obesity or NAFLD. Therefore, it is intriguing to investigate whether hepatic LCN2 regulates the development of NAFLD. So far, the role of hepatocyte‐derived LCN2 in the development of NAFLD is completely unknown. By using the AAV‐mediated gain‐of‐function approach, we provide evidence demonstrating that low‐to‐moderate expression of human LCN2 in hepatocytes protects against diet‐induced NAFLD. Mechanistically, we demonstrate that LCN2 promotes lipolysis and FAO and inhibits DNL, lipid peroxidation and apoptosis, thus preventing steatohepatitis (Fig. 7F). Importantly, our gain‐of‐function data are strongly supported by loss‐of‐function studies that use mice or primary hepatocytes lacking Lcn2.
Asimakopoulou et al. reported that global ablation of Lcn2 in mice led to increases in hepatic lipids and plasma ALT and AST levels after being fed an MCD diet for 4 weeks.10 The authors also found that hepatic Perilipin 5 (Plin5) was reduced in Lcn2−/− mice. Because Plin5−/− mice have lower hepatic TG levels,25 the reduction in Plin5 cannot account for the increased hepatic TG accumulation in Lcn2−/− mice. Interestingly, Ye et al. showed that ablation of Lcn2 in Apoe−/− mice reduced liver damage after being fed an HFC or MCD diet, as a result of decreased expression of C‐X‐C motif receptor 2 (CXCR2) and neutrophil infiltration.8 The latter study was performed in mice lacking Apoe, which are known to develop severe steatohepatitis after being fed a western diet. However, we have observed little neutrophil infiltration in wild‐type mice, Lcn2−/− mice, or mice overexpressing human LCN2 after they are challenged with an HFCF diet for 16‐20 weeks. Thus, the conclusion drawn by Ye et al. should be further validated by independent groups.
Although Lcn2−/− mice are reported to accumulate more lipids in the liver,10 neither the mechanism by which LCN2 regulates lipid metabolism nor the role of hepatocyte‐derived LCN2 in the development of NAFLD has been addressed before. We have provided evidence demonstrating that LCN2 is a key regulator of lipolysis, which releases FFAs from TGH. The newly released FFAs can activate PPARα and FAO but inhibit the LXR‐SREBP‐1c‐DNL pathway. As a result, hepatic TG and fatty acid levels are decreased. In hepatocytes, fatty acid–induced lipotoxicity plays an important role in the pathogenesis of NAFLD, as FFAs (such as C16:0) induce apoptosis, endoplasmic reticulum stress, ROS, and inflammation.26, 27 In contrast, inhibition of lipolysis by abrogation of adipose triglyceride lipase (ATGL) aggravates MCD diet–induced steatohepatitis.28 In addition, loss of hepatic comparative gene identification‐58 (CGI‐58), a co‐activator for ATGL, also inhibits lipolysis and exacerbates the development of NAFLD.29 Indeed, defective lipolysis has now been recognized as one of the most important mechanisms contributing to the pathogenesis of NAFLD.1, 2, 3 We have shown that overexpression of LCN2 in hepatocytes induces lipolysis, leading to a reduction in hepatic levels of fatty acids (C16:0 and C18:1), MDA and apoptosis, whereas loss of LCN2 has opposite effects. Thus, LCN2 protects against steatohepatitis likely by inducing lipolysis in the first place.
LCN2 is an acute protein that is induced in response to bacterial infection, metabolic stress, or injury. Elevated plasma level of LCN2 is generally considered a “help me” signal in response to inflammation or tissue injury.30, 31 Hepatocyte‐derived LCN2 plays a critical role in inhibiting bacterial infection and promoting liver regeneration.5 However, little is known about the role of hepatocyte‐derived LCN2 in lipid metabolism, NASH development, or the underlying mechanism. Our studies underscore a critical role of hepatocyte‐derived LCN2 in the pathogenesis of NAFLD, suggesting that the induction of hepatic LCN2 in response to metabolic stress is a protective mechanism.
In summary, our data illustrated a central role of hepatocyte‐derived LCN2 in the pathogenesis of NAFLD. Importantly, we have also uncovered a mechanism by which LCN2 regulates lipid metabolism, inflammation, and fibrosis. Given that hepatocytes are enriched in LCN2 and are one of the major sources of plasma LCN2, elevation of LCN2 expression in hepatocytes may be useful for treatment of NAFLD.
Supporting information
Acknowledgements
Normal or pathologic human liver tissues were obtained through the Liver Tissue Cell Distribution System (Minneapolis, MN), which was funded by NIH Contract # HHSN276201200017C.
Supported by the National Institutes of Health (R01DK102619, R01DK118941, and R01HL103227, and R01HL142086).
Potential conflict of interest: Nothing to report.
References
- 1. Fuchs CD, Claudel T, Trauner M. Role of metabolic lipases and lipolytic metabolites in the pathogenesis of NAFLD. Trends Endocrinol Metab 2014;25:576‐585. [DOI] [PubMed] [Google Scholar]
- 2. Schweiger M, Lass A, Zimmermann R, Eichmann TO, Zechner R. Neutral lipid storage disease: genetic disorders caused by mutations in adipose triglyceride lipase/PNPLA2 or CGI‐58/ABHD5. Am J Physiol Endocrinol Metab 2009;297:E289‐E296. [DOI] [PubMed] [Google Scholar]
- 3. Romeo S, Kozlitina J, Xing C, Pertsemlidis A, Cox D, Pennacchio LA, et al. Genetic variation in PNPLA3 confers susceptibility to nonalcoholic fatty liver disease. Nat Genet 2008;40:1461‐1465. [DOI] [PMC free article] [PubMed] [Google Scholar]
- 4. Xiao X, Yeoh BS, Vijay‐Kumar M. Lipocalin 2: an emerging player in iron homeostasis and inflammation. Annu Rev Nutr 2017;37:103‐130. [DOI] [PubMed] [Google Scholar]
- 5. Xu MJ, Feng D, Wu H, Wang H, Chan Y, Kolls J, et al. Liver is the major source of elevated serum lipocalin‐2 levels after bacterial infection or partial hepatectomy: a critical role for IL‐6/STAT3. Hepatology 2015;61:692‐702. [DOI] [PMC free article] [PubMed] [Google Scholar]
- 6. Goetz DH, Holmes MA, Borregaard N, Bluhm ME, Raymond KN, Strong RK. The neutrophil lipocalin NGAL is a bacteriostatic agent that interferes with siderophore‐mediated iron acquisition. Mol Cell 2002;10:1033‐1043. [DOI] [PubMed] [Google Scholar]
- 7. Zhang Y, Foncea R, Deis JA, Guo H, Bernlohr DA, Chen X. Lipocalin 2 expression and secretion is highly regulated by metabolic stress, cytokines, and nutrients in adipocytes. PLoS One 2014;9:e96997. [DOI] [PMC free article] [PubMed] [Google Scholar]
- 8. Ye D, Yang K, Zang S, Lin Z, Chau HT, Wang Y, et al. Lipocalin‐2 mediates non‐alcoholic steatohepatitis by promoting neutrophil‐macrophage crosstalk via the induction of CXCR8. J Hepatol 2016;65:988‐997. [DOI] [PubMed] [Google Scholar]
- 9. Devireddy LR, Gazin C, Zhu X, Green MR. A cell‐surface receptor for lipocalin 24p3 selectively mediates apoptosis and iron uptake. Cell 2005;123:1293‐1305. [DOI] [PubMed] [Google Scholar]
- 10. Asimakopoulou A, Borkham‐Kamphorst E, Henning M, Yagmur E, Gassler N, Liedtke C, et al. Lipocalin‐2 (LCN2) regulates PLIN5 expression and intracellular lipid droplet formation in the liver. Biochim Biophys Acta 2014;1842:1513‐1524. [DOI] [PubMed] [Google Scholar]
- 11. Guo H, Jin D, Zhang Y, Wright W, Bazuine M, Brockman DA, et al. Lipocalin‐2 deficiency impairs thermogenesis and potentiates diet‐induced insulin resistance in mice. Diabetes 2010;59:1376‐1385. [DOI] [PMC free article] [PubMed] [Google Scholar]
- 12. Xu Y, Zalzala M, Xu J, Li Y, Yin L, Zhang Y. A metabolic stress‐inducible miR‐34a‐HNF4alpha pathway regulates lipid and lipoprotein metabolism. Nat Commun 2015;6:7466. [DOI] [PMC free article] [PubMed] [Google Scholar]
- 13. Zhang Y, Lee FY, Barrera G, Lee H, Vales C, Gonzalez FJ, et al. Activation of the nuclear receptor FXR improves hyperglycemia and hyperlipidemia in diabetic mice. Proc Natl Acad Sci U S A 2006;103:1006‐1011. [DOI] [PMC free article] [PubMed] [Google Scholar]
- 14. Zhang Y, Yin L, Hillgartner FB. SREBP‐1 integrates the actions of thyroid hormone, insulin, cAMP, and medium‐chain fatty acids on ACCalpha transcription in hepatocytes. J Lipid Res 2003;44:356‐368. [DOI] [PubMed] [Google Scholar]
- 15. Xu J, Li Y, Chen W, Xu Y, Yin L, Ge X, et al. Hepatic carboxylesterase 1 is essential for both normal and farnesoid X‐receptor‐controlled lipid homeostasis. Hepatology 2014;59:1761‐1771. [DOI] [PMC free article] [PubMed] [Google Scholar]
- 16. Bligh EG, Dyer WJ. A rapid method of total lipid extraction and purification. Can J Biochem Physiol 1959;37:911‐917. [DOI] [PubMed] [Google Scholar]
- 17. Xu J, Xu Y, Li Y, Jadhav K, You M, Yin L, et al. Carboxylesterase 1 Is regulated by hepatocyte nuclear factor 4alpha and protects against alcohol‐ and MCD diet‐induced liver injury. Sci Rep 2016;6:24277. [DOI] [PMC free article] [PubMed] [Google Scholar]
- 18. Jadhav K, Xu Y, Xu Y, Li Y, Xu J, Zhu Y, et al. Reversal of metabolic disorders by pharmacological activation of bile acid receptors TGR5 and FXR. Mol Metab 2018;9:131‐140. [DOI] [PMC free article] [PubMed] [Google Scholar]
- 19. Li Y, Zalzala M, Jadhav K, Xu Y, Kasumov T, Yin L, et al. Carboxylesterase 2 prevents liver steatosis by modulating lipolysis, endoplasmic reticulum stress, and lipogenesis and is regulated by hepatocyte nuclear factor 4 alpha in mice. Hepatology 2016;63:1860‐1874. [DOI] [PMC free article] [PubMed] [Google Scholar]
- 20. Ge X, Yin L, Ma H, Li T, Chiang JY, Zhang Y. Aldo‐keto reductase 1B7 is a target gene of FXR and regulates lipid and glucose homeostasis. J Lipid Res 2011;52:1561‐1568. [DOI] [PMC free article] [PubMed] [Google Scholar]
- 21. Rune A, Osler ME, Fritz T, Zierath JR. Regulation of skeletal muscle sucrose, non‐fermenting 1/AMP‐activated protein kinase‐related kinase (SNARK) by metabolic stress and diabetes. Diabetologia 2009;52:2182‐2189. [DOI] [PMC free article] [PubMed] [Google Scholar]
- 22. Zhang Y, Ge X, Heemstra LA, Chen WD, Xu J, Smith JL, et al. Loss of FXR protects against diet‐induced obesity and accelerates liver carcinogenesis in ob/ob mice. Mol Endocrinol 2012;26:272‐280. [DOI] [PMC free article] [PubMed] [Google Scholar]
- 23. Ou J, Tu H, Shan B, Luk A, DeBose‐Boyd RA, Bashmakov Y, et al. Unsaturated fatty acids inhibit transcription of the sterol regulatory element‐binding protein‐1c (SREBP‐1c) gene by antagonizing ligand‐dependent activation of the LXR. Proc Natl Acad Sci U S A 2001;98:6027‐6032. [DOI] [PMC free article] [PubMed] [Google Scholar]
- 24. Yoshikawa T, Shimano H, Yahagi N, Ide T, Amemiya‐Kudo M, Matsuzaka T, et al. Polyunsaturated fatty acids suppress sterol regulatory element‐binding protein 1c promoter activity by inhibition of liver X receptor (LXR) binding to LXR response elements. J Biol Chem 2002;277:1705‐1711. [DOI] [PubMed] [Google Scholar]
- 25. Wang C, Zhao Y, Gao X, Li L, Yuan Y, Liu F, et al. Perilipin 5 improves hepatic lipotoxicity by inhibiting lipolysis. Hepatology 2015;61:870‐882. [DOI] [PubMed] [Google Scholar]
- 26. Malhi H, Gores GJ. Molecular mechanisms of lipotoxicity in nonalcoholic fatty liver disease. Semin Liver Dis 2008;28:360‐369. [DOI] [PMC free article] [PubMed] [Google Scholar]
- 27. Neuschwander‐Tetri BA. Hepatic lipotoxicity and the pathogenesis of nonalcoholic steatohepatitis: the central role of nontriglyceride fatty acid metabolites. Hepatology 2010;52:774‐788. [DOI] [PubMed] [Google Scholar]
- 28. Jha P, Claudel T, Baghdasaryan A, Mueller M, Halilbasic E, Das SK, et al. Role of adipose triglyceride lipase (PNPLA2) in protection from hepatic inflammation in mouse models of steatohepatitis and endotoxemia. Hepatology 2014;59:858‐869. [DOI] [PubMed] [Google Scholar]
- 29. Guo F, Ma Y, Kadegowda AK, Betters JL, Xie P, Liu G, et al. Deficiency of liver Comparative Gene Identification‐58 causes steatohepatitis and fibrosis in mice. J Lipid Res 2013;54:2109‐2120. [DOI] [PMC free article] [PubMed] [Google Scholar]
- 30. Asimakopoulou A, Borkham‐Kamphorst E, Tacke F, Weiskirchen R. Lipocalin‐2 (NGAL/LCN2), a “help‐me” signal in organ inflammation. Hepatology 2016;63:669‐671. [DOI] [PubMed] [Google Scholar]
- 31. Bellos I, Fitrou G, Daskalakis G, Perrea DN, Pergialiotis V. Neutrophil gelatinase‐associated lipocalin as predictor of acute kidney injury in neonates with perinatal asphyxia: a systematic review and meta‐analysis. Eur J Pediatr 2018;177:1425‐1434. [DOI] [PubMed] [Google Scholar]
Associated Data
This section collects any data citations, data availability statements, or supplementary materials included in this article.
Supplementary Materials