Abstract
Vertical transmission of hepatitis B virus (HBV) from the mother to the newborn often results in viral persistence. To understand mechanisms of maternofetal HBV transmission, we studied maternal immunity and peripheral blood mononuclear cell (PBMC) transcriptome in mothers and newborns. We included 50 mothers and babies who were hepatitis B surface antigen (HBsAg) positive: 22 HBV transmitting mothers (group [Gr.] I) and 28 HBV nontransmitting mothers (Gr. II) to newborns and 10 healthy mother–baby pairs (Gr. III). PBMCs were analyzed for HBV‐specific dendritic cells (DCs), T cells, T follicular helper (TFh) cells, B cells, functional immune responses, and cytokine levels as well as transcriptome signatures to identify immune gene expression correlates for protective immunity. Group II mothers had lower HBsAg levels (3.82 × 10³ versus 1.493 × 10⁴; P < 0.0001) with greater HBV‐specific responses of DCs, T cells, TFh cells, and B cells than Gr. I mothers. Frequencies of TFh cells were lower in Gr. I mothers, with reduced interleukin‐21 (IL‐21) levels, and these inversely correlated with HBV DNA levels. Cut‐off levels of 9.5% and 8.93% from the receiver operating curve predicted the involvement of TFh cells and B cells in HBV transmission. Transcriptome signatures revealed that maternal gene imprints were reflected in the newborns. Genes related to DCs, TFh cells, and B cells were increased in Gr. II, and Gr. II newborns showed a boost in cellular and humoral responses after vaccination. Conclusion: In mothers infected with HBV, low serum IL‐21 levels and decreased TFh‐cell and plasma B‐cell frequencies are associated with vertical transmission of HBV to newborns. These features are indicative of low protective maternal immunity.
Abbreviations
- BCL6
B‐cell lymphoma 6
- Breg
regulatory B cell
- CD
clusters of differentiation
- cDNA
complementary DNA
- CXCR
chemokine (C‐X‐C motif) receptor
- DC
dendritic cell
- ELISA
enzyme‐linked immunosorbent assay
- FDR
false discovery rate
- FSC
forward scatter
- GMCSF
granulocyte‐macrophage colony‐stimulating factor
- Gr.
group
- H
healthy (control)
- HB
healthy newborn
- HBc
hepatitis B core
- HBcAg
hepatitis B core antigen
- HBeAg
hepatitis B e antigen
- HBs
hepatitis B surface
- HBsAg
hepatitis B surface antigen
- HBV
hepatitis B virus
- HIV
human immunodeficiency virus
- ICOS
inducible costimulatory molecule
- IFN‐γ
interferon‐γ
- IGHG1
immunoglobulin heavy constant gamma 1
- IL
interleukin
- IRA
innate response activator
- IRF
interferon regulatory factor
- Lin3
lineage cocktail 3
- LMP2/7
proteasome subunit beta 9/subunit beta 8
- mDC
myeloid dendritic cell
- mRNA
messenger RNA
- NS
not significant
- NT
nontransmitting
- PBMC
peripheral blood mononuclear cell
- PCR
polymerase chain reaction
- pDC
plasmocytoid dendritic cell
- PE
phycoerythrin
- ROC
receiver operating curve
- SSC
side scatter
- STAT
signal transducer and activator of transcription
- T
transmitting
- TAP1/TAP2
transporter 1/transporter 2 adenosine triphosphate‐binding cassette subfamily B member
- TFh
T follicular helper
- TGF‐β
transforming growth factor β
- TLR
toll‐like receptor
- TRAF
tumor necrosis factor receptor–associated factor
- +ve
positive
Hepatitis B virus (HBV) infection is a global health concern with an estimated 240 million chronic HBV‐infected individuals.1, 2 Maternofetal transmission is a major cause of persistence of the virus and development of chronicity3 and thereby adds to the pool of infected subjects.4 In newborns with hepatitis B surface antigen (HBsAg) positive (+ve), the risk of developing chronic infection is greater than 90% compared to just 5% to 10% in adults. Maternal high viral load and hepatitis B e antigen (HBeAg) are associated with HBV transmission to newborns.4, 5, 6 However, it has been shown that quantitative HBsAg levels in mothers predict transmission of HBV infection equally well.7
Humoral immune response is equally important for clearance of pathogens and long‐term immunity.8 A subset of clusters of differentiation (CD)4+ T cells and T follicular helper (TFh) cells play a key role in regulation of B‐cell‐mediated responses.9, 10, 11 A recent study has shown the role of dendritic cells (DCs) in the switching of naive CD4+ T cells and programming to TFh cells.12 TFh cells are characterized by expression of chemokine (C‐X‐C motif) receptor 5 (CXCR5), costimulatory molecules (such as inducible costimulatory molecule [ICOS]), and inhibitory molecule programmed death receptor 1 (PD‐1).11 They are involved in B‐cell maturation and function in the germinal center. These cells also influence isotype class switching and antibody affinity maturation by secreting interleukin (IL)‐21 through direct interaction with B cells.10 The TFh cells and B cells also help in HBsAg and HBeAg seroconversion.13, 14, 15, 16
Various genetic factors, such as chemokine (C‐C motif) receptor 5 (CCR5), CXCR4, IL‐4, and IL‐10, impact mother‐to‐infant human immunodeficiency virus (HIV) transmission12, 13, 14 and were identified as determinants for mother‐to‐infant transmission. Although transmission is multifactorial and transcriptomic signatures are albeit complex, genetic signatures add to existing information of the immune response. Therefore, differential gene expression profiling studies are being used to support the functional immune data. HBV transmission from mother to baby provides a unique model to study the role of maternal and viral factors. Thus, the present study was undertaken to investigate the role of viral and host immune factors as well as genetic factors in HBsAg+ mothers who transmitted the virus and those who did not. The results of the study suggest a significant role of maternal immunity in the vertical transmission of hepatitis B.
Patients and Methods
HBV Pregnant Women
A total of 18,461 pregnant women were screened for hepatitis B markers during their routine checkup in the Gynecology and Obstetrics outpatient department at the Lady Hardinge Medical College in collaboration with the Institute of Liver and Biliary Sciences, New Delhi, from 2011 to 2016. None of the pregnant women had any systemic illness, autoimmune disease, or inherited metabolic disorder.
This study was approved by the Institutional Ethics Committee of the Institute of Liver and Biliary Sciences, and informed consent was obtained from each patient (for mothers and their newborns) or their close relatives for inclusion in the study.
Serologic Assays
Using standard sterile techniques, peripheral blood samples (15‐20 mL) were collected in ethylene diamine tetra‐acetic acid tubes at the time of enrollment. Sera of study subjects were tested for routine hepatitis B serologic markers (HBsAg, HBeAg, anti‐HBeAg, anti‐hepatitis B core antigen [HBcAg]) by commercial methods (Cobas e411; Roche Diagnostics, Indianapolis, IN). Plasma was also tested for hepatitis A, hepatitis C, and hepatitis E virus as well as HIV.
Of 18,461 subjects, 297 (1.63%) pregnant women were found positive for HBsAg and negative for hepatitis C and HIV. Of the 297 HBsAg+ve pregnant females, 125 were tested for HBsAg in each trimester and were followed up for 1 year after delivery. Of the 125 HBsAg+ mothers, only 22 gave birth to HBsAg+ve newborns (transmitting [T] mothers). The remaining 103 newborns were negative for HBsAg. Of these 103 newborns, we randomly selected 28 nontransmitting (NT) mothers (Group [Gr.] II) and their newborns for further immune analysis for comparison with T mothers (Gr. I; n = 22) and their newborns.
Serologic and Virologic Assessment of Newborns
Blood samples were collected from the 125 HBsAg+ and 10 healthy (H) mothers and their newborns at birth. The plasma was separated within an hour of collection and immediately stored at −80°C. Plasma was tested for hepatitis B markers (HBsAg, HBeAg, and HBeAg antibody [anti‐HBe]) by commercial methods (kits from Roche Diagnostics). However, the quantity of blood drawn from newborns at the time of birth was substantially less (0.5‐1 mL), and plasma was not sufficient for analysis of both HBsAg and HBV DNA. Therefore, we tested HBsAg at birth and HBV DNA and anti‐HBcAg at 1 and 6 months. HBsAg was done if HBV DNA was positive in the newborn and confirmed again at 6 months.
Study Groups
Gr. I consisted of pregnant women with HBsAg positivity who gave birth to newborns positive for HBsAg; these women were categorized as T mothers (n = 22). Gr. II consisted of pregnant women with HBsAg positivity who gave birth to newborns negative for HBsAg; these women were categorized as NT mothers (n = 28). Gr. III consisted of pregnant women who were negative for all viral markers and gave birth to normal newborns; these women served as controls and were categorized as H mothers (n = 10).
HBV Vaccination
The first dose of the HBV recombinant vaccine was given to newborns within 12 hours of birth and was followed by the second and third doses at 1 month and 6 months, respectively. Blood from the newborns was taken within 6 hours of birth from the peripheral vein before giving the first dose of the HBV vaccine.
Anti‐HBsAg Analysis After HBV Vaccination
After completion of the HBV vaccination course, anti‐HBsAg levels were measured at 6 months in newborns using the human anti‐HBsAg antibody (anti‐HBs) enzyme‐linked immunosorbent assay (ELISA) kit (Cat# SLO192Hu; Sunlog) according to the kit instructions. Serologic and virologic analysis revealed that out of 125 mothers who were HBsAg+, only 22 (17.6%) transmitted HBV to newborns as their newborns showed HBsAg positivity at birth; the remaining 103 mothers did not transmit the virus to their newborns. Out of these 103 mothers, only 28 NT mothers were included for further immune analysis.
HBsAg Quantification
A quantitative assay for maternal HBsAg was conducted using an Abbott i2000 fully automated Architect HBsAg QT (Abbott Laboratories) assay with a detection range of 0.05 to 250 IU/mL. If the HBsAg level was >250 IU/mL, the samples were diluted 1:100 to 1:1,000 to obtain a reading within the range of the calibration curve. A concentration higher than 0.05 IU/mL was considered HBsAg+.
HBV DNA Quantification
HBV DNA quantification was done with 500 μL plasma using the COBAS TaqMan HBV test with high pure extraction (Roche Diagnostics) according to the manufacturer's protocol.17
Isolation of Peripheral Blood Mononuclear Cells and Flow Cytometry Analysis
After collecting plasma, blood was diluted with cold phosphate‐buffered saline (PBS). Peripheral blood mononuclear cells (PBMCs) were then isolated by using Ficoll‐Hypaque density gradient centrifugation.
To analyze T cells and B cells, 1 × 10⁶ PBMCs were incubated with anti‐human CD4, CD8 (Cat# 560108; BD Biosciences), CD19 (Cat# 558497; BD Biosciences), CD38 (Cat# 562665, Resource Identification AB_2313578; BD Biosciences), CD27 (Cat# 563092; BD Biosciences), and CD10 (Cat# 11‐0106‐71; Thermo Fisher Scientific). CD4 (Cat# 317431; BioLegend), CXCR5 (Cat# 356908; BioLegend), and ICOS (Cat# 313518; BioLegend) were used for analyzing TFh and lineage cocktail 3 (Lin3)–ve (Cat# 643510; BD Biosciences), and CD11c (Cat# 560370; BD Biosciences) and CD123 (Cat# 560087; BD Biosciences) were used for analyzing myeloid DCs (mDCs) and plasmocytoid DCs (pDCs). We also used unstained cells and cells with single‐color fluorochrome for setting compensation. We did not use a marker for dead cell exclusion in the panels due to the restriction of available channels in the three‐laser flow cytometer; however, we followed the reference study18 to identify the number of dead cells in samples for detection of HBV‐specific responses.
Cells were permeabilized and fixed for intracellular staining for toll‐like receptors (TLRs) using anti‐human TLR7‐phycoerythrin (PE; Cat# LS‐C10763‐100; LifeSpan) and TLR9‐allophycocyanin (APC; Cat# LS‐C10787‐100; LifeSpan) antibodies for 15 minutes. Single‐color compensation was performed. A minimum of 100,000 events were acquired using a BD Verse flow cytometer, and data were analyzed using Flow Jo software version 8.7 (Tree Star Inc., Ashland, OR).
HBV‐Specific Cellular Responses
To investigate the HBV‐specific responses of CD4, CD8, and TFh cells, the cells were stimulated for 16 hours at 37°C with or without HBV overlapping pooled peptides (HBs207‐339 and HBc340‐388) of genotype D in Roswell Park Memorial Institute medium with 10% fetal bovine serum and then with 5 μg/mL anti‐CD28 and anti‐CD49d (BD Pharmingen, San Diego, CA) for 16 hours at 37°C with 5% CO2. After 1 hour of incubation, brefeldin A (1 μg/mL) (BD Pharmingen) was added to the cultures.
As a positive control, cells were stimulated with phorbol 12‐myristate 13‐acetate (50 ng/mL; Merck, Darmstadt, Germany) and ionomycin (1 μmol/L; Merck). Interferon‐γ (IFN‐γ)‐ and IL‐17A‐producing CD4, CD8, and TFh cells were measured by flow cytometry analysis. To determine the HBV‐specific cellular responses of DCs and B cells, PBMCs were stimulated in the same manner, and IL‐12‐ and IL‐10‐secreting DCs (mDCs and pDCs), IL‐10‐ and transforming growth factor β (TGF‐β)‐secreting regulatory B cells (Bregs), and granulocyte‐macrophage colony‐stimulating factor (GMCSF)‐, IFN‐γ‐, and IL‐2‐secreting B cells were measured.
Cells were stained for 30 minutes with anti‐CD4 V421, anti‐CD8 PE/cyanine5.5 (Cy5), anti‐CXCR5 APC, anti‐IFN‐γ PE (eBiosciences), anti‐IL‐17 PE/Cy7 (BD Pharmingen), and anti‐CD19 V510 at 4°C for analysis of CD4, CD8, and TFh cells; washed with PBS; and then permeabilized and fixed with cytoperm/cytofix (100 µL) (BD Biosciences) for 10 minutes. After washing, cells were fixed and acquired on a BD Verse flow cytometer and results analyzed using FlowJo software (Tree Star).
Quantification of Serum IL‐21 Levels
The plasma IL‐21 level was measured in maternal peripheral blood using the human IL‐21 Ready‐SET‐Go (Second Generation) ELISA kit (eBiosciences) following the manufacturer's protocol. The lower limit of detection was 8 pg/mL.
Next‐Generation Sequencing
We performed RNA sequencing in T and NT mothers (2 from each group, with a similar high viral load [>105 IU/mL]) and H mothers and their newborn babies. Total RNA was purified using Sera‐Mag deoxythymidine oligomer beads (Thermo Fisher Scientific) after deoxyribonuclease I treatment. Messenger RNA (mRNA) was fragmented by heating and then treating with sodium acetate. The cleaved RNA fragments were transcribed into first‐strand complementary DNA (cDNA) using reverse transcriptase, followed by second‐strand cDNA synthesis employing DNA polymerase and ribonuclease H, and then cDNA purification using the QIAquick Gel Extraction kit (Qiagen, CA). The double‐stranded cDNA was further subjected to end repair using T4 DNA polymerase, the Klenow fragment, and T4 polynucleotide kinase followed by a poly (A)‐tailing procedure using Klenow exopolymerase and ligation with an adapter using T4 DNA ligase. Adapter‐ligated fragments were separated by agarose gel electrophoresis, and the desired range of cDNA fragments (200 ± 25 base pairs) was excised from the gel and enriched by polymerase chain reaction (PCR) to construct the final cDNA library. After validation with the Agilent 2200, the cDNA library was pair‐end sequenced on a flow cell using the Illumina HiSeq 2000.
Next‐Generation Sequencing Data Analysis
Stringent quality control of paired‐end sequence reads of all samples was performed using the next‐generation sequencing (NGS) QC Toolkit.18 Paired‐end sequence reads with a Phred score >Q20 was taken for further analysis. Human genome build Hg19 was used for SpliceVar read alignment and identification of transcripts that are expressed in both libraries independently. TopHat pipeline19 was used for alignment, and the Cufflink and Cuffdiff pipeline20 was used for identification of transcript coding regions followed by quantification and annotation using default parameters. Transcripts with an average read count of ≥10, fragments per kilobase of transcript per million mapped reads of ≥1, and a log2 ratio ≥1 were considered as expressed. Sample‐specific transcript expression, baseline transcript expression, and differential expression analysis (fold change >1.5 and P ≥ 0.05) were performed based on the above criteria. Unsupervised hierarchical clustering of differentially expressed genes was done using Cluster 3.021 and visualized using Java Tree View.22 Statistically significantly enriched gene ontologies and pathways that harbor differentially expressed transcripts were identified using the GO‐Elite tool.23
Calculation of Differentially Expressed Transcripts
Differentially expressed transcripts and microRNAs between patient groups were identified by a differential expression sequencing data analysis pipeline using a fold‐change threshold of absolute fold change ≥1.5 and a statistically significant Student t test P value threshold adjusted for a false discovery rate (FDR) of <0.001. Data for healthy controls were used for normalization. Statistically significantly enriched functional classes with a P value adjusted for an FDR of <0.05 derived using the hypergeometric distribution test corresponding to differentially expressed genes were determined using the Student t test with the Benjamini‐Hochberg FDR test. Unsupervised hierarchical clustering of differentially expressed genes between patient groups was done using a Euclidian algorithm with the centroid linkage rule to identify gene clusters.
Quantitative Reverse‐Transcription PCR Analysis
RNA quality was checked by a bioanalyzer (Agilent Technologies, CA). The RNA samples (approximately 200 ng) were then amplified using a random hexamer primer to form cDNA (Exiqon kit; Exiqon A/S, Vedbaek, Denmark).
Quantitative reverse‐transcription PCR (qRT‐PCR) analysis was performed with a SYBR Green PCR kit (Applied Biosystems, DE) using an ABI PRISM 7700 Sequence Detector and ViiA‐7 software (Applied Biosystems). The primers of selected genes were designed using Primer 3 software (Supporting Table SI). Gene expression level was normalized against 18S RNA (control gene). Subsequently, relative gene expression values were determined using the log of 2–ΔΔCT. Log fold change was calculated after subtraction of the 18S internal control from each group.
Statistical Analysis
Categorical variables were presented as proportions, and continuous variables were either presented as means with SD or medians with range. A normally distributed continuous variable was compared using the Student t test or Mann‐Whitney test for nonparametric tests. Categorical variables were compared by Fisher's exact test or Pearson's chi‐square test. Spearman's rank correlation coefficient was used for measuring the association between plasma B cells and IL‐21 with anti‐HBsAg. All statistical tools were two‐tailed, and P < 0.05 was significant. Statistical tests were performed using SPSS for Windows version 22 (IBM Corporation, Armonk, NY).
Results
Study Design for Immune Profiling and Virologic and Serologic Characteristics
Blood from a total of 125 mothers who were HBsAg+ at the time of delivery and their newborns was collected and processed for serologic and virologic studies. Demographic profiles of mothers and their newborns are shown in Supporting Tables S2 and S3. There was no difference between Gr. I and Gr. II at baseline. HBV T mothers (Gr. I) had higher HBsAg levels (1.493 × 10⁴ versus 3.82 × 10³, respectively; P < 0.0001) than Gr. II (Supporting Fig. S1A). HBV DNA levels were also similarly higher, although the difference was not significant (6.7 log10 versus 3.25 log10, respectively; P = 0.32). Of the 22 mothers who were HBsAg+ in Gr. I, 6 (27%) were HBeAg+; whereas of 28 mothers in Gr. II, only 2 (7.1%) were HBeAg+. All the newborns from Gr. I mothers were HBsAg+ve at the time of birth and positive for HBV DNA at 1 month, but newborns from NT mothers were negative for both. Six months after the third dose of the HBV vaccine, 20 of 22 newborns were found to be HBsAg–. Two newborns remained positive for HBsAg and HBV DNA.
HBV‐Specific Cellular Responses by DCs
DCs play a crucial role in antiviral immunity through their capacity to recognize, process, and present HBV antigen through TLRs, which are vital for inducing adaptive immune responses.19 The number and functionality of DCs in response to HBsAg and HBcAg overlapping peptides were measured in mothers. The gating strategy used for mDCs and pDCs in the flow cytometry analysis is shown in Fig. 1A. Frequencies of mDCs and pDCs were significantly higher in H mothers compared to Gr. I and Gr. II mothers. A similar pattern was observed in the mDCs of their newborns. In the case of pDCs, frequencies were similar in healthy babies and HBsAg– newborns, but there was a significant decrease in HBsAg+ve newborns (Fig. 1B).
Figure 1.
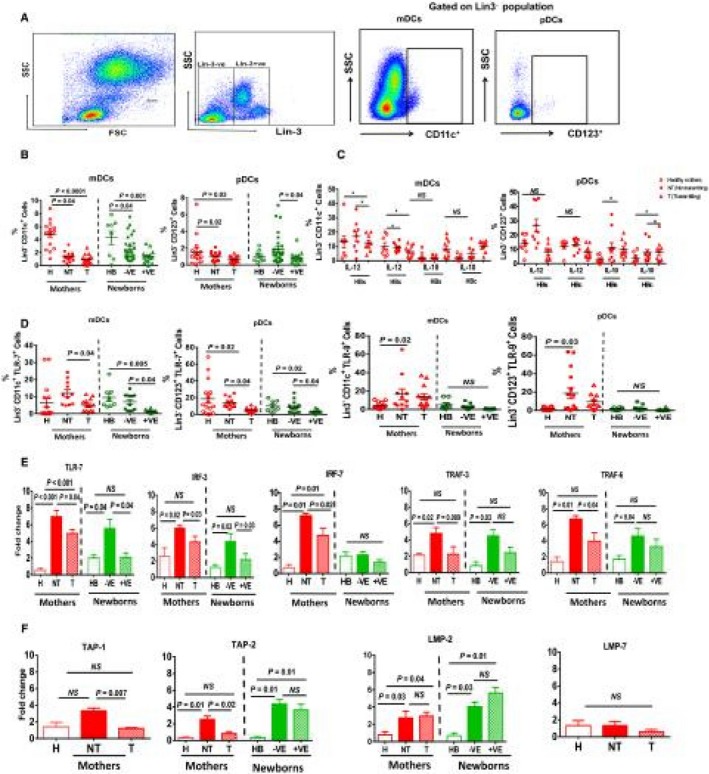
Dendritic cell population in HBV‐infected mothers and their newborns. (A) Sequential gating strategy of CD11c+ve (mDCs) and CD123+ve (pDCs) in the Lin3–ve population. (B) Cumulative dot plot showing the frequencies of circulating mDCs and pDCs in PBMCs of H, NT, and T mothers and their newborns. (C) Discrepancy in HBV‐specific IL‐10‐ and IL‐12‐secreting mDCs and pDCs in mothers. Horizontal short bars in the graph shows the mean ± SEM. P < 0.05 is considered significant. (D) TLR‐7 and TLR‐9 expression on mDCs and pDCs in mothers and their newborns. (E,F) Relative expression of selected genes and data are shown as fold change after normalizing with 18S. Graphs show the mean ± SEM. P < 0.05 is considered significant.
IL‐12‐secreted by DCs is required for naive T‐cell differentiation. Overlapping peptides were used to identify HBV‐specific CD8 and CD4 T‐cell responses. However, many studies suggest that DCs also respond to stimulation of overlapping pooled peptides through T‐cell activation or by cross‐reactivity of these peptides.20, 21, 22, 23 Therefore, we stimulated the PBMCs by overlapping peptides and measured the HBV‐specific responses of DCs. Gating strategies for cytokine secretion is provided in Supporting Fig. S1B. pDCs were found to be potent secretors of IL‐12 after HBsAg or HBcAg stimulation, and mDCs of Gr. I showed a robust production of IL‐10 (Fig. 1C). Frequencies of mDCs/pDCs in HBeAg+ mothers were not significantly different in producing IL‐12 and IL‐10 secretion than HBeAg– mothers (Supporting Fig. S2).
To understand the DC responses in more detail, we assessed the expression analysis of TLR7/TLR9 on DCs. Flow cytometry analysis revealed that TLR7 expression in mDCs and pDCs was significantly reduced in Gr. I mothers and their newborns compared to Gr. II. (Fig. 1D). Further, mRNA expression also confirmed the decreased expression of TLR7 and its downstream signaling molecules interferon regulatory factor (IRF)3, IRF7, tumor necrosis factor receptor–associated factor (TRAF)3, and TRAF6 in T mothers and their newborns (Fig. 1E).
To understand the ability of DCs in antigen processing and proteasome degradation, we analyzed the expression of transporter 1/transporter 2 adenosine triphosphate‐binding cassette subfamily B member (TAP1/TAP2) and proteasome subunit beta 9/subunit beta 8 (LMP2/LMP7) genes. Again, TAP1 and TAP2 expressions were decreased in Gr. I mothers; however, there was no difference in TAP2 or LMP2 expression in babies (Fig. 1F).
HBV‐Specific Proinflammatory and Anti‐Inflammatory Responses by T Cells
Viral clearance or persistence depends on a potent and directed cellular immunity. In chronic hepatitis B (CHB) infection, exhausted CD8 and impaired CD4 T‐cell function have been well documented.24 However, in the context of HBV vertical transmission, no studies provide a functional profile of T cells in mothers and their newborns. We therefore examined the HBV‐specific T cells for their cytokine‐secreting ability (Fig. 2A). There was significant decline in the proinflammatory cytokines secreting CD4/CD8 T cells in T mothers and their +ve newborns compared to the H and Gr. II mothers and their newborns (Fig. 2B,C).
Figure 2.
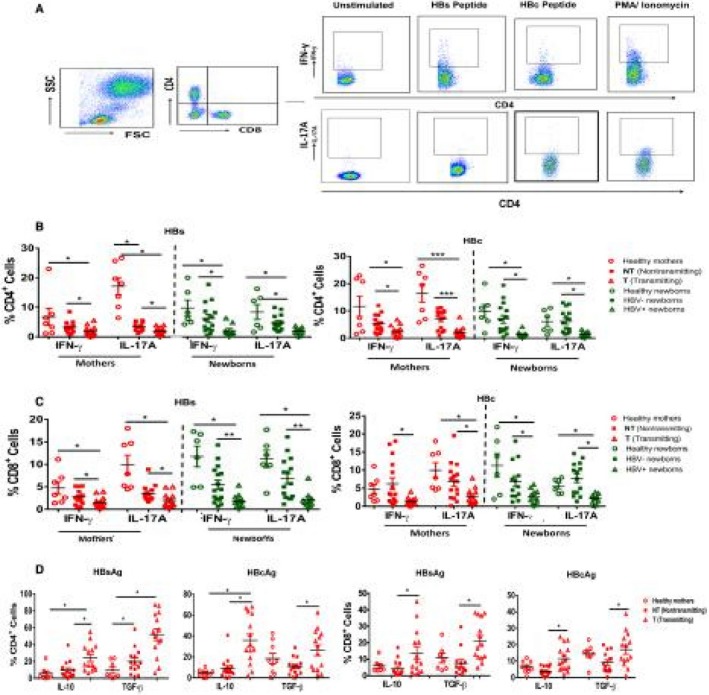
HBV‐specific CD4/CD8 T cells are less polyfunctional in T mothers. PBMCs were stimulated with HBsAg and HBcAg overlapping peptides and PMA/ionomycin as positive controls for 16 hours followed by phenotypic marker staining and intracellular staining. (A) Representative figure showing gating strategy for IFN‐y+CD4+ and IL‐17A+CD4+ T cells. (B,C) Dot plot representing the frequency of HBV‐specific IFN‐y‐ and IL‐17A‐producing CD4 and CD8 T cells in mothers and their newborns. (D) HBV‐specific CD4/CD8 T cells producing IL‐10+ and TGF‐β+ inhibitory cytokines in mothers. Horizontal short bars indicate the mean ± SEM. P < 0.05 is considered significant and represented as *P < 0.05, **P < 0.01, and ***P < 0.001. Abbreviation: PMA, phorbol 12‐myristate 13‐acetate.
As the PBMCs of newborns were not sufficient for all functional studies, HBV‐specific anti‐inflammatory‐suppressive cytokine IL‐10‐ and TGF‐β‐secretion were analyzed in mothers. We found significantly increased IL‐10 and TGF‐β cytokine secretion by CD4+ and CD8+ T cells in T mothers compared to Gr. II and H mothers (Fig. 2D).
Impaired Frequencies of B Cells and their Subsets in HBV T Mothers
B‐cell‐mediated immune responses play an essential role in antibody production and neutralizing circulating viral antigens.25, 26 Specifically, plasma B cells are known as main secretors of antibodies.27 We studied the phenotype of B cells by gating CD19+, CD10+, and CD38+ (Fig. 3A). Total B cells (CD19+) were significantly lower in Gr. I; however, these cells expressed more CD10+ (immature cell marker) and less CD38 (plasma cell marker) in Gr. I mothers and their newborns (Fig. 3B).
Figure 3.
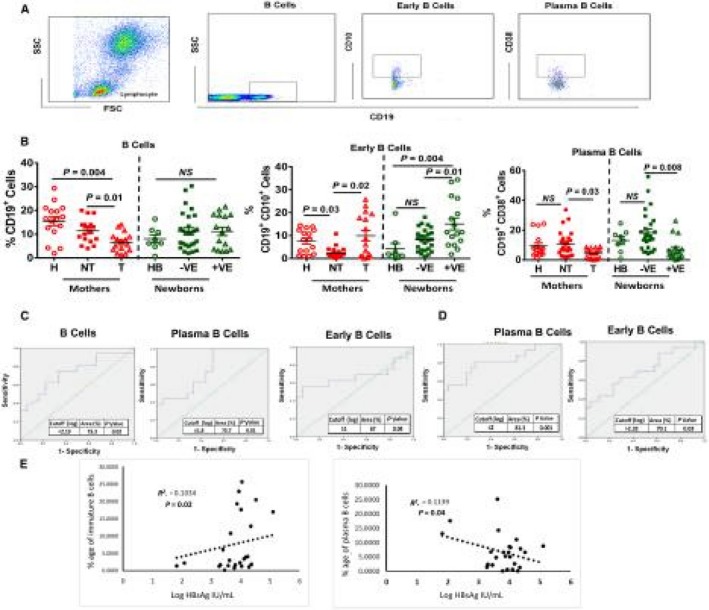
Analysis of B‐cell subsets in T and NT mothers. (A) Representative fluorescence‐activated cell sorting plots showing the gating strategy of total, early, and plasma B cells on the basis of CD19, CD10, and CD38. (B) Dot plot graph showing the frequency of total B cells (CD19+), early B cells (CD19+CD10+), and plasma B cells (CD19+CD38+). Horizontal bars represent the mean ± SEM. P < 0.05 is considered significant. (C,D) Diagnostic value of B cells and their subsets for HBV vertical transmission. ROC analysis showing the cutoff, % area under the curve, and P value in mothers and their newborns. (E) Spearman correlation analysis among HBsAg and B‐cell subsets.
The diagnostic significance of B cells in the vertical transmission of HBV was calculated by the percentage of area under the receiver operating characteristic curve. Receiver operating curve (ROC) analysis showed that mothers who had more total and plasma B cells with a cut‐off value of log 2.19 and log 1.8, respectively, were unlikely to transmit HBV. This is also indicative that more immature B cells with a cut‐off value of log 1 showed increased chances of vertical transmission (Fig. 3C,D). HBsAg levels were significantly negatively correlated (Spearman's correlation) with frequencies of plasma B cells and positively correlated with immature B cells in Gr. I and Gr. II (Fig. 3E,F). Sensitivity and specificity of this diagnostic test are given in Supporting Table S4.
HBV‐Specific B‐Cell Responses
Innate response activator (IRA) B cells are a newly identified B‐cell subset that are able to secrete GMCSF, IFN‐γ, and IL‐2 and significantly contribute to immunity.28 On the contrary, B cells, which negatively regulate immune responses through secretion of suppressive IL‐10 and TGF‐β cytokines, are known as Bregs.
We observed that HBsAg‐ and HBcAg‐specific GMCSF‐, IFN‐γ‐, and IL‐2‐secreting IRA‐B‐cell responses were significantly low in Gr. I compared to Gr. II and Gr. III (Fig. 4A,B). In contrast, Bregs secreted enough IL‐10 and TGF‐β suppressive cytokines in Gr. I compared to Gr. II and Gr. III (Fig. 4C,D).
Figure 4.
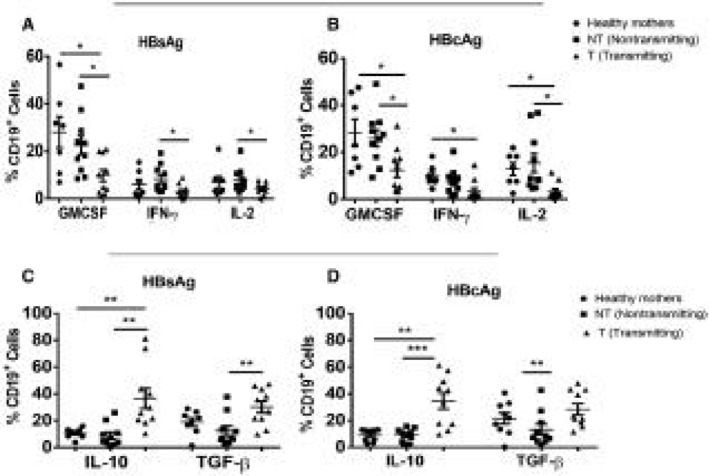
Analysis of HBV‐specific activators and suppressor B cells. PBMCs were stimulated with overlapping HBsAgs and HBcAg and cells stained with GMCSF, IFN‐y, and IL‐2. (A,B) Dot plot showing HBV‐specific GMCSF‐, IFN‐y‐, and IL‐2‐secreting IRA‐B cell proinflammatory responses. (C,D) Dot plots showing IL‐10 and TGF‐β secreting HBV‐specific Breg suppressive responses. Horizontal short bars indicate the mean ± SEM in all samples. P < 0.05 is considered significant and represented as *P < 0.05, **P < 0.01, and ***P < 0.001.
HBV‐Specific TFh Cell Responses
The importance of activated TFh cells to help in the maturation of B cells and plasma B‐cell functions through their signature cytokine IL‐21 is well documented. TFh cells in blood express CXCR5, ICOS, and CXCR3, which are also major producers of IFN‐γ and IL‐17A proinflammatory cytokines. The gating strategy used for the flow cytometry analysis of TFh cells is shown in Fig. 5A. A significant decrease was noted in CD4+CXCR5+CXCR3+ and ICOS+ cells in both Gr. I mothers and their newborns compared to Gr. II and their –ve newborns (Fig. 5A). IL‐21 as signature cytokines of TFh, showed ample secretion in Gr. II and H mothers compared to Gr. I mothers (Fig. 5B). Due to an insufficient amount of plasma IL‐21, ELISA could not be performed in newborns.
Figure 5.
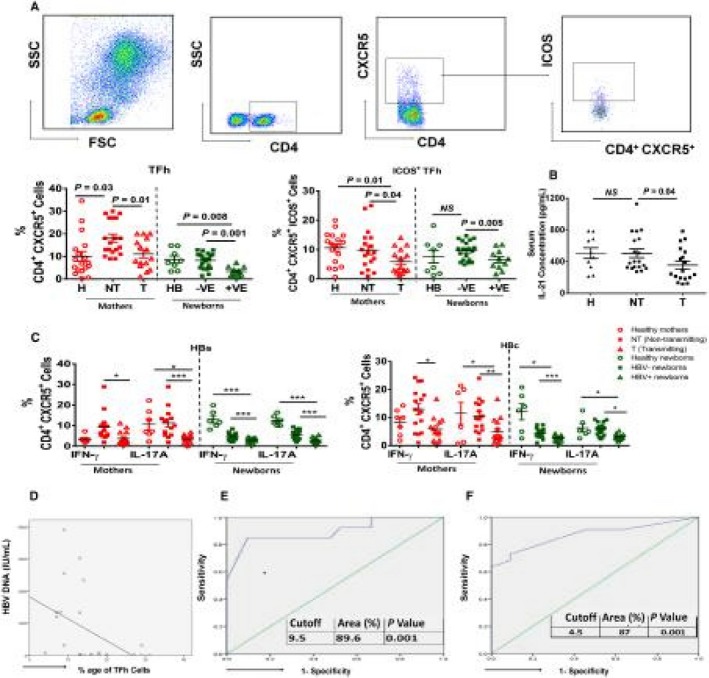
Defective TFh cells in HBV T mothers. (A) Sequential gating strategy of CD4+CXCR5+TFh cells and ICOS+TFh cells and dot plot graph showing the percentage frequencies of TFh cells and ICOS+TFh cells in mothers and newborns. (B) Serum IL‐21 levels in mothers. (C) Frequencies of IFN‐γ‐ and IL‐17A‐producing HBV‐specific CD4+CXCR5+ TFh cells in mothers and newborns. Horizontal short bars indicate the mean ± SEM. P < 0.05 is considered significant and represented as *P < 0.05, **P < 0.01, and ***P < 0.001. (D) Spearman's rank correlation showing the scattered diagram of TFh cells and HBV DNA. (E,F) ROC analysis of TFh cells for the transmission of HBV in mothers and newborns showing cutoff, % area under the curve, and P value.
A significant decrease in HBV‐specific TFh cells that are positive for IFN‐γ and IL‐17A was also detected in Gr. I mothers and their +ve newborns compared to Gr. II and Gr. III (Fig. 5C). Further, we observed that TFh cells negatively correlated with HBV DNA levels in mothers (Fig. 5D). ROC analysis showed that mothers with more than a 9.5% cut‐off value of TFh cells have 89.6% probability of not transmitting the virus to their newborns (Fig. 5E). Similarly, ROC analysis in newborns showed that more than a 4.5% cut‐off value of TFh cells had 87% probability of not being infected with HBV (Fig. 5F).
Transcriptome Profiles Identifies Immune Imprints of T Mothers in their +ve Newborns at Birth
Decreased functionality of immune cells in T mothers and their +ve newborns allowed us to investigate their transcriptome. PBMCs from each group were subjected to RNA sequencing, which revealed that a total of almost 37,000 genes were expressed in mothers and their newborns (Fig. 6A). Data of H mothers and their newborns were used for normalization. Unsupervised hierarchical clustering showed further that 5,813 and 4,653 genes in mothers and newborns, respectively, were differentially expressed by more than 2‐fold (Supporting Fig. S3).
Figure 6.
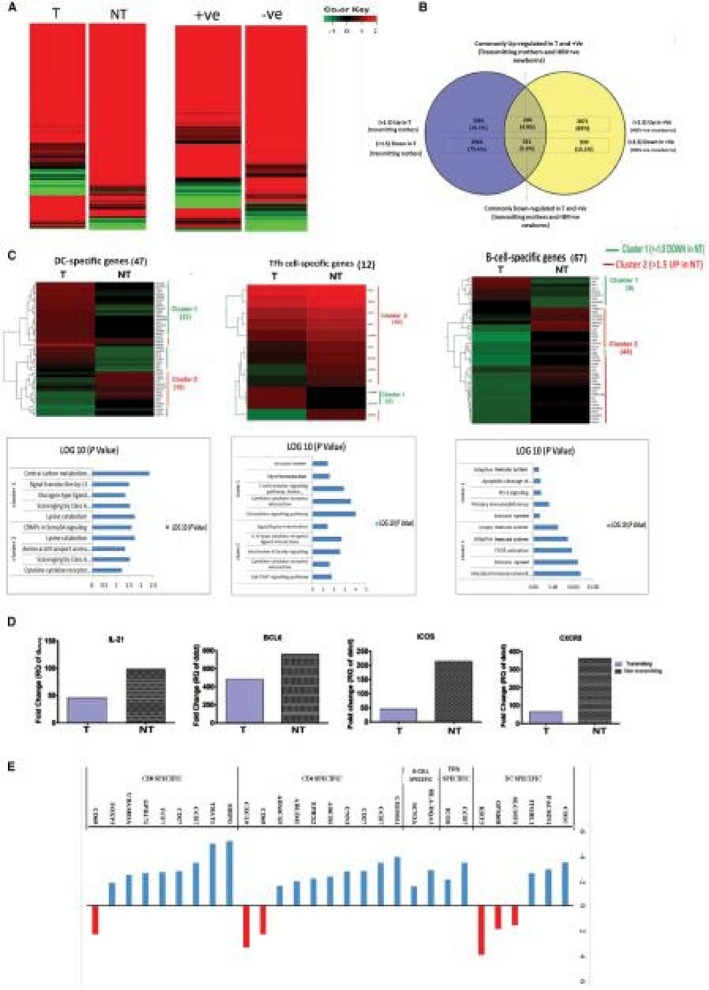
Global gene expression profile of peripheral blood mononuclear cells in mothers and newborns. (A) Heat map illustrating the relative expression of genes in T and NT mothers and their newborns at birth. (B) Pie diagram showing maternal immune imprinting in babies and fold expression of maternal imprints of common genes in +ve newborns; these genes were also up‐ and down‐regulated in mothers. (C) Percentage gene enrichment analysis. (D) Differential gene expression profile of mothers’ DC‐, TFh‐cell‐, B‐cell‐, and T‐cell‐specific genes associated with the top five significant pathways. (Genes that were up‐ and down‐regulated in T mothers were designated as cluster I and cluster 2, respectively. Log 10 values of genes in cluster 1 and 2 show associated key immune pathways.) (E) Relative gene expression of common key genes BCL6, ICOS, CXCR5, and IL‐21 of TFh cells and B cells. Abbreviations: BCL6, B‐cell lymphoma 6 protein; CRMP, collapsin response mediator protein; CXCR5, C‐X‐C chemokine receptor type 5; FCGR, Fcgamma receptor; ICOS, inducible T‐cell co‐stimulator; IL‐21, Interleukin 21; JAK, Janus kinase; PD‐1, programmed death receptor 1; Sema3A, semaphoring 3A.
In mothers and their newborns, similar genes were up‐regulated and down‐regulated (Fig. 6B). We calculated the percentage of cell‐specific gene enrichment using immune modules, as described by Chaussabel et al.29 and Vanwolleghem et al.30 Cell‐specific gene enrichment analysis depicted that T mothers and their +ve newborns have higher numbers of down‐regulated genes related to DCs, TFh cells, B cells, and other key immune functions compared to NT mothers and their –ve newborns (Fig. 6C). Similarly, genes related to DCs, TFh cells, and B cells had >1.5‐fold increased expression in Gr. II mothers compared to mothers in Gr. I (Supporting data sheet 2, gene file) (Fig. 6D). NGS data were reconfirmed by qRT‐PCR analysis, which show decreased expression of TFh‐cell and B‐cell essential genes (B‐cell lymphoma 6 [BCL6], ICOS, CXCR5, and IL‐21) in Gr. I mothers compared to Gr. II mothers (Fig. 6E). Unbiased RNA sequencing results thus validated our flow cytometry expression data. Cell‐specific Kyoto Encyclopedia of Genes and Genomes analysis showed that T mothers had impaired key immune pathways, such as cytokine signaling pathway, Janus kinase–signal transducer and activator of transcription (STAT) signaling, IL‐6 signaling, and intestinal antibodies secretion. Other than these pathways, Gr. I mothers also depicted down‐regulated genes essential for TLR signaling (myeloid differentiation 88 innate immune signal transduction adaptor [MYD88], IRF1, and STAT1) (Supporting Fig. S4A); effector immune responses (tumor necrosis factor (TNF), IL‐18, CD14, TRAF2, macrophage inflammatory protein 1β [MIP‐1β], and long terminal repeat [LTR]) (Supporting Fig. S4B); T‐cell signaling (CD45, CD38, lymphocyte‐specific protein tyrosine kinase [LCK], and ICOS) (Supporting Fig. S4C); B‐cell maturation (CD40, CXCR5, immunoglobulin heavy constant gamma 1 [IGHG1], and joining chain of multimeric immunoglobulin [Ig]A and IgM [IGJ]) (Supporting Fig. S4D); and altered CD4 and CD8 T‐cell functions (Supporting Figs. S5 and S6) compared to Gr. II mothers.
Restoration of HBV‐Specific Responses and Immune Cell Frequencies in Newborns After Vaccination
At 6 months, we analyzed the effect of HBV vaccination in newborns from HBsAg+ mothers and observed that most of the +ve newborns (20 of 22) became HBsAg– with undetectable HBV DNA levels. After the complete course of HBV vaccination (at 6 months), immune phenotyping and functional capacity of DCs, CD4/CD8, TFh cells, and B cells in the +ve newborns were analyzed. Six‐month‐old babies revealed that there was significant improvement in the immune profile and HBV‐specific responses of DCs, CD4/CD8 T cells, TFh cells, and B cells after vaccination. Most of the immune cell‐related key genes (DCs, TFh cells, and B cells) imprinted from their corresponding mothers were down‐regulated at the time of birth (Fig. 7E). However, after complete vaccination, genes belonging to DCs, TFh cells, and B cells (CD1c, integrin subunit beta like 1 [ITGBL1], CXCR5, ICOS, and forkhead box P3 [Foxp3]) were improved. This confirms that the HBV vaccine in the newborns not only neutralized the circulating HBsAg and influenced the antiviral immune responses (Fig. 7A‐E) in 20 HBsAg+ newborns but also improved translational expression of genes. However, 2 babies were still HBsAg+ve with detectable HBV DNA levels (1.10 × 10⁷ and 3.21 × 10⁵) at 6 months. In fact, until 1 year, both babies showed HBsAg positivity (data not shown).
Figure 7.
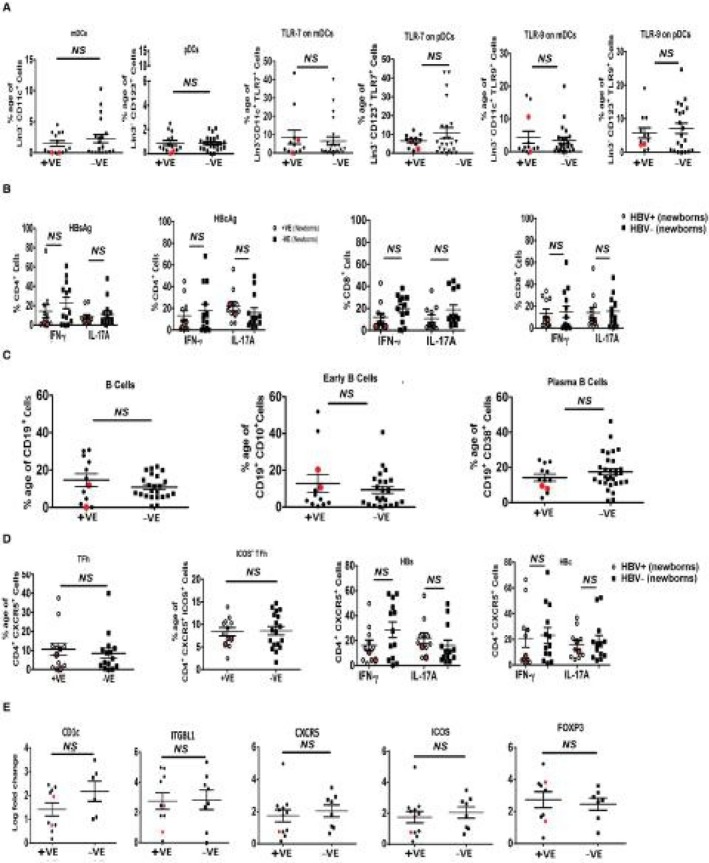
Immune profile and HBV‐specific cell responses in HBV +ve and –ve newborns after HBV vaccination. At 6 months after completing the HBV vaccination course, PBMCs of newborns were subjected to immune profiling. (A) Dot plot showing frequencies of mDCs and pDCs and TLR7 and TLR9 expression on them. (B) Ex vivo‐stimulated PBMCs showing numbers of HBV‐specific CD4+ or CD8+ T cells secreting IFN‐γ and IL‐17A. (C) Cumulative frequencies of total B cells, early B cells, and plasma B cells. (D) Frequencies of TFh cells and ICOS+ TFh cells and HBV‐specific TFh cells secreting IFN‐y and IL‐17A. (E) Differential immune cell‐related gene expression profile of +ve and –ve newborns at birth. Real‐time gene expression of genes (CD1c, ITGBL1, CXCR5, ICOS, and Foxp3) after vaccination. Horizontal bars indicate the mean ± SEM. P < 0.05 is considered significant. Data were obtained from a total of 20 newborns who were seroconverted after HBV vaccination. Status of newborns who remained HBsAg+ at 6 months and did not respond to the vaccine is highlighted with enlarged red dots. Abbreviations: Foxp3, forkhead box P3; ITGBL1, integrin subunit beta like 1.
Discussion
The results of this novel study show that maternal immune responses play a major role in the transmission of HBV to newborns. Decreased TFh‐cell and plasma B‐cell frequencies and low serum IL‐21 levels were found to be associated with the vertical transmission of HBV to newborns. These features are indicative of low protective maternal immunity.
Cellular immune responses have been documented for efficient viral clearance and to influence perinatal transmission, including a role of IL‐10 and IFN‐γ.31 This requires efficient DCs with potent abilities of antigen processing and presentation.28, 29, 30 In Gr. I mothers, we observed that their DCs had reduced mRNA expression levels of genes responsible for antigen processing and presentation.
DCs trigger the IFN‐γ pathway through TLRs and provide a link between innate and adaptive immunity. Our data indicate imprints of down‐regulation of the MYD‐88‐ dependent and independent TLR pathway, high IL‐10‐producing immune tolerant DCs, and lower IL‐12‐secreting effector DCs from HBV+ mothers to babies, suggesting their effect on HBV vertical transmission.
IL‐12‐secreting DCs play a key role in the differentiation of CD4 T and TFh cells,32, 33 and accordingly, IL‐12‐secreting DCs were fewer in number in Gr. I. During HBV infection, the presence of HBV‐specific functional effector T cells and antibody‐producing B cells eventually define HBV infection outcome.
While evaluating T‐cell functionality, we observed that suppressive cytokines producing T cells were abundant and effector cytokines were reduced in Gr. I mothers. Similar immune imprints of DCs and T cells were observed in their newborns. Another subset of T cells, TFh cells, which have a distinct role in the differentiation and maturation of B cells and antibody secretion,11 were found dysfunctional in CHB. Indeed, these cells in T mothers were having a negative correlation with HBV DNA levels and also showed decreased levels of its signature cytokine IL‐21. In addition, TFh cells secreted lower concentrations of IFN‐y and IL‐17A cytokines. In total, TFh cells, which are essential for B‐cell maturation and its functions, were dysfunctional in Gr. I mothers. Humoral B‐cell‐mediated immunity plays an important role in HBV infection outcome; however, few reports have characterized the frequency of a neutralizing antibody producing B cells and their reduced proliferation in chronic HBV infection.34, 35 In addition to deranged T‐cell functionality, we observed that B cells were also compromised in HBV T mothers. It has been documented that both B‐cell maturation and TFh‐cell functionality are regulated by type 1 regulatory T cells in liver.36
To fill several gaps in B‐cell biology in HBV infection, we analyzed the IFN‐y and IL‐2 secreting IRA‐B cells and Breg concentrations and found there was a sharp decline in IFN‐y and IL‐2 secreting IRA‐B cells in T mothers. We believe this adds to the disadvantage in setting up protective immunity. Similar immune imprints of the B‐cell phenotype were observed in the HBsAg+ newborns; these were reversed after HBV vaccination and HBsAg seroconversion.
In addition to our flow data, the gene expression profile revealed a significant decrease in the expression of genes associated with TFh cells (BCL6, CXCR5, ICOS, and IL‐21) and B cells (IL‐4R, CD40, copine 5 [CPNE5], IGHG1, and absent in melanoma 2 [AIM2]) in Gr. I mothers. Our data infer that impaired functionality of DCs and cellular and humoral immune responses in HBV‐infected mothers play major roles in mother‐to‐baby HBV transmission. Studies have shown an increase in HBsAg‐specific cellular and humoral immunity following HBV immunization in infants.37 Similar to earlier observations, 6 months after the HBV vaccination, we also observed an improved immune profile in all the +ve babies except 2. Two HBsAg+ve newborns did not respond to the HBV vaccination and remained HBsAg/HBV DNA +ve showing no anti‐HBs titers, indicating that not all HBV‐infected children are protected. HBV vaccination neutralized the HBsAg in babies at 6 months and improved their immune functionality. The HBV vaccine is documented to have lower efficacy in hyperendemic areas. The recombinant HBV vaccine contains the HBs a‐determinant region, and because the a‐determinant region is prone to mutations, the vaccine may have had no effect on these 2 babies who truly showed 9% HBV vertical transmission. In fact, we found HBsAg positivity in these 2 infants for 1 year and continue to observe these babies for any adverse development of liver disease.
Our data highlight the prominent role of functional DCs and cellular and humoral immune responses in NT mothers and their newborns who were negative. In this study, we took the opportunity to translate the immune cell parameters in predicting HBV transmission from mother to baby. ROC analysis predicted TFh‐cell and B‐cell frequencies with a chance of HBV vertical transmission. We are validating these findings in an ongoing larger cohort.
We conclude that immune cells were more functional and protective and prevented HBV vertical transmission in NT mothers (Fig. 8). Thus, impaired immunity in newborns at the time of birth is the result of a complex interplay between virus and maternal host factors, which impact the risk of transmission. Maternal host factors, like high HBV DNA and HBsAg levels, may also have impacted the immune profile. Because this study showed that maternal immunity with higher levels of HBsAg in circulation may be collectively associated with mother‐to‐child HBV transmission, monitoring and targeting HBsAg and HBV DNA levels may improve maternal immunity and help in transient or nontransient HBV transmission.
Figure 8.
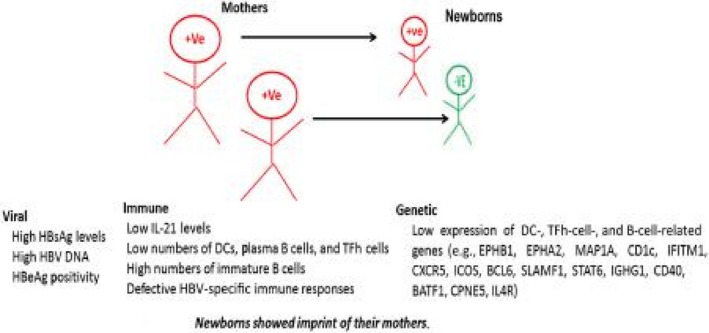
Maternal factors involved in HBV transmission. Viral, immune, and genetic factors of mothers that are mainly associated and involved in HBV transmission. Abbreviations: BATF1, basic leucine zipper ATF‐like transcription factor; CPNE5, copine 5; EPHB1/A2, ephrin type‐B receptor 1/A receptor 2; IFITM1, interferon induced transmembrane protein 1; MAP1A, microtubule associated protein 1A; SLAMF1, signaling lymphocytic activation molecule family member 1.
Supporting information
Acknowledgment
We thank Dr. Guresh Kumar for helping with the statistical analysis of the data.
Supported in part by the Indian Council of Medical Research (grant VIR/78/2013‐ECD‐I to N.T.).
Potential conflict of interest: Nothing to report.
Contributor Information
Shiv Kumar Sarin, Email: sksarin@ilbs.in.
Nirupma Trehanpati, Email: trehanpati@ilbs.in.
References
- 1. Bertoletti A, Ferrari C. Adaptive immunity in HBV infection. J Hepatol 2016;64(Suppl.):S71‐S83. [DOI] [PubMed] [Google Scholar]
- 2. Puri P. Tackling the hepatitis B disease burden in India. J Clin Exp Hepatol 2014;4:312‐319. [DOI] [PMC free article] [PubMed] [Google Scholar]
- 3. Sarin SK, Kumar M, Shrivastava S, Sinha S, Pati NT. Influence of chronic HBV infection on pregnancy: a human model of maternofetal virus host interactions. Gastroenterology 2011;141:1522‐1525. [DOI] [PubMed] [Google Scholar]
- 4. Pande C, Sarin SK, Patra S, Bhutia K, Mishra SK, Pahuja S, et al. Prevalence, risk factors and virological profile of chronic hepatitis B virus infection in pregnant women in India. J Med Virol 2011;83:962‐967. [DOI] [PubMed] [Google Scholar]
- 5. Sarin S, Kumar M, Lau G, Abbas Z, Chan H, Chen C, et al. Asian‐Pacific clinical practice guidelines on the management of hepatitis B: a 2015 update. Hepatol Int 2016;10:1‐98. [DOI] [PMC free article] [PubMed] [Google Scholar]
- 6. Pande C, Kumar A, Patra S, Trivedi SS, Dutta AK, Sarin SK. High maternal hepatitis B virus DNA levels but not HBeAg positivity predicts perinatal transmission of hepatitis B to the newborn. Gastroenterology 2008;134(Suppl. 1):A760. [Google Scholar]
- 7. Wen WH, Huang CW, Chie WC, Yeung CY, Zhao LL, Lin WT, et al. Quantitative maternal hepatitis B surface antigen predicts maternally transmitted hepatitis B virus infection. Hepatology 2016;64:1451‐1461. [DOI] [PubMed] [Google Scholar]
- 8. Racine R, Winslow GM. IgM in microbial infections: taken for granted? Immunol Lett 2009;125:79‐85. [DOI] [PMC free article] [PubMed] [Google Scholar]
- 9. Kim CH, Rott LS, Clark‐Lewis I, Campbell DJ, Wu L, Butcher EC. Subspecialization of CXCR9+ T cells: B helper activity is focused in a germinal center‐localized subset of CXCR9+ T cells. J Exp Med 2001;193:1373‐1381. [DOI] [PMC free article] [PubMed] [Google Scholar]
- 10. Laurent C, Fazilleau N, Brousset P. A novel subset of T‐helper cells: follicular T‐helper cells and their markers. Haematologica 2010;95:356‐358. [DOI] [PMC free article] [PubMed] [Google Scholar]
- 11. Schmitt N, Ueno H. Human T follicular helper cells: development and subsets. Adv Exp Med Biol 2013;785:87‐94. [DOI] [PubMed] [Google Scholar]
- 12. Ballesteros‐Tato A, Randall TD. Priming of T follicular helper cells by dendritic cells. Immunol Cell Biol 2014;92:22‐27. [DOI] [PMC free article] [PubMed] [Google Scholar]
- 13. Zhao PW, Shi X, Li C, Ayana DA, Niu JQ, Feng JY, et al. IL‐33 enhances humoral immunity against chronic HBV infection through activating CD4(+)CXCR13(+) TFH cells. J Interferon Cytokine Res 2015;35:454‐463. [DOI] [PMC free article] [PubMed] [Google Scholar]
- 14. Feng J, Lu L, Hua C, Qin L, Zhao P, Wang J, et al. High frequency of CD4+ CXCR14+ TFH cells in patients with immune‐active chronic hepatitis B. PLoS One 2011;6:e21698. [DOI] [PMC free article] [PubMed] [Google Scholar]
- 15. Vyas AK, David P, Patra S, Sarin SK, Trehanpati N. T follicular helper cells of the mother prevent vertical transmission of hepatitis B to their babies. J Hepatol 2016;64(Suppl.):S507. [Google Scholar]
- 16. Vyas AK, Sharma BC, Sarin SK, Trehanpati N. Immune correlates of hepatitis B surface antigen spontaneous seroconversion in hepatitis B e antigen negative chronic hepatitis B patients. Liver Int 2018;38:38‐49. [DOI] [PubMed] [Google Scholar]
- 17. Gupta E, Kumar A, Choudhary A, Kumar M, Sarin SK. Serum hepatitis B surface antigen levels correlate with high serum HBV DNA levels in patients with chronic hepatitis B: a cross‐sectional study. Indian J Med Microbiol 2012;30:150‐154. [DOI] [PubMed] [Google Scholar]
- 18. Boni C, Fisicaro P, Valdatta C, Amadei B, Di Vincenzo P, Giuberti T, et al. Characterization of hepatitis B virus (HBV)‐specific T‐cell dysfunction in chronic HBV infection. J Virol 2007;81:4215‐4225. [DOI] [PMC free article] [PubMed] [Google Scholar]
- 19. Ma Z, Zhang E, Yang D, Lu M. Contribution of Toll‐like receptors to the control of hepatitis B virus infection by initiating antiviral innate responses and promoting specific adaptive immune responses. Cell Mol Immunol 2015;12:273‐282. [DOI] [PMC free article] [PubMed] [Google Scholar]
- 20. Li R‐B, Chen H‐S, Xie Y, Fei R, Cong X, Jiang D, et al. Dendritic cells from chronic hepatitis B patients can induce HBV antigen‐specific T cell responses. World J Gastroenterol 2004;10:1578‐1582. [DOI] [PMC free article] [PubMed] [Google Scholar]
- 21. Jan RH, Lin YL, Chen CJ, Lin TY, Hsu YC, Chen LK, et al. Hepatitis B virus surface antigen can activate human monocyte‐derived dendritic cells by nuclear factor kappa B and p38 mitogen‐activated protein kinase mediated signaling. Microbiol Immunol 2012;56:719‐727. [DOI] [PubMed] [Google Scholar]
- 22. Akbar SM, Yoshida O, Chen S, Cesar AJ, Abe M, Matsuura B, et al. Immune modulator and antiviral potential of dendritic cells pulsed with both hepatitis B surface antigen and core antigen for treating chronic HBV infection. Antivir Ther 2010;15:887‐895. [DOI] [PubMed] [Google Scholar]
- 23. van der Molen RG, Sprengers D, Binda RS, de Jong EC, Niesters HG, Kusters JG, et al. Functional impairment of myeloid and plasmacytoid dendritic cells of patients with chronic hepatitis B. Hepatology 2004;40:738‐746. [DOI] [PubMed] [Google Scholar]
- 24. Ye B, Liu X, Li X, Kong H, Tian L, Chen Y. T‐cell exhaustion in chronic hepatitis B infection: current knowledge and clinical significance. Cell Death Dis 2015;6:e1694. [DOI] [PMC free article] [PubMed] [Google Scholar]
- 25. Waffarn EE, Baumgarth N. Protective B cell responses to flu—no fluke! J Immunol 2011;186:3823‐3829. [DOI] [PMC free article] [PubMed] [Google Scholar]
- 26. Dörner T, Radbruch A. Antibodies and B cell memory in viral immunity. Immunity 2007;27:384‐392. [DOI] [PubMed] [Google Scholar]
- 27. Nutt SL, Hodgkin PD, Tarlinton DM, Corcoran LM. The generation of antibody‐secreting plasma cells. Nat Rev Immunol 2015;15:160‐171. [DOI] [PubMed] [Google Scholar]
- 28. Rauch PJ, Chudnovskiy A, Robbins CS, Weber GF, Etzrodt M, Hilgendorf I, et al. Innate response activator B cells protect against microbial sepsis. Science 2012;335:597‐601. [DOI] [PMC free article] [PubMed] [Google Scholar]
- 29. Chaussabel D, Quinn C, Shen J, Patel P, Glaser C, Baldwin N, et al. A modular analysis framework for blood genomics studies: application to systemic lupus erythematosus. Immunity 2008;29:150‐164. [DOI] [PMC free article] [PubMed] [Google Scholar]
- 30. Vanwolleghem T, Hou J, van Oord G, Andeweg AC, Osterhaus A, Pas SD, et al. Re‐evaluation of hepatitis B virus clinical phases by systems biology identifies unappreciated roles for the innate immune response and B cells. Hepatology 2015;62:87‐100. [DOI] [PubMed] [Google Scholar]
- 31. Kuhn L, Coutsoudis A, Moodley D, Mngqundaniso N, Trabattoni D, Shearer GM, et al. Interferon‐gamma and interleukin‐10 production among HIV‐1–infected and uninfected infants of HIV‐1‐infected mothers. Pediatr Res 2001;50:412‐416. [DOI] [PubMed] [Google Scholar]
- 32. Schmitt N, Morita R, Bourdery L, Bentebibel SE, Zurawski SM, Banchereau J, et al. Human dendritic cells induce the differentiation of interleukin‐21‐producing T follicular helper‐like cells through interleukin‐12. Immunity 2009;31:158‐169. [DOI] [PMC free article] [PubMed] [Google Scholar]
- 33. Yang JA, Tubo NJ, Gearhart MD, Bardwell VJ, Jenkins MK. Cutting edge: Bcl6‐interacting corepressor contributes to germinal center T follicular helper cell formation and B cell helper function. J Immunol 2015;194:5604‐5608. [DOI] [PMC free article] [PubMed] [Google Scholar]
- 34. Oliviero B, Cerino A, Varchetta S, Paudice E, Pai S, Ludovisi S, et al. Enhanced B‐cell differentiation and reduced proliferative capacity in chronic hepatitis C and chronic hepatitis B virus infections. J Hepatol 2011;55:53‐60. [DOI] [PubMed] [Google Scholar]
- 35. Xu X, Shang Q, Chen X, Nie W, Zou Z, Huang A, et al. Reversal of B‐cell hyperactivation and functional impairment is associated with HBsAg seroconversion in chronic hepatitis B patients. Cell Mol Immunol 2015;12:309‐316. [DOI] [PMC free article] [PubMed] [Google Scholar]
- 36. Xu L, Yin W, Sun R, Wei H, Tian Z. Liver type I regulatory T cells suppress germinal center formation in HBV‐tolerant mice. Proc Natl Acad Sci U S A 2013;110:16993‐16998. [DOI] [PMC free article] [PubMed] [Google Scholar]
- 37. Woo PC, Tsoi H‐W, Wong L‐P, Leung HC, Yuen K‐Y. Antibiotics modulate vaccine‐induced humoral immune response. Clin Diagn Lab Immunol 1999;6:832‐837. [DOI] [PMC free article] [PubMed] [Google Scholar]
Associated Data
This section collects any data citations, data availability statements, or supplementary materials included in this article.
Supplementary Materials


