Abstract
T cells expressing chimeric antigen receptors (CAR) targeting human CD19 (huCD19) have exhibited impressive clinical efficacy against B cell malignancies1,2. CAR-T cells have been less effective against solid tumors3–5, in part because they enter a hyporesponsive (“exhausted” or “dysfunctional”) state6–9 triggered by chronic antigen stimulation and characterized by upregulation of inhibitory receptors and loss of effector function. To investigate the function of CAR-T cells in solid tumors, we transferred huCD19-reactive CAR-T cells into huCD19+ tumor-bearing mice. CD8+ CAR+ tumor-infiltrating lymphocytes (TILs) and endogenous TILs expressing inhibitory receptors PD-1 and TIM3 exhibited similar profiles of gene expression and chromatin accessibility, associated with secondary activation of nuclear receptor transcription factors (TFs) Nr4a1 (Nur77), Nr4a2 (Nurr1) and Nr4a3 (Nor1) by the initiating TF NFAT (nuclear factor of activated T cells)10–12. CD8+ T cells from humans with cancer or chronic viral infections13,14,15 expressed high levels of Nr4a TFs and displayed enrichment of Nr4a binding motifs in accessible chromatin regions. CAR-T cells lacking all three Nr4a TFs (Nr4aTKO) promoted tumor regression and prolonged the survival of tumor-bearing mice. Nr4aTKO CAR-TILs displayed phenotypes and gene expression profiles characteristic of CD8+ effector T cells, and chromatin regions uniquely accessible in Nr4aTKO CAR-TILs compared to WT were enriched for binding motifs for NFκB and AP-1, TFs involved in T cell activation. Our data identify Nr4a TFs as major players in the cell-intrinsic program of T cell hyporesponsiveness and point to Nr4a inhibition as a promising strategy for cancer immunotherapy.
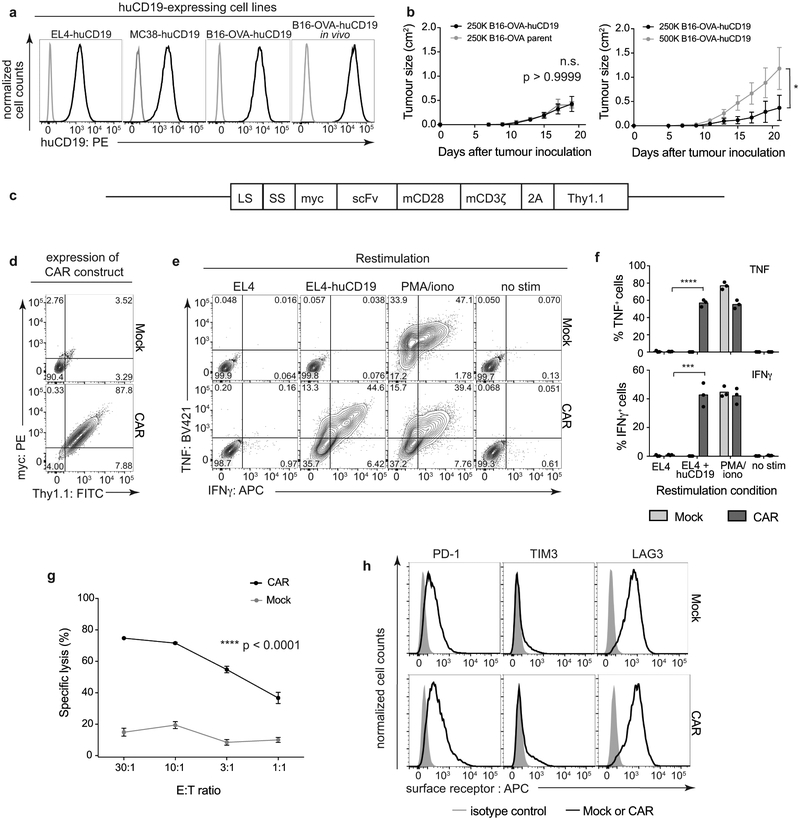
Mouse B16-OVA melanoma, EL4 thymoma, and MC38 colon adenocarcinoma cell lines were engineered to express huCD19 (Extended Data Fig. 1a); the B16-OVA-huCD19 cells stably maintained huCD19 expression after growth in syngeneic C57BL/6J mice for 18 days and subsequent culture for 7 days ex vivo (Extended Data Fig. 1a, right). B16-OVA and B16-OVA-huCD19 cells grew at the same rate in vivo, indicating that the huCD19 antigen did not cause tumor rejection (Extended Data Fig. 1b, left). Based on tumor growth rate, we inoculated mice with 500,000 B16-OVA-huCD19 tumor cells (Extended Data Fig. 1b, right). Mouse CD8+ T cells retrovirally transduced with a second-generation CAR against huCD19 [ref. 16,17] exhibited a transduction efficiency of 95.5 ± 4.0% (Extended Data Fig. 1c–d), produced TNF and IFNγ upon restimulation with EL4-huCD19 cells, and exhibited dose-dependent lysis of B16-OVA-huCD19 cells (Extended Data Fig. 1e–g). CAR-T cells did not express higher surface levels of PD-1, TIM3, or LAG3 than mock-transduced cells under resting conditions (Extended Data Fig. 1h).
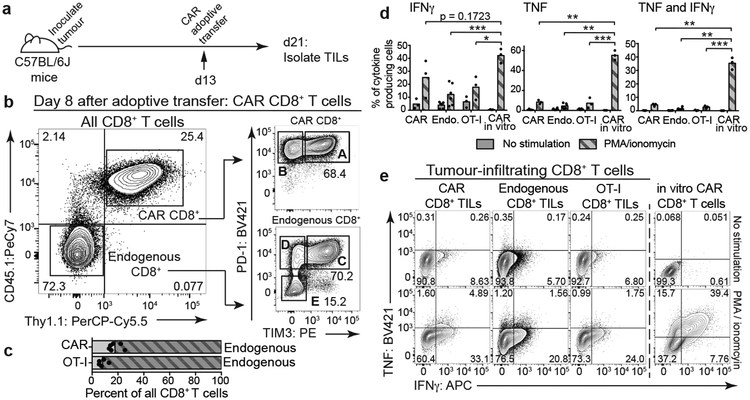
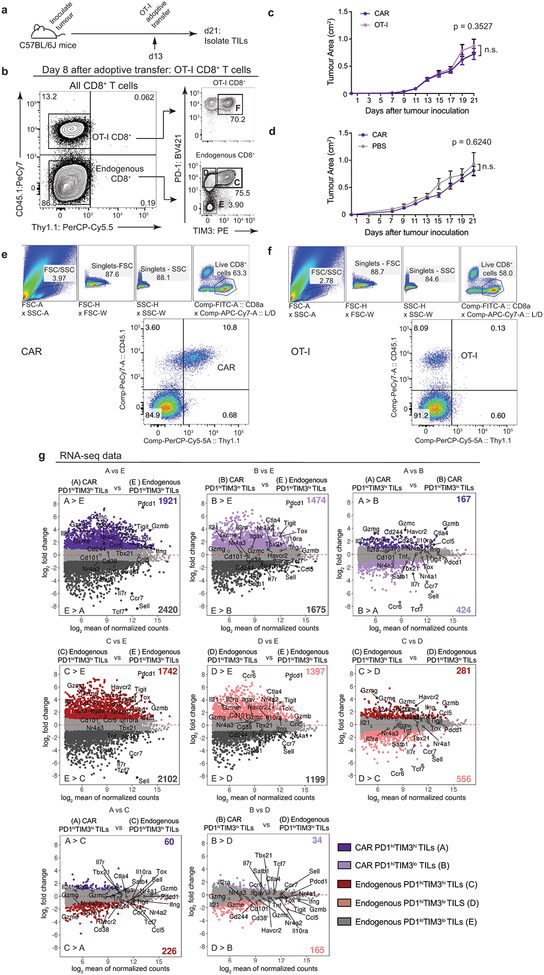
C57BL/6J mice bearing B16-OVA-huCD19 tumors and adoptively transferred with CD8+CD45.1+Thy1.1+ CAR-T cells (Fig. 1a–b) or CD8+CD45.1+ OT-I cells (specific for chicken ovalbumin (OVA) SIINFEKL peptide presented by H-2Kb, Extended Data Fig. 2a–b) showed similar tumor growth rates (Extended Data Fig. 2c); low numbers of CAR-T cells were transferred to minimize tumor rejection (Extended Data Fig. 2d). Eight days after adoptive transfer, CAR and OT-I TILs (Fig. 1b, Extended Data Fig. 2b, 2e–f) comprised ~18% and ~9% respectively of CD8+ TILs (Fig. 1c), and exhibited similar proportions of PD-1highTIM3high cells compared to endogenous TILs (Fig. 1b, Extended Data Fig. 2b). All TILs produced low levels of TNF and IFNγ upon restimulation with PMA/ionomycin (Fig. 1d–e), confirming their decreased function.
Figure 1 |. CAR, OT-I, and endogenous CD8+ TILs isolated from B16-OVA-huCD19 tumors exhibit similar phenotypes.
(a) Experimental design to assess CAR and endogenous TILs; 1.5×10⁶ CAR-T cells were adoptively transferred into C57BL/6J mice 13 days after tumor inoculation. (b) Left, representative flow cytometry plot identifying CD45.2+ endogenous TILs and CD45.1+Thy1.1+ CAR-TILs (Thy1.1 encoded in the CAR retroviral vector). Right, flow cytometry plots showing PD-1 and TIM3 surface expression on CD8+ CAR and endogenous TILs. (c) Bar graph showing the percentage of CAR and OT-I TILs in total CD8+ TILs. Bars show mean values with data points for 6, 5 and 11 independent experiments for CAR, OT-I and endogenous TILs respectively. (d) Quantification of cytokine production after restimulation of CAR, OT-I and endogenous CD8+ TILs, compared to cultured CD8+ CAR-T cells stimulated with PMA/ionomycin or left unstimulated. Bars show mean values with data points for 3 independent experiments. All p-values were calculated using two-tailed unpaired t-tests with Welch’s correction, *p≤0.05, **p≤0.01, ***p≤0.001, ****p≤0.0001. (e) Representative flow cytometry plots of cytokine production after restimulation.
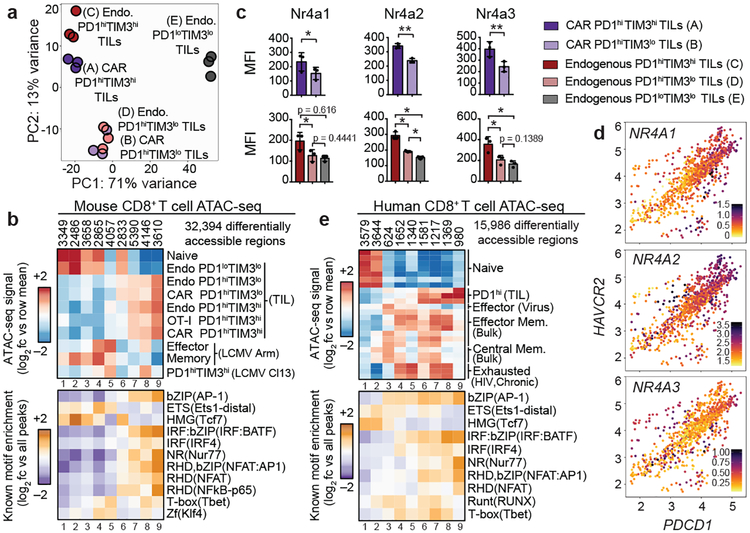
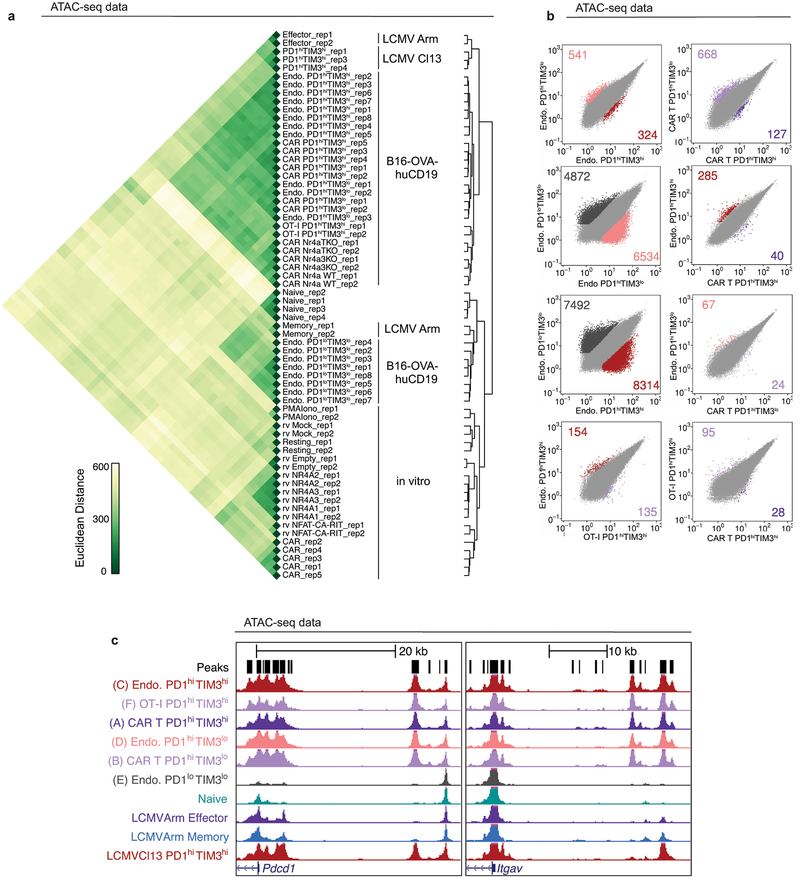
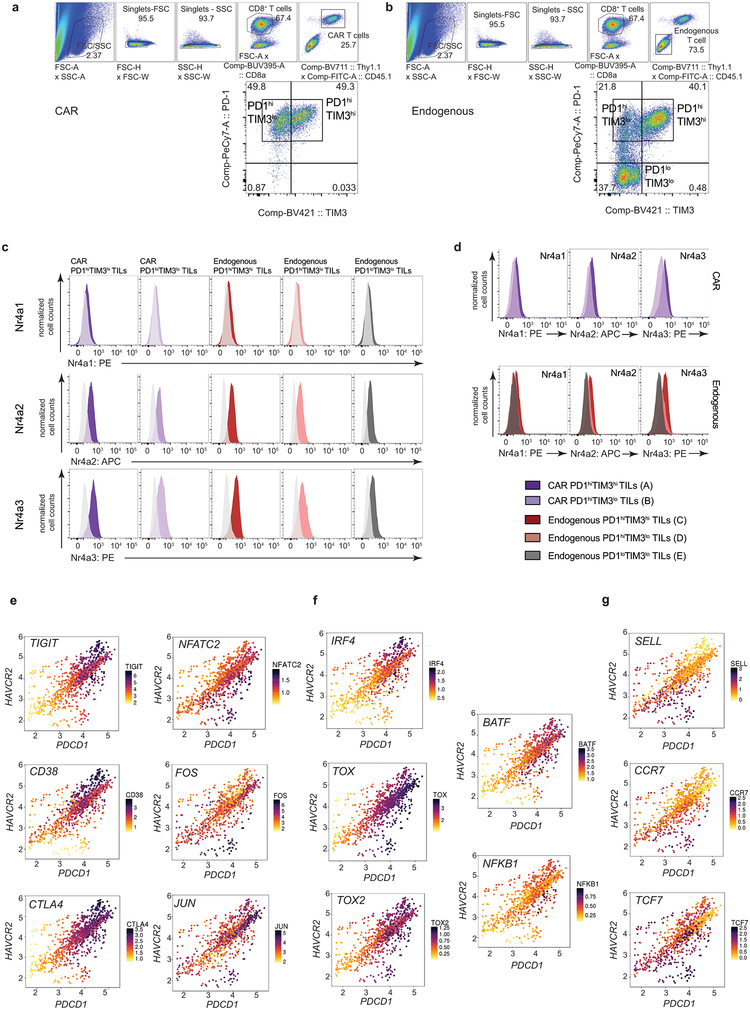
The transcriptional profiles of “highly exhausted” PD-1highTIM3high CAR-TILs (population A, Fig. 1b) were similar to those of endogenous PD-1highTIM3high TILs (population C, Fig. 1b), but distinct from those of CAR and endogenous “antigen-specific memory precursor” PD-1highTIM3low TILs18 (populations B, D) and naïve-like endogenous PD-1lowTIM3low TILs (population E) (Fig. 2a, Extended Data Fig. 2g, Table S1). The chromatin accessibility profiles of endogenous, OT-I and CAR PD-1highTIM3high and PD-1highTIM3low TIL subsets (A-D, F) were similar to one another, but distinct from those of PD-1lowTIM3low endogenous TILs (E), which resembled naïve CD8+ T cells (Fig. 2b, Extended Data Fig. 3). PD-1highTIM3low TILs (B, D) resembled memory-precursor CD8+ T cells7,11,12, with accessible regions showing substantial enrichment for consensus TCF1 motifs (Fig. 2b, cluster 6). Regions selectively accessible in PD-1high populations (A-D, F) were enriched for consensus Nr4a as well as NFAT, NFκB, bZIP and IRF:bZIP motifs (Fig. 2b, clusters 8, 9). Nr4a protein expression was higher in PD-1highTIM3high than in PD-1highTIM3low TILs (Fig. 2c, Extended Data Fig. 4a–d).
Figure 2 |. CAR and endogenous CD8+ TILs exhibit similar gene expression and chromatin accessibility profiles.
(a) Principal component analysis of RNA-seq data from PD-1hiTIM3hi (A) and PD-1hiTIM3lo (B) CAR-TILs, and endogenous PD-1hiTIM3hi (C), PD-1hiTIM3lo (D), PD-1loTIM3lo (E) TILs. Data represent 3 independent experiments, each using TILs pooled from 9–14 mice. (b) Top, heatmap of mouse CD8+ T cell ATAC-seq data showing log2 fold change from row mean for 9 k-means clusters. Bottom, heatmap of motif enrichment analysis. Data shown for one representative member of TF families enriched in at least one cluster compared to all accessible regions. (c) Quantification of Nr4a expression (MFI); p-values for CAR comparisons (top) were calculated using two-tailed paired t-tests; p-values for endogenous comparisons (bottom) were calculated using row-matching one-way ANOVA with Greenhouse-Geisser correction and Tukey’s multiple comparisons tests; for both calculations, *p≤0.05, **p≤0.01, ***p≤0.001, ****p≤0.0001. Data show mean and individual values from three independent experiments, each using TILs pooled from 9–14 mice. (d) Scatterplots of RNA-seq data showing expression of PDCD1 (x-axis) and HAVCR2 (y-axis) in single cells of human CD8+ TILs14, with expression of the indicated NR4A genes shown in the color scale. Each dot represents a single cell. (e) Top, human CD8+ T cell ATAC-seq data from PD-1hi TILs (two samples from melanoma, one sample from non-small cell lung tumor [ref. 13]) and antigen-specific CD8+ T cells from HIV-infected individuals15 showing log2 fold change from row mean for 9 k-means clusters. Bottom, heatmap of motif enrichment analysis.
Single-cell RNA-seq data from human CD8+ TILs provided further justification for studies of Nr4a. In CD8+ TILs infiltrating a human melanoma14, NR4A1 and NR4A2 expression showed a strong positive correlation with PDCD1 (PD-1) and HAVCR2 (TIM3) expression, and NR4A3 showed a moderate positive correlation (Fig. 2d). PDCD1 and HAVCR2 expression correlated positively with TIGIT, CD38, CTLA4, JUN, TOX, TOX2 and IRF4 and negatively with TCF7 (Extended Data Fig. 4e–g; Table S2). Additionally, Nr4a (nuclear receptor), NFAT, bZIP and IRF:bZIP motifs were enriched in regions uniquely accessible in CD8+ PD-1high TILs from human melanoma and non-small cell lung cancer13, and in HIV antigen-specific CD8+ T cells from infected humans15 (Fig. 2e, cluster 9). The upregulation of Nr4a members and enrichment of Nr4a binding motifs in differentially accessible regions of chronically-stimulated human and mouse CD8+ PD-1high T cells11,12,15,19 led us to focus on Nr4a family members as potential transcriptional effectors of CD8+ T cell exhaustion.
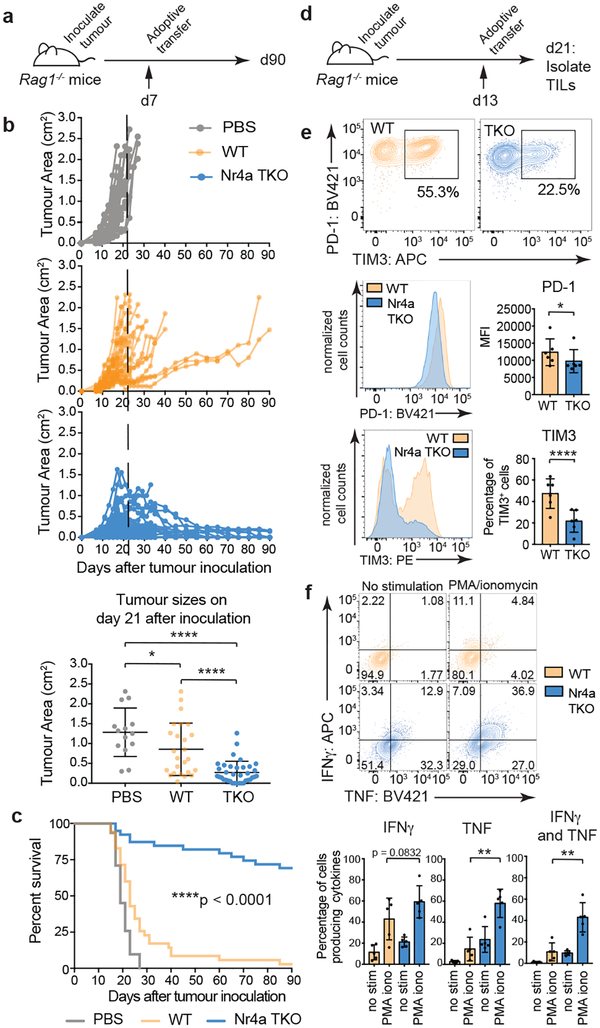
All three Nr4a proteins are essential for regulatory T cell development20, indicating redundant function. We compared Nr4a-sufficient (WT) CAR-TILs with Nr4a triple knockout (Nr4aTKO) CAR-TILs (Fig. 3a), using Rag1-deficient recipient mice to avoid potential rejection. Nr4aTKO and control WT CAR-T cells were obtained by transducing naïve CD8+ T cells from Nr4a1fl/flNr4a2fl/flNr4a3−/− mice with both CAR and Cre retroviruses, and naïve CD8+ T cells from Nr4a1fl/flNr4a2fl/flNr4a3+/+ mice with CAR and empty retroviruses respectively (Extended Data Fig. 5a–c). Compared to control tumor-bearing mice adoptively transferred with WT CD8+ CAR-T cells, tumor-bearing mice adoptively transferred with Nr4aTKO CD8+ CAR-T cells showed pronounced tumor regression and enhanced survival (Fig. 3a–c). Tumor size differences were apparent as early as day 21 after tumor inoculation (Fig. 3b, bottom), and Nr4aTKO CAR-T cells promoted tumor rejection and prolonged survival even in immunocompetent recipient mice (Extended Data Fig. 5d–g). Thus, Nr4a TFs suppress tumor rejection in the CAR-T cell model.
Figure 3 |. Nr4a-deficient CAR-TILs promote tumor regression and prolong survival.
(a) Experimental design; 3×10⁶ WT or Nr4aTKO CAR-T cells were adoptively transferred into Rag1−/− mice 7 days after tumor inoculation. PBS was injected as a control. (b) Top, tumor growth in individual mice. Bottom, tumor sizes of individual mice at day 21 (mean ± s.d.); p-values calculated using an ordinary one-way ANOVA with Tukey’s multiple comparisons test. (c) Survival curves; ****p<0.0001 calculated using log-rank (Mantel-Cox) test. Surviving mouse numbers at d7, d21 and d90 were n=21, 14, 0 (PBS); n=35, 25, 1 (WT); n=39, 36, 27 (Nr4aTKO). (d) Experimental design; 1.5×10⁶ WT or Nr4aTKO CAR-T cells were adoptively transferred into Rag1−/− mice 13 days after tumor inoculation, and analyzed 8 days later. (e) Surface PD-1 and TIM3 expression on CAR+ NGFR+ cells with a set level of CAR expression (103 – 104). Representative flow cytometry plots (top), histograms (middle and bottom, left) and means and individual values (right) of 6 independent experiments, each using TILs pooled from 3–8 mice. p-values were calculated using two-tailed paired t-tests with Welch’s correction. (f) Top, representative flow cytometry plots for TNF and IFNγ production. Bottom, quantification of 5 independent experiments, each using TILs pooled from 3–8 mice. IL-2 was not detectable above background (not shown). p-values were calculated using two-tailed paired t-tests between unstimulated and stimulated WT and Nr4aTKO CAR-TILs. For all p-value calculations, *p≤0.05, **p≤0.01, ***p≤0.001, ****p≤0.0001.
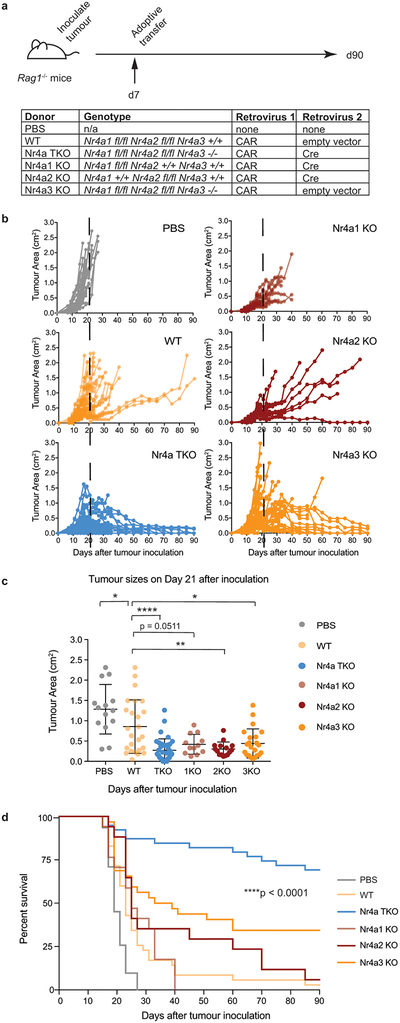
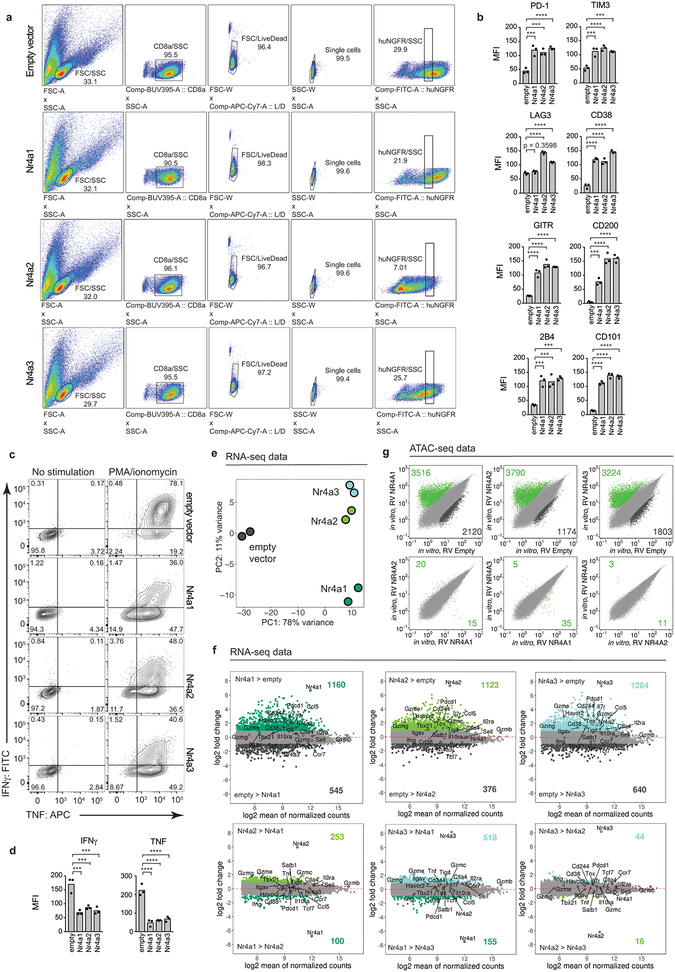
To assess Nr4a redundancy, we evaluated the anti-tumor effects of CD8+ CAR-T cells lacking individual Nr4a proteins (Extended Data Fig. 6a). Nr4aTKO CAR-T cells exhibited greater anti-tumor activity than CAR-T cells from mice lacking Nr4a1, Nr4a2 or Nr4a3 (Extended Data Fig. 6b–d). Moreover, retroviral expression of any Nr4a TF in CD8+ T cells (Extended Data Fig. 7a) resulted in increased expression of inhibitory surface receptors and decreased cytokine production upon restimulation (Extended Data Fig. 7b–d). In principal component analyses (PCA) of RNA-seq data, the majority of the variance (78%) was between cells expressing any Nr4a TF versus cells expressing the empty vector control (Extended Data Fig. 7e, Table S3). In both RNA-seq and ATAC-seq, pairwise comparisons showed few if any differences between Nr4a family members (Extended Data Fig. 7f–g). Thus the three Nr4a proteins induce similar changes in transcriptional and chromatin accessibility profiles in CD8+ T cells.
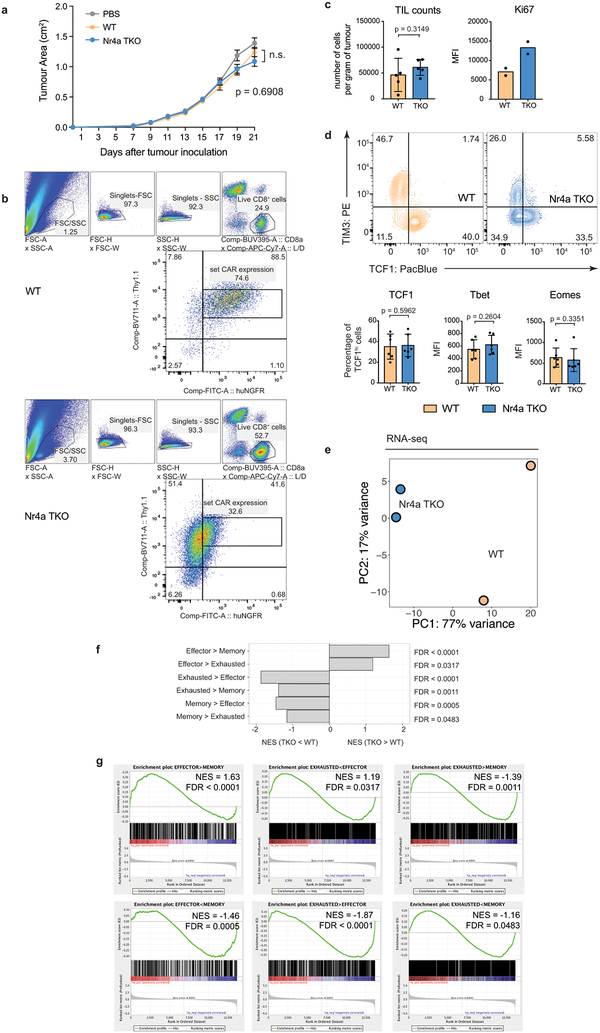
To assess phenotypic and genome-wide changes associated with anti-tumor function, we modified experimental conditions to delay tumor regression (Fig. 3d). Tumor sizes and TIL recoveries were similar between Nr4aTKO and WT (Extended Data Fig. 8a–c). Eight days after adoptive transfer, Nr4aTKO TILs showed a mild but statistically significant decrease in PD-1 expression compared to WT TILs, and the total Nr4aTKO PD-1high population was strikingly skewed towards low TIM3 expression (Fig. 3e); moreover, the percentage of cells expressing TNF or both IFNγ and TNF after restimulation was significantly higher in Nr4aTKO compared to WT TILs (Fig. 3f). TIM3low Nr4aTKO CAR-TILs were noticeably skewed towards low TCF1 expression (Extended Data Fig. 8d, top); the TIM3lowTCF1low population, which is different from the TIM3lowTCF1high memory precursor population that expands after PD-1 blockade18,21–23, may be responsible for increased effector function. There was no significant difference in the mean fluorescence intensities (MFI) of TCF1, Tbet, or Eomes (Extended Data Fig. 8d, bottom).
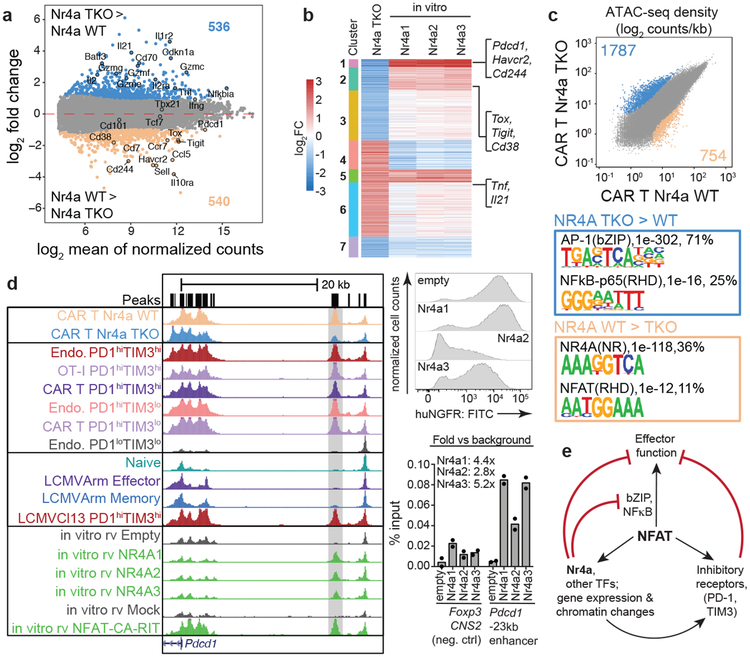
Nr4aTKO TILs showed increased expression of genes related to effector function: mRNAs encoding effector proteins (IL-2Rα, TNF, granzymes) were upregulated; genes expressed in naïve/memory T cells compared to effector populations (e.g. Sell, Ccr7) were downregulated; and inhibitory surface receptors typically upregulated in hyporesponsive T cells (Pdcd1, Havcr2, Cd244, Tigit, Cd38) were downregulated in Nr4aTKO compared to WT TILs (Fig. 4a, Extended Data Fig. 8e–g, Table S4). Gene set enrichment analysis24 (GSEA) comparing RNA-seq data from Nr4aTKO versus WT TILs against gene sets from effector, memory and exhausted populations from LCMV-infected mice11 supported these conclusions.
Figure 4 |. Gene expression and chromatin accessibility profiles indicate increased effector function of Nr4aTKO compared to WT CAR-TILs.
(a) Mean average plots of genes differentially expressed in Nr4aTKO versus WT CAR-TILs; p-values calculated using Wald test (as implemented in DESeq2), and adjusted using the Benjamini-Hochberg method. Differentially expressed genes (adjusted p-value <0.1, log2FoldChange ≥1 or ≤−1) are highlighted; selected genes are labeled. (b) Heatmap of genes with opposing expression changes between Nr4a deletion and Nr4a overexpression. Fold change values (log2scale) of genes differentially expressed in Nr4aTKO relative to WT CAR-TILs were compared to corresponding values in cells ectopically expressing Nr4a1, Nr4a2, or Nr4a3, and 7 k-means clusters were identified. Genes downregulated after Nr4a deletion/ upregulated after Nr4a overexpression (e.g. Pdcd1, Havcr2, Tox), or upregulated after Nr4a deletion/ downregulated after Nr4a overexpression (e.g. Tnf, Il21) are indicated. (c) Scatterplot of pairwise comparison of ATAC-seq density (Tn5 insertions per kb) between Nr4aTKO and WT CAR-TILs, showing differentially accessible regions and associated de novo identified motifs. (d) Left, genome browser view of the Pdcd1 locus in all previously-mentioned ATAC-seq samples and CA-RIT-NFAT1-transduced cells. Gray bar, exhaustion-specific enhancer ~23 kb 5’ of the Pdcd1 TSS. Top right, histogram of Nr4a expression in cells expressing HA-tagged Nr4a1, Nr4a2, or Nr4a3 (representative of two biological replicates). Bottom right, ChIP-qPCR showing enrichment of HA-tagged Nr4a over background at the Pdcd1 enhancer (technical replicates from one of two independent experiments). (e) Proposed role of Nr4a in T cells chronically stimulated with antigen.
To identify transcriptional targets of individual Nr4a proteins, we clustered genes differentially expressed in Nr4aTKO compared to WT TILs (Fig. 4a, Table S4), by changes in gene expression when Nr4a was ectopically expressed (Fig. 4b, Table S3). Clusters 1 and 2 contain genes downregulated in the absence of Nr4a and upregulated in Nr4a-expressing cells (Pdcd1, Havcr2, Cd244 in cluster 1, Tox, Tigit, Cd38 in cluster 2). Cluster 4 contains genes upregulated in Nr4aTKO TILs and downregulated in Nr4a-expressing cells (Tnf, Il21). Previous publications have identified Runx3 as a downstream target of Nr4a1 in CD8+ T cell development25 and as a gene whose overexpression contributes to tumor regression26, but Runx3 was not differentially expressed in Nr4aTKO compared to WT TILs.
As expected, a substantial fraction of regions (~36%) with lower accessibility in Nr4aTKO TILs contained Nr4a binding motifs; a smaller subset contained NFAT binding sites without an adjacent AP-1 site, suggesting that Nr4a maintains the accessibility of “exhaustion-related” regions10 that bind NFAT without AP-1 (Fig. 4c). Regions more accessible in Nr4aTKO compared to WT TILs were enriched for consensus bZIP (~71%) and Rel/ NFκB (~25%) binding motifs, confirming the established role of bZIP (Fos, Jun, ATF, CREB, etc) and Rel/ NFκB family members in T cell activation and effector function, and consistent with negative crosstalk between Nr4a and NFκB27,28. Overall, Nr4aTKO TILs display potent effector function: decreased inhibitory receptor expression, increased cytokine production, and strong enrichment in accessible chromatin for binding motifs of TFs involved in effector function.
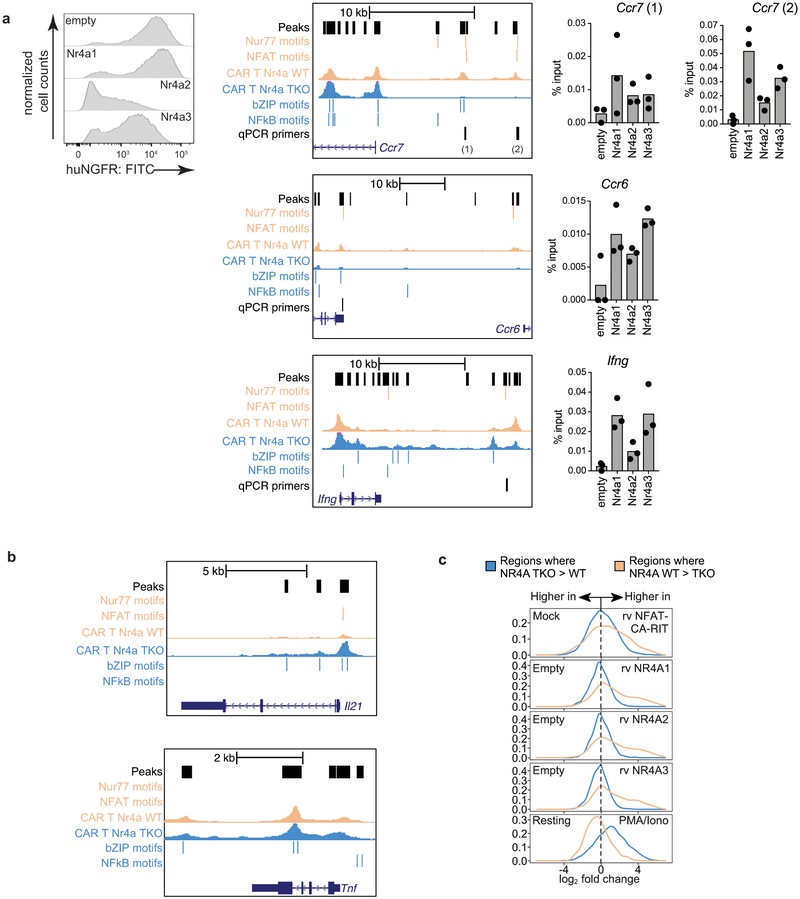
We confirmed the binding of HA-tagged Nr4a proteins to selected differentially accessible regions in CD8+ T cells by ChIP-qPCR. Ccr7, a gene whose expression is high in naïve and memory T cells and decreased in effector cells29, is less expressed in effector-like Nr4aTKO compared to WT TILs (Fig. 4a); the Ccr7 distal 5’ region contains two ATAC-seq peaks that are less prominent in Nr4aTKO than in WT TILs and contain adjacent NFAT and Nr4a binding motifs (Extended Data Fig. 9a, middle panel, peach lines). These regions bind Nr4a (Extended Data Fig. 9a, right, bar plots). In contrast, two ATAC-seq peaks in the Ccr7 proximal promoter and first intron are more prominent in Nr4aTKO compared to WT TILs and contain bZIP and NFκB motifs (Extended Data Fig. 9a, middle panel, blue lines; and additional examples Ifng, Ccr6). TNF and IL-21, cytokines involved in effector function30, are more highly expressed in Nr4aTKO compared to WT TILs (Fig. 4a); two bZIP motif-containing regions of the Il21 promoter gain accessibility, and the Tnf locus shows broadly increased accessibility across the promoter and the entire gene in Nr4aTKO compared to WT TILs (Extended Data Fig. 9b).
We previously used an engineered NFAT protein, CA-RIT-NFAT1, to mimic a dephosphorylated nuclear NFAT that cannot form cooperative transcriptional complexes with AP-1 (Fos-Jun)10. CA-RIT-NFAT1-transduced cells display a transcriptional program that mimics the early stages of in vivo exhaustion/dysfunction; they also express higher levels of Nr4a TFs than mock-transduced cells10–12. Regions more accessible in WT versus Nr4aTKO TILs were also more accessible in CA-RIT-NFAT1-expressing versus mock-transduced cells (Extended Data Fig. 9c, top) and Nr4a1/2/3-transduced versus empty vector-transduced cells (middle three panels). Conversely, regions more accessible in Nr4aTKO versus WT TILs were more accessible in PMA/ionomycin-stimulated compared to resting cells (Extended Data Fig. 9c, bottom). PMA/ionomycin stimulates bZIP and NFκB TFs, indicating that the in vivo effector function of Nr4aTKO compared to WT TILs is associated with increased activity of these TFs.
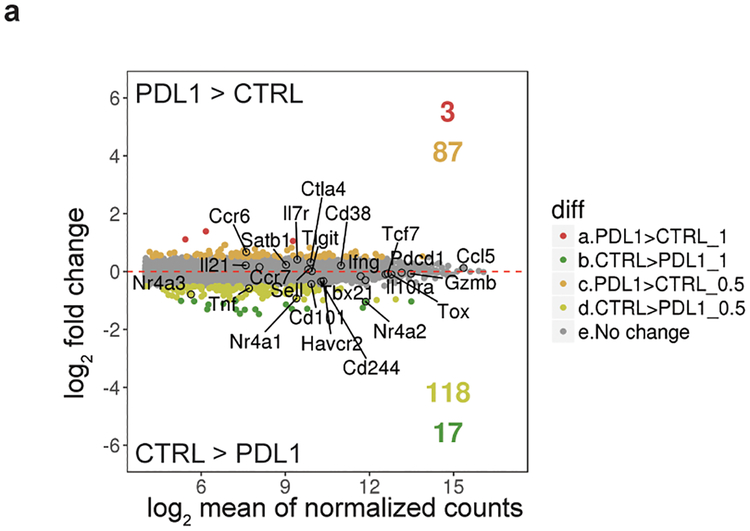
Each Nr4a protein binds to and is partly responsible for increased accessibility of an enhancer located at ~23 kb 5’ of the Pdcd1 transcription start site (TSS) (Fig. 4d), noted in all mouse models of exhaustion/dysfunction investigated so far11–13,15,19. The ATAC-seq peak marking this enhancer is diminished in Nr4aTKO compared to WT CAR-T cells, and increased in T cells ectopically expressing Nr4a1, Nr4a2 or Nr4a3 compared to cells transduced with empty vector alone (Fig. 4d). Deletion of this enhancer results in a decrease in the MFI of PD-1 staining in the EL-4 thymoma cell line15. PD-1 blockade19 caused a significant (2-fold) decrease in levels of Nr4a2 mRNA, with a smaller decrease in Nr4a1 and Nr4a3 mRNAs (Extended Data Fig. 10a). Taken together, these data indicate together with NFAT, the three Nr4a TFs are prominent, redundant effectors of the CD8+ T cell hyporesponsive program downstream of NFAT (Fig. 4e). Moreover, because Nr4a deficiency results in downregulation of the inhibitory receptors PD-1 and TIM3, the effect of Nr4a deficiency is functionally similar to that of PD-1 blockade19, but Nr4a deletion affects a wider range of regulatory elements than PD-1 blockade alone (Fig. 4e).
While immune cell therapies offer considerable promise for the treatment of cancer, treatment with individual blocking antibodies against targets such as PD-1 and CTLA4 rarely achieve complete cures. We have shown that the NFAT/ Nr4a axis controls the expression of multiple inhibitory receptors, and that treatment of tumor-bearing mice with CAR-T cells lacking all three Nr4a TFs resulted in tumor regression and prolonged survival. Inhibiting the function of Nr4a family members in tumor-infiltrating T cells could be a promising strategy in cancer immunotherapy, since it would be expected to mimic combination therapies with blocking antibodies against multiple inhibitory receptors31.
Materials and Methods
Construction of retroviral vector (MSCV-myc-CAR-2A-Thy1.1) containing chimeric antigen receptor (CAR).
The chimeric antigen receptor was pieced together using published portions of the clone FMC63 human CD19 single chain variable fragment16,17, and the published portions of the murine CD28 and CD3ζ sequences32. The sequence for the myc tag on the N-terminus was obtained from published work33. This chimeric antigen construct was then cloned into an MSCV-puro (Clontech) murine retroviral vector in place of the PGK-puro.
Sequence of CAR construct (nt): (1476bp)
GCCACCATGGCTTTGCCAGTGACAGCTCTTCTCCTTCCACTGGCCCTCCTCCTTCACGCCGCTAGGCCAGAGCAGAAACTTATTTCAGAGGAAGACCTGGACATTCAAATGACACAAACTACTTCTTCTCTCTCCGCCTCACTTGGTGACCGCGTCACTATTAGTTGCCGCGCTAGTCAAGATATTAGTAAGTACCTGAATTGGTATCAACAAAAACCTGACGGGACTGTAAAGCTGCTTATATATCATACTTCTAGGCTGCATTCTGGAGTACCTTCACGATTTAGCGGTAGCGGATCCGGCACCGACTACTCCCTCACAATTAGCAATCTGGAGCAAGAGGACATAGCCACCTACTTCTGCCAGCAAGGGAATACCTTGCCATACACTTTCGGTGGTGGAACTAAGCTCGAAATTACTGGGGGTGGAGGCAGTGGCGGAGGGGGGTCAGGTGGGGGAGGTTCAGAAGTCAAACTCCAGGAATCTGGACCTGGACTCGTTGCCCCTTCCCAATCCCTTAGTGTTACATGCACTGTATCAGGTGTATCCCTCCCTGATTACGGTGTCTCCTGGATTCGGCAGCCTCCTCGGAAGGGTCTCGAGTGGTTGGGAGTGATTTGGGGGTCTGAAACTACTTATTATAACAGTGCCCTTAAGAGTAGATTGACTATAATTAAGGATAACAGTAAGTCACAAGTATTCCTCAAAATGAATTCCTTGCAAACAGACGATACAGCAATATATTACTGCGCAAAACACTACTACTATGGCGGTAGTTACGCTATGGACTATTGGGGTCAAGGAACCTCTGTCACAGTTTCTAGCATTGAGTTCATGTATCCCCCACCTTACTTGGACAATGAAAGGTCTAATGGGACCATCATACACATTAAAGAGAAACACCTGTGTCATACTCAGAGTTCTCCAAAATTGTTCTGGGCCTTGGTTGTCGTTGCCGGCGTACTGTTCTGTTACGGTCTCTTGGTTACCGTGGCACTTTGTGTTATCTGGACTAATTCCCGGCGGAATCGGGGTGGACAGAGCGATTACATGAATATGACCCCAAGAAGACCTGGACTGACCAGGAAACCATATCAACCCTATGCTCCTGCTCGGGACTTTGCTGCTTACCGCCCACGCGCAAAGTTTTCTAGGAGCGCTGAAACCGCTGCCAACCTCCAAGACCCTAATCAGCTTTACAATGAATTGAACTTGGGACGCCGGGAGGAGTATGACGTCCTTGAGAAAAAGCGGGCTCGGGATCCAGAAATGGGCGGAAAGCAACAGAGGCGAAGAAATCCACAAGAGGGGGTCTATAACGCTCTTCAGAAAGATAAAATGGCTGAGGCATATAGCGAAATTGGGACCAAGGGGGAGAGAAGAAGAGGCAAGGGACATGACGGGCTTTACCAGGGTTTGTCTACCGCAACAAAAGACACCTATGATGCTTTGCACATGCAAACACTGGCTCCTAGA
Sequence of CAR construct (aa): (492 aa)
ATMALPVTALLLPLALLLHAARPEQKLISEEDLDIQMTQTTSSLSASLGDRVTISCRASQ
DISKYLNWYQQKPDGTVKLLIYHTSRLHSGVPSRFSGSGSGTDYSLTISNLEQEDIATYF
CQQGNTLPYTFGGGTKLEITGGGGSGGGGSGGGGSEVKLQESGPGLVAPSQSLSVTCTVSGVSLPDYGVSWIRQPPRKGLEWLGVIWGSETTYYNSALKSRLTIIKDNSKSQVFLKMNSLQTDDTAIYYCAKHYYYGGSYAMDYWGQGTSVTVSSIEFMYPPPYLDNERSNGTIIHIKEKHLCHTQSSPKLFWALVVVAGVLFCYGLLVTVALCVIWTNSRRNRGGQSDYMNMTPRRPGLTRKPYQPYAPARDFAAYRPRAKFSRSAETAANLQDPNQLYNELNLGRREEYDVLEKKRARDPEMGGKQQRRRNPQEGVYNALQKDKMAEAYSEIGTKGERRRGKGHDGLYQGLSTATKDTYDALHMQTLAPR
Construction of retroviral vector containing huCD19.
DNA fragment encoding huCD19 was PCR-amplified and cloned into an MSCV-puro (Clontech) murine retroviral vector.
Construction of retroviral vectors containing Cre (MSCV-Cre-IRES-NGFR), and Nr4a1, Nr4a2, Nr4a3 (MCSV-HA-Nr4a1-IRES-NGFR, MCSV-HA-Nr4a2-IRES-NGFR, MCSV-HA-Nr4a3-IRES-NGFR).
DNA fragment encoding Cre was PCR-amplified and cloned into MSCV-IRES-NGFR (Addgene Plasmid #27489). DNA fragment encoding Nr4a1 (a kind gift of C.-W. J. Lio, La Jolla Institute for Allergy and Immunology, La Jolla, CA) was PCR-amplified with 5’ HA-tag and cloned into MSCV-IRES-NGFR. DNA fragment encoding Nr4a2 (Addgene Plasmid #3500) was PCR-amplified with 5’ HA-tag and cloned into MSCV-IRES-NGFR. DNA fragment encoding Nr4a3 (DNASU Plasmid # MmCD00080978) was PCR-amplified with 5’ HA-tag and cloned into MSCV-IRES-NGFR.
Eukaryotic cell lines.
The EL4 mouse thymoma cell line was purchased from the American Type Culture Collection (ATCC): EL4 (ATCC® TIB-39™, Mus musculus T cell lymphoma). The B16-OVA mouse melanoma cell line expressing the ovalbumin protein (a kind gift of S. Schoenberger, La Jolla Institute for Allergy and Immunology, La Jolla, CA) was previously described12. The 293T cell line was purchased from ATCC: 293T (ATCC® CRL-3216™). The Platinum-E Retroviral Packaging Cell Line, Ecotropic (PlatE) cell line was purchased from Cell BioLabs, Inc: RV-101. The MC-38 mouse colon adenocarcinoma cell line (a kind gift of A.W. Goldrath, UCSD, La Jolla, CA) was originally purchased from Kerafast, Inc (ENH204). The EL4 cell line stained positive for mouse Thy1.2 and PD-1; and stained negative for huCD19. The B16-OVA cell line stained negative for huCD19. The MC-38 cell line stained negative for huCD19. The PlatE and 293T cell lines were not authenticated. Cell lines were not tested for mycoplasma contamination.
Construction of mouse tumor cell lines expressing huCD19.
B16-OVA, EL4, and MC-38 cells were transduced with an amphotropic virus containing the human CD19 (huCD19) and then sorted for cells expressing high levels of huCD19.
Preparation of B16-OVA-huCD19 melanoma cells for tumor inoculation.
B16-OVA-huCD19 cells were cultured in Dulbecco’s medium (DMEM) with 10% (vol/vol) FBS, 1% L-glutamine, 1% penicillin/ streptomycin and passaged three times prior to inoculation. At the time of injection, cells were trypsinized and resuspended in Hanks balanced salt solution without phenol red at 10 million cells per milliliter. C57BL/6J male mice (8–12 wk old) were injected intradermally with 500,000 B16-OVA-huCD19 cells (50 μL per injection).
Preparation of MC38-huCD19 colon adenocarcinoma cells for tumor inoculation.
MC38-huCD19 cells were cultured in Dulbecco’s medium (DMEM) with 10% (vol/vol) FBS, 0.1mM non-essential amino acids, 1mM sodium pyruvate, 10mM Hepes, 1% L-glutamine, 1% penicillin/streptomycin and passaged two times prior to inoculation. At the time of injection, cells were trypsinized and resuspended in Hanks balanced salt solution without phenol red at 10 million cells per milliliter. C57BL/6J male mice (8–12 wk old) were injected intradermally with 500,000 MC38-huCD19 cells (50 μL per injection).
Mice.
C57BL/6J, B6.SJL-PtprcaPepcb/BoyJ, Rag 1−/− mice were obtained from Jackson Laboratories. Nr4a gene-disrupted strains were obtained from Takashi Sekiya and Akihiko Yoshimura, with permission from Pierre Chambon. Both male and female mice were used for studies. Mice were age-matched and between 8–12 weeks old when used for experiments, and tumor-bearing mice were first tumor size-matched and then randomly assigned to experimental groups. All mice were bred and/or maintained in the animal facility at the La Jolla Institute for Allergy and Immunology. All experiments were performed in compliance with the study protocol approved by the LJI Institutional Animal Care and Use Committee (IACUC) regulations.
B16-OVA-huCD19 tumor model.
For analysis of CAR CD8+ TILs and endogenous CD8+ TILs: On Day 0, 8–12 week old C57BL/6J mice were injected intradermally with 5 × 10⁵ B16-OVA-huCD19 cells. After tumors became palpable, tumor measurements were recorded with a manual caliper every other day and tumor area was calculated in centimeters squared (length × width). On Day 13, 1.5 million CAR-Transduced CD45.1+ CD8+ T cells were adoptively transferred into tumor size-matched tumor-bearing mice. On Day 21, mice were harvested for tumors. For analysis of CAR CD8+ TILs lacking Nr4a family members: Because the Nr4a gene-disrupted mice were originally derived from 129/SvJ ES cells34, and their genetic background might not have been fully compatible with that of inbred C57BL/6J mice despite stringent backcrossing, we used Rag1-deficient mice as recipients in most experiments to avoid variable rejection. On Day 0, 8–12 week old Rag1−/− mice were injected intradermally with 5 × 10⁵ B16-OVA-huCD19 cells and tumors were measured every other day after they became palpable. On Day 13, 1.5 million CAR- and empty vector pMIN-transduced Nr4a1fl/fl Nr4a2 fl/fl Nr4a3+/+ (WT) or CAR- and Cre-transduced CD8+ Thy1.1+ NGFR+ Nr4a1fl/fl Nr4a2 fl/fl Nr4a3−/− (Nr4aTKO) T cells were adoptively transferred into tumor size-matched tumor-bearing mice. On Day 21, mice were harvested for tumors and spleens. For monitoring of tumor growth for survival studies after adoptive transfer of CAR-T cells lacking Nr4a family members: Again because the Nr4a gene-disrupted mice were originally derived from 129/SvJ ES cells34, and their genetic background might not have been fully compatible with that of inbred C57BL/6J mice despite stringent backcrossing, we used Rag1-deficient mice as recipients in most experiments to avoid variable rejection. On Day 0, 8–12 week old Rag1−/− mice were injected intradermally with 5 × 10⁵ B16-OVA-huCD19 cells and tumors were measured every other day after they became palpable. On Day 7, 3 million CAR- and empty vector pMIN-transduced or CAR- and Cre-transduced CD8+ Thy1.1+ NGFR+ Nr4a-floxed mouse T cells (in combinations to produce Nr4a1KO, Nr4a2KO, Nr4a3KO, Nr4aTKO, WT as listed in Extended Data Figure 6a) were adoptively transferred into tumor size-matched Rag1−/− tumor-bearing mice. For the experiments using immunocompetent recipients, on day 7, 6 million CAR- and empty vector pMIN-transduced or CAR- and Cre-transduced CD8+ Thy1.1+ NGFR+ Nr4a-floxed mouse T cells (to produce Nr4aTKO and WT) were adoptively transferred into tumor size-matched C57BL/6J tumor-bearing mice. For all survival studies, tumor growth was monitored until experimental endpoint on Day 90 after tumor inoculation or until IACUC-approved endpoint of a maximal tumor measurement exceeding a diameter greater than 1.5cm for more than three days without signs of regression. In none of the experiments were any of these limits exceeded.
MC38-huCD19 tumor model.
The monitoring of tumor growth for survival studies after adoptive transfer of CAR-T cells lacking Nr4a family members into C57BL/6J mice bearing MC38-huCD19 tumors was performed as described for the B16-OVA-huCD19 model using immunocompetent recipients.
Preparation of cells for adoptive transfer.
CD8+ T cells were isolated and activated with 1ug/mL anti-CD3 and 1 ug/mL anti-CD28 for 1d, then removed from activation and transduced with retrovirus expressing CAR, Cre, pMIN, or a combination of the above for 1h at 37°C and 2000g. Immediately after the transduction, cells were replaced with media containing 100U of IL-2/mL. 1d following the first transduction, a second transduction was performed and immediately after the transduction, cells were replaced with media containing 100U of IL-2/mL. On the day of adoptive transfer (either day 3 or day 5 post activation), cells were analyzed by flow cytometry and cell counts were obtained using a hemocytometer. The number of CAR-transduced cells was obtained using the cell counts from the hemocytometer and the population percentages obtained from flow cytometry. Cells were then collected, washed with PBS and resuspended at a concentration equivalent of 1.5 million, 3 million, or 6 million CAR-transduced cells per 200uL of PBS. Mice were then adoptively transferred with 200uL of retro-orbital i.v. injections each.
Isolation of tumor infiltrating lymphocytes (TILs) for subsequent analyses.
Sample preparation for flow cytometry/cell sorting of TILs from CAR and OT-I experiments, and for flow cytometry of TILs from Nr4aTKO vs WT experiments: On Day 21, mice were euthanized and perfused with PBS prior to removal of tumor. Tumors were collected, pooled together by group, homogenized, and then dissociated using the MACS Miltenyi Mouse Tumor Dissociation kit (Miltenyi Biotec) and the gentleMACs dissociator with Octo Heaters (Miltenyi Biotec) according to manufacturer’s instructions. Tumors were then filtered through a 70uM filter and spun down. Supernatant was aspirated and the tumors were resuspended in the equivalent of 4–5 grams of tumor per 5mL of 1%FBS/PBS for CD8 positive isolation using the Dynabeads FlowComp Mouse CD8 isolation kit (Invitrogen). After positive isolation, cells were either divided into equal amount for staining and phenotyping with flow cytometry, or stained for cell sorting. Sample preparation for cell sorting of TILs from Nr4a WT and Nr4aTKO experiments: On Day 21, mice were euthanized and perfused with PBS prior to removal of tumor. Tumors were collected, pooled together by group, homogenized, and then dissociated using the MACS Miltenyi Mouse Tumor Dissociation kit (Miltenyi Biotec) and the gentleMACs dissociator with Octo Heaters (Miltenyi Biotec) according to manufacturer’s instructions. Tumors were then filtered through a 70uM filter and spun down. Supernatant was aspirated and the tumors were resuspended in 40% Percoll/RPMI and underlaid with 80% Percoll/PBS in 15mL conical tubes to form an 80%/40% Percoll discontinuous density gradient. Samples were spun for 30min at room temperature at 1363g in a large benchtop centrifuge with a swinging bucket. TILs were collected from 80%/40% Percoll interface and further purified using CD90.2 Microbeads (Miltenyi Biotec) and magnetic separation. After positive isolation, cells were stained for cell sorting.
Transfections.
Transfections were performed in 10cm dish format, following manufacturer’s instructions for the TransIT®-LT1 Transfection Reagent (Mirus Bio LLC) and using the pCL10A1 and pCL-Eco packaging vectors (the former for the huCD19 virus, and the latter for all other viruses produced).
Retroviral transduction.
Retroviral transductions were performed in 6-well plate format, using 3mL of 0.45uM filtered virus and 8ug/mL of polybrene per well. Double transductions were performed using 1.5mL of each virus for a total of 3mL. Cells were spun at 2000g for 1 h at 37°C in a pre-warmed centrifuge. Immediately after the transduction, cells were replaced with media containing 100U of IL-2/mL. A second transduction is performed the following day.
Antibodies.
Fluorochrome-conjugated antibodies were purchased from Biolegend, BD Sciences, eBioscience, and Cell Signaling Technologies. Primary antibody used for chromatin-immunoprecipitation was purchased from Cell Signaling Technologies.
Surface marker staining.
Cells were spun down and stained with 1:200 final concentration of antibodies in 50% of 2.4G2 (Fc block) and 50% of FACS Buffer (PBS + 1% FBS, 2mM EDTA) for 15 min.
Cytokine restimulation and staining.
Prior to staining, cells were incubated in media containing 10nM of PMA and 500nM of ionomycin, and 1ug/mL of Brefeldin A at 37°C for 4 hours. After restimulation, cells were then stained for surface markers and with live/dead dye as described in the surface marker staining protocol above. Cells were then fixed with 4% paraformaldehyde for 30 min, permeabilized with 1X BD Perm/Wash (BD Biosciences) for 30min, and then stained for cytokines at a final concentration of 1:200 in 1X BD Perm/Wash buffer. 1X BD Perm/Wash buffer was prepared according to manufacturer’s instructions. All wash steps were performed with FACS Buffer (PBS + 1% FBS, 2mM EDTA).
TF staining.
Cells were stained for surface markers and with live/dead dye as described in the surface marker staining protocol above. Cells were then fixed, permeabilized, and stained using the Foxp3 / Transcription Factor Staining Kit (eBioscience) according to manufacturer’s instructions. All TF antibodies were used at 1:200 final concentration. The antibody for Ki67 was used at 1:100 final concentration.
Flow cytometry analysis.
All flow cytometry analysis was performed using the LSRFortessa (BD Biosciences) or the LSR-II (BD Biosciences). Flow data was analyzed using FlowJo v.10 (Tree Star, Inc). Relevant sample gating has been provided in extended data figures.
Statistical analyses.
Statistical analyses on flow cytometric data and tumor growth data for experiments involving were performed using the appropriate statistical comparison, including paired or unpaired two-tailed t-tests with Welch’s correction as needed, one-way ANOVA with multiple comparisons test (Tukey’s or Dunnett’s), row-matching (RM) one-way ANOVA with Greenhouse-Geisser correction, or ordinary two-way ANOVA (Prism 7, GraphPad Software). Statistical analyses for survival curves were performed using the log-rank (Mantel-Cox) test (Prism 7, GraphPad Software). A p-value of < 0.05 was considered statistically significant.
In vitro killing assay.
10,000 B16-OVA-huCD19 cells (target cells) were plated in 100uL of T cell media (or media only for background) in each well in E-plate 96 (ACEA Biosciences Inc, San Diego, CA). Plate was placed in xCELLigence Real-Time Cell Analysis (RTCA) instrument (ACEA Biosciences Inc, San Diego, CA) after 30 minutes and incubated overnight. The following day, the plate was removed from xCELLigence RTCA machine and CD8+ CAR-T cells (effector cells) were added in an additional 100uL of T cell media for 30 minutes (for lysis positive control, 0.2% TritonX was used, for lysis negative control, only media was used). The plate is then placed back into the incubator, and data acquisition begins. 5 hours after, the Cell Index (CI) was obtained from each well. Percentage of specific lysis was calculated for each well as follows: % specific lysis = 100 - (CIeach well/(CIpos-CIneg))*100. B16-OVA-huCD19 cells were thawed out 3 days prior to plating on day 4 (when inoculation would usually occur); mouse CD8+ CAR-T cells were prepared prior to the experiment to be added to target cells on day 5 post activation of CD8+ T cells.
Chromatin immunoprecipitation and quantitative real-time PCR (ChIP-qPCR).
ChIP was performed as previously described35. Briefly, CD8+ T cells were isolated from C57BL/6J mice as above, activated with plate-bound anti-CD3/CD28, transduced with either empty vector control or retrovirus expressing Nr4a1, Nr4a2, or Nr4a3 with hemagglutinin(HA)-tag on the N-terminus. Cells were cultured for a total of 5 days post-transduction. For fixation, formaldehyde (16%, ThermoFisher) was added directly to the cells to a final concentration of 1% and incubated at room temperature for 10 mins with constant agitation. Glycine (final 125mM) was added to quench the fixation and the cells were washed twice with ice-cold PBS. Cell pellets were snap-frozen with liquid nitrogen and stored at −80°C until use. For nuclei isolation, cell pellets were thawed on ice and lysed with lysis buffer (50 mM HEPES pH 7.5, 140 mM NaCl, 1mM EDTA, 10% glycerol, 0.5% NP40, 0.25% Triton-X100) supplemented with 1% Halt protease inhibitor (ThermoFisher) for 10 mins at 4°C with constant rotation. Pellets were washed once with washing buffer (10 mM Tris-HCl pH 8.0, 200 mM NaCl, 1 mM EDTA, 0.5 mM EGTA, 1% Halt protease inhibitor) and twice with shearing buffer (10 mM Tris-HCl pH 8.0, 1 mM EDTA, 0.1% SDS, 1% Halt protease inhibitor). Nuclei were resuspended in 1mL shearing buffer, transferred to 1 mL milliTUBE (Covaris, Woburn, MA), and sonicated with Covaris E220 using for 18 minutes (Duty Cycle 5%, intensity 140 Watts, cycles per burst 200). After sonication, insoluble debris was removed by centrifugation at 20,000 × g for 10 mins at 4°C. The concentration of chromatin was quantified using Qubit DNA BR assay (ThermoFisher). For immunoprecipitation, 25ug of chromatin was removed and mixed with equal volume of 2× Conversion buffer (10 mM Tris-HCl pH 7.5, 280 mM NaCl, 1 mM EDTA, 1mM EGTA, 0.2% sodium deoxycholate, 0.2% Triton-X100, 1% Halt protease inhibitor) in a 2mL low-binding tube (Eppendorf). Either 5% or 6% of input chromatin was saved as control. Chromatin was pre-cleared using 30uL washed protein A magnetic dynabeads (ThermoFisher) for 1h at 4°C with constant rotation. Pre-cleared chromatin was transferred to new tube, added with 10ug rabbit monoclonal anti-HA (C29F4, Cell Signaling Technology) and 30uL washed protein A magnetic dynabeads, and incubated at 4°C overnight with constant rotation. Bead-bound chromatin was washed twice with RIPA buffer (50 mM Tris-HCl pH 8.0, 250 mM LiCl, 1 mM EDTA, 1% sodium deoxycholate, 1% NP-40, 0.1% SDS), once with high salt washing buffer (50 mM Tris-HCl pH 8.0, 500 mM NaCl, 1 mM EDTA, 1% NP-40, 0.1% SDS), once with Lithium washing buffer (50 mM Tris-HCl pH 8.0, 150 mM NaCl, 1 mM EDTA, 1% sodium deoxycholate, 1% NP-40), and once with TE (10 mM Tris-HCl pH 8.0, 1 mM EDTA). All washes were incubated for 5 mins at 4°C with constant rotation. Chromatin was eluted from beads by incubating with elution buffer (100mM NaHCO3, 1% SDS) at room temperature for 30 mins in the presence of 0.5 mg/mL of RNaseA (Qiagen). To de-crosslink protein and DNA, proteinase K (final 0.5 mg/mL) and NaCl (final 200mM) were added to the recovered supernatant and incubated at 65°C overnight with constant shaking (1000 rpm) in a ThermoMixer (Eppendorf). DNA was purified using Zymo ChIP DNA clean and concentration kit (Zymo Research) according to the manual from the manufacturer. Eluted DNA was analyzed by qPCR using Power SYBR Green PCR Master Mix (Roche) and StepOne Real Time PCR system (ThermoFisher). The signals from ChIP sample was normalized to those from the input and calculated as “percentage of input”. A value of “undetected” was recorded as zero.
ChIP qPCR primers (all coordinates are for mm10).
1) chrX:7584283–7584409 127bp: Fp3-CNS2-qF (forward) CCCAACAGACAGTGCAGGAA, (reverse) Fp3-CNS2-qR TGGTGTGACTGTGTGATGCA. 2) chr1:94074907–94075062 156bp: Pd1.4A_qF1 (forward) ACCTTTCCTGTGCCTACGTC, Pd1.4A_qR1 (reverse) TAAGAGTGGTGGTGGTTGGG. 3) chr11:99163437–99163632 196bp: CCR7_E1_F1 (forward) GGCTCTACTGCCCTGTTGTC, CCR7_E1_R1 (reverse) AACACATCATTTTGCCGTGA. 4) chr11:99168432–99168614 183bp: CCR7_E2_F1 (forward) GGACACAGACGGGTGAGTTT, CCR7_E2_R1 (reverse) GGCCTGTGTTCAAATGAGGT. 5) chr17:8196147–8196301 155bp: CCR6_F1 (forward) GGCAGGATGTGGCTTTGTAT, CCR6_R1 (reverse) CCTGCATGTAGTGCTGACCA 6) chr10:118460432–118460610 179bp: IfngE_F1 (forward) GCGCCTAGAAGTTCAGTGCT, IfngE_R1 (reverse) TTTGAGATGCAGCAGTTTGG.
Cell sorting.
Cell sorting was performed by the LJI Flow Cytometry Core, using the FACSAria-I, FACSAria-II, or FACSAria-Fusion (BD Biosciences). For ATAC-seq, 50,000 cells were sorted from the isolated CD8+ TILs, with the exception of the OT-I samples, for which 15,000 – 30,000 cells were sorted. In some cases, a second ATAC-seq technical replicate using 50,000 additional cells was prepared in parallel. For RNA-seq, 10,000 cells were sorted from the isolated CD8+ TILs. For the CAR and OT-I experiments, the populations sorted were as follows: CD8+ CD45.1+ Thy1.1+ PD-1highTIM3high CAR (population A), CD8+ CD45.1+ Thy1.1+ PD-1highTIM3low CAR (population B), CD8+ CD45.1− Thy1.1− PD-1highTIM3high endogenous cells (population C), CD8+ CD45.1− Thy1.1− PD-1highTIM3low endogenous cells (population D) and CD8+ CD45.1− Thy1.1− PD-1lowTIM3low endogenous cells (population E), and CD8+ CD45.1+ PD-1highTIM3high OT-I (population F). For the Nr4a experiments, populations were sorted as follows: CD8+ Thy1.1+ NGFR+ Nr4a WT TILs and CD8+ Thy1.1+ NGFR+ Nr4aTKO TILs. For the experiments ectopically expressing Nr4a in invitro, populations were sorted on a set level of NGFR+ expression.
ATAC-seq sample and library preparation.
ATAC-seq samples were prepared as in [ref. 36] with minor modifications. Briefly, cells were sorted into 50%FBS/PBS, spun down, washed once with PBS, and then lysed. Transposition reaction was performed using Nextera enzyme (Illumina) and purified using the MinElute kit (Qiagen) prior to PCR amplification (KAPA Biosystems) with 10–12 cycles using barcoded primers and 2 × 50 cycle paired-end sequencing (Illumina).
ATAC-seq analysis.
Sequencing reads in FASTQ format were generated from Illumina Basespace (for mouse datasets) or were from published data13,15. Reads were mapped to mouse (mm10) or human (hg19) genomes using bowtie (version 1.0.0, [ref. 37] with parameters “-p 8 -m 1 --best --strata -X 2000 -S --fr --chunkmbs 1024.” Unmapped reads were processed with trim_galore using parameters “--paired --nextera --length 37 --stringency 3 -- three_prime_clip_R1 1 --three_prime_clip_R2 1” before attempting to map again using the above parameters. These two bam files were merged and processed to remove reads mapping to the mitochondrial genome and duplicate reads (with picard MarkDuplicates). For mouse datasets, technical replicates were merged together into one single biological replicate at this point. For human datasets, samples with low coverage or which did not meet quality control metrics were excluded. For the one human sample with two technical replicates, these matched closely and number 1 was chosen for the analysis. Genomic coverage for individual replicates were computed on 10 bp windows with MEDIPS [ref.38] using full fragments captured by ATAC-seq and used to generate average coverage with the Java Genomics Toolkit [ref. 39] for each group.
To identify peaks, the bam files containing unique, non-chrM reads were processed with samtools and awk using “‘{if(sqrt(\$9*\$9)<100){print \$0}}’” to identify nucleosome free DNA fragments less than 100 nt in length. These subnucleosomal fragments were used to call peak summits for each replicate with MACS2 using parameters “--nomodel --keep-dup all --call-summits.” For peak calling, we used a q value cutoff of 0.0001 for mouse datasets and 0.01 for human datasets. The summits for each peak from all replicates were expanded to regions with a uniform size of 200 bp for mouse datasets and 300 bp for human datasets. These regions from all replicates were merged into one global set of peaks and were filtered to remove peaks on the Y chromosome or those that overlapped ENCODE blacklisted regions40,41.
We used summarizeOverlaps to compute the number of transposase insertions overlapping each peak from all replicates42. For differential coverage, raw ATAC-seq counts in each peak for all replicates of all samples were normalized between replicates using voom [ref. 43]. Pairwise contrasts were performed with limma and differentially accessible regions were filtered based on an fdr adjusted p-value of less than 0.01 and an estimated fold-change of at least 4. ATAC-seq density (number of transposase insertion sites per kilobase per million mapped reads) per peak and accessible regions were defined as those with a mean of 5 normalized insertions per kilobase. We used HOMER [ref. 44] to identify motifs for TF binding sites enriched in different groups of peaks.
RNA-seq sample and library preparation.
Total RNA was extracted using the RNeasy Micro Kit (Qiagen). SMARTseq2 libraries were prepared as described45. Briefly, purified RNA was hybridized to polyA to enrich for mRNA, and then mRNA underwent reverse transcription and template switching prior to an 18-cycle PCR preamplification step. PCR cleanup was then performed using AMPure XP beads (Beckman Coulter). Quality check of the cDNA library was performed using an Agilent high-sensitivity DNA chip, and 1ng of input cDNA was further used for library preparation using the Nextera XT LibraryPrep kit (Illumina). Tagmented DNA was amplified with a 12-cycle PCR and again purified with AMPureXP beads. Library size distribution and yield were evaluated using the Agilent high-sensitivity DNA chip. Libraries were pooled at equimolar ratios and sequenced with the rapid run protocol on a HiSEq2500 (Illumina) with 50-nt single-end cycling.
RNA-seq analysis.
Quality and adapter trimming was performed on raw RNA-seq reads using TrimGalore! v0.4.5 (http://www.bioinformatics.babraham.ac.uk/projects/trim_galore/) with default parameters, retaining reads with minimal length of 36 bp. Resulting single-end reads were aligned to mouse genome mm10 using STAR v2.5.3a [ref. 46] with alignment parameter outFilterMismatchNmax 4. Technical replicates were merged. RNA-seq analysis was performed at the gene level, employing the transcript annotations of the mouse genome mm10. Reads aligning to annotated features were counted using the summarizeOverlaps function (mode=“Union”) of the Bioconductor package GenomicAlignments v1.10.1 [ref.42]. The DESeq2 package v1.14.1 [ref. 47] was used to normalize the raw counts and identify differentially expressed genes (FDR cutoff of p<0.1, unless otherwise specified). Genes with less than 10 reads total were pre-filtered in all comparisons as an initial step. Transformed values (rlog) were calculated within DESeq2 for data visualization.
Single cell RNA-seq analysis.
Data was obtained from a previously published study on the cellular ecosystem of human melanoma tumors14. Briefly, [ref. 14] profiled by single cell RNA-seq (scRNA-seq) malignant and non-malignant cells (including immune, stromal, and endothelial cells). Normalized expression values (Ei,j=log2(TPMi,j/10+1), where TPMi,j refers to transcripts per million (TPM) for gene i in cell j) were obtained from Gene Expression Omnibus (GSE72056). For the analysis, we only kept genes with non-zero expression values in at least 10 cells. Given the technical noisiness and gene dropout associated with scRNA-seq data, we used the MAGIC algorithm48 for imputation in the matrix of normalized expression values, with diffusion parameter t=2. An R implementation of the MAGIC method was downloaded from (https://www.krishnaswamylab.org/magic-project). Tumor-infiltrating T cells were selected based on the inferred cell type annotation described in [ref. 14]. CD8+ T cells were selected based on the expression of CD8A (cells with imputed values ≥ 4) and CD4 (cells with imputed values ≤ 1.5). Imputed values were used for gene expression visualizations.
Gene Set Enrichment Analyses (GSEAs).
Gene set enrichment analysis (GSEA) was performed employing the GSEA Preranked function [ref. 24], ranking genes by log2 fold change according to the pertinent comparison, with number of permutations of 10,000 and allowing for gene set size up to 2000 genes. Gene sets were defined from differentially expressed genes obtained from pairwise comparisons between effector, memory, and exhausted CD8+ T cells from a previously published study11. In this context, differential gene expression was identified employing DESeq2 with FDR cutoff of p<0.01 and log2 fold change cutoff of 1.
Data Reporting.
No statistical methods were used directly to predetermine sample size; further explanation can be found in the Life Sciences Reporting Summary. The investigators were not blinded to group allocation during experiments and outcome assessment.
Data availability.
All data generated and supporting the findings of his study are available within the paper. RNA-seq and ATAC-seq data are available in the Gene Expression Omnibus (GEO) database under the SuperSeries reference number GSE123739. Source data for Figures 2, 4, and Extended Data Figures 2, 4, 7, 8, 9 are provided in Tables S1–S5. Additional source data is provided in the online version of the paper. Additional information and materials will be made available upon request.
Extended Data
Extended Data Figure 1 |. Functional assessment of a human CD19 (huCD19)-reactive chimeric antigen receptor (CAR).
(a) Left three panels, EL4, MC38 and B16-OVA cell lines expressing huCD19. Gray, parental; black, huCD19-expressing cells. Right; B16-OVA-huCD19 cells recovered after growth in a C57BL/6J mouse followed by culture for 7 days. Gray, isotype control; black, anti-huCD19. Data from one biological replicate in each case. (b) Left, growth curves (mean ± s.e.m., 15 mice per group) of 250,000 B16-OVA parental or B16-OVA-huCD19 tumor cells in vivo after inoculation into C57BL/6J mice. There is no significant difference at any timepoint (ordinary two-way ANOVA, p >0.9999). Right, growth curves (mean ± s.e.m.) of 250,000 (n=5 mice) or 500,000 (n=6 mice) B16-OVA-huCD19 tumor cells in vivo after inoculation (significant difference between the two groups at day 21; ordinary two-way ANOVA; *p=0.0146). (c) Diagram of the CAR construct. LS, leader sequence; SS, signal sequence; myc, myc epitope-tag; scFv, single chain variable fragment against human CD19; followed by the mouse (m) CD28 and CD3ζ signaling domains, the 2A self-cleaving peptide and the mouse Thy1.1 reporter. (d) CAR surface expression monitored by myc epitope-tag and Thy1.1 expression. Mock-transduced CD8+ T cells were used as controls. (e) Cytokine (TNF, IFNγ) production by CAR CD8+ T cells after restimulation with EL4-huCD19 cells or with PMA/ionomycin. (f) Quantification of the data shown in (e); p-values (TNF: ****p<0.0001, IFNγ: ***p=0.0009) were calculated using a two-tailed unpaired t-test. (g) In vitro killing assay (mean ± s.e.m.) of CD8+ CAR and mock-transduced T cells; data from two biologically independent experiments, each with three technical replicates. (h) Inhibitory surface receptor expression on CAR- and mock-transduced CD8+ T cells cultured in vitro for 5 days; data representative of three biological replicates. Gray shading, isotype control, black line, mock or CAR. Data in (d, e, h) are representative of 3 independent experiments. For all p-value calculations, *p ≤0.05, **p ≤0.01, ***p ≤0.001, ****p ≤0.0001.
Extended Data Figure 2 |. Adoptively transferred CD8+ CAR-T cells infiltrating B16-OVA-huCD19 tumors exhibit phenotypes and gene expression profiles similar to those of OT-I and endogenous CD8+ TILs.
(a, b) Experimental design to assess CD45.1+ OT-I and CD45.2+ endogenous TILs; 1.5×10⁶ OT-I T cells were adoptively transferred into C57BL/6J mice 13 days after tumor inoculation. (c) Tumor growth curves (mean ± s.e.m.) of mice adoptively transferred with CAR or OT-I CD8+ T cells; graph is a compilation of 3 independent experiments. At days 7 and 21, mouse numbers were: CAR, n=24, 17; for OT-I, n=21, 20. (d) Tumor growth curves (mean ± s.e.m.) of mice adoptively transferred with CAR or PBS; graph is a compilation of 3 independent experiments. At days 7 and 21, mouse numbers were: CAR n=35, 35; PBS n=8, 6. (c, d) For tumor sizes on day 21 after tumor inoculation, p=0.3527 for CAR compared to OT-I (c) and p=0.6240 for PBS compared to CAR (d); p-values were calculated using a two-tailed unpaired t-test with Welch’s correction, *p ≤0.05, **p ≤0.01, ***p ≤0.001, ****p ≤0.0001. (e, f) Flow cytometry gating scheme for CAR (e) and OT-I (f) CD8+ TILs. (g) Mean average (MA) plots of genes differentially expressed in the indicated comparisons. Wald test was performed to calculate p-values, as implemented in DESeq2; p-values were adjusted using the Benjamini-Hochberg method. Genes differentially expressed (adjusted p-value <0.1 and log2FoldChange ≥1 or ≤−1) are highlighted. Selected genes are labeled. Top row, comparisons of the CAR-TIL populations amongst themselves and to endogenous PD-1loTIM3lo TILs; middle row, comparisons within the endogenous TIL populations; bottom row, comparisons of CAR and endogenous PD-1hiTIM3hi TILs (left), and CAR and endogenous PD-1hiTIM3lo TILs (right).
Extended Data Figure 3 |. Adoptively transferred CAR-expressing mouse CD8+ T cells infiltrating B16-OVA-huCD19 tumors exhibit chromatin accessibility profiles similar to those of endogenous CD8+ TILs.
(a) Pairwise euclidean distance comparisons of log2 transformed ATAC-seq density (Tn5 insertions per kilobase) between all replicates at all peaks accessible in at least one replicate. (b) Scatterplot of pairwise comparison of ATAC-seq density (Tn5 insertions per kb) between samples indicated. (c) Genome browser views of sample loci, Pdcd1 (left), Itgav (right); scale range is from 0–600 for all tracks and data are the mean of all replicates. CD8+ TIL populations are as indicated and defined in Fig. 1b, 1d: (A) PD-1hiTIM3hi CAR, (B) PD-1hiTIM3lo CAR, (C) PD-1hiTIM3hi endogenous, (D) PD-1hiTIM3lo endogenous, (E) PD-1loTIM3lo endogenous.
Extended Data Figure 4 |. Mouse and human CD8+ TILs exhibit increased expression of Nr4a1, Nr4a2, Nr4a3.
(a, b) Flow cytometry gating scheme for CAR (a) and endogenous (b) CD8+ TILs. (c) Representative flow cytometry histograms of Nr4a proteins in PD-1hiTIM3hi TILs, PD-1hiTIM3lo TILs, and PD-1loTIM3lo TILs and their corresponding fluorescence minus one controls (in off-white). Data are representative of 3 independent experiments in which the sample from each independent experiment is comprised of TILs pooled together from 9–14 mice. (d) Representative flow cytometry histograms for Nr4a protein expression, comparing CAR and endogenous TIL populations (A-E) defined in Fig. 1. (e, f, g) Plotting in single cells the expression of PDCD1 and HAVCR2 (x- and y-axis respectively), and (displayed by the color scale) the expression of the following: (e) Genes differentially upregulated in PD-1hiTIM3hi TILs relative to PD-1loTIM3lo TILs. (f) Genes coding for selected TFs showing differential expression in the comparison of PD-1hiTIM3hi TILs relative to PD-1loTIM3lo TILs. (g) Genes differentially downregulated in PD-1hiTIM3hi TILs relative to PD-1loTIM3lo TILs. Each dot represents a single cell. Human CD8+ TILs data are from [ref.14].
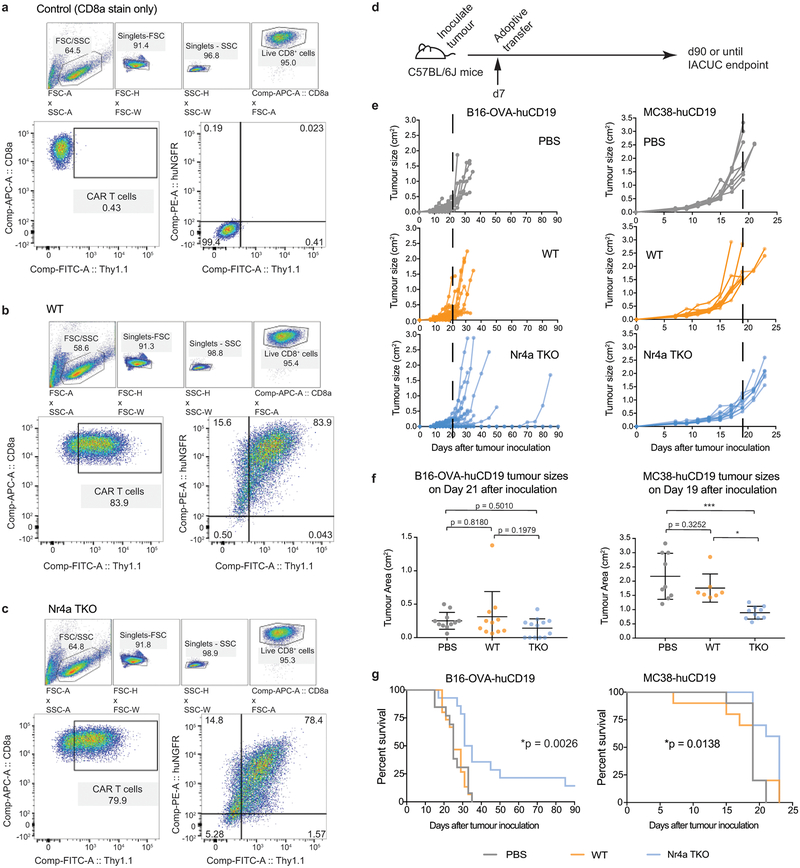
Extended Data Figure 5 |. Prolonged survival of immunocompetent tumor-bearing mice adoptively transferred with CD8+ Nr4aTKO compared to WT CAR-T cells.
(a) CD8a only staining control (previously tested to be the same as fluorescence minus one controls for CAR+ expression and NGFR+ expression) of CAR-T cells prior to adoptive transfer. (b) CAR and NGFR expression of CD8+ WT CAR-T cells prior to adoptive transfer. (c) CAR and NGFR expression of CD8+ Nr4aTKO CAR-T cells prior to adoptive transfer. Data in (a-c) are representative of 4 independent experiments. (d) 6×10⁶ CAR-T cells were adoptively transferred into C57BL/6J mice 7 days after tumor inoculation. (e) Growth of B16-OVA-huCD19 (left;13–15 mice per condition) and MC38-huCD19 (right; 10 mice per condition) tumors in individual mice. (f) B16-OVA-huCD19 (left) and MC38-huCD19 (right) tumor sizes (mean ± s.d.) at day 21 and 19 post inoculation respectively. p-values were calculated using an ordinary one-way ANOVA with Tukey’s multiple comparisons test: B16-OVA-huCD19, no significant difference; MC38-huCD19, PBS vs Nr4aTKO ***p=0.0001; PBS vs WT, p=0.3252; WT vs Nr4aTKO, *p=0.0120. (g) Survival curves for mice bearing B16-OVA-huCD19 tumors (left) and MC38-huCD19 tumors (right). p-values calculated using log-rank (Mantel-Cox) test. For B16-OVA-huCD19, surviving mouse numbers at d7, d21, d90 were: PBS, n=13, 11, 0; WT, n=15, 11, 0; Nr4aTKO, n=14, 13, 2; * p=0.0026. For MC38-huCD19, surviving mouse numbers at d7 and d19 were: PBS, n=10, 9; WT, n =10, 7; Nr4aTKO, n=10, 10; all mice died by d23; *p=0.0138. For all p-value calculations in (f, g), *p ≤0.05, **p ≤0.01, ***p ≤0.001, ****p ≤0.0001.
Extended Data Figure 6 |. Tumor-bearing mice adoptively transferred with CAR CD8+ T cells lacking all three Nr4a family members exhibit prolonged survival compared to mice transferred with wildtype CAR CD8+ T cells or CAR CD8+ T cells lacking only one of the three Nr4a family members.
(a) Experimental design; 3×10⁶ WT, Nr4aTKO, Nr4a1KO, Nr4a2KO, or Nr4a3KO CAR-T cells were adoptively transferred into Rag1−/− mice 7 days after tumor inoculation. (b) Growth of B16-OVA-huCD19 tumors in individual mice, comprised of 17 or more mice per condition (these data include the WT and Nr4aTKO data from Figure 3). (c) Graph shows mean ± s.d. and the individual values of B16-OVA-huCD19 tumor sizes at day 21 after inoculation. p-values were calculated using an ordinary one-way ANOVA with Tukey’s multiple comparisons test; PBS vs WT, *p=0.0395; WT vs Nr4a1KO, p=n.s.=0.0511; WT vs Nr4a2KO, **p=0.002, WT vs Nr4a3KO, *p=0.0161; and WT vs Nr4aTKO, ****p<0.0001. (d) Survival curves. **** p< 0.0001, calculated using log-rank (Mantel-Cox) test. Surviving mouse numbers at d7, d21, and d90 were n=31, 14, 0 for PBS; n=35, 25, 1 for WT; n=17, 12, 0 for Nr4a1KO; n=17, 15, 1 for Nr4a2KO; n=32, 22, 11 for Nr4a3KO; and n=39, 36, 27 for Nr4aTKO. For all p-value calculations, *p ≤0.05, **p ≤0.01, ***p ≤0.001, ****p ≤0.0001.
Extended Data Figure 7 |. Phenotypic and genomic features of mouse CD8+ T cells expressing Nr4a1, Nr4a2 or Nr4a3.
Mouse CD8+ T cells were isolated, activated, transduced with empty retrovirus or retroviruses encoding HA-tagged Nr4a1, Nr4a2, or Nr4a3 with human NGFR reporter, and assayed on day 5 post activation. (a) Flow cytometry gating of CD8+ NGFR+ empty vector control, Nr4a1, Nr4a2, and Nr4a3-expressing cells at a constant expression level of NGFR reporter. (b) Quantification of surface receptor expression (data from 3 independent replicates). (c) Representative flow cytometry plots of cytokine production upon restimulation with PMA/ionomycin. (d) Quantification of the data in (c). All p-values were calculated using an ordinary one-way ANOVA with Dunnett’s multiple comparisons test; *p ≤0.05, **p ≤0.01, ***p ≤0.001, ****p ≤0.0001. (e) PCA plot of RNA-seq data from in vitro resting mouse CD8+ T cells ectopically expressing Nr4a1, Nr4a2, Nr4a3, and empty vector control. (f) MA plots of genes differentially expressed in the comparisons of ectopic expression of Nr4a1, Nr4a2, or Nr4a3 against empty vector (top row), and pairwise comparisons between the ectopic expression of various Nr4a family members (bottom row). Wald test was performed to calculate p-values, as implemented in DESeq2. p-values were adjusted using the Benjamini-Hochberg method. Genes differentially expressed (adjusted p-value <0.1 and log2FoldChange ≥1 or ≤−1) are highlighted using different colors as indicated in the PCA plot as in (e). Selected genes are labeled. (g) Scatterplot of pairwise comparison of ATAC-seq density (Tn5 insertions per kb) between the indicated samples. Data in (a-d) are from three independent experiments, data in (e-g) from two independent experiments, each with two technical replicates.
Extended Data Figure 8 |. CD8+ Nr4aTKO CAR-TILs show increased effector function compared to WT CAR-TILs.
(a) Tumor growth curves (mean ± s.e.m.) after adoptive transfer of 1.5×10⁶ CAR-T cells into Rag1−/− mice on day 13 after tumor inoculation. Mouse numbers at d7 and d21 were: WT, n=47, 35; Nr4aTKO, n=41, 32. p-values were calculated using an ordinary 2-way ANOVA with Tukey’s multiple comparisons test; for WT vs Nr4aTKO, p=0.6908. (b) Flow cytometry gating scheme for surface markers, cytokines, and TFs expressed by WT (top) and Nr4aTKO (bottom) TILs. All samples are gated on cells with a set level of CAR expression (103 – 104) within the CAR+ NGFR+ population. (c) Bar plots (mean ± s.d.) showing (left) number of WT and Nr4aTKO CAR-TILs per gram of tumor (5 independent experiments; p-value was calculated using a two-tailed ratio paired t-test) and (right) MFI of Ki67 of WT and Nr4aTKO CAR-TILs (2 independent experiments). (d) Top, representative flow cytometry for TIM3 and TCF1 expression in WT and Nr4aTKO CAR-TILs (2 independent experiments). Bottom, bar plots (mean ± s.d.) of TF expression by WT and Nr4aTKO CAR-TILs (6 independent experiments). p-values were calculated using two-tailed paired t-tests. For all p-value calculations, *p ≤0.05, **p ≤0.01, ***p ≤0.001, ****p ≤0.0001. (e) PCA plot of RNA-seq data from Nr4aTKO or WT CAR-TILs. (f) Normalized enrichment scores (NES) of gene sets defined from pairwise comparisons of effector, memory and exhausted CD8+ T cells from LCMV-infected mice11. Enrichment score calculated using a Kolmogorov-Smirnov test, as implemented in gene set enrichment analysis (GSEA). (g) GSEA of RNA-seq data from Nr4aTKO and WT CAR-TILs displayed as enrichment plots, ranking genes by log2 fold change in expression between those conditions. The false discovery rate (FDR) for both (f, g) is controlled at a level of 5% by the Benjamini–Hochberg correction. For (e-g), data are from two independent experiments each consisting of 1–2 technical replicates.
Extended Data Figure 9 |. Nr4a family members bind to predicted Nr4a binding motifs that are more accessible in the WT CAR-TILs compared to the Nr4aTKO CAR-TILs, and regions more accessible in WT compared to Nr4aTKO CAR-TILs are more accessible in CA-RIT-NFAT1- and Nr4a1/2/3-transduced cells.
(a) Right top, histogram view showing expression of Nr4a in cells ectopically expressing HA-tagged versions of Nr4a1, Nr4a2, Nr4a3; data are representative of 2 independent experiments. Middle, genome browser views of the Ccr7, Ccr6, Ifng loci for WT CAR-TILs compared to Nr4aTKO CAR-TILs, including binding motifs for NFAT, Nr4a (Nur77), bZIP, NFkB, and the location of the qPCR primers used. Scale range is 0–1000 for all tracks and data are mean of two independent experiments. Right, bar plots showing enrichment of Nr4a at regions probed; data representative of 2 independent experiments consisting of three technical replicates each. (b) Genome browser views of the Il21 (top), Tnf (bottom) loci incorporating WT CAR-TILs compared to Nr4aTKO CAR-TILs, including binding motifs for NFAT, Nr4a (Nur77), bZIP, NFkB. Scale range is 0–600 for all tracks except Tnf for which the scale is 0–1000; data are mean of two independent experiments. (c) Top four panels, ATAC-seq data from Nr4aTKO and WT CAR-TILs compared with data from cells ectopically expressing CA-RIT-NFAT1, Nr4a1, Nr4a2, or Nr4a3. Bottom panel, ATAC-seq data from Nr4aTKO and WT CAR-TILs compared with data from cultured cells stimulated with PMA/ionomycin.
Extended Data Figure 10 |. Nr4a family members show a moderate decrease in mRNA expression in antigen-specific cells from LCMV-infected mice treated with anti-PDL1 or IgG control.
(a) MA plots of genes differentially expressed in cells treated with anti-PDL1 compared to cells treated with IgG control, highlighting two different categories of differentially expressed genes: those with adjusted p-value <0.1 and log2FoldChange ≥0.5 or ≤−0.5 (lighter colors); and those with adjusted p-value < 0.1 and log2FoldChange ≥1 or ≤−1 (darker colors). Selected genes are labeled. Displayed are the number of genes in each category. The sequencing data in this analysis was obtained from [ref.19]. Wald test was performed to calculate p-values, as implemented in DESeq2; p-values were adjusted using the Benjamini-Hochberg method.
Supplementary Material
Acknowledgements
We would like to thank C. Kim, L. Nosworthy, R. Simmons, D. Hinz, and C. Dillingham of the LJI Flow Cytometry Core Facility for cell sorting; J. Day, S. Wlodychak, and C. Kim of the LJI Next Generation Sequencing Facility for next-generation sequencing; S. Schoenberger for B16-OVA cells; A. W. Goldrath for MC-38 cells; V. Wong, S. Trifari, and G. Mognol for advice and discussions; B. Peters for statistics discussions; and the Department of Laboratory Animal Care (DLAC) and the animal facility for excellent support. This work was funded in part by the US National Institutes of Health (NIH) AI109842, AI040127, S10OD016262, S10 RR027366 (A.R.); NIH T32 GM007752 and PhRMA Foundation Paul Calabresi Medical Student Research Fellowship (J.C.); UC MEXUS-CONACYT Fellowship (I.F.L.-M.); AACR-Genentech Immuno-oncology Research Fellowship, 18-40-18-SEO (H.S.); Cancer Research Institute (CRI) Irvington Postdoctoral Fellowship (C.-W.J.L.); Fraternal Order of Eagles Fellow of the Damon Runyon Cancer Research Foundation, DRG-2069–11 (J.P.S.-B.); JSPS KAKENHI Scientific Research (B) 16KT0114 (T.S.); and JSPS KAKENHI (S) JP17H06175, Challenging Research (P) JP18H05376, and Advanced Research & Development Programs for Medical Innovation (AMED-CREST) JP18gm0510019, JP18gm1110009 (A.Y.).
Footnotes
The authors declare no competing financial or non-financial interests.
Supplementary Information is available in the online version of the paper.
Reviewer Information
Nature thanks (named reviewers A, B, C) and the other anonymous reviewer(s) for their contribution to the peer review of this work.
References
- 1.Davila ML et al. Efficacy and toxicity management of 19–28z CAR-T cell therapy in B cell acute lymphoblastic leukemia. Sci. Transl. Med 6, (2014). [DOI] [PMC free article] [PubMed] [Google Scholar]
- 2.Maude SL et al. Chimeric Antigen Receptor T Cells for Sustained Remissions in Leukemia. N. Engl. J. Med 371, 1507–1517 (2014). [DOI] [PMC free article] [PubMed] [Google Scholar]
- 3.Ahmed N et al. Human Epidermal Growth Factor Receptor 2 (HER2)–Specific Chimeric Antigen Receptor–Modified T Cells for the Immunotherapy of HER2-Positive Sarcoma. J. Clin. Oncol 33, 1688–1696 (2015). [DOI] [PMC free article] [PubMed] [Google Scholar]
- 4.O’Rourke DM et al. A single dose of peripherally infused EGFRvIII-directed CAR-T cells mediates antigen loss and induces adaptive resistance in patients with recurrent glioblastoma. Sci. Transl. Med 9, (2017). [DOI] [PMC free article] [PubMed] [Google Scholar]
- 5.Moon EK et al. Multifactorial T cell Hypofunction That is Reversible Can Limit the Efficacy of Chimeric Antibody Receptor-transduced Human T cells in Solid Tumors. Clin. Cancer Res 20, 4262–73 (2014). [DOI] [PMC free article] [PubMed] [Google Scholar]
- 6.Wherry EJ T cell exhaustion. Nat. Immunol 131, 492–499 (2011). [DOI] [PubMed] [Google Scholar]
- 7.Wherry EJ et al. Molecular Signature of CD8+ T Cell Exhaustion during Chronic Viral Infection. Immunity 27, 670–684 (2007). [DOI] [PubMed] [Google Scholar]
- 8.Schietinger A et al. Tumor-Specific T Cell Dysfunction Is a Dynamic Antigen-Driven Differentiation Program Initiated Early during Tumorigenesis. Immunity 45, (2016). [DOI] [PMC free article] [PubMed] [Google Scholar]
- 9.Schietinger A & Greenberg PD Tolerance and exhaustion: Defining mechanisms of T cell dysfunction. Trends in Immunology 35, (2014). [DOI] [PMC free article] [PubMed] [Google Scholar]
- 10.Martinez GJ et al. The Transcription Factor NFAT Promotes Exhaustion of Activated CD8+ T Cells. Immunity 42, (2015). [DOI] [PMC free article] [PubMed] [Google Scholar]
- 11.Scott-Browne JP et al. Dynamic Changes in Chromatin Accessibility Occur in CD8+ T Cells Responding to Viral Infection. Immunity 45, 1327–1340 (2016). [DOI] [PMC free article] [PubMed] [Google Scholar]
- 12.Mognol GP et al. Exhaustion-associated regulatory regions in CD8 + tumor-infiltrating T cells. Proc. Natl. Acad. Sci 201620498 (2017). doi: 10.1073/pnas.1620498114 [DOI] [PMC free article] [PubMed] [Google Scholar]
- 13.Philip M et al. Chromatin states define tumour-specific T cell dysfunction and reprogramming. Nature 545, 452 (2017). [DOI] [PMC free article] [PubMed] [Google Scholar]
- 14.Tirosh I et al. Dissecting the multicellular ecosystem of metastatic melanoma by single-cell RNA-seq. Science 352, (2016). doi: 10.1126/science.aad0501 [DOI] [PMC free article] [PubMed] [Google Scholar]
- 15.Sen DR et al. The epigenetic landscape of T cell exhaustion. Science 354, (2016). [DOI] [PMC free article] [PubMed] [Google Scholar]
- 16.Nicholson IC et al. Construction and characterisation of a functional CD19 specific single chain Fv fragment for immunotherapy of B lineage leukaemia and lymphoma. Mol. Immunol 34, 1157–1165 (1997). [DOI] [PubMed] [Google Scholar]
- 17.Brogdon J, June CH, Loew A, Maus M & Scholler J Treatment of cancer using humanized anti-cd19 chimeric antigen receptor (2014).
- 18.Im SJ et al. Defining CD8+T cells that provide the proliferative burst after PD-1 therapy. Nature (2016). doi: 10.1038/nature19330 [DOI] [PMC free article] [PubMed] [Google Scholar]
- 19.Pauken KE et al. Epigenetic stability of exhausted T cells limits durability of reinvigoration by PD-1 blockade. Science 354, (2016). [DOI] [PMC free article] [PubMed] [Google Scholar]
- 20.Sekiya T et al. Nr4a receptors are essential for thymic regulatory T cell development and immune homeostasis. Nat. Immunol 14, 230–237 (2013). [DOI] [PubMed] [Google Scholar]
- 21.Leong YA et al. CXCR5+follicular cytotoxic T cells control viral infection in B cell follicles. Nat. Immunol (2016). doi: 10.1038/ni.3543 [DOI] [PubMed] [Google Scholar]
- 22.He R et al. Follicular CXCR5-expressing CD8+T cells curtail chronic viral infection. Nature (2016). doi: 10.1038/nature19317 [DOI] [PubMed] [Google Scholar]
- 23.Utzschneider DT et al. T Cell Factor 1-Expressing Memory-like CD8+T Cells Sustain the Immune Response to Chronic Viral Infections. Immunity (2016). doi: 10.1016/j.immuni.2016.07.021 [DOI] [PubMed] [Google Scholar]
- 24.Subramanian A et al. Gene set enrichment analysis: A knowledge-based approach for interpreting genome-wide expression profiles. Proc. Natl. Acad. Sci 102, 15545–15550 (2005). [DOI] [PMC free article] [PubMed] [Google Scholar]
- 25.Nowyhed HN et al. The Nuclear Receptor Nr4a1 Controls CD8 T Cell Development Through Transcriptional Suppression of Runx3. Sci. Rep 5, 9059 (2015). [DOI] [PMC free article] [PubMed] [Google Scholar]
- 26.Milner JJ et al. Runx3 programs CD8+T cell residency in non-lymphoid tissues and tumours. Nature (2017). doi: 10.1038/nature24993 [DOI] [PMC free article] [PubMed] [Google Scholar]
- 27.Harant H & Lindley IJD Negative cross-talk between the human orphan nuclear receptor Nur77/NAK-1/TR3 and nuclear factor-κB. Nucleic Acids Res (2004). doi: 10.1093/nar/gkh856 [DOI] [PMC free article] [PubMed] [Google Scholar]
- 28.Saijo K et al. A Nurr1/CoREST Pathway in Microglia and Astrocytes Protects Dopaminergic Neurons from Inflammation-Induced Death. Cell 137, 47–59 (2009). [DOI] [PMC free article] [PubMed] [Google Scholar]
- 29.Best JA et al. Transcriptional insights into the CD8 + T cell response to infection and memory T cell formation. Nat. Immunol 14, 404–412 (2013). [DOI] [PMC free article] [PubMed] [Google Scholar]
- 30.Spolski R & Leonard WJ Interleukin-21: Basic Biology and Implications for Cancer and Autoimmunity. Annu. Rev. Immunol 26, 57–79 (2008). [DOI] [PubMed] [Google Scholar]
- 31.Larkin J et al. Combined Nivolumab and Ipilimumab or Monotherapy in Untreated Melanoma. N. Engl. J. Med 373, 23–34 (2015). [DOI] [PMC free article] [PubMed] [Google Scholar]
Methods References
- 32.Kochenderfer JN, Yu Z, Frasheri D, Restifo NP & Rosenberg SA Adoptive transfer of syngeneic T cells transduced with a chimeric antigen receptor that recognizes murine CD19 can eradicate lymphoma and normal B cells. Blood 116, 3875–3886 (2010). [DOI] [PMC free article] [PubMed] [Google Scholar]
- 33.Roybal KT et al. Precision Tumor Recognition by T Cells with Combinatorial Antigen-Sensing Circuits. Cell 164, 770–779 (2016). [DOI] [PMC free article] [PubMed] [Google Scholar]
- 34.Kadkhodaei B et al. Nurr1 Is Required for Maintenance of Maturing and Adult Midbrain Dopamine Neurons. J. Neurosci (2009). doi: 10.1523/JNEUROSCI.3910-09.2009 [DOI] [PMC free article] [PubMed] [Google Scholar]
- 35.Lio CW et al. Tet2 and Tet3 cooperate with B-lineage transcription factors to regulate DNA modification and chromatin accessibility. Elife 5, (2016). [DOI] [PMC free article] [PubMed] [Google Scholar]
- 36.Buenrostro JD, Giresi PG, Zaba LC, Chang HY & Greenleaf WJ Transposition of native chromatin for fast and sensitive epigenomic profiling of open chromatin, DNA-binding proteins and nucleosome position. Nat. Methods 10, (2013). [DOI] [PMC free article] [PubMed] [Google Scholar]
- 37.Langmead B, Trapnell C, Pop M & Salzberg S Ultrafast and memory-efficient alignment of short DNA sequences to the human genome. Genome Biol 10, R25 (2009). [DOI] [PMC free article] [PubMed] [Google Scholar]
- 38.Chavez L et al. Computational analysis of genome-wide DNA methylation during the differentiation of human embryonic stem cells along the endodermal lineage. Genome Res 20, 1441–1450 (2010). [DOI] [PMC free article] [PubMed] [Google Scholar]
- 39.Palpant T Java Genomics Toolkit (2016). Available at: https://github.com/timpalpant/java-genomics-toolkit.
- 40.Consortium EP et al. An integrated encyclopedia of DNA elements in the human genome. Nature 489, 57–74 (2012). [DOI] [PMC free article] [PubMed] [Google Scholar]
- 41.Kundaje A Blacklisted genomic regions for functional genomics analysis (2014). Available at: https://sites.google.com/site/anshulkundaje/projects/blacklists.
- 42.Lawrence M et al. Software for Computing and Annotating Genomic Ranges. PLoS Comput. Biol 9, (2013). [DOI] [PMC free article] [PubMed] [Google Scholar]
- 43.Ritchie ME et al. limma powers differential expression analyses for RNA-sequencing and microarray studies. Nucleic Acids Res 43, e47 (2015). [DOI] [PMC free article] [PubMed] [Google Scholar]
- 44.Heinz S et al. Simple Combinations of Lineage-Determining Transcription Factors Prime cis-Regulatory Elements Required for Macrophage and B Cell Identities. Mol. Cell 38, 576–589 (2010). [DOI] [PMC free article] [PubMed] [Google Scholar]
- 45.Picelli S et al. Full-length RNA-seq from single cells using Smart-seq2. Nat. Protoc 9, 171–181 (2014). [DOI] [PubMed] [Google Scholar]
- 46.Dobin A et al. STAR: Ultrafast universal RNA-seq aligner. Bioinformatics 29, 15–21 (2013). [DOI] [PMC free article] [PubMed] [Google Scholar]
- 47.Love MI, Huber W & Anders S Moderated estimation of fold change and dispersion for RNA-seq data with DESeq2. Genome Biol 15, (2014). [DOI] [PMC free article] [PubMed] [Google Scholar]
- 48.van Dijk D et al. Recovering Gene Interactions from Single-Cell Data Using Data Diffusion. Cell (2018). doi: 10.1016/j.cell.2018.05.061 [DOI] [PMC free article] [PubMed] [Google Scholar]
Associated Data
This section collects any data citations, data availability statements, or supplementary materials included in this article.
Supplementary Materials
Data Availability Statement
All data generated and supporting the findings of his study are available within the paper. RNA-seq and ATAC-seq data are available in the Gene Expression Omnibus (GEO) database under the SuperSeries reference number GSE123739. Source data for Figures 2, 4, and Extended Data Figures 2, 4, 7, 8, 9 are provided in Tables S1–S5. Additional source data is provided in the online version of the paper. Additional information and materials will be made available upon request.


