Abstract
One major difference between limb and extraocular muscles (EOM) is the presence of an enriched population of Pitx2-positive myogenic precursor cells in EOM compared to limb muscle. We hypothesize that retinoic acid regulates Pitx2 expression in EOM myogenic precursor cells and that its effects would differ in leg muscle. The two muscle groups expressed differential retinoic acid receptor (RAR) and retinoid X receptor (RXR) levels. RXR co-localized with the Pitx2-positive cells but not with those expressing Pax7. EOM-derived and LEG-derived EECD34 cells were treated with vehicle, retinoic acid, the RXR agonist bexarotene, the RAR inverse agonist BMS493, or the RXR antagonist UVI 3003. In vitro, fewer EOM-derived EECD34 cells expressed desmin and fused, while more LEG-derived cells expressed desmin and fused when treated with retinoic acid compared to vehicle. Both EOM and LEG-derived EECD34 cells exposed to retinoic acid showed a higher percentage of cells expressing Pitx2 compared to vehicle, supporting the hypothesis that retinoic acid plays a role in maintaining Pitx2 expression. We hypothesize that retinoic acid signaling aids in the maintenance of large numbers of undifferentiated myogenic precursor cells in the EOM, which would be required to maintain EOM normalcy throughout a lifetime of myonuclear turnover.
Keywords: Extraocular muscle, Retinoic acid, Muscle stem cells, Retinoic acid signaling
1. Introduction
The extraocular muscles (EOMs) are different from limb skeletal muscles developmentally, anatomically, physiologically, and biochemically [1]. One of the more unusual properties of uninjured adult EOMs is their continuous and significant levels of myonuclear remodeling throughout life due to the presence of chronically activated myogenic precursor cells [2–5]. Recent studies using a reporter mouse for Pax7, a transcription factor expressed ubiquitously in satellite cells of skeletal muscle [6], confirmed these earlier studies and showed a significant level of myonuclear turnover in the EOM [7,8]. In contrast, uninjured adult limb skeletal muscles contain largely quiescent Pax7-positive myogenic precursor cells, and only after injury or in disease is there significant activation and proliferation of these cells [6,9–12].
Other significant differences between EOMs and body muscle also exist. For example, distinct transcription factors are required for the early determination, development, and maintenance of EOMs compared to limb muscle [13,14]. Specifically, the transcription factor Pitx2 is required for the development of EOMs, but is not required for the development of limb skeletal muscle [15]. Pitx2 expression is also maintained at high levels in adult EOMs compared to limb skeletal muscle [16,17], and this high level of Pitx2 expression is necessary to maintain characteristic properties of adult EOMs [16–18].
Myogenic precursor cells within adult skeletal muscle are a diverse population, and this diversity is amplified in adult EOMs. Overall, the EOMs have an elevated density of different types of myogenic precursor cells compared to normal uninjured adult limb muscles [19,20]. For example, there is an elevated density of Pax7-positive cells in EOMs compared to limb muscle [21] as well as an elevated population of EECD34 cells, identified using flow cytometry, which are positive for CD34 and negative for Seal, CD45, and CD31 [19]. In a recent study, we described a significantly elevated population of myogenic precursor cells in EOMs that express Pitx2, which are essentially a non-over-lapping population from those cells that express Pax7 [17,20]. The roles played by these heterogeneous myogenic precursor cell populations in the function of the EOMs are unclear. Our recent study showed that high dose gamma irradiation (18 Gy) in a mouse model of muscular dystrophy differentially affected Pitx2 and Pax7 myogenic precursor cells and resulted in the transient appearance of dystrophic changes – centrally located myonuclei – in the irradiated EOMs. This study suggests that these different precursor populations play different temporal and/or functional roles in EOM myofiber remodeling, repair, and regeneration [21].
The factor(s) that maintain high levels of Pitx2 expression in adult EOMs are currently unknown. One candidate factor is retinoic acid, a vitamin A derivative. Retinoic acid regulates Pitx2 expression during ocular and craniofacial development [22,23]. Without proper retinoic acid signaling during development, the EOMs do not form [24,25]. Recent studies have implicated retinoic acid in globally regulating myogenic differentiation [26]. We tested the hypotheses that retinoic acid signaling differs in adult EOM and limb muscle myogenic precursor cells and that retinoic acid controls the maintenance of high levels of Pitx2 expression in adult EOMs and promotes proper function of the Pitx2-positive EOM myogenic precursor cells.
To test this hypothesis, we compared the expression of RARα, RARγ, RXRα, and RXRγ proteins in mouse EOMs and limb muscle. Next, the functional effects of modulating retinoic acid signaling were assessed in myogenic precursor cells in vitro isolated from mouse EOMs and limb muscle. Finally, to determine if retinoic acid acts to maintain Pitx2 expression in adult EOM myogenic precursor cells, the effect of retinoic acid signaling on expression of Pitx2 in EECD34 cells in vitro was assessed following addition of retinoic acid, RXR agonist, or inhibition of RXR function.
2. Results
2.1. EOMs express different levels of retinoic acid receptor and retinoid X receptor protein than limb skeletal muscle
Retinoic acid receptors (RARs) are nuclear receptors involved in retinoic acid signaling. The canonical retinoic acid signaling pathway involves the dimerization of RAR with retinoid X receptors (RXR) [27]. The RAR-RXR dimers then bind to retinoic acid response elements and stimulate the transcription of retinoic acid responsive genes. However, recent data show that these nuclear receptors can be differentially regulated and can each function in an independent manner in cells [28–31]. To determine if retinoic acid receptors were differentially expressed in EOMs compared to limb muscle, we used western blots to assess the amount of retinoic acid receptor alpha (RARα) and gamma (RARγ) expressed in EOM and LEG whole tissue lysates. RARα protein levels were significantly higher in LEG whole tissue lysates compared to EOM whole tissue lysates, with LEG samples expressing 4-fold more RARα than the EOMs (Fig. 1A, B). However RARγ levels were not statistically significantly different in LEG whole tissue lysates compared to EOM whole tissue lysates (Fig. 1C, D). In contrast, retinoid X receptor alpha (RXRα) and gamma (RXRγ) protein levels were significantly higher in EOM whole tissue lysates, with EOM expressing over almost 91.7% more RXRα than LEG whole tissue lysates (Fig. 1E, F) and 106% more RXRγ (Fig. 1G, H).
Fig. 1. EOM express different levels of retinoic acid and retinoid X receptor protein than limb skeletal muscle.
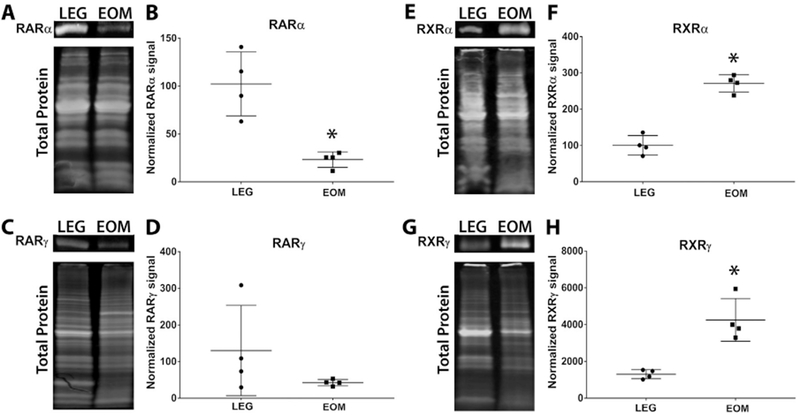
Representative western blot of whole tissue lysates from wild-type mouse LEG and EOM probed for (A) RARα, (C) RARγ, (E) RXRα, (G) RXRγ, and compared to total protein. Relative Intensity of (B) RARα, (D) RARγ, (F) RXRα, and (H) RXRγ proteins In wild-type mouse LEG and EOM normalized to total protein. * Indicates significant difference from EOM (P ≤ 0.05).
2.2. RXRα co-expresses with Pitx2 but not Pax7
The potential myogenic identity of the precursor cells expressing RXRα was examined in tissue sections of EOMs from adult mice. Nuclear expression of RXRα was evident in sections from EOM (Figs. 2 and 3), but was only sparsely found in sections of leg muscle (not shown). The RXRα positive nuclei were seen to co-express Pitx2 (Fig. 2). Using a Pax7 reporter mouse [8], the Pax7-expressing satellite cells did not co-express RXRα (Fig. 3). This suggested a strong interrelationship between RXRα and Pitx2 expression. Note also the RXRα-positive myonuclei in addition to the RXRα-positive cells outside of the sarcolemma (Fig. 3D).
Fig. 2. RXRα co-expresses with Pitx2.
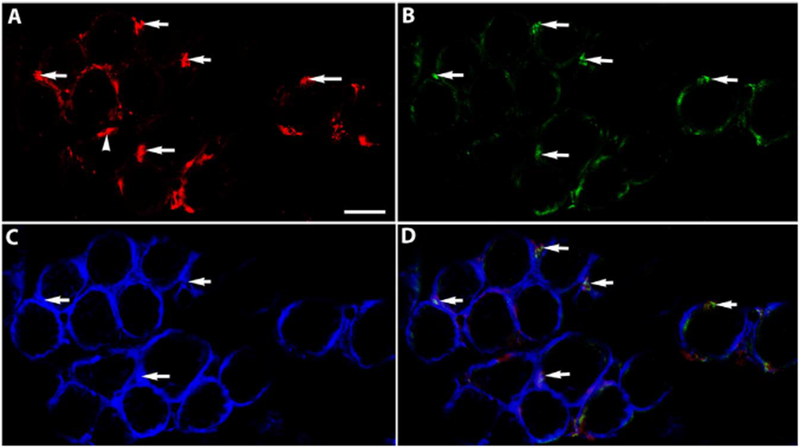
Cryosection of normal adult mouse EOM immunostained for (A) Pitx2 (red), (B) RXRα (green), (C) dystrophin (blue), and (D) Is the merged Image. Arrows Indicate examples of co-expression. Arrowhead Indicates a Pitx2 positive nucleus that did not also express RXRα. Note that these myogenic precursor cells also express dystrophin. Scale bar is 20 μm.
Fig. 3. RXRα does not co-express with Pax7.
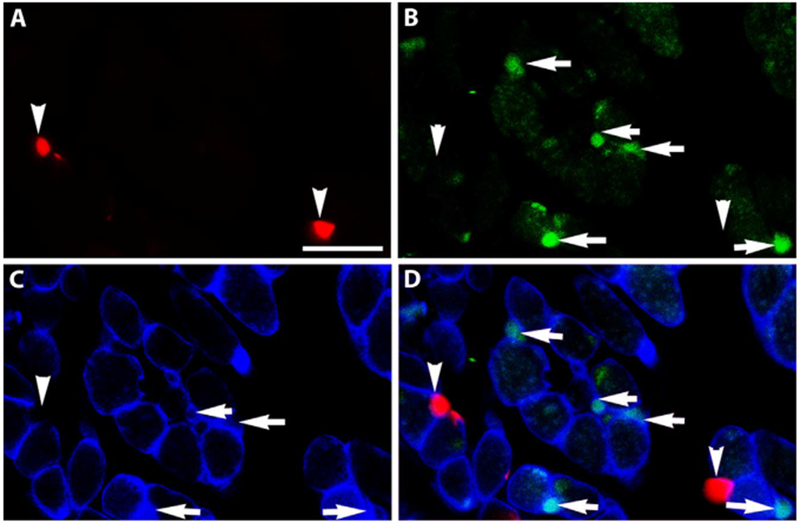
Cryosection of an EOM from a Pax7-reporter mouse (red). The section was immunostained for (B) RXRα (green), (C) dystrophin (blue), and (D) is the merged image. Arrowheads indicate Pax7-positive cells and arrows indicate RXRα -positive cells. No co-expression was seen. Note there are also RXRα-positive nuclei (green) inside the sarcolemma. Scale bar is 20 μm.
2.3. EOM-derived EECD34 cells maintain Pitx2 expression in vitro
EECD34 cells (CD34+/Sca1−/CD45−/CD31−) are a subpopulation of myogenic precursor cells, the majority of which are positive for Pitx2 [17,19]. To determine if EECD34 cells derived from the EOMs retained their Pitx2 expression in vitro, cells were immunostained one, two, three, and four days after plating in proliferation media. At one and two days after the EECD34 cells were plated in proliferation media, essentially 100% of the cells were Pitx2 positive (Fig. 4A, B, D). In these cultures, dividing cells were often present (Fig. 4A), and both daughter cells retained their Pitx2 expression at these time points. By 72 h in vitro, 92.3 ± 3.6% of the cells were still Pitx2 positive (Fig. 4C, D), and the vast majority of dividing cells were still both Pitx2 positive (not shown). By 96 h in proliferation medium, 95.0 ± 0.6% % of the cells were Pitx2-positive. This demonstrates that at the time of the proliferation assay, the EECD34 cells retained their Pitx2 expression.
Fig. 4. EECD34 cells maintain Pitx2 expression in vitro.
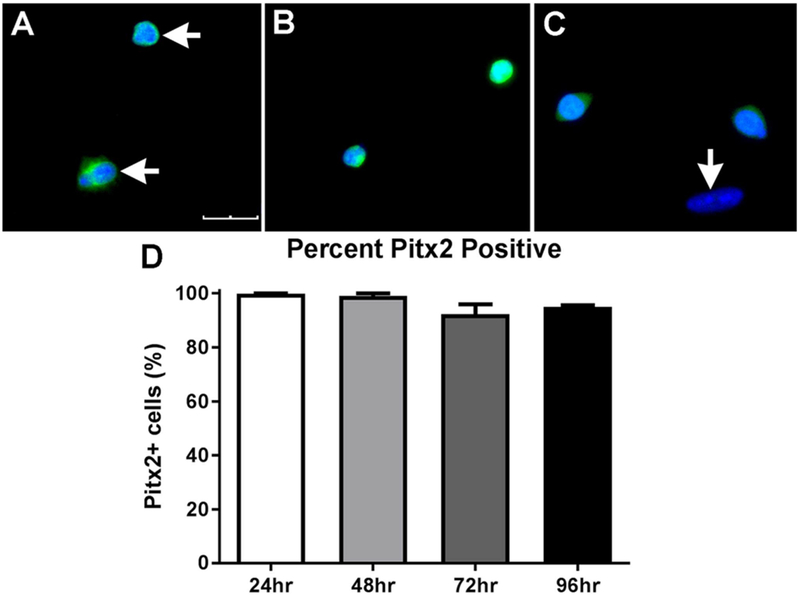
Representative images of EECD34 cells from wild type mouse EOM after (A) 24 h, (B) 48 h, or (C) 72 h in vitro in proliferation media immunostained for Pitx2 (green) and DAPI (blue). The bottom cell in (A) is dividing, and both are Pitx2-positive. Horizontal arrows indicate Pitx2 positive cells. Vertical arrow indicates a cell negative for Pitx2 (C). Scale bar is 30 μm. (D) Percentage of EECD34 cells from wild-type mouse EOM positive for Pitx2 after 24, 48, 72, and 96 h in vitro.
2.4. EECD34 cell proliferation is unchanged by additional retinoic acid or reduced retinoic acid signaling
Knockdown of Pitx2 expression in EECD34 cells in vitro significantly reduced their proliferation rate [17]. Given the potential role for retinoic acid to regulate Pitx2 expression in adulthood, as it does during development, and the significant role played by Pitx2 in regulating the proliferation rates of EECD34 cells, EECD34 cell proliferation rates were assessed following the addition of retinoic acid and retinoic acid signaling modulators. The effect of retinoic acid, the pan-RAR inverse agonist BMS493, and the RXR antagonist UVI 3003 on the proliferation rate of EECD34 cells in vitro was determined by calculating the percentage of cells that incorporated the thymidine analog EdU following treatment. Addition of retinoic acid, BMS493, or UVI 3003 did not change the proliferation rate of EOM-derived or LEG-derived EECD34 cells compared to control cells (Fig. 5A–E). However, in EOM-derived EECD34 cells there was a significant difference in proliferation rates between cells treated with the RAR inverse agonist compared to those treated with retinoic acid, with RAR inverse agonist treated cells having 29.7% more EdU-positive cells than retinoic acid treated cells (Fig. 5E). Consistent with previous results [17], there were significantly more EdU-positive EOM-derived EECD34 cells compared to LEG-derived EECD34 cells under all conditions except the retinoic acid treatment, with proliferation rates 44.9% higher in control cultures, 30.3% higher in the presence of retinoic acid, 72.1% higher in the presence of the RAR inverse agonist, and 52.5% higher in the presence of the RXR antagonist (Fig. 5E).
Fig. 5. EECD34 cell proliferation is unchanged by additional retinoic acid or reduced retinoic acid signaling.
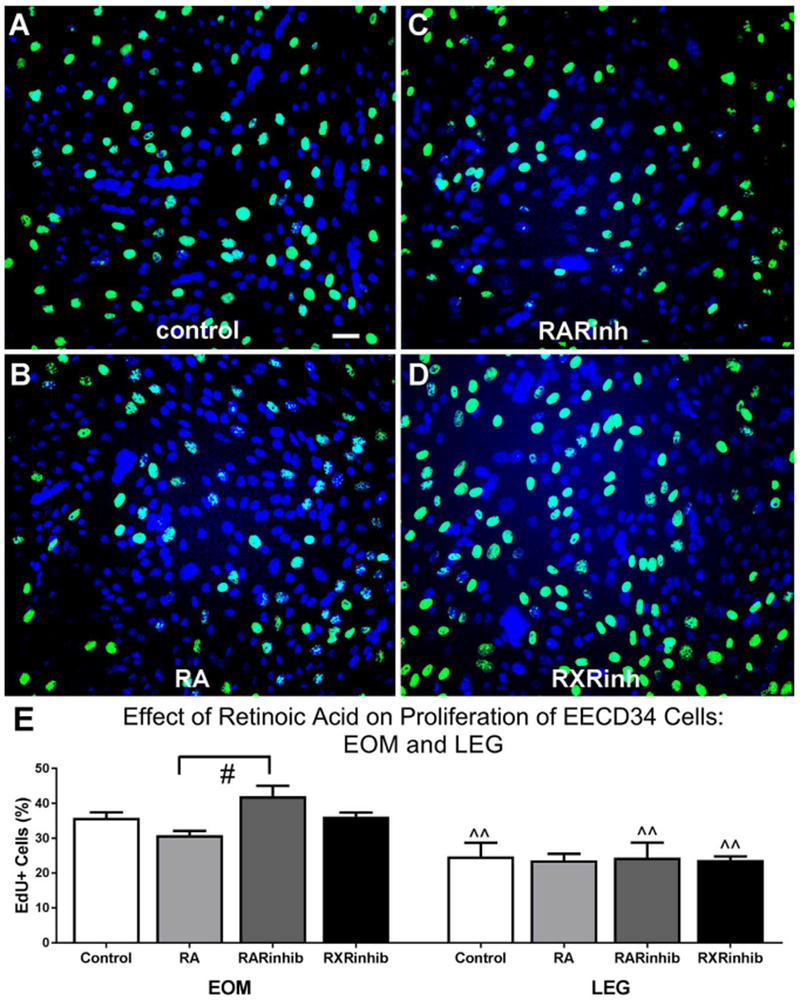
Representative images of EECD34 cells from wild-type mouse EOM treated with (A) vehicle (control), (B) retinoic acid (RA), (C) the RAR inverse agonist BMS493 (RARinh), or (D) the RXR antagonist UVI 3003 (RXRinh) and stained for EdU (green) and DAPI (blue). (E) Percentage of EECD34 cells from EOM and LEG that have incorporated EdU following treatment with vehicle (control), retinoic acid (RA), BMS493 (RARinhib), or UVI 3003 (RXRinhib). Scale bar is 20 μm. # indicates significant difference from EOM EECD34 cells treated with retinoic acid ^^ indicates significant difference from EOM with the same treatment. Data are statistically significant at p ≤ 0.05.
2.5. EECD34 cell fusion and desmin expression is changed after modulation of retinoic acid signaling
Knockdown of Pitx2 expression in EECD34 cells in vitro significantly reduced their fusion index [17]. Given the potential role for retinoic acid to regulate Pitx2 expression in adulthood as it does during development, and the role of Pitx2 in regulating fusion of EECD34 cells, we investigated if the addition of retinoic acid, BMS493, or UVI 3003 altered the fusion and desmin expression of EECD34 cells in vitro. Following 72 h incubation in fusion media containing vehicle, retinoic acid, BMS493, or UVI 3003, the cells were immunostained for desmin, followed by hematoxylin staining (Fig. 6), counted, and the cell fusion index and percent of differentiated cells were calculated. Under all conditions the LEG-derived EECD34 cells had a significantly greater fusion index compared to EOM-derived EECD34 cells (Fig. 7A). For vehicle treated control cells there was a 58.6% difference, retinoic acid treated cells there was a 123.3% difference, BMS493 treated cells there was a 36.3% difference, and UVI 3003 treated cells there was a 65.4% difference in fusion index between EOM-derived and LEG-derived EECD34 cells.
Fig. 6. EECD34 cell fusion and differentiation following retinoic acid signaling modulation.
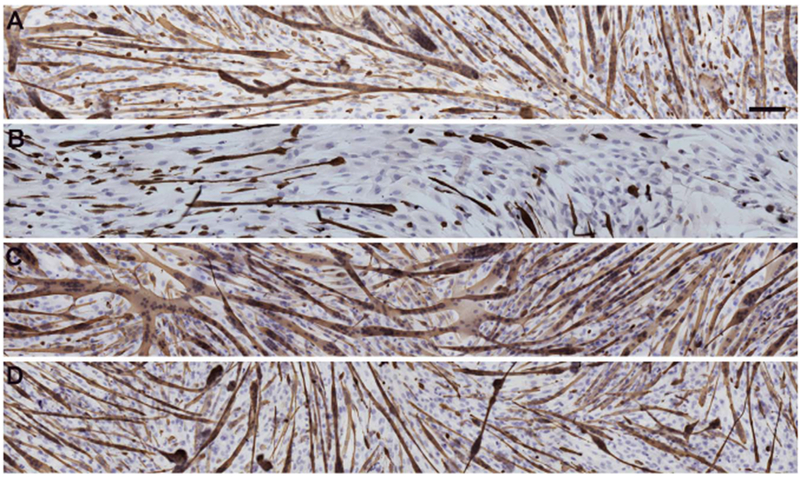
Reconstruction of representative cultures of EECD34 cells from mouse EOM in fusion media treated with (A) vehicle, (B) retinoic acid, (C) BMS493, or (D) UVI 3003. Cultures were stained with desmin (brown) and hematoxylin (purple). Scale bar is 100 μm.
Fig. 7. EECD34 cell fusion and differentiation is changed after modulation of retinoic acid signaling.
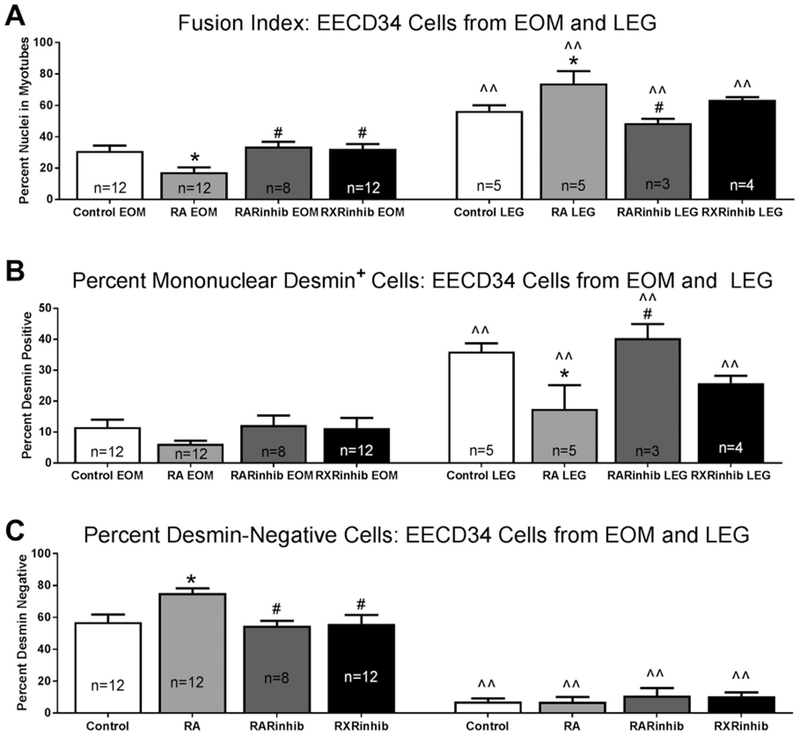
(A) Fusion index of EECD34 cells from mouse EOM and LEG treated with vehicle (control), retinoic acid (RA), the RAR inverse agonist BMS493 (RARinhib), or the RXR antagonist UVI 3003 (RXRinhib). (B) Percentage of desmin-positive myoblasts in EECD34 cell cultures from mouse EOM and LEG treated with vehicle (control), retinoic acid (RA), BMS493 (RARinhib), or UVI 3003 (RXRinhib). (C) Percentage of desmin-negative EECD34 cells from mouse EOM and LEG treated with vehicle (control), retinoic acid (RA), BMS493 (RARinhib), or UVI 3003 (RXRinhib). * indicates significant difference from vehicle (control). # indicates significant difference from retinoic acid (RA) treatment. ^^ indicates significant difference from EOM with the same treatment. Data are statistically significant at p ≤ 0.05.
For the EOM-derived EECD34 cells, the cells treated with retinoic acid showed a significant 43.4% lower fusion index compared to vehicle treated control cells (Fig. 7A). Treatment of the EOM-derived EECD34 cells with the RAR inverse agonist or RXR antagonist resulted in a similar fusion index compared to the vehicle-treated control cells. In addition, the fusion rate of the EOM-derived EECD34 cells treated with either the RAR inverse agonist or RXR antagonist were significantly greater than the cells treated with retinoic acid (Fig. 7A). In contrast, treatment of the LEG-derived EECD34 cells with retinoic acid resulted in a 31% higher fusion index compared to the vehicle treated cells. There was no significant difference in the fusion index after treatment of the LEG-derived EECD34 cells with the two receptor inhibitors compared to control. However, there was a significant 41.2% difference in the fusion index between the LEG-derived EECD34 cells treated with retinoic acid and those treated with BMS493 (Fig. 7A). For the LEG-derived EECD34 cells, there was no significant difference in the fusion index after RXR inhibition compared to any of the other treatments.
Mononuclear cells that were positive for desmin indicated that they had differentiated but did not fuse with other cells. All the LEG-derived EECD34 cultures had a higher percentage of desmin-positive mononuclear cells than the EOM-derived EECD34 cells under similar culture conditions (Fig. 7B). There were no significant differences in the percentage of desmin-positive mononuclear cells in the EOM-derived EECD34 cells treated with vehicle, retinoic acid, BMS493, or UVI 3003 (Fig. 7B).
When the cultures of the LEG-derived EECD34 cells were examined, there were significantly fewer mononuclear desmin-positive cells after retinoic acid treatment compared to the control cultures, where 17.5 ± 7.7% were desmin-positive in retinoic acid treated cells compared to 36.0 ± 2.6% in vehicle treated control cells (Fig. 7B). This represented a 69.3% difference. There were also significantly more desmin-positive mononuclear cells after treatment of the LEG-derived EECD34 cells with the RAR inverse agonist compared to those treated with the retinoic acid, representing a 79% difference. There was no significant difference in the number of desmin positive LEG-derived EECD34 cells after RXR inhibition compared to any of the other treatments.
Desmin-negative cells were also analyzed, as these cells suggest maintenance of an undifferentiated state (Fig. 7C). For each condition, there were significantly greater numbers of desmin-negative cells for the EOM-derived EECD34 cells than for the LEG-derived EECD34 cells, with a 154.4% difference for the vehicle treated cells, an 165.5% difference for the retinoic acid treated cells, a 133.5% difference for the RAR inverse agonist treated cells, and a 136% difference for the cells treated with RXR antagonist (Fig. 7C). In the EOM-derived EECD34 cells treated with retinoic acid, there were significantly more desmin-negative cells than in vehicle treated control cultures, 75.26 ± 3% compared to 57.15 ± 4.6% for the control cultures, a difference of 31.7% (Fig. 7C). While they were not significantly different from the control cultures, both the RAR inverse agonist and RXR antagonist resulted in significantly fewer desmin-negative cells in the EOM-derived EECD34 cells compared to those treated with retinoic acid, at 54.8 ± 3.1% and 56.1 ± 5.5% respectively, representing differences of approximately 30%. There were no significant differences in percent of nuclei that were desmin-negative in the LEG-derived EECD34 cells between any of the treatment conditions.
The mean length of the myotubes that formed in vitro was determined for all treatment conditions. There were no significant differences in the mean length of myotubes in any of the 4 conditions from the EOM-derived EECD34 cells (Fig. 8). However, retinoic acid treatment of the LEG-derived EECD34 cells resulted in significantly longer myotubes in vitro, 438.2 ± 59.2 μm in the retinoic acid treated cells compared to 256.9 ± 13.8 μm in control cells (Fig. 8). This was a 52.1% difference in length between retinoic acid treated cells and control cells. Myotubes from retinoic acid treated LEG-derived EECD34 cells were also significantly longer than myotubes from LEG-derived EECD34 cells treated with either RAR inverse agonist or RXR antagonist. The mean myotube length in the retinoic acid treated cultures was 63.9% and 40% longer than in the cultures treated with RAR inverse agonist and RXR antagonist, respectively.
Fig. 8. LEG EECD34, but not EOM EECD34, derived myotubes are longer following retinoic acid treatment.
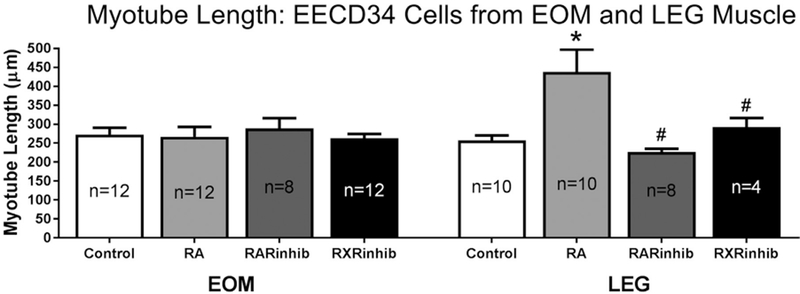
EOM and LEG EECD34 mean myotube lengths after treatment with vehicle (control), retinoic acid (RA), BMS493 (RARinhib), or UVI 3003 (RXRinhib). * indicates significant difference from EOM-derived or LEG-derived EECD34 cells treated with vehicle. # indicates significant difference from retinoic acid (RA) treatment. n = number of replicates. Data are statistically significant at p ≤ 0.05.
2.6. Retinoic acid modulates Pitx2 expression in EOM-derived EECD34 cells in vitro
If retinoic acid signaling is important for the maintenance of Pitx2 expression, then altering retinoic acid signaling should also alter the expression of Pitx2 in the myogenic precursor cells. Pitx2 expression was assessed in vitro 24 h after the addition of vehicle, retinoic acid, the RAR inverse agonist BMS493, the RXR agonist bexarotene, or the RXR antagonist UVI3003 to EOM and LEG-derived EECD34 cells in a low serum media. In the cultures from EOM-derived EECD34 cells treated with retinoic acid, the percent of Pitx2-positive cells was significantly higher compared to vehicle-treated control cells, 80 ± 6.08% compared to 21.75 ± 2.8%, a 115% difference (Fig. 9A, B, E). Similarly, the cultures treated with the RXR agonist were 81.16 ± 4.3% Pitx2-positive, a 116% difference from vehicle treated EOM-derived EECD34 cells (Fig. 9A, C, E). Both the retinoic acid and RXR agonist treated cultures had significantly more Pitx2-positive cells than the cultures treated with the RXR antagonist UVI3003, where only 34.5 ± 10.8% were Pitx2-positive, a 79.5% and 81% difference, respectively, from the RXR antagonist treated cells (Fig. 9B–E). The largest difference was seen in the cultures treated with the RAR inverse agonist, which had significantly fewer Pitx2-positive cells than those cultures treated with retinoic acid, RXR agonist, and RXR antagonist, with differences of 171.9%, 172.2%, and 140.3% respectively.
Fig. 9. More cells express Pitx2 after treatment with retinoic acid or the RXR agonist bexarotene.
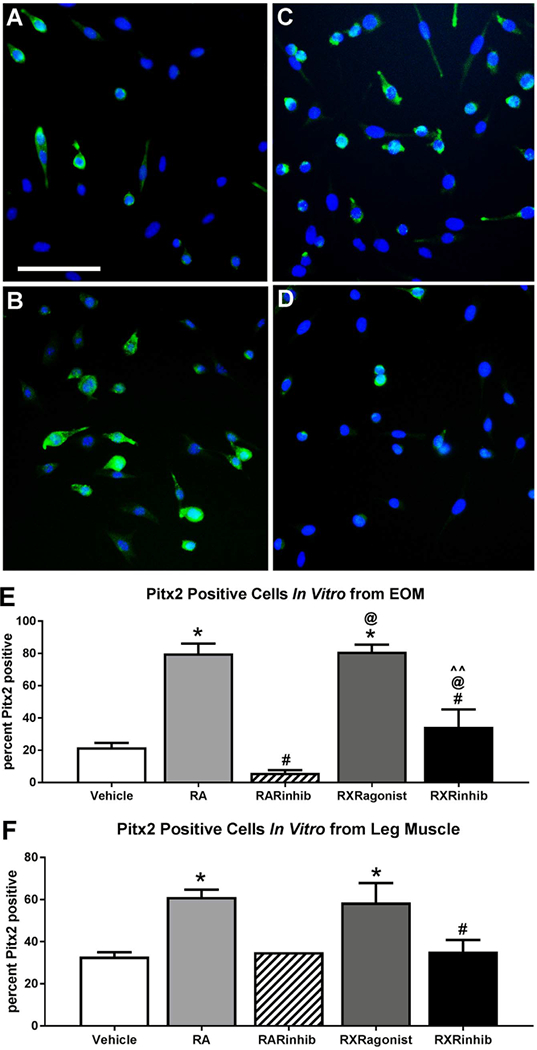
Representative images of EECD34 cells from mouse EOM treated with (A) vehicle, (B) retinoic acid, (C) the RXR agonist bexarotene, and (D) the RXR antagonist UVI 3003 and stained for Pitx2 (green) and DAPI (blue). Scale bar is 75 μm. (E) Percent of Pitx2-positive cells in EOM-derived EECD34 cells cultured in low-serum fusion medium after 24 h treatment with vehicle, retinoic acid (RA), the RAR inverse agonist BMS493 (RARinhib), the RXR agonist bexarotene, or RXR antagonist UVI 3003 (RXRinhib). (F) Percent of Pitx2-positive cells in LEG-derived EECD34 cells cultured in low-serum fusion medium after 24 h treatment with vehicle, retinoic acid (RA), the RAR inverse agonist BMS493 (RARinhib), RXR agonist, or RXR antagonist (RXRinhib). All data represent 3 independent replicates, except RARinhib in LEG where n = 1. * indicates significant difference from vehicle treated control cells. # indicates significant difference from cells treated with RA. @ indicates significant difference from cells treated with RAR inverse agonist (RARinhib). ^^ indicates significant difference from cells treated with RXR agonist. Data are statistically significant at p ≤ 0.05.
In the EECD34 cultures derived from LEG muscle, there was a significant difference between the numbers of cells positive for Pitx2 after retinoic acid treatment, at 61.2 ± 3.5%, compared to vehicle treated controls, at 32.9 ± 2.1%, and represents a 61.2% difference (Fig. 9F). There were also significantly more cells expressing Pitx2 in the RXR agonist treated cultures, at 58.66 ± 9.15% relative to vehicle treated controls, a 52.3% difference. There were 61.9% significantly fewer cells expressing Pitx2 in the RXR antagonist treated cultures, at 32.3 ± 5.6%, compared to the cultures treated with retinoic acid, There were no differences in the percent of cells expressing Pitx2 after RXR antagonist treatment compared to control cultures.
In summary, retinoic acid significantly increased the percent of cells that expressed Pitx2 in the EECD34 cells derived from EOM and LEG. This supports the hypothesis that Pitx2 expression levels may be, at least in part, controlled by retinoic acid levels at these time points.
3. Discussion
Retinoic acid signaling was shown in previous studies to be critical for the up-regulation of Pitx2 expression, and the upregulation of the transcription factor Pitx2 was critical for the formation of the EOMs [14,25]. If either retinoic acid signaling or Pitx2 expression was inhibited, no EOMs developed. The expression of Pitx2 was found to be down-regulated in skeletal muscle after early development of limb skeletal muscles [32], but continued to be expressed at high levels in the extraocular muscles throughout life [16–18] Pitx2 was expressed in a large number of myonuclei in mature EOMs [16,18], as well as in myogenic precursor cells found both in the traditional satellite cell location and in the interstitial connective tissue [17]. Thus, we hypothesized that the continued expression of Pitx2 in adult EOMs was due to maintenance of retinoic acid signaling.
3.1. Retinoic acid receptor expression
The EOMs expressed lower levels of RARα compared to limb skeletal muscle, similar levels of RARγ, and expressed high relative levels of RXRα and RXRγ. While the canonical signaling of retinoic acid is through RAR:RXR dimers, a number of studies showed that there was differential regulation of RAR and RXR during proliferation and differentiation [28,30]. In addition, RXR-mediated signaling was shown to enhance specification of the muscle specific lineage in an RAR-in-dependent manner [31]. Thus, while both receptors were present, their different expression levels in EOMs and limb muscles suggest that there is functional specificity in the roles they play in the maintenance of these muscles in mature animals.
3.2. Retinoic acid treatment and proliferation
At the commencement of the proliferation assay, the vast majority of the EECD34 cells in vitro were Pitx2-positive. Addition of retinoic acid, RAR inverse agonist, or RXR antagonist to EOM- or LEG-derived EECD34 cells in vitro did not alter rates of proliferation under any of the treatment conditions compared to the vehicle treated control cultures. For the EOM-derived EECD34 cells, only treatment with the RAR inverse agonist had a significant effect on proliferation rate compared to that of the retinoic acid treated cells. The cells grown under the control conditions were in proliferation medium, which contains 20% serum; normal serum contains high levels of retinoic acid, normally at a concentration of 4–5 ng/ml [33,34]. One hypothesis for the lack of effect of retinoic acid treatment on proliferation rates in the EECD34 cells in vitro is that the high serum levels of the proliferation medium already contained significant levels of retinoic acid. This suggests that it may be necessary to remove it from the culture medium to see an effect on proliferation in vitro. Because the RAR receptor is constitutively active [35], the inverse agonist was required in order to see a significant effect on proliferation rates in the EOM-derived EECD34 cells compared to retinoic acid. This is supported by the reduced numbers of cells that expressed Pitx2 within one day of switching from the proliferation medium, where almost all cells were Pitx2 positive, to approximately 20% expressing Pitx2 when the serum levels, and consequently the retinoic acid levels, in the medium were reduced.
3.3. Retinoic acid signaling and differentiation
The effect of retinoic acid on fusion into myotubes, defined as cells that contained at least two nuclei, was noticeably different in the EOM-derived EECD34 cells compared to the LEG-derived EECD34 cells. In the LEG-derived EECD34 cells, there were significantly fewer mono-nucleated desmin positive cells, but overall 91.5% of the retinoic acid treated LEG-derived EECD34 cells expressed desmin. This demonstrated that for the LEG-derived EECD34 cells, retinoic acid functioned to induce differentiation, promoting the expression of desmin and fusion into myotubes compared to the vehicle-treated control cells. However, due to the presence of retinoic acid in the culture medium, the differences between cells treated with retinoic acid and the RAR inverse agonist provide the greatest significant insight into the potential role of retinoic acid signaling in these LEG-derived cells. While the addition of the RAR inverse agonist decreased the level of fusion of the LEG-derived EECD34 cells in vitro by one third, it also resulted in a greater number of desmin-positive mononuclear cells. This suggests a specific role for retinoic acid in promoting fusion of these LEG-derived cells in vitro. These results correlate with the high levels of RAR receptor expressed by these cells. There are a large number of studies in vivo and in vitro showing the enhancement of muscle precursor cell differentiation by retinoic acid [26,36,37]. In fact, recent work demonstrated efficacy of using RAR agonists to promote repair after skeletal muscle injury in vivo [38]. The lack of effect of the RXR antagonist was expected in the LEG-derived EECD34 cell cultures in light of their lower levels of RXR receptor expression.
A significantly different picture was seen after addition of retinoic acid to EOM-derived EECD34 cells, where fusion was inhibited by 50% compared to the control cultures. In contrast to the high level of fusion in the LEG muscle-derived cells, 75.3 ± 3% of the EOM-derived EECD34 cells remained desmin-negative in the low serum fusion medium containing retinoic acid compared to 7.1 ± 3% from LEG-derived EECD34 cells. Both the RAR inverse agonist and the RXR antagonist treatments showed similar results to controls relative to fusion index and desmin expression patterns. Comparatively speaking, however, in all the cultures of EOM-derived EECD34 cells, approximately 60% remained desmin-negative. The desmin-negative cells represented a small minority of the LEG-derived EECD34 cells, which averaged between 5% and 10%. Others have shown that retinoic acid treatment of embryonic stem cells promotes the expansion of the premyogenic progenitor population [37]. A recent study using primary human myoblasts also showed that retinoic acid impaired skeletal muscle differentiation [39]. However, as studies in other muscle precursor cell types had the reverse effect, pushing the cells toward expression of MyoD and myogenin [26,36,40], it would appear that culture conditions, type of cells isolated, and whether the cells are primary or cell lines, affect the downstream changes induced by modulation of retinoic acid signaling. In EOM-derived EECD34 cells cultured directly ex vivo, the effect of retinoic acid treatment was to decrease fusion. This is interesting in light of their dependence for embryological development, including both size and location, on retinoic acid produced by neural crest cells early in development [24,25]. Further, this signaling was linked to RXR specifically [22]. The current studies show that there is a specific population of muscle stem cells, enriched in the EOM, that have a significantly different response to retinoic acid signaling compared to the “same” cells derived from limb skeletal muscles. These data implicate retinoic acid in playing a potential role in preventing fusion of these cells into normal adult EOM, the effect we hypothesize may be to promote their longer-term retention, which is needed considering the significant level of remodeling that occurs throughout life in mature EOM [2,5,7,8].
3.4. Levels of Pitx2: modulation by retinoic acid signaling
The ability of retinoic acid and the RXR agonist bexarotene to significantly increase the number of Pitx2-expressing EECD34 cells strongly supports the role of this signaling pathway in the normal maintenance of Pitx2 expression in the adult EOM. Retinoic acid is known to be a potent enhancer of skeletal muscle myogenesis of various myogenic cell lines in vitro [36,40]. It was shown previously that retinoic acid acts in opposite ways on distinct populations of myogenic precursor cells [41]. However, none of the various treatments resulted in all of the cells responding in a similar manner. The EECD34 cells are not a “pure” population [17], and this is probably reflected in the differential effectiveness of the agonists and antagonists used in this study to modulate Pitx2 expression for both the EOM- and LEG-derived EECD34 cells. In particular, RXR plays a number of roles outside of retinoic acid signaling, including signaling with the thyroid hormone receptor, peroxisome proliferator-activated receptor (PPAR) and others [42,43]. In addition, while the percent of serum was greatly reduced in low serum fusion medium compared to proliferation medium, retinoic acid was still present within the fusion medium. If defined medium without serum was used, the effects for all treatments might have been more visible in the assays used in this study.
3.5. Summary
In conclusion, there are different levels of retinoic acid signaling receptor proteins in limb compared to extraocular muscles. The treatments with retinoic acid, an RAR inverse agonist, or an RXR antagonist resulted in significantly different responses. In the cultures treated with retinoic acid, the LEG-derived EECD34 cells responded with an increase in cells expressing desmin and increased fusion compared to control cultures, while the EOM-derived EECD34 cells responded with significantly more cells negative for desmin as well as decreased fusion. This suggests that the EECD34 cells used in these cultures are heterogeneous, and that the fate of these cells in the milieu of the EOM is distinctly different than these cells when in the milieu of leg muscles. The identity of these other factors is unknown. In the EOM, where there is a 10-fold increased density of Pitx2-positive myogenic precursor cells compared to leg muscle [27], we hypothesize that retinoic acid signaling may play a role in maintaining large numbers of Pitx2-expressing cells in the EOM by inhibiting their fusion into myofibers, allowing their extensive and life-long myonuclear turnover rates. Further studies are needed to determine if this occurs in vivo.
4. Methods
4.1. Animals
All experiments adhered to NIH guidelines for the use of animals in research and were approved by the Institutional Animal Care and Usage Committee at the University of Minnesota. C57BL/6 mice (Envigo, Madison, WI) were housed and maintained by Research Animal Resources at the University of Minnesota. All adult mice were sacrificed by CO2 asphyxiation.
4.2. Western blotting
For whole tissue lysates, EOMs and tibialis anterior (LEG) were removed from C57BL/6 mice and immediately placed into ice-cold Dulbecco’s minimal essential medium (DMEM) or snap-frozen in liquid nitrogen. Each EOM sample contained all eight rectus muscles pooled from three mice, and each LEG sample contained the right tibialis anterior muscle pooled from three mice. Muscles placed in DMEM were removed from media, weighed, and placed in a glass homogenizer on ice containing 100 ml of 1× cell lysis buffer (Cell Signaling, Danvers, MA) with Complete® Protease Inhibitor Cocktail (Roche, Indianapolis, IN) per 10 mg of muscle. To process the frozen samples, muscles were removed and pulverized to a powder in glass homogenizer tubes on dry ice. Samples were then allowed to thaw on ice and homogenized in 300uL or 1800uL RIPA buffer (Sigma, St. Louis, MO) with Complete® Protease Inhibitor Cocktail (Roche) for EOM and LEG respectively. All homogenized samples were centrifuged at 11,000 g for 20 min at 4 °C. Supernatants were transferred to ice-cold tubes and stored at − 30 °C. Protein concentrations were determined by the bicinchoninic acid (BCA) protein assay (Thermo Scientific; Waltham, MA). 8–33 μg of protein was separated on Any kD mini-PROTEAN TGX precast gels (Bio-Rad, Hercules, CA) and transferred to nitrocellulose. Membranes were dried for 1 h after transfer, then stained with the REVERT™ Total Protein Stain Kit (LI-COR Biosciences, Lincoln, NE) and imaged with an Odyssey Infrared Imaging System (LI-COR Biosciences) before the stain was reversed. Membranes were blocked in Odyssey blocking solution (LI-COR Biosciences) for 1 h at room temperature, then incubated with one of the following primary antibodies: retinoic acid receptor alpha (1:500, RARα, abeam, Cambridge, MA), retinoic acid receptor gamma (1:1000; RARγ, abeam), retinoid X receptor alpha (1:1000; RXRα, abeam), or retinoid X receptor gamma (1:100; RXRγ, abeam) overnight at 4 °C. The next day membranes were washed in Tris-buffered saline and Tween 20 (TBST) (IX TBS, 0.1% Tween 20) and incubated in goat anti-rabbit-IR800CW (1:20,000; LI-COR Biosciences) for 1 h at room temperature. After rinsing in TBST, the membranes were imaged with the Odyssey Infrared Imaging System. Densitometry values were obtained using Odyssey instrument software.
4.3. Immunohistochemistry
4.3.1. Identification of RXR expression in tissue sections.
Cryostat sections through adult C57BL/6 mouse EOMs were immunostained for the expression of RXR and its co-expression with specific markers of myogenic precursor cells. Sections were fixed in 4% paraformaldehyde (Affymetrix, San Diego, CA), rinsed in phosphate buffered saline (PBS), blocked in 20% normal serum, followed by incubation in primary antibody to RXRα (1:100, abeam, Cambridge, MA) in antibody buffer containing PBS and 0.1% Triton X-100 overnight at 4 °C, rinsed in PBS, blocked in 20% normal serum, followed by incubation in goat anti-rabbit Alexa Fluor 488 (1:1000, Jackson ImmunoResearch, West Grove, PA) in antibody buffer. The sections were then incubated in Fab fragments diluted in antibody buffer overnight at 4 °C. The following day, the sections were rinsed in PBS, blocked in 20% normal serum, and incubated with an antibody to Pitx2 in antibody buffer at room temperature for 1 h (1:1500; Capra Science, Angelholm, Sweden). After incubation, the tissue was rinsed in PBS, blocked in 20% normal serum, followed by incubation in goat antirabbit Rhodamine Red antibody (1:1000; Jackson ImmunoResearch) in antibody buffer, rinsed in PBS. The sections were next treated with antidystrophin (1:200, Sigma), rinsed with PBS, followed by incubation with goat anti-rabbit IgG-conjugated to dylight 405 (1:100, Jackson Labs.), and mounted with Vectashield (Vector Laboratories, Burlingame, CA). A second series used sections from the Pax7-tdTomato reporter mouse (Pax7Cre; P26RtdTamato). These were fixed in 4% paraformaldehyde prior to cryosectioning. These sections were then rinsed in PBS, blocked in 20% normal serum, incubated in primary antibody to RXRα, and processed similarly to those sections immunostained for Pitx2. The sections were next treated with antidystrophin (1:200, Sigma), rinsed with PBS, followed by incubation with goat anti-rabbit IgG-conjugated to dylight 405 (1:100, Jackson Labs.), and mounted with Vectashield (Vector Laboratories).
4.4. Flow cytometry
4.4.1. Isolation of mononuclear cells.
EOMs and limb muscle (LEG) were removed and immediately placed into ice-cold DMEM. For EECD34 cell sorting experiments, each EOM sample contained all eight rectus muscles and each LEG sample contained the right tibialis anterior muscles pooled from two mice. EOMs and minced LEG were digested in a collagenase/dispase solution (10 mg/ml collagenase B, 2.4U/ml Dispase II, 2.5 mM CaCl2 in phosphate buffered saline (PBS) at 37 °C, 5% CO2 for ~ 1.5 h, pipetting every 30 min to dissociate tissue. Mononuclear cells were filtered through a 35 μm nylon mesh filter to remove cellular debris. Cells were washed twice with sorter buffer [1% fetal bovine serum (Atlanta Biologicals, Norcross, GA) and 25 mM N-2-hydroxyethylpiperazine-N-2-ethane sulfonic acid (HEPES) in PBS] and spun into a pellet at 1000 g for 5 min at 4 °C. The supernatant was carefully removed with a pipette, and the cell pellet was resuspended in 300 μl of sorter buffer per mouse pooled for each EOM sample and 600 μl of sorter buffer per mouse pooled for each LEG sample.
4.4.2. EECD34 cell sorting.
Isolated mononuclear cells were incubated with the following antibodies at the indicated concentrations for 45 min at 4 °C in the dark: CD34-Brilliant Violet 421 (5 μ1/100 μl sorter buffer; BD Biosciences; Franklin Lakes, NJ), Scal-FITC (2 μ1/100 μl sorter buffer; BD Biosciences), CD45-PE (2 μ1/100 μl sorter buffer; BD Biosciences), and CD31-APC (5 μ1/100 μl sorter buffer; BD Biosciences). Cells were washed with sorter buffer and spun into a pellet at 1000 g for 5 min at 4 °C. Cell pellets were resuspended in sorter buffer containing 5 mM MgCl2, DNase I (10 U/ml), and 7-AAD (50 μl/1 ml sorter buffer). Live EECD34 cells (CD34+/Sca1−/CD45−/CD31−/7AAD−) were sorted into cold proliferation media (DMEM, 10% fetal bovine serum, 10% horse serum, 1% penicillin/streptomycin, 0.5% chick embryo extract) using a BD FACSAria II (BD Biosciences).
4.5. In vitro experiments
4.5.1. Pitx2 immunostaining.
After 24, 48, 72, and 96 h EOM-derived EECD34 cells that had been plated on Matrigel were rinsed with phosphate buffered saline (PBS) and fixed for 10 min in ice cold acetone. After a PBS rinse, the cells were blocked for 30 min in 20% goat serum, followed by incubation with an antibody to Pitx2 in antibody buffer overnight at 4 °C (1:1500; Capra Science, Ängelholm, Sweden). The following day, cells were rinsed in PBS, blocked in 20% goat serum, followed by an incubation at room temperature for 30 min with goat anti-rabbit-AlexaFluor 488 antibody (1:1000; Jackson ImmunoResearch) in antibody buffer, rinsed in PBS, and mounted with Vectashield with DAPI (Vector Laboratories, Burlingame, CA). The percent of cells that expressed Pitx2 was counted as a percentage of all cells as identified by DAPI-positive nuclei. Analysis was based on three independent cell isolations for each time point.
A second series of plated cells were switched to low-serum fusion medium on day 5 and treated with vehicle, retinoic acid, the RAR inverse agonist BMS493 (10−5 M; Sigma), RXR agonist bexarotene (3 × 10⁻⁵M; Tocris, Bio-techne, Minneapolis, MN), or the RXR antagonist UVI3003 (10−5M; Tocris). After 24 h, they were immunostained to determine expression of Pitx2 as described in the preceding paragraph. Pitx2 expression was determined as a percentage of all cells in the dish over a minimum of 18–20 fields randomly selected across the culture dish. Analysis was based on three independent cell isolations for both the EOM-derived EECD34 and LEG-derived cells.
4.5.2. Proliferation experiments.
Sorted EECD34 cells were plated onto Matrigel coated dishes 8-well Permanox chamber slides (Lab-Tek, Thermo Scientific) or 48-well plates (Corning, Corning, NY) at a density of 10,000 cells/cm2, or 15 well μ-Slide Angiogenesis plates (Ibidi, Madison WI) at a density of 7680 cells/cm2. Proliferation media was changed every other day until cells reached the appropriate density.
At ~ 30–40% confluence cells were treated with vehicle (ethanol), all-trans retinoic acid (10−6M; Sigma), the RAR inverse agonist BMS493 (10−5 M; Sigma), or the RXR antagonist UVI 3003 (10−5M; Tocris) for 24 h in proliferation media with a final concentration of ethanol at 0.1% for all treatments. At the end of the 24-h treatment cell proliferation rates were assessed.
4.5.3. Fusion experiments.
At ~ 70–80% confluence cells were treated with vehicle (ethanol), all-trans retinoic acid (10−6 M; Sigma), BMS493 (10−5M; Sigma), or UVI 3003 (10−5 M; Tocris) for 72 h in fusion media (DMEM, 5% horse serum, 1% penicillin/streptomycin) with the final concentration of ethanol at 0.1% for all treatments. Fusion media containing vehicle, retinoic acid, BMS493, or UVI 3003 were replaced after 48 h. At the end of the 72-h treatment cell fusion was assessed.
4.6. EdU (5-ethynyl-2′-deoxyuridine) proliferation assay
Proliferation rates of treated cells were determined at the end of the 24-h treatment using the Click-iT® EdU kit (Invitrogen, Carlsbad, CA). Cells were incubated with 20 μM EdU (a thymidine analog) in proliferation media for 1 h. Immediately following the 1-h incubation, cells were fixed and labeled with Oregon Green 488 according to the manufacturer’s instructions. Cells were mounted in Vectashield Mounting Media with DAPI (Vector Laboratories) and examined by fluorescence microscopy at 20× magnification. A minimum of 200 nuclei from at least 4 fields were counted for each independent experiment. A minimum of three independent replicates were analyzed for the LEG samples, and nine independent replicates were analyzed for the EOM samples.
4.7. Fusion assay
At the end of the 72-h treatment the cells were stained for desmin to determine the amount of cell fusion. Cells were rinsed with PBS, fixed with 4% paraformaldehyde for 10 min, rinsed, blocked with 10% horse serum in antibody buffer for 30 min, blocked using the Avidin/Biotin blocking kit (Vector Laboratories), and incubated for one hour with an antibody to desmin (Dako, 1:500) in antibody buffer. Desmin was detected using the Vectastain ABC kit (Vector Laboratories) and diami-nobenzidine. Cells were counterstained with hematoxylin. The fusion index was calculated as the number of nuclei present in myotubes defined as containing two or more nuclei divided by the total number of nuclei. Percent desmin-positive and percent desmin-negative mononuclear cells were calculated as the number of individual nuclei with or without desmin immunostaining, respectively, divided by the total number of nuclei. Cells were visualized at 20× magnification. A minimum of 200 nuclei from at least 4 fields were counted for each independent experiment. A minimum of three to five independent replicates were analyzed for the LEG samples, and nine to twelve independent replicates were analyzed for the EOM samples. For myotube length, 36 consecutive 20× images were stitched together into a 6 × 6 square using Adobe Photoshop (Adobe Systems, San Jose, California), and full length myotubes were measured using the Bioquant Image Analysis System (Bioquant, Nashville, TN). Four to twelve independent replicates were measured, means for each replicate were averaged, and the averages were used to determine significant differences between the treatments.
4.8. Statistical analysis and data availability
Data are reported as means ± SEM. Data were analyzed with a two-way analysis of variance (ANOVA) followed by a post-hoc Tukey’s multiple comparison test with aid of Prism software (Graphpad). Statistical significance was defined as P < 0.05.
All data and associated protocols will be made available to readers on request.
Acknowledgements
This work was supported by NIH EY55137 (LKM), NIH P30AR0507220, NIH P30 EY11375, Marzolf Scholarship (SLH), NIDCR T32DE007288 (SLH), the Minnesota Lions Foundation, an unrestricted grant to the Department of Ophthalmology and Visual Neurociences from Research to Prevent Blindness, Inc. In addition, this work was supported in part by NIH P30 CA77598 utilizing the Masonic Cancer Center University of Minnesota Flow Cytometry Resource.
Abbreviations:
- EOM
extraocular muscles
- RAR
retinoic acid receptor
- RXR
retinoid X receptor
- EECD34 cells
extraocular muscle enriched cells expressing CD34
- LEG
tibialis anterior muscle
Footnotes
Competing interests
The authors declare that they have no competing interests.
References
- [1].McLoon LK, Willoughby CL, Andrade FH, Extraocular muscles: structure and function, in: McLoon LK, Andrade F (Eds.), Craniofacial Muscles: A New Framework for Understanding the Effector Side of Craniofacial Muscles, Springer, New York City, New York, 2012, pp. 31–88. [Google Scholar]
- [2].McLoon LK, Wirtschafter JD, Continuous myonuclear addition to single extraocular myofibers in uninjured adult rabbits, Muscle Nerve 25 (2002) 348–358. [DOI] [PubMed] [Google Scholar]
- [3].McLoon LK, Wirtschafter JD, Activated satellite cells are present in uninjured extraocular muscles of mature mice, Trans. Am. Ophthalmol. Soc 100 (2002) 119–124. [PMC free article] [PubMed] [Google Scholar]
- [4].McLoon LK, Wirtschafter JD, Activated satellite cells in extraocular muscles of normal adult monkeys and humans, Invest. Ophthalmol. Vis. Sci 44 (2003) 1927–1932. [DOI] [PMC free article] [PubMed] [Google Scholar]
- [5].McLoon LK, Rowe J, Wirtschafter J, McCormick KM, Continuous myofiber remodeling in uninjured extraocular myofibers: myonuclear turnover and evidence for apoptosis, Muscle Nerve 29 (2004) 707–715. [DOI] [PMC free article] [PubMed] [Google Scholar]
- [6].Seale P, et al. , Pax7 is required for the specification of myogenic satellite cells, Cell 102 (2000) 777–786. [DOI] [PubMed] [Google Scholar]
- [7].Keefe AC, et al. , Muscle stem cells contribute to myofibers in sedentary adult mice, Nat. Commun 6 (2015) 7987. [DOI] [PMC free article] [PubMed] [Google Scholar]
- [8].Pawlikowski B, Pullman C, Betta N, Kardon G, Olwin BB, Pervasive satellite cell contribution to uninjured adult muscle fibers, Skelet. Muscle 5 (2015) 42. [DOI] [PMC free article] [PubMed] [Google Scholar]
- [9].Carlson BM, Faulkner JA, The regeneration of skeletal muscle fibers following injury: a review, Med. Sci. Sports Exerc 15 (1983) 187–198. [PubMed] [Google Scholar]
- [10].Lepper C, Partridge TA, Fan CM, An absolute requirement for Pax7-positive satellite cells in acute injury-induced skeletal muscle regeneration, Development 138 (2011) 3639–3646. [DOI] [PMC free article] [PubMed] [Google Scholar]
- [11].Murphy MM, Lawson JA, Mathew SJ, Hutcheson DA, Kardon G, Satellite cells, connective tissue fibroblasts and their interactions are crucial for muscle regeneration, Development 138 (2011) 3625–3637. [DOI] [PMC free article] [PubMed] [Google Scholar]
- [12].Sambasivan R, et al. , Pax7-expressing satellite cells are indispensable for adult skeletal muscle regeneration, Development 138 (2011) 3647–3656. [DOI] [PubMed] [Google Scholar]
- [13].Tajbakhsh S, Rocancourt D, Cossu G, Buckingham M, Redefining the genetic hierarchies controlling skeletal myogenesis: Pax-3 and Myf-5 act upstream of MyoD, Cell 89 (1997) 127–138. [DOI] [PubMed] [Google Scholar]
- [14].Diehl AG, et al. , Extraocular muscle morphogenesis and gene expression are regulated by Pitx2 gene dose, Invest. Ophthalmol. Vis. Sci 47 (2006) 1785–1793. [DOI] [PubMed] [Google Scholar]
- [15].L’Honoré A, Ouimette J-F, Lavertu-Jolin M, Drouin J, Pitx2 defines alternate pathways acting through MyoD during limb and somitic myogenesis, Development 137 (2010) 3847–3856. [DOI] [PubMed] [Google Scholar]
- [16].Zhou Y, et al. , An altered phenotype in a conditional knockout of Pitx2 in extraocular muscle, Invest Ophthalmol. Vis. Sci 50 (2009) 4531–4541. [DOI] [PMC free article] [PubMed] [Google Scholar]
- [17].Hebert SL, Daniel M, McLoon LK, The role of Pitx2 in maintaining the phenotype of myogenic precursor cells in the extra ocular muscles, PLoS One 8 (2013) e58405. [DOI] [PMC free article] [PubMed] [Google Scholar]
- [18].Zhou Y, Liu D, Kaminski HJ, Pitx2 regulates myosin heavy chain isoform expression and multi-innervation in extra ocular muscle, J. Physiol 589 (2011) 4601–4614. [DOI] [PMC free article] [PubMed] [Google Scholar]
- [19].Kallestad KM, et al. , Sparing of extraocular muscle in aging and muscular dystrophies: a myogenic precursor cell hypothesis, Exp. Cell Res 317 (2011) 873–885. [DOI] [PMC free article] [PubMed] [Google Scholar]
- [20].Verma M, Fitzpatrick KR, McLoon LK, Extraocular muscle repair and regeneration, Curr. Ophthalmol. Rep 5 (2017) 207–215. [DOI] [PMC free article] [PubMed] [Google Scholar]
- [21].McDonald AA, Kunz MD, McLoon LK, Dystrophic changes in extraocular muscles after gamma irradiation in mdx: utrophin+/− mice, PLoS One 9 (2014) e86424. [DOI] [PMC free article] [PubMed] [Google Scholar]
- [22].Bohnsack BL, Kasprick DS, Kish PE, Goldman D, Kahana A, A zebrafish model of Axenfeld-Rieger syndrome reveals that pitx2 regulation by retinoic acid is essential for ocular and craniofacial development, Invest. Ophthalmol. Vis. Sci 53 (2012) 7–22. [DOI] [PMC free article] [PubMed] [Google Scholar]
- [23].Kumar S, Duester G, Retinoic acid signaling in perioptic mesenchyme represses Wnt signaling via induction of Pitx2 and Dkk2, Dev. Biol 340 (2010) 67–74. [DOI] [PMC free article] [PubMed] [Google Scholar]
- [24].Bohnsack BL, et al. , Development of extraocular muscles requires early signals from periocular neural crest and the developing eye, Arch. Ophthalmol 129 (2011) 1030–1041. [DOI] [PMC free article] [PubMed] [Google Scholar]
- [25].Matt N, Ghyselinck NB, Pellerin I, Dupe V, Impairing retinoic acid signaling in the neural crest cells is sufficient to alter entire eye morphogenesis, Dev. Biol 320 (2008) 140–148. [DOI] [PubMed] [Google Scholar]
- [26].Chen J, Li Q, Implication of retinoic acid receptor selective signaling in myogenic differentiation, Sci. Rep 6 (2016) 18856. [DOI] [PMC free article] [PubMed] [Google Scholar]
- [27].Mark M, Ghyselinck NM, Chambon P, Function of retinoid nuclear receptors: lessons from genetic and pharmacological dissections of the retinoic acid signaling pathway during mouse embryogenesis, Annu. Rev. Pharmacol. Toxicol 46 (2006) 451–480. [DOI] [PubMed] [Google Scholar]
- [28].Downes M, Mynett-Johnson L, Muscat GEO, The retinoic acid and retinoid X receptors are differentially expressed during myoblast differentiation, Endocrinology 134 (1994) 2658–2661. [DOI] [PubMed] [Google Scholar]
- [29].Floeschlé A, et al. , RXRγ is essential for mediating the all-trans retinoic acid-induced growth arrest of C2 myogenic cells, Oncogene 12 (1996) 411–421. [PubMed] [Google Scholar]
- [30].Alric S, Froeschlé A, Piquemal D, Carnac G, Bonnieu A, Functional specificity of the two retinoic acid receptor RAR and RXR families in myogenesis, Oncogene 16 (1998) 273–282. [DOI] [PubMed] [Google Scholar]
- [31].Le May M, et al. , Contribution of retinoid X receptor signaling to the specification of skeletal muscle lineage, J. Biol. Chem 286 (2011) 26806–26812. [DOI] [PMC free article] [PubMed] [Google Scholar]
- [32].L’Honoré A, et al. , Sequential expression and redundancy of Pitx2 and Pitx3 genes during muscle development, Dev. Biol 307 (2007) 421–433. [DOI] [PubMed] [Google Scholar]
- [33].De Leenheer AP, Lambert WE, Claeys I, All-trans-retinoic acid: measurement of reference values in human serum by high performance liquid chromatography, J. Lipid Res 23 (1982) 1362–1367. [PubMed] [Google Scholar]
- [34].Eckhoff C, Collins MD, Nau H, Human plasma all-trans-, 13-cis- and 13-cis-4-oxoretinoic acid profiles during subchronic vitamin A supplementation: comparison to retinol and retinyl ester plasma levels, J. Nutr 121 (1991) 1016–1025. [DOI] [PubMed] [Google Scholar]
- [35].Underhill TJ, Cash DE, Linney E, Constitutively active retinoid receptors exhibit interfamily and intrafamily promoter specificity, Mol. Endrocrinol 8 (1994) 274–285. [DOI] [PubMed] [Google Scholar]
- [36].Halevy O, Lerman O, Retinoic acid induces adult muscle cell differentiation medicated by the retinoic acid receptor-alpha, J. Cell. Physiol 154 (1993) 566–572. [DOI] [PubMed] [Google Scholar]
- [37].Ryan T, et al. , Retinoic acid enhances skeletal myogenesis in human embryonic stem cells by expanding the premyogenic progenitor population, Stem Cell Rev 8 (2012) 482–493. [DOI] [PubMed] [Google Scholar]
- [38].Di Rocco A, et al. , Selective retinoic acid receptor γ agonists promote repair of injured skeletal muscle in mouse, Am. J. Pathol 185 (2015) 2495–2504. [DOI] [PMC free article] [PubMed] [Google Scholar]
- [39].El-Haddad M, et al. , Retinoic acid maintains human skeletal muscle progenitor cells in an immature state, Cell. Mol. Life Sci 74 (2017) 1923–1936. [DOI] [PMC free article] [PubMed] [Google Scholar]
- [40].Kennedy KA, et al. , Retinoic acid enhances skeletal muscle progenitor formation and bypasses inhibition by bone morphogenetic protein 4 but not dominant negative beta-catenin, BMC Biol 67 (2009), 10.1186/1741-7007-7067. [DOI] [PMC free article] [PubMed] [Google Scholar]
- [41].Corcoran JP, Ferretti P, RA regulation of keratin expression and myogenesis suggests different ways of regenerating muscle in adult amphibian limbs, J. Cell Sci 112 (1999) 1385–1394. [DOI] [PubMed] [Google Scholar]
- [42].Bohnsack BL, Kahana A, Thyroid hormone and retinoic acid interact to regulate zebrafish craniofacial neural crest development, Dev. Biol 373 (2013) 300–309. [DOI] [PMC free article] [PubMed] [Google Scholar]
- [43].Wagner CE, Jurutka PW, Marshall PA, Heck MC, Retinoid X receptor selective agonists and their synthetic methods, Curr. Top. Med. Chem 17 (2017) 742–767. [DOI] [PubMed] [Google Scholar]


