Abstract
Neoantigens, which are derived from tumour-specific protein-coding mutations, are exempt from central tolerance, can generate robust immune responses1,2 and can function as bona fide antigens that facilitate tumour rejection3. Here we demonstrate that a strategy that uses multi-epitope, personalized neoantigen vaccination, which has previously been tested in patients with high-risk melanoma4–6, is feasible for tumours such as glioblastoma, which typically have a relatively low mutation load1,7 and an immunologically ‘cold’ tumour microenvironment8. We used personalized neoantigen-targeting vaccines to immunize patients newly diagnosed with glioblastoma following surgical resection and conventional radiotherapy in a phase I/Ib study. Patients who did not receive dexamethasone—a highly potent corticosteroid that is frequently prescribed to treat cerebral oedema in patients with glioblastoma—generated circulating polyfunctional neoantigen-specific CD4+ and CD8+ T cell responses that were enriched in a memory phenotype and showed an increase in the number of tumour-infiltrating T cells. Using single-cell T cell receptor analysis, we provide evidence that neoantigen-specific T cells from the peripheral blood can migrate into an intracranial glioblastoma tumour. Neoantigen-targeting vaccines thus have the potential to favourably alter the immune milieu of glioblastoma.
Reporting summary
Further information on research design is available in the Nature Research Reporting Summary linked to this paper.
We designed a phase I/Ib study of personalized neoantigen vaccines for patients with newly diagnosed methylguanine methyltransferase (MGMT)-unmethylated glioblastoma, from whom surgically resected tumour and matched normal cells were analysed to identify neoantigens. Vaccine production occurred during recovery from surgery and administration of radiotherapy. Vaccines4 contained up to 20 long peptides that were divided into pools of 3–5 peptides (designated as pools A–D) admixed with poly-ICLC (polyinosinic and polycytidylic acid, stabilized with poly-l-lysine and carboxymethylcellulose; see Methods). Following radiotherapy, vaccines were administered in a prime–boost schedule (Fig. 1a).
Fig. 1 |. Generation of a personal neoantigen-targeting vaccine for newly diagnosed patients with glioblastoma that had unmethylated MGMT promoters.
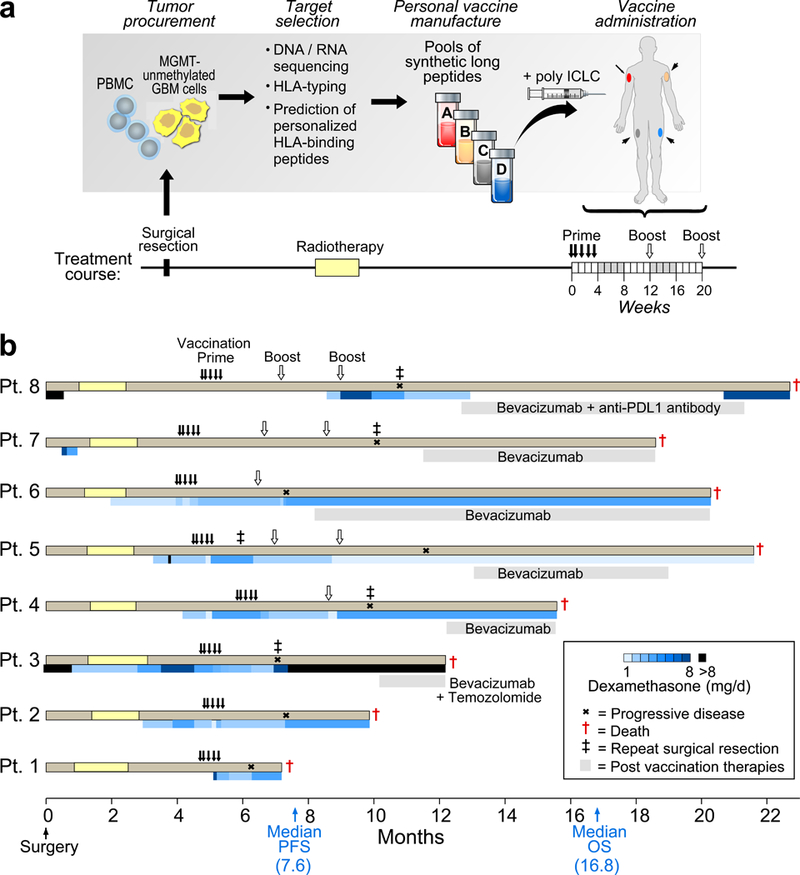
a, Somatic mutations were identified by Clinical Laboratory Improvement Amendments (CLIA)-certified whole-exome sequencing of DNA from surgically resected glioblastoma and matched normal cells (PBMCs) and their expression was confirmed by tumour RNA-seq. Immunizing peptides were selected based on HLA class I binding predictions (Methods). Each patient was vaccinated with up to 20 long peptides, administered in non-rotating pools of 3–5 peptides. b, Clinical event timeline for the eight patients who received at least one vaccine dose, from surgery until time of death due to progressive disease. Blue bars, dexamethasone dose and duration. Grey bars, salvage therapy administered following progression. Median progression-free survival (PFS) and overall survival (OS) was 7.6 months (90% confidence interval, 6.2–9.5) and 16.8 months (90% confidence interval, 9.6–21.3), respectively.
Among 10 enrolled patients, we detected a median of 116 somatic single-nucleotide variants per tumour (range, 75–158) with a median of 59 coding mutations per tumour (range, 32–93) using whole-exome sequencing, and the expression of a subset of genes was confirmed by RNA sequencing (RNA-seq) analysis (Supplementary Table 1a, b). These included mutations commonly observed in glioblastoma that affect PTEN, RB1 and EGFR (Extended Data Fig. 1a, b and Supplementary Table 2). No IDH1 or IDH2 mutations were detected. A median of 64.5 HLA binders (range, 30–163) with a half-maximum inhibitory concentration (IC50) < 500 nM was predicted per tumour (Extended Data Fig. 1c and Supplementary Table 3a, b). Two patients were withdrawn because of an insufficient number of actionable neoepitopes or disease progression after radiotherapy. For the remaining 8 patients, the median number and amino acid length of peptides incorporated per vaccine was 12 (range, 7–20) and 24 (range, 15–30), respectively (Supplementary Tables 4a, 5).
Median time from surgery to first vaccination was 19.9 weeks (range, 17.1–24.7 weeks). All eight patients received the five planned priming vaccines but only three completed both booster vaccinations. The other five patients discontinued therapy because of disease progression. Only two patients (7 and 8) did not require dexamethasone during vaccine priming (Fig. 1b). Treatment side effects were limited to grade 1–2 events. No toxicities were dose-limiting or resulted in dose delay or treatment discontinuation (Supplementary Table 4b). All patients died from progressive disease. Median progression-free survival and overall survival were 7.6 months and 16.8 months, respectively (Fig. 1b).
Circulating immune responses to immunizing peptides (IMPs) were analysed among the five patients who received at least one booster vaccine. Peripheral blood mononuclear cells (PBMCs) were tested for reactivity against pools of overlapping 15- to 16-amino acid peptides (assay peptides (ASPs)) corresponding to the immunizing peptides (Extended Data Fig. 2). All three patients (patients 4, 5 and 6) who required dexamethasone during vaccine priming failed to generate interferon-γ (IFNγ) responses (Fig. 2a). Diffuse early reactivity from patient 6 probably reflects high baseline inflammation that subsequently dissipated. By contrast, patients 7 and 8 – who did not receive dexamethasone during vaccine priming – generated robust de novo immune responses against multiple predicted neoantigens as analysed using ex vivo enzyme-linked immunospot (ELISPOT) (Fig. 2a and Extended Data Fig. 3a). Patient 7 responded primarily to pool C peptides, with CD4+ T cell responses against mutated ARHGAP35 and GPC1 neoepitopes, and preferential reactivity to mutant over wild-type peptides (Fig. 2b and Extended Data Fig. 3b). Lower frequency mutant-specific CD8+ T cell responses to predicted class I epitopes (EPT) that arose from mutated ARHGAP35 (ARHGAP35MUT) and mutated SLX4 (SLX4MUT) were detected following one round of in vitro stimulation in post-vaccination samples (Fig. 2b and Extended Data Fig. 3c). Patient 8 demonstrated ex vivo ELISPOT reactivity against ASPs from two out of three immunizing peptide pools (pools A and B; pool C responses were below the threshold of 55 spot-forming cells per 106 PBMCs), with CD4+ T cell responses directed against three neoepitopes (Extended Data Fig. 3b). Preferential targeting of mutant SHANK2 (SHANK2MUT) and SVEP1 (SVEP1MUT) over wild-type sequences and equivalent reactivity of mutant versus wild-type COX18 was observed (Fig. 2b). Four of the strongest neoantigen-specific responses from patients 7 and 8 were confirmed to be against processed epitopes (Fig. 2c and Extended Data Fig. 3d).
Fig. 2 |. Vaccination induces circulating neoantigen-specific T cell responses in patients who did not receive dexamethasone during vaccine priming.
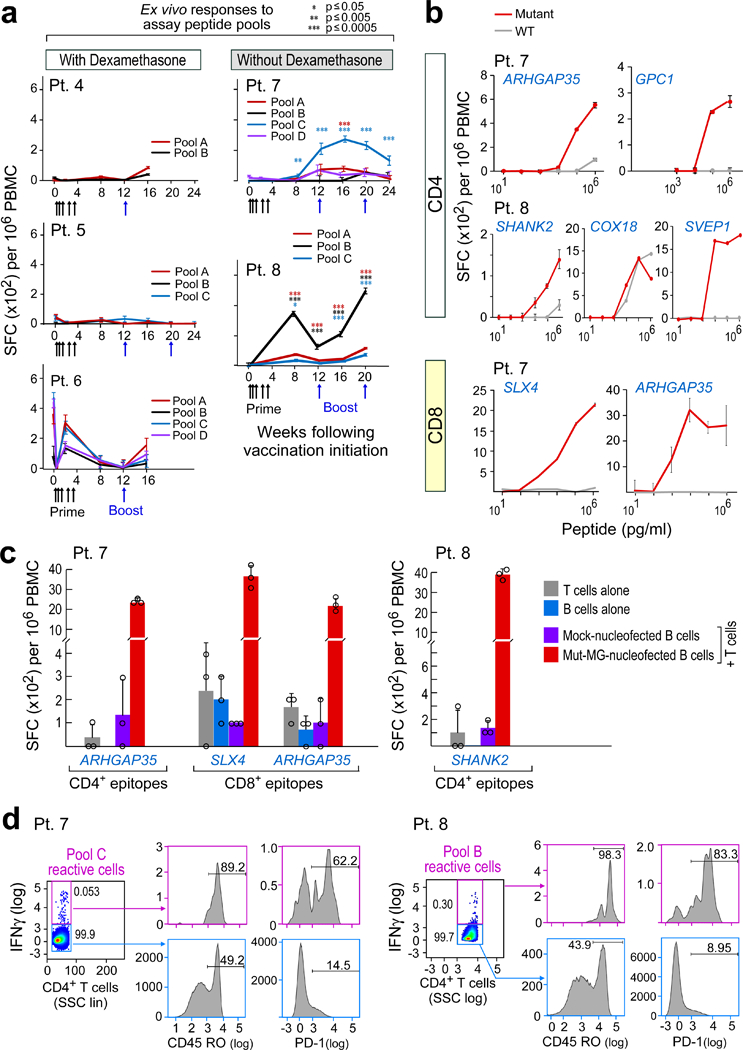
a, Ex vivo IFNγ ELISPOT responses for PBMCs that were stimulated with neoantigen-peptide pools. Data are background-subtracted; n = 3 biologically independent samples, data are mean ± s.e.m.; Wilcoxon signed-rank test, two-sided without adjustment for multiple comparisons, see Methods for statistical analysis; SFC, spot- forming cells. b, IFNγ secretion by neoantigen-reactive T cell lines from patients 7 and 8 shows discrimination between mutated and wild-type peptides, focusing on neoantigens generating CD4+ and CD8+ T cell responses. n = 3 biological independent samples, data are mean ± s.d.; SHANK2 responses were detected ex vivo. c, Dominant responses of CD4+ and CD8+ neoantigen-specific T cell lines from patients 7 and 8 are directed against endogenously processed and presented peptides, as shown by reactivity of these cells against autologous B cells that were nucleofected with minigenes (MG) that encoded these neoantigens. n = 3 biologically independent samples, data are mean ± s.d. d, Ex vivo intracellular cytokine staining of PBMCs from patients 7 and 8 post-vaccination after neoepitope stimulation. PBMCs were pre-gated on CD3+ and CD4+ T cells. Cytokine-producing neoantigen-reactive cells express CD45RO and PD-1, demonstrating an antigen-experienced memory T cell phenotype. SSC, side scatter; All T cell lines originated from week 8 or 16 PBMCs; ELISPOT experiments were performed in triplicate wells per time point.
Neoantigen pool-specific CD4+ T cells from patients 7 and 8 were shown to secrete IFNγ, IL-2 and TNF, singly and in combination, by direct ex vivo intracellular cytokine staining, thus demonstrating the polyfunctionality of these cells (Extended Data Fig. 3e). The IFNγ- and IL-2-producing neoantigen-specific T cells were enriched for CD45RO and PD-1 expression, consistent with generation of antigen-experienced memory T cells following vaccination (Fig. 2d and Extended Data Fig. 3f).
CD8+ T cells from patient 7 that were specific to ARHGAP35MUT and SLX4MUT were able to detect minigene-expressed antigens, but did not recognize an autologous tumour cell line when analysed using a TNF ELISPOT (Extended Data Fig. 4a–d). However, reactivity against tumour-fed dendritic cells was observed for ARHGAP35MUT CD4+ T cells and blocked with class II blocking antibodies, indicating that this epitope can be naturally processed and presented (Extended Data Fig. 4e).
Five patients (3, 4, 5, 7 and 8) with disease progression at a median of 17.3 weeks (range, 6.7–26.3) following vaccine initiation underwent surgery post-vaccination (Extended Data Fig. 5a). Multiplex immunofluorescence detected a significant increase in infiltrating CD8+ T cells at relapse for patients 7 and 8 compared to baseline (average increase 71.0 cells per mm2; 95% confidence interval, 39.1–102.9, P = 0.006; Fig. 3a, Methods and Supplementary Table 6), whereas no increase was observed in patients who received dexamethasone (patients 3, 4 and 5). At relapse, patients 7 and 8 also had increased CD8+ T cells (P = 0.02) and CD4+ T cells (P = 0.008; few of the intratumoral CD4+ T cells had a regulatory T cell phenotype, Extended Data Fig. 5b) compared to patients 3, 4 and 5. The extent of immune cell infiltration into the tumour at initial resection was not related to the predicted number of neoantigens (Extended Data Fig. 5c).
Fig. 3 |. Increase in T cell infiltration evident in patients with circulating neoantigen-specific T cell responses.
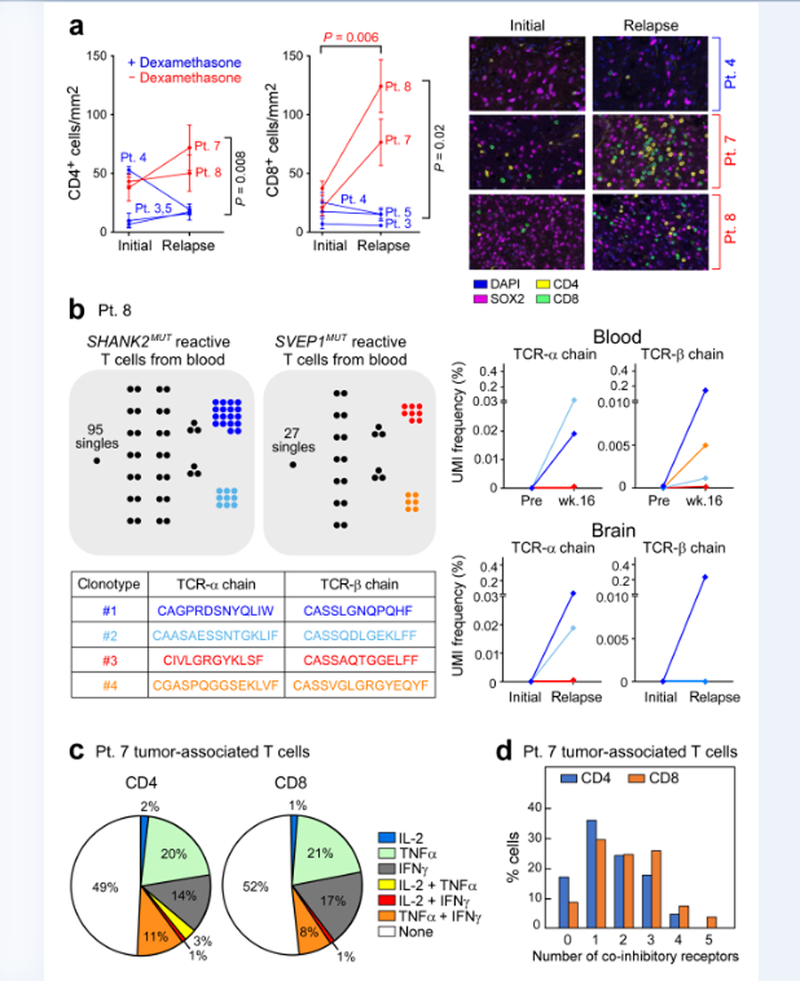
a, Multiplex immunofluorescence staining of five pairs of initial and relapse tumour specimens reveals increased T cell infiltration in patients who did not receive dexamethasone during vaccine priming (red) compared to those who did (blue), with representative sections shown. Sections show SOX2 (magenta) to stain tumour cells, CD4 (yellow) and CD8 (green). Infiltrates were determined by enumerating the mean number of CD4+ and CD8+ cells in 20× fields. The number of fields evaluated per sample was: 4 fields for initial and relapse samples of patients 3 and 8, initial samples of patient 4 and relapse samples of patient 7; and 5 fields for relapse samples of patient 4, initial and relapse samples of patient 5 and initial samples of patient 7. Data are mean ± s.e.m. P values reported are two-sided and based on model F-tests. See Methods for statistical analysis. b, Each dot represents a single T cell, and cells with identical TCRs are clustered together. Two dominant SHANK2 neoantigen-reactive TCRαβ clones (dark and light blue) were identified in T cell lines that were generated from Week 16 post-vaccination PBMCs from patient 8 using an IFNγ secretion assay. These clones were detected among post-vaccination (relapse) but not pre-vaccination (initial) tumour-associated TCRαβ sequences using bulk RNA-seq. Two dominant SVEP1-reactive TCRαβ (red and orange) clones were observed in post-vaccination PBMCs but not in brain tumour biopsies. c, Enumeration of the numbers of single CD4+ and CD8+ tumour-associated T cells that expressed effector cytokines in patient 7, analysed using scRNA-seq. d, CD4+ and CD8+ tumour-associated T cells in patient 7 expressed multiple co-inhibitory receptors based on scRNA-seq.
To determine whether the increased infiltration of tumour-associated T cells following vaccination in patients 7 and 8 included neoantigen-reactive T cells, we tested whether T cell receptor (TCR) CDR3 α and β sequences – which define clones of T cells with neoantigen-specificity – could be found in tumour tissue in the brain. Our first approach, tested in patient 8, was to leverage clonotype information that was obtained from the analysis of neoantigen-stimulated peripheral blood (Extended Data Fig. 5d). Using single-cell TCR sequencing (Methods and Supplementary Table 7) of in vitro neopeptide-stimulated T cells, we identified 113 and 40 TCRαβ T cell clones from 156 and 63 single cells following stimulation with SHANK2MUT and SVEP1MUT peptides, respectively (Extended Data Fig. 5e and Supplementary Table 8). We then used this information to track the frequency of the identified individual TCRα and TCRβ chains within bulk TCR-repertoire sequencing data that were generated from matched pre-vaccine and week 16 PBMC samples or the initial and relapsed tumour RNA specimens (Extended Data Fig. 5d and Supplementary Table 9). TCRα and TCRβ chains that matched the two dominant SHANK2MUT and two SVEP1MUT neoantigen-reactive TCRαβ clones that were isolated from in vitro culture were detected in week 16 but not in pre-treatment peripheral blood, whereas only the SHANK2MUT TCRα and TCRβ chain sequences were directly detectable in the RNA from the relapse (percentage TCRα unique molecular identifiers (UMI: 0.038 and 0.019; percentage TCRβ UMI: 0.233 and 0.000 for clone 1 and clone 2, respectively) but not the initial tumour (Fig. 3b). These data suggest that a subset of T cells with specificities that are consistent with neoantigen reactivity and that have been induced by the administration of the vaccine can successfully traffic to the site of disease in this patient.
Because fresh tumour tissue was available at the time of relapse for patient 7, we were able to test a second approach, which was to use T cell clonotype information discovered directly from tumour-associated T cells. We began by freshly isolating single CD3+ lymphocytes (n = 307) from the post-vaccination tumour of patient 7 and performing single-cell RNA-seq (scRNA-seq), which revealed gene expression information for 81 (26%) CD8+ and 161 (52%) CD4+ tumour-associated T cells (Extended Data Fig. 6a, b and Methods). Nearly all CD8+ T cells expressed markers of cytotoxicity (PRF1, GZMA and GZMK) and appeared to be differentiated cells (CCR7–). Only a minority of CD4+ T cells were regulatory T cells, co-expressing IL2RA and FOXP3, while almost a third expressed cytotoxicity markers9 (Extended Data Fig. 6a, c and Supplementary Table 10). Approximately half of the CD4+ and CD8+ T cells expressed at least one effector cytokine (IFNG, IL2 or TNF) and 20–30% of these demonstrated polyfunctionality (Fig. 3c). The co-inhibitory molecules TIM3 (also known as HAVCR2), TIGIT, PD1 (also known as PDCD1), CTLA4 and LAG3 were commonly expressed alone or in combinations of two or three in both CD4+ and CD8+ cells (Fig. 3d). A subset of post-vaccination tumour-infiltrating CD8+ T cells were PD-1+ and their levels increased significantly with vaccination in patients 7 and 8, consistent with prior activation (P = 0.04; Extended Data Fig. 6d). The low frequency of PD-L1+SOX2+ tumour cells did not change with vaccination nor with dexamethasone exposure (Extended Data Fig. 6e).
To determine whether the T cells from patient 7 that recognized the immunizing neoantigens were clonally expanded in the tumour, we used computationally reconstructed TCR sequences from the scRNA-seq data and targeted resequencing of TCR transcripts (Fig. 4a) to identify paired CDR3α and CDR3β sequences. We identified 231 unique TCR clonotypes with 1–8 cells per clonotype from 277 single CD3+ T cells isolated from the relapsed tumour of patient 7 (Extended Data Fig. 7a and Supplementary Table 11a). Targeted TCR sequencing of post-vaccination circulating neoantigen-reactive T cells from patient 7 was also performed after antigen stimulation to identify any circulating clonotypes that matched those isolated from the relapsed tumour (Extended Data Fig. 7b). From 240 circulating CD4+ T cells, 229 unique T cell clonotypes (1–4 cells per clonotype) were identified and from 125 CD8+ T cells, 57 unique T cell clonotypes (1–49 cells per clonotype) were found (Extended Data Fig. 7a and Supplementary Table 11b, c). Indeed, TCR sequences from four CD4+ and two CD8+ circulating neoantigen-reactive T cell clonotypes were identical to those from the relapsed tumour (Fig. 4b).
Fig. 4 |. TCRαβ clonotypes are shared between tumour-associated T cells and neoantigen-reactive T cells in peripheral blood, with select clones demonstrated to be specific for neoantigens targeted by the vaccine.
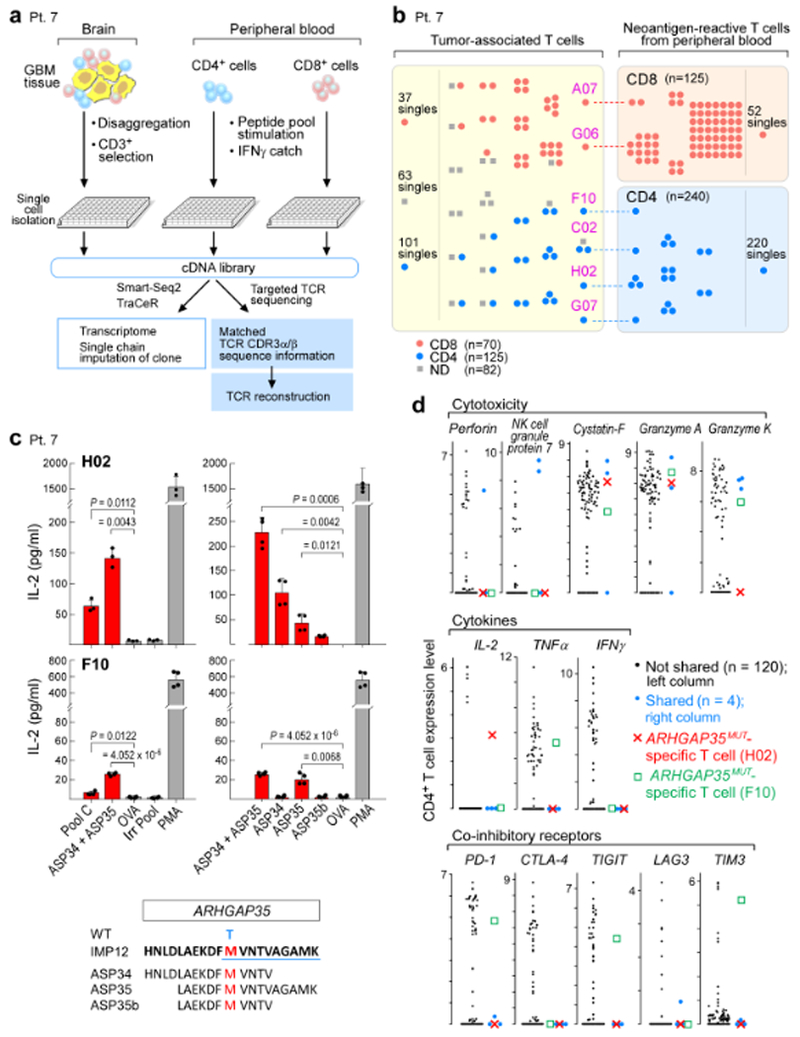
a, Schema of single-cell transcriptome and TCR analysis of T cells isolated from the relapse tumour specimen, and from PBMCs stimulated in vitro with immunizing neoantigens from patient 7. b, Select TCRαβ clones are shared between tumour-associated T cells and neoantigen-reactive T cells in the periphery. Each dot represents a single T cell, and cells with identical TCRs are clustered together. c, CD4+ TCRs H02 and F10, expressed in JurkatΔαβ cells, are specific for ARHGAP35MUT, a neoantigen targeted by vaccination for patient 7. H02 TCR responds predominantly to ASP34, whereas F10 responds to ASP35. Two-sample two-sided t-tests with Welch correction used for comparison to negative control ovalbumin peptide (OVA); Irr Pool, irrelevant peptide pool; PMA, phorbol 12-myristate 13-acetate; WT, wild- type amino acid. Top left n = 3 biologically independent samples, all others n = 2 biologically independent samples, each with two technical replicates. Representative data from one of three independent experiments are shown; data are mean ± s.d. d, Distribution of expression levels (log2(transcripts per million/10 + 1)) for select genes in CD4+ infiltrating T cells, highlighting the ARHGAP35MUT-specific T cells, H02 and F10; blue dots, other cells with TCR clones shared between tumour-associated and neoantigen-reactive T cells in peripheral blood.
The shared TCR sequences were cloned and expressed in CD4+ or CD8+ TCR-deficient Jurkat cells, based on paired CDR3α and CDR3β sequence information10 (Extended Data Fig. 7c, Methods and Supplementary Table 12) and screened for reactivity against neoantigen peptide pools. The predominant CD8+ clone (49 cells) was specific to EPT12A, a predicted epitope from the immunizing neoantigen ARHGAP35MUT of patient 7 (Extended Data Fig. 7d). Two out of four shared CD4+ TCRs (H02 and F10) were shown to be specific to ARHGAP35MUT (Fig. 4c). The H02 and F10 TCRs reacted predominantly to the epitopes ASP34 and ASP35, respectively (Fig. 4c), and both discriminated between mutant and wild-type peptides (Extended Data Fig. 7e). Bulk RNA-seq of the relapsed tumour confirmed expression of the mutated ARHGAP35 allele (Extended Data Fig. 7f). CD4+ T cells with shared TCRs – including the H02 and F10 ARHGAP35MUT-specific T cells (Fig. 4d) – expressed cystatin F, granzyme A, granzyme K, TNF and IL-2, consistent with a previously reported9 signature for cytotoxic CD4+ T cells. The F10 T cells, however, also co-expressed PD-1, TIGIT and TIM3, suggestive of a severe exhaustion phenotype. Furthermore, CD4+ tumour-associated T cells were found to have an exhausted phenotype compared to circulating T cells (Extended Data Fig. 8a–c, Supplementary Table 10), indicating antigen exposure at the site of disease. Although it is possible that the tumour-associated, ARHGAP35MUT-specific T cells are derived from blood vessels within the resected tumour, the increased frequency of each of these clones in the tumour (F10 and H02, 1 out of 277 cells in each case) compared to blood (39 and 29 out of 360,000 T cells reactive to ASP35 and ASP34, respectively, Extended Data Fig. 9a–c) makes this improbable (P = 0.030 for ASP35 and P = 0.023 for ASP34, Poisson test).
In conclusion, neoantigen vaccination is a feasible therapeutic strategy for immunologically cold tumours with a relatively low mutational burden. Although increased CD4+ T cells have been reported in glioblastoma tumours that relapse rapidly11, in our small series we show that low levels of infiltrating T cells at diagnosis increased only among patients who generated neoepitope-specific systemic immune responses. Furthermore, we demonstrated that a subset of these T cells within resected intracranial glioblastoma tumours is specific for neoantigens targeted by vaccination. Similar to our melanoma trial4, prominent CD4+ T cell responses against immunizing neoantigens were detected, despite the use of major histocompatibility complex (MHC) class I binding prediction algorithms. While the reasons for this are unknown, similar findings were observed in a recent personal neoantigen vaccine trial using RNA-encoding MHC class I predicted binding epitopes6. Optimization of algorithms that predict the immunogenicity of CD8+ epitopes12, and eventually CD4+ epitopes, may help to clarify these results as well as enhance immunogenicity.
Of note, systemic immune responses were limited to patients who did not receive dexamethasone during vaccine priming. This is consistent with observations that dexamethasone indicates poor outcome following checkpoint blockade among patients with recurrent glioblastoma13 and patients with melanoma with brain metastases14, possibly because of systemic depletion of naive and memory CD4+ and/or CD8+ T cells15. Despite generating systemic and intratumoral neoantigen-specific immune responses post-vaccination, all patients showed tumour recurrence and ultimately died of progressive disease, indicating that the induced T cell responses must still overcome considerable challenges to produce clinically relevant anti-tumour activity, including tumour-intrinsic defects and immunosuppressive factors in the microenvironment16,17. Low expression of MHC class I in the tumour and the lack of expression of class II (Extended Data Fig. 4b, c) may hinder tumour recognition by neoantigen-specific T cells. However, IFNγ increased MHC I expression in a glioblastoma cell line from patient 7 (Extended Data Fig. 4b), suggesting that inflammation and T cell-derived IFNγ may increase HLA expression in vivo and aid tumour recognition. Finally, we found that infiltrating T cells post-vaccination—including those with neoantigen specificity—expressed multiple co-inhibitory receptors, consistent with a profound exhaustion phenotype18. These observations, combined with anticipated improvements in the timing of vaccine generation provide a rationale to evaluate neoepitope vaccination combined with immune checkpoint blockade for the treatment of glioblastoma.
METHODS
Trial design and treatment
The trial protocol and all amendments were approved by the Dana-Farber/Harvard Cancer Center (DF/HCC) Institutional Review Board (IRB). The trial was conducted in accordance with the Declaration of Helsinki and the International Conference on Harmonization Good Clinical Practice guidelines and was registered at ClinicalTrials.gov (https://clinicaltrials.gov/; NCT02287428). All patients provided written informed consent before study entry, following DF/HCC IRB protocol approval. All authors attest that the trial was conducted in accordance with the protocol and all amendments; and that they had access to data used for the writing of the manuscript, and vouch for the accuracy and completeness of the data and analyses.
Study eligibility was assessed among patients seen at the Center for Neuro-Oncology, Dana-Farber Cancer Institute and required: age ≥18 years; Karnofsky performance status ≥70; histopathological confirmation of WHO grade IV glioblastoma (GBM) or variant; tumour MGMT promoter unmethylated by CLIA-certified laboratory; supratentorial tumour with no more than 4 cm in maximal diameter of enhancing tumour on post-operative imaging in any plane; and adequate hepatic, renal and bone marrow function. Patients were excluded if: fewer than five actionable neoepitopes were identified for vaccine generation; they developed disease progression following external beam radiotherapy as defined by Response Assessment in Neuro-Oncology (RANO)19; required more than 4 mg of dexamethasone per day within one week before vaccine initiation; developed active infection; or were pregnant or lactating.
Following surgery, patients received conventional radiation therapy administered at 180–200 cGy per fraction daily for five days per week to a total of approximately 60 Gy. Personalized neoantigen vaccines were prepared using information from fresh tumour and normal tissue obtained at the time of diagnostic resection, as described below. Temozolomide chemotherapy was not administered as this adds only nominal benefit for patients with tumours that lack methylation of the MGMT promoter20. The vaccine was administered subcutaneously at least four weeks following completion of external beam radiotherapy. Five priming vaccine doses were initially administered over four weeks (days 1, 4, 8, 15 and 22) followed by two booster doses eight and sixteen weeks later. For each dose, vaccine pools were administered within six hours of thawing in a non-rotating fashion to one of up to four extremities. Concomitant medications deemed necessary for adequate patient care were allowed, including concomitant corticosteroids for symptoms associated with cerebral oedema, but the study vaccine was held for patients requiring more than 4 mg per day of dexamethasone within seven days of vaccine administration. Clinical assessment and monitoring using the RANO criteria19 and the Immunotherapy Response Assessment in Neuro-Oncology criteria21 is described in the Supplementary Information.
Generation of personalized neoantigen vaccines
The personalized neoantigen vaccines were prepared based on the analysis of whole-exome sequencing (WES) and RNA-seq data generated from fresh-frozen tumours or tumours that were available as formalin-fixed paraffin-embedded (FFPE) tissue, obtained at the time of diagnostic resection. WES of normal tissue was generated from autologous PBMC DNA (Supplementary Table 1a). Details of the WES and RNA-seq protocols can be found in the Supplementary Information. Patient HLA allotype was assessed using standard class I and class II PCR-based typing (BWH Tissue Typing Laboratory). Coding mutations were identified and personal neoantigens were predicted based on binding affinity analysis to individual HLA alleles using the class I MHC binding prediction tool NetMHCpan version 2.422; with a cut-off of predicted IC50 < 500 nM for selected epitopes.
WES.
CLIA-certified WES was conducted by the Clinical Research Sequencing Platform, Broad Institute (CLIA 22D2055652). Library construction from surgical GBM specimens and matched germline DNA of all 10 patients was performed as previously described23. For patients 1, 2 and 9, whole-exome capture was performed using the Agilent SureSelect Human All Exon 44 Mb version 2.0 bait set (Agilent Technologies)24. For patients 3, 4, 5, 6, 7, 8 and 10, WES was performed using the Illumina Nextera Rapid Capture Exome version 1.2 bait set. Data were analysed using the Broad Picard Pipeline (version 1.752), which includes de-multiplexing, duplicate marking and data aggregation.
RNA-seq.
For RNA-seq library construction, RNA was extracted from fresh-frozen sections (patients 1, 2 and 9) or FFPE samples (patients 3, 4, 5, 6, 7, 8 and 10) using the Qiagen AllPrep DNA/RNA/miRNA Universal Kit or Qiagen AllPrep DNA/RNA FFPE Kit, respectively. RNA-seq libraries were prepared using Illumina TruSeq Stranded mRNA Library Prep Kit or Illumina’s TruSeq RNA Access Library Prep Kit (Supplementary Table 1b). Total RNA was quantified using the Quant-iT RiboGreen RNA Assay Kit and normalized to 5 ng μl−1. For patients 1, 2 and 9, each sample was transferred into a library preparation that was an automated variant of the Illumina TruSeq Stranded mRNA Sample Preparation Kit. The resulting libraries were quantified with qPCR using the KAPA Library Quantification Kit for Illumina Sequencing Platforms. Data were analysed using the Broad Picard Pipeline, which includes de-multiplexing and data aggregation. RNA-seq data were not available for patient 5, due to tissue necrosis in the tumour sample.
DNA quality control.
Broad Institute protocols as previously described25,26 were used for DNA quality control. The identities of all tumour and normal DNA samples were confirmed by fingerprint genotyping of 95 common single-nucleotide polymorphisms by Fluidigm Genotyping (Fluidigm). Sample contamination by foreign DNA was assessed using ContEst (version 1.4–437)27.
Somatic mutation calling.
Analyses of WES data of tumour and matched PBMCs (as source of normal germline DNA) from the patients were used to identify the specific coding-sequence mutations, including single-, di- or tri-nucleotide variants that lead to single amino acid missense mutations and small insertions/deletions (indels). Output from Illumina software was processed by the Broad Picard Pipeline to yield BAM files, which contained aligned reads (bwa version 0.5.9, aligned to the NCBI Human Reference Genome Build hg19) with well-calibrated quality scores25,28. Somatic alterations were identified using a set of tools within the ‘Firehose’ pipeline (https://software.broadinstitute.org/cancer/cga/). Somatic single nucleotide variations (sSNVs) were detected using MuTect (Firehose version 13112); somatic small insertions and deletions were detected using Indelocator (version 1.0)25 and Strelka (version 1.0.11)29. All indels were manually reviewed using the Integrative Genomics Viewer (IGV version 2.4)30. All somatic mutations, insertions and deletions were annotated using Oncotator (version 1.4.1)31. The ABSOLUTE algorithm (version 1.1) was used to calculate the purity and ploidy of the samples. RNA-seq data were processed using the PRADA software (version 1.1)32 and tumour transcriptional data were displayed alongside data from normal brain cortical tissue from the GTEx project49 (analysis V6, dbGaP accession phs000424.v6.p1) and from GBM from TCGA50.
Identification of target epitopes for peptide design.
NetMHCpan version 2.4 was used to identify mutation-containing epitopes that are predicted to bind to the MHC class I molecules of each individual patient22,33,34. Up to 30 peptides of 15–30 amino acids length (long peptides) that arose from up to 30 independent mutations were selected and prioritized for peptide preparation. Epitopes were chosen for inclusion based on a pre-defined set of criteria in the following rank order: (1) NeoORFs (neoantigen open reading frame) that included predicted binding epitopes; (2) sSNVs with high predicted affinity (<150 nM) due to changes in anchor residues; (3) sSNVs with high predicted affinity (<150 nM) due to mutations in positions other than anchor residues; (4) NeoORFs with no predicted binding epitopes; (5) lower affinity (<150–500 nM) versions of (2) and (3).
Mutations in oncogenes were given the highest priority within each ranked group; otherwise epitopes were ranked by predicted mutated peptide affinity. Only sSNVs that demonstrated expression of the mutated allele were used (not available for patient 5). Additionally, a variety of possible biochemical properties (hydrophobicity or presence of multiple cysteines), which may affect the synthesizability or solubility of the long peptide were considered.
Synthesis of long peptides, pooling and final vaccine preparation.
Good Manufacturing Practice (GMP) peptides 20–30 amino acids in length were synthesized by standard solid-phase synthetic peptide chemistry and purified using reverse phase high performance liquid chromatography (RP-HPLC) (CSBio). Each vaccine consisted of up to 20 distinct peptides that were grouped into four pools (A, B, C and D), each consisting of up to five peptides, with the intent of separating peptides that bind to the same MHC allele into different pools to decrease potential antigen competition at the draining lymph node. For each dose, the vaccine pools were administered within six hours of thawing, in a non-rotating fashion to one of up to four extremities. The final concentration of peptides per pool was 400 μg ml−1, with a goal of administering a final dose of 300 μg of each peptide per vaccine injection. Each vaccine pool was filter-sterilized and frozen at −80 °C. Following final testing for identity, sterility and endotoxins, vaccine pools were released for clinical use. On the day of vaccine administration, each pool was thawed and 0.75 ml was mixed with 0.25 ml (0.5 mg) of polyinosinic and polycytidylic acid, stabilized with poly-l-lysine and carboxymethylcellulose (poly-ICLC, Hiltonol, Oncovir) for a final administration volume of 1.0 ml per pool.
Patient samples and cell lines
Tumour samples and heparinized blood were obtained from study subjects on IRB-approved protocols at the DFCI. Patient samples were de-identified and assigned a study-specific tracking number. PBMCs were collected via leukapheresis before initiation of external beam radiotherapy (pre-treatment baseline) and approximately eight weeks following completion of priming vaccine dosing. PBMCs were isolated by Ficoll/Hypaque density-gradient centrifugation (GE Healthcare) and cryopreserved with 10% dimethyl sulfoxide in FBS (Sigma-Aldrich). Cells and serum from patients were stored in vapour-phase liquid nitrogen until the time of analysis. The GBM cell line of patient 7 was established from tumour cells collected from surgical resection at initial diagnosis (Extended Data Fig. 4a); the protocol for generation is described in the Supplementary Information. JurkatΔαβ is a TCR-deficient Jurkat cell line (genetically engineered to lack endogenous TCR expression by CRISPR–Cas9 targeting, with stable expression of CD28, CD8, and CD4) obtained from A. Muraguchi and H. Kishi (Department of Immunology, University of Toyama). This cell line has been confirmed to be mycoplasma-free and has been well-characterized in previous publications10,35.
Antigen formats for immune monitoring
Assay (ASPs) and predicted class I epitope peptides (EPTs) were synthesized and lyophilized (from either JPT Peptide Technologies or RS Synthesis; >80% purity) in a manner previously described4. ASPs were 15–16 amino acids long and overlapped by at least 11 amino acids, covering the immunizing peptide sequence. EPTs were 9–10 amino acids predicted to be MHC class I restricted neoepitopes. Minigenes were constructed for the ASP and EPT peptides that elicited a response from patient PBMCs. Autologous CD19+ B cells were isolated from pre-vaccine PBMCs and were nucleofected with minigenes using program X-001 (Amaxa Cell Line Nucleofector Kit V; Lonza). The complete protocol is described in the Supplementary Information. For experiments testing direct tumour recognition, GBM cell lines from patient 7 were dissociated and passaged using Accutase (Sigma-Aldrich) and dissociated using Versene (Gibco, ThermoFisher). The protocol for cross-presentation assays36 is described in the Supplementary Information.
Generation and detection of patient neoantigen-specific T cells
ELISPOT assays.
Screening ex vivo IFNγ ELISPOT assays on PBMCs stimulated for 18 h with synthesized screening peptides consisting of ASP and EPT peptides were performed. The averages of responses to DMSO, HIV-GAG or OVA peptide for each time point were subtracted from experimental wells for background correction37. If no responses were observed, additional in vitro stimulation with the peptide pool was performed for up to 21 days. Upon detection of a positive ELISPOT response (defined as at least 55 spot-forming units (SFU) per 106 PBMCs or a ≥3-fold increase over baseline), the peptide pools were allocated into sub-pools in order to deconvolute the peptide pool to determine the immunogenic peptide(s) per pool. PBMCs were cultured in DMEM GlutaMAX medium supplemented with HEPES, β-mercaptoethanol, sodium pyruvate, nonessential amino acids, penicillin–streptomycin (Gibco, ThermoFisher) and 10% AB-positive heat-inactivated human serum (Gemini Bioproduct). For in vitro expansion (pre-stimulation) of antigen-specific T cells, PBMCs were stimulated in 24-well cell-culture plates at 5 × 10⁶ cells per well with individual (10 μg ml−1) or pooled peptides (each at 10 μg ml−1) in the presence of IL-7 (20 ng ml−1; Peprotech). On day 3, low-dose IL-2 (20 U ml−1; Amgen) was added. Half-medium change and supplementation of cytokines were performed as necessary, as described previously38. After 10–21 days, T cell (referred to as ‘T cell lines’) specificity was tested against peptide, minigenes or the autologous tumour by IFNγ or TNF ELISPOT in DMEM medium supplemented with penicillin–streptomycin and 10% FBS (complete DMEM) as previously described4. For deconvolution of CD4+ and CD8+ T cell responses, CD4+ and CD8+ T cells were enriched immunomagnetically (CD8+, CD4+ T cell Isolation Kit beads, Miltenyi Biotec) before plating for ELISPOT.
Intracellular cytokine staining.
PBMCs were thawed and rested overnight in DMEM GlutaMAX medium (Gibco, ThermoFisher) supplemented with 10% AB-positive heat-inactivated human serum (Gemini Bioproduct), nonessential amino acids, HEPES, β-mercaptoethanol, sodium pyruvate, penicillin–streptomycin (Gibco, ThermoFisher) and 20 ng ml−1 IL-7 (Peprotech). On the next day, PBMCs were stimulated with 10 μg ml−1 vaccine peptide pools, HIV-GAG peptide (negative control) or 1% phytohemagglutinin (PHA) (positive control) overnight. Stimulated PBMCs were treated with GolgiStop (BD Biosciences) according to the manufacturer’s recommendations for 8 h the following day. After treatment, PBMCs were stained for 30 min at room temperature with a fixable dead cell stain (Thermofisher), anti-CD3 (BV605), anti-CD8 (PerCP–Cy5.5), anti-CD4 (BV650) (BD Biosciences), anti-CD45RO (APC–Cy7) and anti-PD-1 (PE) (Biolegend). Cells were fixed and permeabilized (Fixation/Permeabilization Solution Kit, BD Biosciences). Intracellular cytokines were stained with anti IFNγ (PE–Cy7), IL-2 (APC) and TNF (AF700) (BD Biosciences) for 1 h at 4 °C. Cells were washed with permeabilization buffer and fixed (1% paraformaldehyde solution, Sigma-Aldrich). Cells were analysed using a BD Fortessa flow cytometer. Live lymphocytes were gated on forward and side scatter and live/dead staining, and CD3 positivity was used to determine the T cell gate. CD4+ versus CD8+ cells were gated and cytokine staining was plotted on each population using the program FlowJo.
Multiplex immunofluorescence
Staining was performed using BOND RX fully automated stainers (Leica Biosystems). The target antigens, antibody clones and dilutions for markers, as well as the details of controls are listed in Supplementary Table 6. Image acquisition was performed using the Mantra multispectral imaging platform (Vectra 3, PerkinElmer). Areas with non-tumour or residual normal tissue (that is, residual lymph node) were excluded from the analysis. Representative regions of interest were chosen by the pathologist, and multiple fields of view were acquired at 20× resolution as multispectral images. Cell identification was performed as described39, using supervised machine learning algorithms within Inform 2.3 (PerkinElmer). Thresholds for ‘positive’ staining and the accuracy of phenotypic algorithms were optimized and confirmed by the pathologist (S.J.R.) for each case. The protocol is described in full in the Supplementary Information.
Processing of GBM and PBMC specimens for scRNA-seq
Surgically resected GBM tissue from patient 7 was obtained on ice within 30 min of lesion excision. The tumour specimen was mechanically disrupted into small pieces with a disposable, sterile scalpel and further dissociated into a single-cell suspension using the enzymatic brain dissociation kit (P) from Miltenyi Biotec, following the manufacturer’s protocol. Fc receptor blocking was performed on the total cell suspension using Human TruStain FcX (Biolegend). The cell suspension was subsequently stained for flow cytometry using antibodies against CD45 [HI30]-BV605, CD3 [HIT3a]-BV510 from BD Bioscience, CD4 [OKT4]-PE–Cy7, CD8 [HIT8a]-PerCP–Cy5.5, exclusion panel–APC (CD14 [63D3], CD64 [10.1], CD163 [GHI/61], CD15 [HI98] from Biolegend and CD66b [G10F5] from ThermoFisher Scientific). The tumour cell suspension was next spiked with 1 μM calcein AM (ThermoFisher) to enable gating of live cells and incubated in the dark at room temperature for 10 min. Live, single T cells (gating: calcein AM+, exclusion−, CD45+, CD3+, CD8+ or CD4+) were sorted into individual wells of a 96-well twin.tec PCR plate (Eppendorf), which contained 10 μl per well of RLT buffer (Qiagen), using an AriaIII fluorescence-activated cell sorter (FACS) with a 70-μm nozzle (BD Biosciences). Plates were immediately centrifuged at 800g for 1 min at 4 °C and frozen on dry ice.
Single neoantigen-reactive CD4+ and CD8+ T cells were isolated from PBMCs of patient 7, obtained 8–16 weeks after vaccine initiation. For isolation of CD4+ T cells, PBMCs were stimulated in vitro with 10 μg ml−1 of ASP peptide pools overnight, and then subsequently flow cytometrically sorted on the basis of IFNγ secretion (IFNγ Secretion Assay, Miltenyi Biotec) and co-expression of CD3+ and CD4+ into 96-well plates (FACSAria II Cell Sorter, BD Biosciences). Single neoantigen-reactive CD8+ T cells were isolated from PBMCs of patient 7 that were stimulated with 10 μg ml−1 of EPT peptides, corresponding to the ARHGAP35MUT or SLX4MUT peptides in DMEM complete medium supplemented with 10% human serum. Three days after stimulation, the cells were supplemented with human IL-2 (20 units) and human IL-7 (20 ng ml−1). The medium was replenished as necessary over three weeks of culture, after which CD8+ T cells were enriched (CD8 magnetic beads, Miltenyi Biotec), rested overnight in cytokine-free medium and then stimulated overnight with autologous APCs (CD4- and CD8-depleted PBMCs) loaded with peptide (10 μg). Subsequently, IFNγ-producing neoantigen-responsive cells were stained and sorted as single cells into 96-well plates, as above.
scRNA-seq data generation and analysis
scRNA-seq data were generated using a modified version of the Smart-seq2 protocol, as previously described40. As we reported previously41, we mapped the scRNA-seq reads to the human transcriptome (hg19) using Bowtie (v1.2.0)42 and quantified gene expression as transcripts per million (TPM) using RSEM (v1.1.17)43. We further normalized the data as E = log2(TPM / 10 + 1) and evaluated the number of genes detected in each cell and the average expression (E) of T cell markers (CD2, CD3D, CD3E and CD3G); 307 out of 384 cells that were sequenced had at least 1,800 detected genes and genes with average Emarker genes > 2 were retained for further analysis. Genes were retained for further analysis if their average TPM across all cells that were retained for analysis was above 3. Next, we defined expression scores, for each cell, for the following genes and signatures, based on the average E of the gene(s) indicated in parenthesis: (1) CD4 (CD4); (2) CD8 (CD8A and CD8B); (3) regulatory T (Treg) cells (FOXP3 and IL2RA); (4) cytotoxic T cells (PRF1, GZMA, GZMK, NKG7 and CST7); (5) naive/memory T cells (CCR7, TCF7, SELL, CD27, CD28 and IL7R); and (6) co-inhibitory receptors (PD1, CTLA4, TIGIT, LAG3 and TIM3). Note: GZMB was excluded due to minimal expression across all cells. We classified cells into corresponding classes if they passed the average expression threshold (>3) for the gene/signature of the class, but were lower than another threshold (<1) for the alternative class. Thus, cells were classified as CD4+ and CD8+ by the corresponding score being larger than three and the alternate score being smaller than one, with remaining cells being considered unresolved (ND, not determined) and excluded from further analysis. CD4+ cells were further classified as Treg cells or as cytotoxic T cells if they had Treg or cytotoxic scores higher than three; no cells had scores higher than three for both signatures.
We attempted to computationally reconstruct TCRs from each single-cell transcriptome, including those that did not pass our quality control for gene expression, using TraCeR (version 0.4.0)44. We next defined putative clones by grouping cells having identical reconstruction of the TCRα or TCRβ chains. This was performed for the tumour-associated T cells as well as for the T cells from peripheral blood samples, to distinguish clonotypes that were specific to the tumour from those that are shared with the blood.
Targeted TCR sequencing
Targeted amplification of TCR transcripts was performed in a 96-well plate format using single-cell-amplified cDNA libraries (before fragmentation), either from the Smart-seq2 procedure described above or prepared using the NEBNext Single Cell/Low Input cDNA Synthesis & Amplification Module (New England BioLabs E6421L). The protocol uses RNase H-dependent polymerase chain reaction (rhPCR) technology to improve the specificity for differential amplification of TCR alleles45 and uses double indexing to avoid the problem of index switching46. The sequences of all primers (Integrated DNA Technologies) used in the protocol are provided in Supplementary Table 7. Sequencing was performed on the Illumina MiSeq with the 300-cycle Reagent Kit version 2 (MS-102–2002). The protocol is described in full in the Supplementary Information.
The raw single-cell TCR sequencing data were demultiplexed using the well-specific dual indices. For each well, the paired-end reads were first aligned to V primers and C primers to separate the TRA and TRB reads (e < 0.001, BLAST version 2.2.30+)47. Only the reads with consistent V and C primers aligned were kept (for example, one read with R1 aligned to a TRAV primer and R2 aligned to the TRAC primer). The separated TRA and TRB reads were aligned to TCR reference sequences using MiXCR-2.1.548, and a set of clonotypes was assembled for each gene in each well. The most abundant productive α and β clonotypes were selected and paired for each well.
The protocol was adapted for the analysis of bulk RNA by substituting a reverse transcriptase reaction for the single-cell cDNA library, as described in the Supplementary Information.
RNA extraction for bulk TCR sequencing
Banked frozen GBM tumour biopsies of patient 8 at diagnosis and at relapse were physically dissociated using a tissue homogenizer in QIAGEN-RNeasy Mini kit buffers and RNA was extracted as described in the manufacturer’s protocol. Cryopreserved PBMCs collected from patient 8 pre- and post-vaccine were thawed and rested overnight in DMEM GlutaMAX medium (Gibco, ThermoFisher), supplemented with 10% AB-positive heat-inactivated human serum (Gemini Bioproduct), nonessential amino acids, HEPES, β-mercaptoethanol, sodium pyruvate, penicillin–streptomycin (Gibco, ThermoFisher) and 20 ng ml−1 IL-7 (Peprotech). On the next day, 5 × 10⁶ PBMCs were collected and total RNA was extracted using a QIAGEN RNeasy Mini kit.
Generation and antigen-specificity testing of TCR-expressing Jurkat reporter cell lines
The TCR cloning and expression protocol10 is described in the Supplementary Information. We used TCR-deficient Jurkat cells (JurkatΔαβ)35 transduced to express CD4 and CD8 as reporter cells. To assess antigen specificity of the cloned TCRs, we pulsed dendritic cells derived from patient PBMCs with candidate peptides (10 μg ml−1 unless specified otherwise) for 2 h in complete RPMI. Reporter cells stably expressing TCR were co-cultured in 96-well round bottom plate with pulsed dendritic cells, in a ratio of 20:1 (0.5 × 10⁶ Jurkat-expressing TCR cells to 2.5 × 10⁴ dendritic cells) in complete RPMI. After 24 h at 37 °C and 5% CO2, the supernatant was collected and diluted 1:2 with ELISA Assay Diluent (Biolegend) and IL-2 production was measured using the Human IL-2 ELISA MAX Standard Kit (Biolegend) according to the manufacturer’s instructions. OVA peptide was used as a negative control and PMA/ionomycin was used as a positive control.
Statistical considerations
This study incorporated co-primary end points of safety and feasibility. Safety was assessed using a standard dose escalation design. With a true probability of dose limiting toxicity (DLT) estimated to be ≤10%, 0 or 1 DLT in a cohort of five patients was associated with a 92% probability of proceeding to the dose expansion phase. Patients were deemed evaluable for DLT if they received at least three study vaccinations or experienced DLT. A stopping rule for unexpected toxicity during the expansion phase was incorporated that required interruption of further accrual to the dose expansion if four or more patients experienced DLT. Feasibility was assessed as the percentage of patients who were able to have at least 10 actionable neoepitope vaccine peptides generated and the percentage of patients who were able to initiate study vaccination within 12 weeks of diagnostic surgery. Feasibility was defined as at least 50% of the patients (1) having at least 10 actionable peptides for vaccine production and (2) initiating vaccine therapy within 12 weeks of diagnostic surgery.
Changes between pre-treatment and post-vaccination PBMC immune responses were assessed using the Wilcoxon signed-rank test. All P values were two-tailed and reported without adjustment for multiple comparisons (Fig. 2a). Summary statistics were used to assess other measures of immune cell status. For the ELISPOT analyses, data for each pool were normalized against the control by taking the average of the control for each time period and subtracting it from each of the three replicate pool measurements at that time. If the normalized value was less than zero, then zero was substituted. The normalized numbers of SFU per assay per unit time were estimated using repeated-measures regression with an unstructured covariance to model the variation over time. In the model, assay, time and the interaction of assay and time were predictors. Estimates of the average numbers of SFU for each assay were based on least-squares means. To control for multiplicity within a time point, P values for the comparisons of each pool against zero were adjusted using the Benjamini–Hochberg procedure, thereby maintaining an overall type-I error of 0.05 at each time.
Investigations of changes in the T cell infiltrate between initial and relapse tumour resection specimens from patients 3, 4, 5, 7 and 8 were based on repeated-measures linear models with the number of cells per mm2 as the dependent variable and treatment, time and their interaction as independent variables (Fig. 3a and Extended Data Fig. 6d, e). Comparisons between dexamethasone/no dexamethasone arms were made, and because of the multiple measurements per patient at each time point, the covariance structures of all models were adjusted to allow for clustering by patient within the data. P values were based on model F-tests. Statistical significance was defined as P < 0.05. There were no corrections for multiple comparisons.
Rates of detection of ASP35 and ASP34 specificity among single T cells in the brain at relapse and in the PBMCs collected at week 16 (patient 7) were compared using a Poisson test, with statistical significance defined as P < 0.05.
The distributions of progression-free and overall survival are summarized using the method of Kaplan–Meier. Median percentages are presented with standard errors estimated using log(−log(outcome)) methodology. Follow-up duration, which was defined as the time from diagnosis to death or database cut-off, was calculated for all patients.
Extended Data
Extended Data Fig. 1 |. Mutational landscape of patient GBM tumours.
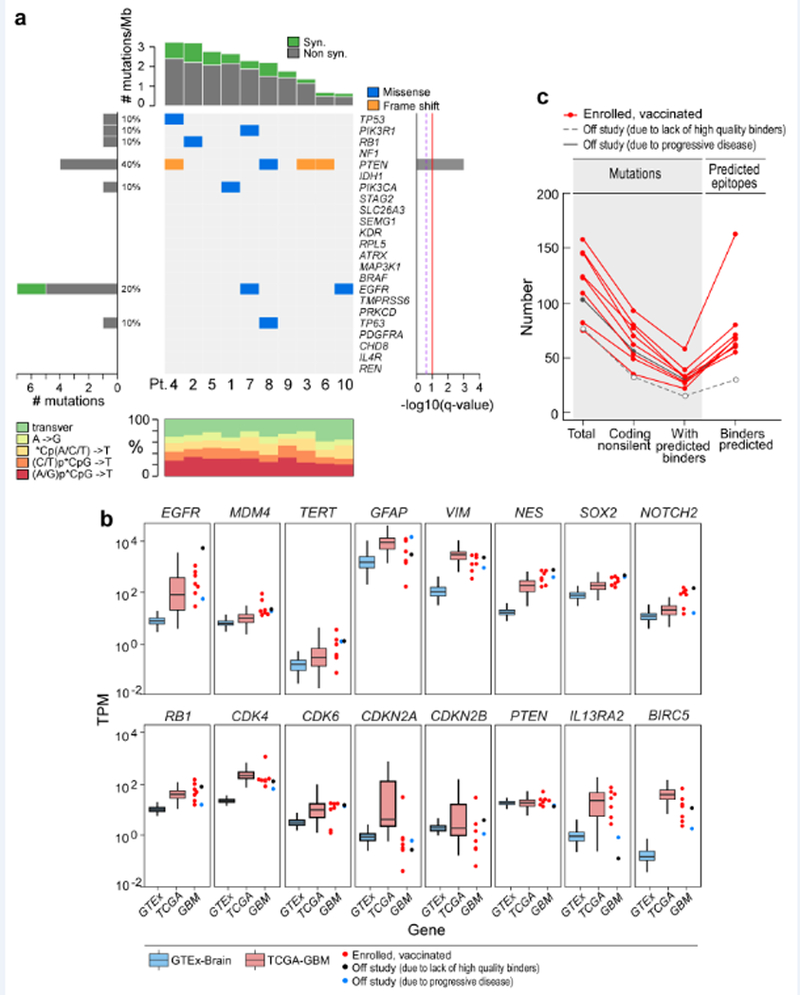
a, The overall mutational landscape of the GBM tumours from 10 enrolled patients (top, number of mutations per Mb; bottom, distribution of nucleotide changes) and the presence of mutations in genes that have previously been identified as recurrent in GBM TCGA samples (n = 290) by the MutSig2CV algorithm51 (middle; genes are ordered on the basis of the significance of recurrence reported in the TCGA). b, Expression profiles of the GBM specimens from patients at study entry, according to RNA-seq analysis (Methods). This analysis revealed that tumour samples from the patients showed: EGFR upregulation (consistent with EGFR amplification and polysomy 7), MDM4 upregulation (consistent with p53 pathway dysregulation), TERT upregulation, upregulation of genes associated with glial intermediate filaments (for example, GFAP, VIM and NES), upregulation of markers of GBM stemness (for example, SOX2 and NOTCH2), Rb pathway dysregulation (for example, RB1, CDKN2A and CDKN2B downregulation and CDK4 and CDK6 upregulation), PTEN downregulation (consistent with monosomy 10) and upregulation of IL13RA2 and BIRC5 (which encodes survivin). Tumour RNA-seq data were available for 9 out of 10 study subjects (red dots, vaccinated, n = 7; blue dots, not included in study because of progressive disease, n = 1; black dots, not included in study because of insufficient numbers of binders, n = 1) and were normalized as transcripts per million base pairs (TPM). These data were compared to expression data from normal brain tissue (GTEx data, blue box) and a published cohort of GBMs (TCGA, red box). The upper, middle and lower hinges of the box plot are 75th, 50th and 25th quartiles, the whiskers extend to 1.5× the interquartile range below and above the lower and upper hinge, respectively, and points above or below the whiskers represent outliers. c, Numbers of mutations and predicted epitopes for all study subjects (Supplementary Table 4). Red lines, patients for whom vaccines were generated (n = 8); grey solid line, patient who was removed from the study before vaccine administration owing to progressive disease (n = 1); grey dotted line, patient had an insufficient number of mutations to proceed to vaccine generation (n = 1).
Extended Data Fig. 2 |. Mapping of CD4+ and CD8+ T cell responses to individual ASP and EPT to the immunizing peptides for patients 7 and 8.
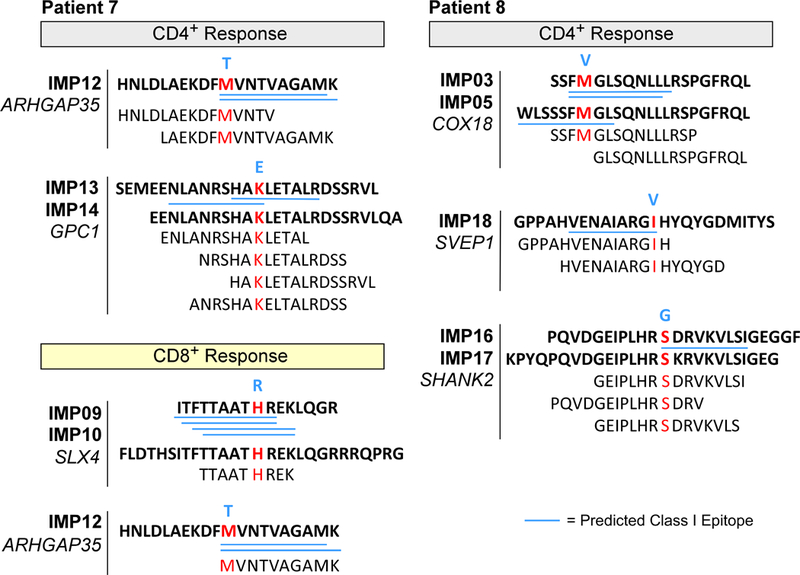
ASP and EPT that cover the immunizing peptides (IMPs) are shown for the immunizing peptide(s) that induced T cell responses. Blue bold, germline amino acid; red bold, mutated amino acid. Blue underline, predicted class I epitopes (IC50 < 500 nM) based on NetMHCpan16,32.
Extended Data Fig. 3 |. Neoantigen-specific T cell responses generated by vaccine in patients.
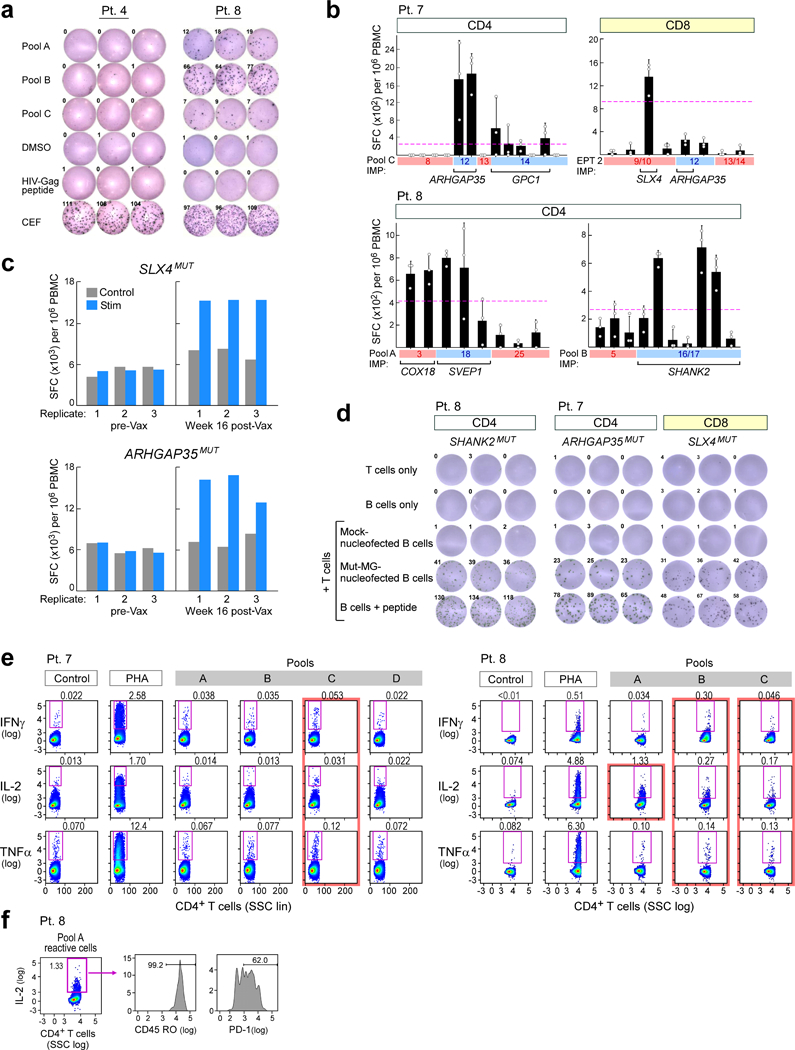
a, Ex vivo IFNγ ELISPOT observed in a patient treated with dexamethasone during vaccine priming (patient 4, left) showed no response at 12 weeks after vaccination, whereas a patient who did not receive dexamethasone (patient 8, right) showed strong response already at 8 weeks after vaccination. b, Deconvolution of post-vaccination CD4+ and CD8+ immune responses following stimulation to the neoantigen vaccine pools using IFNγ ELISPOT assays. n = 3 biologically independent samples, data are mean ± s.d. c, SLX4MUT and ARHGAP35MUT CD8+ T cell responses are only detected by ELISPOT assay in samples 16 weeks after vaccination, not pre-vaccination samples after stimulation in vitro for three weeks. d, Representative IFNγ ELISPOT responses from dominant neoantigen-specific T cell lines established from week 8 or week 16 PBMCs of vaccinated patients against minigene-transfected patient B cells, demonstrating epitope processing and presentation; ELISPOT experiments were performed in triplicate wells per time point. e, Analysis of ex vivo T cell responses to neoantigen pools using intracellular cytokine staining followed by flow cytometry. Data are representative of results from three independent experiments. f, IL-2 producing pool A-reactive T cells isolated ex vivo from patient 8 express CD45RO (memory) and PD-1 (activation) markers. Data are representative of results from two independent experiments.
Extended Data Fig. 4 |. Characterization of tumour expression markers and HLA class I and class II in GBM.
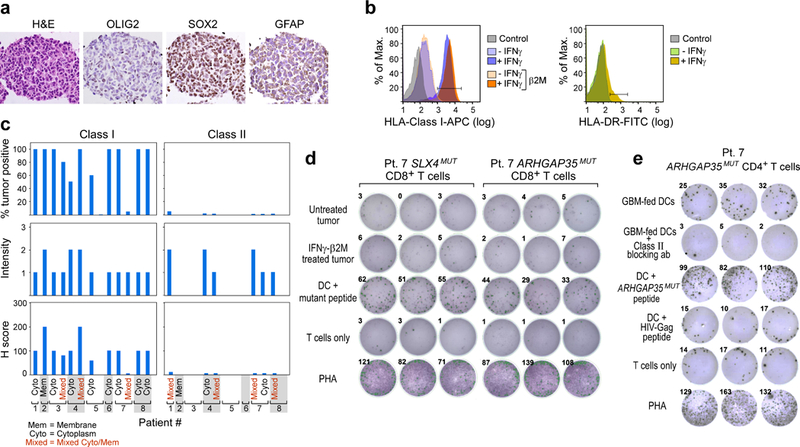
a, The GBM tumour cell line from patient 7 that was established from the initial resection is positive for GBM tumour markers by immunohistochemistry. b, The GBM tumour cell line generated from initial resection tissue of patient 7 has low HLA-class I expression that is upregulated by IFNγ treatment and is negative for HLA-class II DR expression. This experiment was repeated four times. c, Immunohistochemistry analysis of HLA-class I and II expression on diagnostic sections of GBM tumours from the eight patients enrolled and vaccinated in the study. This experiment was performed once, with the available resection tissue. d, Neoantigen-specific CD8+ T cells generated by vaccination of patient 7 do not recognize the GBM tumour cell line generated from initial resection tissue of patient 7 by TNF ELISPOT assay with or without IFNγ treatment to upregulate HLA-class I expression on tumour cells. Data were generated from one experiment with three replicate wells. Additional direct tumour recognition assays performed with IFNγ ELISPOT demonstrated similar results (data not shown). e, IFNγ secretion by the neoantigen-specific CD4+ T cell line generated from PBMC of patient 7 against autologous dendritic cells co-cultured with irradiated autologous GBM. Class II blocking antibody attenuated the IFNγ response. All T cell lines originated from week 16 PBMCs; ELISPOT experiments were performed in triplicate wells per time point.
Extended Data Fig. 5 |. Analysis of tumour morphology, immune infiltration at initial resection and relapse, and TCR clonotypes of patient 8.
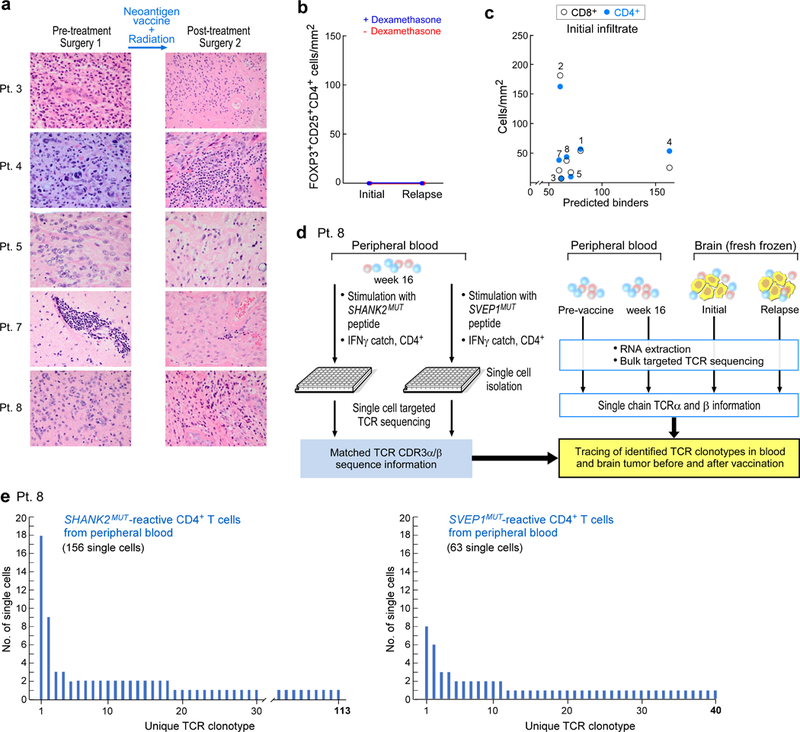
a, Haematoxylin and eosin staining of initial and post-vaccination resection samples show the most-prominent changes for patients 4, 7 and 8, including high levels of perivascular lymphocytes, extensive cystic changes and necrosis post-treatment in patient 7, low tumour content and patchy lymphocytic infiltration in patient 8 and sarcomatous morphology with myomatous changes in patient 4. b, No FOXP3+ and CD25+ CD4+ cells were detected in matched initial and relapse tumour sections, evaluated by multiplex immunofluorescence. c, No correlation was observed between the number of predicted neoantigens and the extent of T cell infiltration in the initial resection sample. d, Schema of single-cell TCR analysis of neoantigen-reactive T cells isolated from post-vaccination PBMCs of patient 8 and comparison to bulk TCR sequencing of cDNA from pre- and post-vaccination PBMCs and from initial and relapse fresh-frozen tumour biopsies. e, TCR clonotypes observed in neoantigen-reactive T cell lines generated from PBMCs of patient 8, based on single-cell-targeted TCRαβ sequencing (see Methods). This experiment was performed once, with the available resection tissue.
Extended Data Fig. 6 |. Analysis of tumour-associated T cells from patient 7.
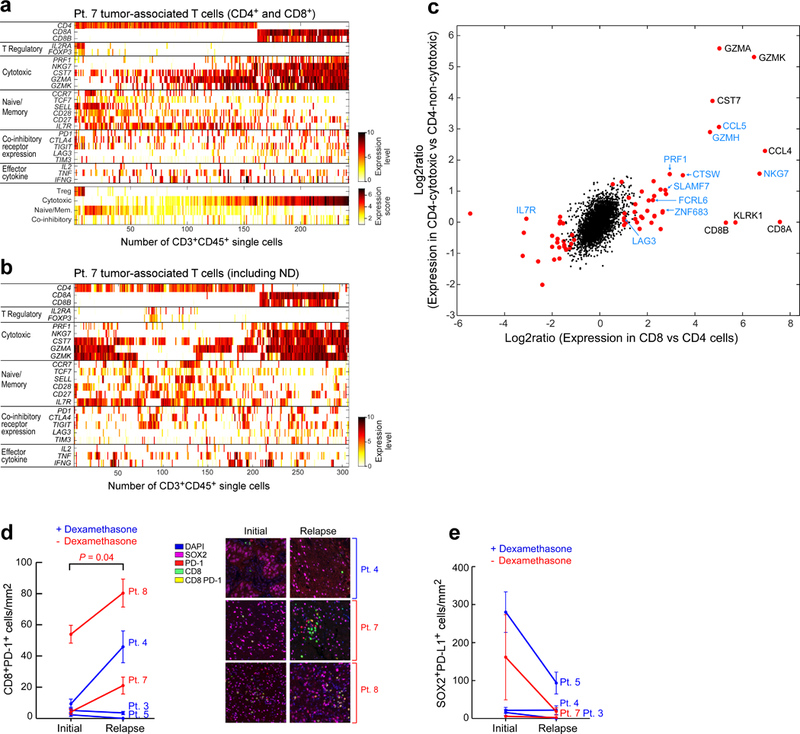
a, Expression levels (log2(TPM/10 + 1)) of selected marker genes for regulatory, cytotoxic and naive/memory T cell phenotypes; and expression of co-inhibitory receptors and effector cytokines based on scRNA-seq of tumour-associated CD4+ and CD8+ T cells from the relapse specimen of patient 7 (top). The average levels of these gene sets were used to define the expression scores of these signatures (bottom). b, Expression levels of selected marker genes for all tumour-associated CD3+ T cells from patient 7, including those unable to be resolved as CD4 or CD8 based on scRNA-seq. ND, not determined. c, Expression program associated with cytotoxicity in CD8+ (x axis) and CD4+ (y axis) T cells. For CD8, we compared all CD8+ T cells to non-Treg CD4+ T cells. For CD4, we divided the non-Treg CD4+ T cells by their average expression of a predefined cytotoxic signature (PRF1, NKG7, GZMK, GZMA and CST7) into three groups (low, medium and high) and compared the high to the low groups. The expression log2 ratios of all expressed genes for these two comparisons (CD8 and CD4) are shown. To identify significant differences, we performed a one-sided permutation test, which shuffled the assignments of cells to groups 100,000 times and defined P values based on the number of times the shuffled log2 ratios are higher (or lower for negative effects) than the observed log2 ratios. P values were adjusted by Bonferroni correction and significant genes were defined as those with an adjusted P value below 0.05 and a fold change above 2 (Supplementary Table 10). Significant genes are shown as red dots; significant genes that have also been identified previously9 are shown in blue font. d, Multiplex immunofluorescence demonstrates increase in CD8+PD-1+ cell infiltration at relapse in patients who did not receive dexamethasone during vaccine priming (red). Infiltrates were determined by enumerating the mean number of CD8+PD-1+ cells in 20× fields. The number of fields evaluated per sample was: 4 fields for relapse samples from patients 7 and 8; 5 fields for initial and relapse samples from patient 3, relapse samples from patient 5 and initial samples from patient 8; and 6 fields for initial and relapse samples from patient 4, and initial samples from patients 5 and 7. Data are mean ± s.e.m. P values are two-sided and based on model F-tests. e, Enumeration of the SOX2+PD-L1+ cells in matched initial and relapse tumour sections, evaluated by multiplex immunofluorescence. Infiltrates were determined by enumerating the mean number SOX2+PD-L1+ cells in 20× fields as in d. Data are mean ± s.e.m.
Extended Data Fig. 7 |. Single-cell TCR sequencing analysis of tumour-associated T cells from patient 7.
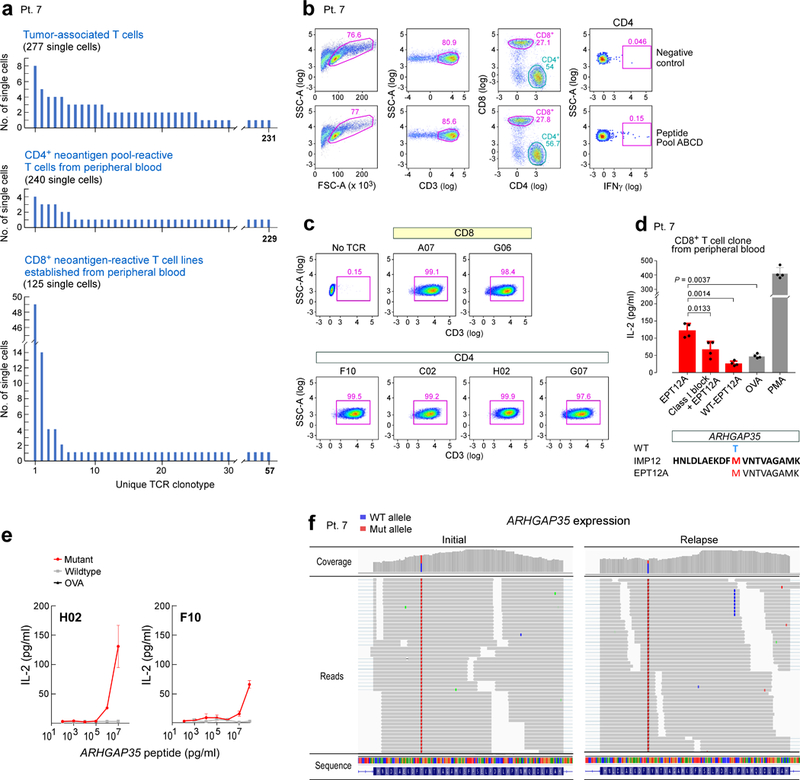
a, Single-cell TCR sequencing analyses of tumour-associated T cells, CD4+ neoantigen pool-reactive T cells from peripheral blood ex vivo and CD8+ neoantigen-reactive T cell lines (stimulated with ARHGAP35MUT and SLX4MUT) show enrichment of particular clonotypes. b, Sorting strategy for isolating neoantigen pool-reactive CD4+ T cells from peripheral blood ex vivo. c, Six TCRs identified in both tumour-associated and neoantigen-reactive T cells from peripheral blood were successfully cloned and expressed in the reporter cell line, as verified by stabilized CD3 surface expression; this experiment was repeated twice in independent experiments. The CDR3 sequences of these TCRs can be found in Supplementary Table 9. d, The largest CD8+ clone detected among the neoantigen-reactive T cell lines established from peripheral blood of patient 7 was experimentally confirmed to be specific for EPT12A, the MHC class I predicted epitope of ARHGAP35MUT. Two-sample two-sided t-tests with Welch correction were used for the comparisons; n = 4 biologically independent replicates; data are mean ± s.d. e, CD4+ ARHGAP35-specific H02 and F10 TCRs (as described in Fig. 4) discriminate between the mutant and wild-type form of the peptide. n = 2 biologically independent samples, each with two technical replicates; data are mean ± s.e.m. f, The ARHGAP35 mutation in the tumour of patient 7 is present in both the initial and relapse tumour specimens, as visualized by the IGV30.
Extended Data Fig. 8 |. Comparison of single-cell expression profiles of circulating neoantigen-stimulated CD4+ T cells and tumour-associated CD4+ T cells isolated from patient 7.
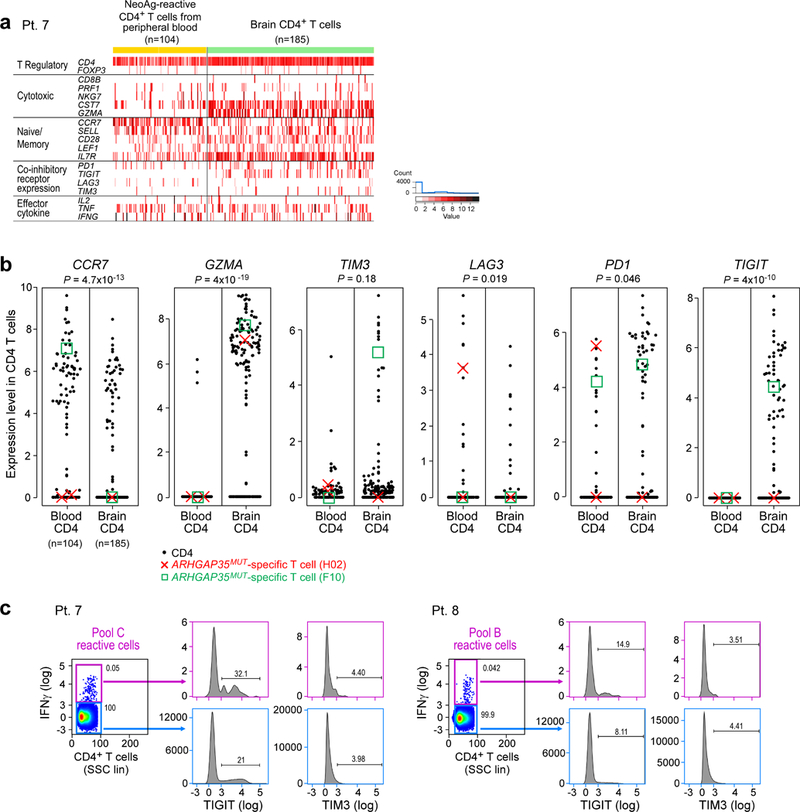
a, Single-cell transcriptome analysis of CD4+ tumour-associated T cells (n = 185), freshly isolated at the time of relapse and neoantigen-reactive CD4+ cells isolated from post-vaccination (week 16) peripheral blood (n = 104) of patient 7 (excluding CD4 dropouts). Tumour-associated T cells expressed more granzyme A than circulating neoantigen-reactive CD4+ cells and showed higher expression of the co-inhibitory molecule TIGIT. b, Significantly altered expression of CCR7, GZMA, LAG3, PD1 and TIGIT was detected between CD4+ cells from the blood versus brain by two-sided Wilcoxon rank-sum tests. The expression levels of ARHGAP35MUT-specific single T cells (clones H02 (red cross) and F10 (green box)), as described in Fig. 4, are marked. c, Vaccination peptide pool-reactive T cells from patients 7 and 8 PBMCs were stained for TIGIT and TIM3, confirming the minimal expression of these markers on neoantigen-reactive IFNγ-producing T cells in the periphery, compared to IFNγ− controls, as suggested by the single-cell transcriptome data in a. Data are representative of results from two independent experiments.
Extended Data Fig. 9 |. Detection of ARHGAP35MUT-specific T cells in patient 7, week 16.
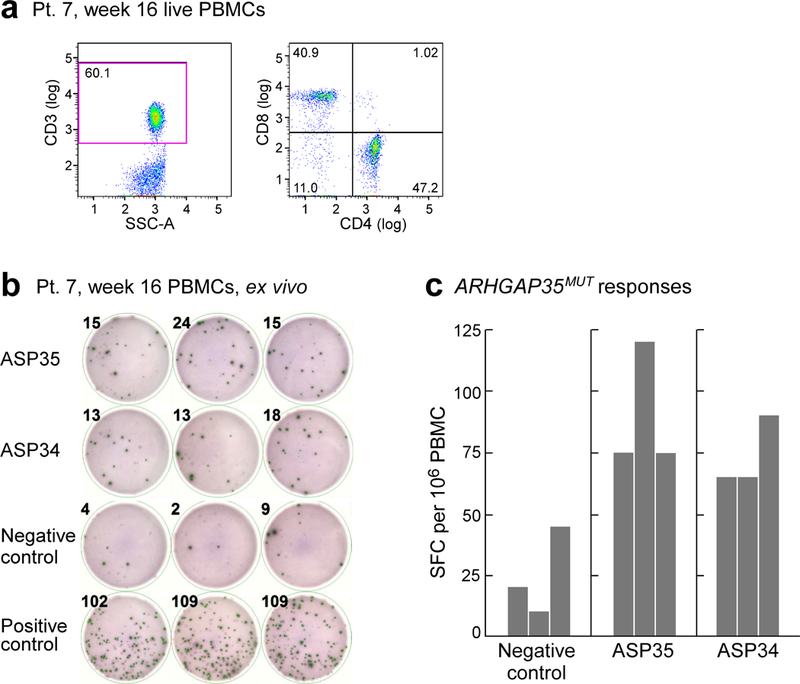
a, Thawed PBMCs from week 16 collected from patient 7 revealed 60% of the live PBMCs to be CD3+ T cells. Data are representative of results from two independent experiments. b, Thawed PBMCs from patient 7 at week 16 were tested ex vivo by ELISPOT, in which 2 × 10⁵ PBMCs were added per well and exposed overnight to 10 μg ml−1 of peptides covering ARHGAP35MUT (ASP34 or ASP35 peptides) compared to negative control (OVA peptide). Experiment was performed once in triplicate wells. c, Results of ex vivo ELISPOT (n = 3 biologically independent samples). Together, these results indicate that the frequencies of ASP35- and ASP34-reactive T cells were 39 and 29 (after subtracting background) per 360,000 T cells, respectively. Detection of ASP35-reactive T cells (F10) and ASP34-reactive T cells (H02) in brain at relapse was 1 each among 277 single intracranial T cells (Fig. 4c). The rate of T cells that recognize immunizing neoantigens is highly enriched in the brain compared to the periphery, P = 0.030 for ASP35 and P = 0.023 for ASP34, two-sided Poisson test.
Supplementary Material
Acknowledgements
We thank the Ben and Catherine Ivy Foundation and the Blavatnik Family Foundation for supporting this research. We acknowledge support from the Broad Institute SPARC program and National Institutes of Health (NCI-1RO1CA155010–02 (to C.J.W.)), NHLBI-5R01HL103532–03 (to C.J.W.), Francis and Adele Kittredge Family Immuno-Oncology and Melanoma Research Fund (to P.A.O.), Faircloth Family Research Fund (to P.A.O.), NIH/NCI R21 CA216772–01A1 (to D.B.K.), NCI-SPORE-2P50CA101942–11A1 (to D.B.K.); NHLBI-T32HL007627 (to J.B.I.); NCI (R50CA211482) (to S.A.S.), Zuckerman STEM Leadership Program (to I.T.); Benoziyo Endowment Fund for the Advancement of Science (to I.T.); P50 CA165962 (SPORE) and P01 CA163205 (to K.L.L.); DFCI Center for Cancer Immunotherapy Research fellowship (to Z.H.); Howard Hughes Medical Institute Medical Research Fellows Program (to A.J.A.); and American Cancer Society PF-17–042-01–LIB (to N.D.M.). C.J.W. is a scholar of the Leukemia and Lymphoma Society. We thank the Center for Neuro-Oncology, J. Russell and Dana-Farber Cancer Institute (DFCI) Center for Immuno-Oncology (CIO) staff; B. Meyers, C. Harvey and S. Bartel (Clinical Pharmacy); M. Severgnini, K. Kleinsteuber and E. McWilliams, (CIO laboratory); M. Copersino (Regulatory Affairs); T. Bowman (DFHCC Specialized Histopathology Core Laboratory); A. Lako (CIO); M. Seaman and D. H. Barouch (BIDMC); the Broad Institute’s Biological Samples, Genetic Analysis and Genome Sequencing Platforms; J. Petricciani and M. Krane for regulatory advice; B. McDonough (CSBio), I. Javeri and K. Nellaiappan (CuriRx) for peptide development.
Footnotes
Reviewer information Nature thanks M. Lim and the other anonymous reviewer(s) for their contribution to the peer review of this work.
Online content
Any methods, additional references, Nature Research reporting summaries, source data, statements of data availability and associated accession codes are available at https://doi.org/10.1038/s41586-018-0792-9.
Code availability
Code used for data analysis including Broad Picard Pipeline version 1.752 (WES/RNA-seq), MuTect version 13112 (sSNVs identification), Indelocator version 1.0 (indel identification), Strelka version 1.0.11 (indel identification), PRADA software version 1.1 (RNA-seq), NetMHCpan version 2.4 (neoantigen prediction), ContEst version 1.4–437 (for contamination estimation), ABSOLUTE version 1.1 (purity/ploidy estimation), Oncotator version 1.4.1 (mutation annotation), TraCeR version 0.4.0 (TCR sequencing), RSEM version 1.1.17 (gene expression quantification), Bowtie version 1.2.0 (RNA-seq alignment), BWA-mem version 0.7.7-r441 and IGV version 2.4 (genomic variant visualization) are publicly available from the indicated references.
Data availability
WES, scRNA-seq, bulk RNA-seq and TCR sequencing data generated and analysed during the current study are available through dbGaP (https://www.ncbi.nlm.nih.gov/gap) with accession number phs001519.v1.p1. All other data are available from the corresponding author upon reasonable request.
Competing interests: D.A.R. is an advisor to Abbvie, Agenus, Bristol-Myers Squibb, Celldex, EMD Serono, Genentech/Roche, Inovio, Merck, Merck KGaA, Monteris, Novocure, Oncorus, Oxigene, Regeneron, Stemline and Taiho Oncology; he has received research funding support from Acerta Phamaceuticals, Agenus, Celldex, EMD Serono, Incyte, Midatech, Omniox and Tragara. D.B.K. has previously advised Neon Therapeutics and owns equity in Aduro Biotech, Agenus, Ampliphi BioSciences, Biomarin Pharmaceutical, Bristol-Myers Squibb, Celldex Therapeutics, Editas Medicine, Exelixis, Gilead Sciences, IMV, Lexicon Pharmaceuticals, Sangamo Therapeutics and Stemline Therapeutics. J. Sun is a current employee of Moderna Therapeutics. C.J.W. is a founder of Neon Therapeutics and member of its scientific advisory board. P.A.O. has received research funding from and has advised Neon Therapeutics, Bristol-Meyers Squibb, Merck, CytomX, Pfizer, Novartis, Celldex, Amgen, AstraZeneca/MedImmune, Armo BioSciences and Roche/Genentech. K.J.L. is a paid consultant for Integrated DNA Technologies. E.F.F. is a founder and employee of Neon Therapeutics. N.H. is a founder of Neon Therapeutics and member of its scientific advisory board and an advisor for IFM therapeutics. K.W.W. is a paid consultant for Novartis, serves on the scientific advisory board for TCR2, Nextech and T-Scan, and receives sponsored research funding from Novartis, BMS and Astellas that is not related to the topic of this manuscript. S.J.R. receives research funding from Bristol-Myers Squibb, Merck, KITE Pharmaceuticals and Affimed Pharmaceuticals, and is on a scientific medical board for Perkin-Elmer. J.R. has consulted for Celgene, Draper Labs and Clarus Ventures. A.R. is a founder of Celsius Therapeutics and a member of the scientific advisory board for ThermoFisher Scientific, Driver Group and Syros Pharmaceuticals. E.S.L. is a founder of Neon Therapeutics and a member of its board of directors. G.G. is receiving research funds from IBM and Pharmacyclics, and is an inventor on patent applications related to MuTect and ABSOLUTE. N.J.L. has advised Neon Therapeutics, is a current advisor of New England Biolabs and is a member of the scientific advisory board for Genturi. E.A.C. is currently an advisor to Advantagene and DNAtrix, and has equity interest in DNATrix; he has previously advised Oncorus, Merck, Tocagen, Ziopharm, StemCell and NanoTx. P.Y.W. has no directly relevant conflicts; he currently sits on advisory boards for Abbvie, AstraZeneca, Eli Lilly, Genentech/Roche, Immunomic Therapeutics, Puma, Vascular Biogenics, Taiho and Deciphera, received speaker fees for Merck and received research support from Agios, AstraZeneca, Beigene, Eli Lilly, Genentech/Roche, Kadmon, Karyopharm, Kazia, Merck, Novartis, Oncoceutics, Sanofi-Aventis and VBI Vaccines. A.M.S. is CEO and CSO of Oncovir. M.S.K. is a current employee of Celsius Therapeutics. S.A.S has previously advised Neon Therapeutics and has equity in 152 Therapeutics. C.J.W. is subject to a conflict of interest management plan for the reported studies because of her competing financial interests in Neon Therapeutics. Under this plan, C.J.W. may not access identifiable data for human subjects or otherwise participate directly in the Institutional Review Board-approved protocol reported herein. C.J.W.’s contributions to the overall strategy and data analyses occurred on a de-identified basis. Patent applications have been filed on aspects of the described work entitled as follows: ‘Compositions and methods for personalized neoplasia vaccines’ (N.H., E.F.F. and C.J.W.), ‘Methods for identifying tumour specific neo-antigens’ (N.H. and C.J.W.), ‘Formulations for neoplasia vaccines’ (E.F.F.) and ‘Combination therapy for neoantigen vaccine’ (N.H., C.J.W. and E.F.F.). The Dana-Farber Cancer Institute, the lead site of this trial, has a proprietary and financial interest in the personalized neoantigen vaccine. As a result of its licensing activities, Dana-Farber Cancer Institute also holds equity in Neon Therapeutics. The remaining authors declare no competing interests.
Additional information
Extended data is available for this paper at https://doi.org/10.1038/s41586–018-0792–9 .
Supplementary information is available for this paper at https://doi.org/10.1038/s41586–018-0792–9 .
Reprints and permissions information is available at www.nature.com/reprints.
Publisher’s note: Springer Nature remains neutral with regard to jurisdictional claims in published maps and institutional affiliations.
References
- 1.Schumacher TN. & Schreiber RD. Neoantigens in cancer immunotherapy. Science 348, 69–74 (2015). [DOI] [PubMed] [Google Scholar]
- 2.Coulie PG., Van den Eynde BJ., van der Bruggen P. & Boon T. Tumour antigens recognized by T lymphocytes: at the core of cancer immunotherapy. Nat. Rev. Cancer 14, 135–146 (2014). [DOI] [PubMed] [Google Scholar]
- 3.Hu Z., Ott PA. & Wu CJ. Towards personalized, tumour-specific, therapeutic vaccines for cancer. Nat. Rev. Immunol. 18, 168–182 (2018). [DOI] [PMC free article] [PubMed] [Google Scholar]
- 4.Ott PA. et al. An immunogenic personal neoantigen vaccine for patients with melanoma. Nature 547, 217–221 (2017). [DOI] [PMC free article] [PubMed] [Google Scholar]
- 5.Carreno BM. et al. A dendritic cell vaccine increases the breadth and diversity of melanoma neoantigen-specific T cells. Science 348, 803–808 (2015). [DOI] [PMC free article] [PubMed] [Google Scholar]
- 6.Sahin U. et al. Personalized RNA mutanome vaccines mobilize poly-specific therapeutic immunity against cancer. Nature 547, 222–226 (2017). [DOI] [PubMed] [Google Scholar]
- 7.Lawrence MS. et al. Mutational heterogeneity in cancer and the search for new cancer-associated genes. Nature 499, 214–218 (2013). [DOI] [PMC free article] [PubMed] [Google Scholar]
- 8.Rutledge WC. et al. Tumor-infiltrating lymphocytes in glioblastoma are associated with specific genomic alterations and related to transcriptional class. Clin. Cancer Res. 19, 4951–4960 (2013). [DOI] [PMC free article] [PubMed] [Google Scholar]
- 9.Patil VS. et al. Precursors of human CD4+ cytotoxic T lymphocytes identified by single-cell transcriptome analysis. Sci. Immunol. 3, eaan8664 (2018). [DOI] [PMC free article] [PubMed] [Google Scholar]
- 10.Hu Z. et al. A cloning and expression system to probe T cell receptor specificity and assess functional avidity to neoantigens. Blood 132, 1911–1921 (2018). [DOI] [PMC free article] [PubMed] [Google Scholar]
- 11.Wang Q. et al. Tumor evolution of glioma-intrinsic gene expression subtypes associates with immunological changes in the microenvironment. Cancer Cell 32, 42–56 (2017). [DOI] [PMC free article] [PubMed] [Google Scholar]
- 12.Abelin JG. et al. Mass spectrometry profiling of HLA-associated peptidomes in mono-allelic cells enables more accurate epitope prediction. Immunity 46, 315–326 (2017). [DOI] [PMC free article] [PubMed] [Google Scholar]
- 13.Reardon DA. et al. Randomized phase 3 study evaluating the efficacy and safety of nivolumab vs bevacizumab in patients with recurrent glioblastoma: CheckMate 143, Neuro Oncol. 19, iii21 (2017). [Google Scholar]
- 14.Parakh S. et al. Efficacy of anti-PD-1 therapy in patients with melanoma brain metastases. Br. J. Cancer 116, 1558–1563 (2017). [DOI] [PMC free article] [PubMed] [Google Scholar]
- 15.Gustafson MP. et al. Systemic immune suppression in glioblastoma: the interplay between CD14+HLA-DRlo/neg monocytes, tumor factors, and dexamethasone. Neuro-Oncol. 12, 631–644 (2010). [DOI] [PMC free article] [PubMed] [Google Scholar]
- 16.Mangani D., Weller M. & Roth P. The network of immunosuppressive pathways in glioblastoma. Biochem. Pharmacol. 130, 1–9 (2017). [DOI] [PubMed] [Google Scholar]
- 17.Nduom EK., Weller M. & Heimberger AB. Immunosuppressive mechanisms in glioblastoma. Neuro-Oncol. 17, vii9–vii14 (2015). [DOI] [PMC free article] [PubMed] [Google Scholar]
- 18.Woroniecka K. et al. T cell exhaustion signatures vary with tumor type and are severe in glioblastoma. Clin. Cancer Res. 24, 4175–1486 (2018). [DOI] [PMC free article] [PubMed] [Google Scholar]
- 19.Wen PY. et al. Updated response assessment criteria for high-grade gliomas: response assessment in neuro-oncology working group. J. Clin. Oncol. 28, 1963–1972 (2010). [DOI] [PubMed] [Google Scholar]
- 20.Hegi ME. et al. MGMT gene silencing and benefit from temozolomide in glioblastoma. N. Engl. J. Med. 352, 997–1003 (2005). [DOI] [PubMed] [Google Scholar]
- 21.Okada H. et al. Immunotherapy response assessment in neuro-oncology: a report of the RANO working group. Lancet Oncol. 16, e534–e542 (2015). [DOI] [PMC free article] [PubMed] [Google Scholar]
- 22.Hoof I. et al. NetMHCpan, a method for MHC class I binding prediction beyond humans. Immunogenetics 61, 1–13 (2009). [DOI] [PMC free article] [PubMed] [Google Scholar]
- 23.Fisher S. et al. A scalable, fully automated process for construction of sequence-ready human exome targeted capture libraries. Genome Biol. 12, R1 (2011). [DOI] [PMC free article] [PubMed] [Google Scholar]
- 24.Gnirke A. et al. Solution hybrid selection with ultra-long oligonucleotides for massively parallel targeted sequencing. Nat. Biotechnol. 27, 182–189 (2009). [DOI] [PMC free article] [PubMed] [Google Scholar]
- 25.Chapman MA. et al. Initial genome sequencing and analysis of multiple myeloma. Nature 471, 467–472 (2011). [DOI] [PMC free article] [PubMed] [Google Scholar]
- 26.Berger MF. et al. The genomic complexity of primary human prostate cancer. Nature 470, 214–220 (2011). [DOI] [PMC free article] [PubMed] [Google Scholar]
- 27.Cibulskis K. et al. ContEst: estimating cross-contamination of human samples in next-generation sequencing data. Bioinformatics 27, 2601–2602 (2011). [DOI] [PMC free article] [PubMed] [Google Scholar]
- 28.DePristo MA. et al. A framework for variation discovery and genotyping using next-generation DNA sequencing data. Nat. Genet. 43, 491–498 (2011). [DOI] [PMC free article] [PubMed] [Google Scholar]
- 29.Saunders CT. et al. Strelka: accurate somatic small-variant calling from sequenced tumor-normal sample pairs. Bioinformatics 28, 1811–1817 (2012). [DOI] [PubMed] [Google Scholar]
- 30.Robinson JT. et al. Integrative genomics viewer. Nat. Biotechnol. 29, 24–26 (2011). [DOI] [PMC free article] [PubMed] [Google Scholar]
- 31.Ramos AH. et al. Oncotator: cancer variant annotation tool. Hum. Mutat. 36, E2423–E2429 (2015). [DOI] [PMC free article] [PubMed] [Google Scholar]
- 32.Torres-García W. et al. PRADA: pipeline for RNA sequencing data analysis. Bioinformatics 30, 2224–2226 (2014). [DOI] [PMC free article] [PubMed] [Google Scholar]
- 33.Falk K., Rötzschke O., Stevanović S., Jung G. & Rammensee HG. Allele-specific motifs revealed by sequencing of self-peptides eluted from MHC molecules. Nature 351, 290–296 (1991). [DOI] [PubMed] [Google Scholar]
- 34.Lundegaard C., Lund O. & Nielsen M. Prediction of epitopes using neural network based methods. J. Immunol. Methods 374, 26–34 (2011). [DOI] [PMC free article] [PubMed] [Google Scholar]
- 35.Miyama T. et al. Highly functional T-cell receptor repertoires are abundant in stem memory T cells and highly shared among individuals. Sci. Rep. 7, 3663 (2017). [DOI] [PMC free article] [PubMed] [Google Scholar]
- 36.Wahl LM., Wahl SM., Smythies LE. & Smith PD. Isolation of human monocyte populations. Curr. Protoc. Immunol. 70, 7.6A.1–7.6A.10 (2006). [DOI] [PubMed] [Google Scholar]
- 37.Keskin DB. et al. Physical detection of influenza A epitopes identifies a stealth subset on human lung epithelium evading natural CD8 immunity. Proc. Natl Acad. Sci. USA 112, 2151–2156 (2015). [DOI] [PMC free article] [PubMed] [Google Scholar]
- 38.Cai A. et al. Mutated BCR-ABL generates immunogenic T-cell epitopes in CML patients. Clin. Cancer Res. 18, 5761–5772 (2012). [DOI] [PMC free article] [PubMed] [Google Scholar]
- 39.Carey CD. et al. Topological analysis reveals a PD-L1-associated microenvironmental niche for Reed–Sternberg cells in Hodgkin lymphoma. Blood 130, 2420–2430 (2017). [DOI] [PMC free article] [PubMed] [Google Scholar]
- 40.Trombetta JJ. et al. Preparation of single-cell RNA-seq libraries for next generation sequencing. Curr. Protoc. Mol. Biol. 107, 4.22.1–4.22.17 (2014). [DOI] [PMC free article] [PubMed] [Google Scholar]
- 41.Tirosh I. et al. Single-cell RNA-seq supports a developmental hierarchy in human oligodendroglioma. Nature 539, 309–313 (2016). [DOI] [PMC free article] [PubMed] [Google Scholar]
- 42.Langmead B., Trapnell C., Pop M. & Salzberg SL. Ultrafast and memory-efficient alignment of short DNA sequences to the human genome. Genome Biol. 10, R25 (2009). [DOI] [PMC free article] [PubMed] [Google Scholar]
- 43.Li B. & Dewey CN. RSEM: accurate transcript quantification from RNA-seq data with or without a reference genome. BMC Bioinformatics 12, 323 (2011). [DOI] [PMC free article] [PubMed] [Google Scholar]
- 44.Stubbington MJT. et al. T cell fate and clonality inference from single-cell transcriptomes. Nat. Methods 13, 329–332 (2016). [DOI] [PMC free article] [PubMed] [Google Scholar]
- 45.Dobosy JR. et al. RNase H-dependent PCR (rhPCR): improved specificity and single nucleotide polymorphism detection using blocked cleavable primers. BMC Biotechnol. 11, 80 (2011). [DOI] [PMC free article] [PubMed] [Google Scholar]
- 46.Kircher M., Sawyer S. & Meyer M. Double indexing overcomes inaccuracies in multiplex sequencing on the Illumina platform. Nucleic Acids Res. 40, e3 (2012). [DOI] [PMC free article] [PubMed] [Google Scholar]
- 47.Altschul SF., Gish W., Miller W., Myers EW. & Lipman DJ. Basic local alignment search tool. J. Mol. Biol. 215, 403–410 (1990). [DOI] [PubMed] [Google Scholar]
- 48.Bolotin DA. et al. MiXCR: software for comprehensive adaptive immunity profiling. Nat. Methods 12, 380–381 (2015) [DOI] [PubMed] [Google Scholar]
- 49.Lonsdale J. et al. The Genotype-Tissue Expression (GTEx) project. Nat. Genet. 45, 580–585 (2013). [DOI] [PMC free article] [PubMed] [Google Scholar]
- 50.Broad Institute TCGA Genome Data Analysis Center. Firehose version stddata__2016_01_28 run. 10.7908/C11G0KM9.(Broad Institute of MIT and Harvard, 2016) [DOI]
- 51.Lawrence MS. et al. Discovery and saturation analysis of cancer genes across 21 tumour types. Nature 505, 495–501 (2014). [DOI] [PMC free article] [PubMed] [Google Scholar]
Associated Data
This section collects any data citations, data availability statements, or supplementary materials included in this article.


