

ABSTRACT
Background: Evidence linking breastfeeding to reduced risk of developing childhood obesity is inconclusive, yet previous studies have not considered variation in specific components of breast milk that may affect early development.
Objective: We examined whether differences in the composition of human milk oligosaccharides (HMOs) correlate with infant growth and body composition at 1 and 6 mo of age.
Design: Twenty-five mother-infant dyads were recruited from the University Hospital at the University of Oklahoma Health Sciences Center. Infants were breastfed for 6 mo. Breast-milk and infant measures were obtained at 1 and 6 mo of infant age. HMO composition was analyzed by high-pressure liquid chromatography, and infant growth (length and weight) and body composition (percentage fat, total fat, lean mass) were measured by dual-energy X-ray absorptiometry. Relations between HMOs and infant growth and body composition were examined by using multiple linear regression. A priori covariates included maternal prepregnancy body mass index, pregnancy weight gain, and infant age and sex.
Results: Higher HMO diversity and evenness at 1 mo were associated with lower total and percentage fat mass at 1 mo. At 1 mo, each 1-μg/mL increase in lacto-N-fucopentaose (LNFP) I was associated with a 0.40-kg lower infant weight (P = 0.03). At 6 mo, each 1-μg/mL increase in LNFPI was associated with a 1.11-kg lower weight (P = 0.03) and a 0.85-g lower lean mass (P = 0.01). At 6 mo, each 1-μg/mL increase in LNFPI was associated with a 0.79-g lower fat mass (P = 0.02), whereas disialyl-lacto-N-tetraose and LNFPII were associated with a 1.92-g (P = 0.02) and 0.42-g (P = 0.02) greater fat mass, respectively. At 6 mo, each 1-μg/mL increase in fucosyl-disialyl-lacto-N-hexaose and lacto-N-neotetraose was associated with 0.04% higher (P = 0.03) and 0.03% lower (P < 0.01) body fat, respectively.
Conclusion: These findings support the hypothesis that differences in HMO composition in mother’s milk are associated with infant growth and body composition. This trial was registered at clinicaltrials.gov as NCT02535637.
Keywords: HMOs, LNFPI, human milk oligosaccharides, infant body composition, microbiome
INTRODUCTION
Childhood overweight and obesity rates have increased dramatically over the past 3 decades and remain high, with a prevalence of nearly 23% in children 2–5 y of age (1). Once established, obesity and its health consequences are difficult to treat and often persist into adulthood (2–4). Therefore, it is critical to identify factors in early childhood that increase or mitigate the risk of excessive weight gain and obesity to help develop early interventions.
Multiple studies have shown that breastfeeding decreases the risk of developing obesity in childhood and adolescence (5–10). However, not all studies support this view (11–14), and a comprehensive systematic review of 71 articles found only a modest protective effect of breastfeeding on obesity prevention in which breastfeeding reduced the prevalence of overweight and obesity by ~10% (15). These conflicting findings may be partially due to the diverse composition of human breast milk, which contains macronutrients, micronutrients, and a host of other bioactive compounds (cytokines, adipokines, chemokines, cofactors) that are only now being discovered and studied and that vary both among women and over time. Human milk contains high concentrations of unconjugated glycans, complex sugars called human milk oligosaccharides (HMOs),7 that are currently not present in infant formula (16, 17). HMOs carry lactose at their reducing end that can be elongated by disaccharides of galactose and N-acetylglucosamine and modified by fucose and/or sialic acid (17). More than 150 structurally distinct HMOs have been identified so far, and many of their biological effects are highly structure specific (16).
Once ingested, HMOs resist degradation in the small intestine and persist in the colon, where different HMOs serve as specific metabolic substrates for certain bacteria and help shape the infant gut microbiome. For example, HMOs and their fucosylated components support increased bifidobacteria, which dominate the microbiota of breastfed infants (18–21). The gut microbiome has been associated with overweight and obesity (18–20, 22), leading us to speculate that specific HMOs might affect the development of overweight and obesity indirectly by altering the structure or function of the gut microbiome (23). HMOs might also have a more direct effect on infant growth and body composition, because they affect epithelial cell responses in the gut (16, 24–26) and are absorbed and reach the circulation where they might exert systemic effects (5, 27, 28).
Because HMO composition varies between women and over the course of lactation (29–32), we hypothesized that differences in HMO composition in mother’s milk are associated with infant growth and body composition. To test this hypothesis, we examined a cohort of 25 mother-infant pairs at 1- and 6-mo postpartum and analyzed relations between HMO composition and infant growth and body composition.
METHODS
Study overview
Thirty-seven mother-infant dyads were initially enrolled at 1 mo (±5 d) of age with the intent of careful follow-up to 6 mo of age in a breast-milk growth study. The overall study design and preliminary results on infant growth and body composition in a subset of 19 subjects were described previously in which we examined relations between breast-milk hormones and inflammatory markers with infant growth and body composition (33). Participants were instructed to arrive at the University of Oklahoma Health Sciences in Oklahoma City between 0800–1000 h with the mother fasted. On arrival, a complete breast-milk expression from a single breast was obtained, which was followed by a whole-body dual-energy X-ray absorptiometry scan in the infant. These measures were repeated when the infant was 6 mo of age. All of the subjects signed both a consent and Health Insurance Portability and Accountability Act form before any data collection. The University of Oklahoma Institutional Review Board approved all testing procedures.
Study participants
The 37 mother-infant dyads enrolled into the study were breastfed (defined as no formula supplementation) and 31 mother-infant dyads returned for their 6-mo visit. The following inclusion and exclusion criteria were used to determine eligibility into the study. Inclusion criteria included the following: 1) maternal age of 18–45 y at the time of delivery, 2) gestation ≥37 wk, 3) singleton birth, and 4) a postpartum hospital stay for mother and infant of <3 d. Exclusion criteria were as follows: 1) mother using any tobacco, 2) alcohol consumption defined as >1 drink/wk, 3) type 1 or 2 diabetes before or during pregnancy, and 4) presumed or known congenital birth defects. All maternal demographic information (age, parity, prepregnancy weight, and gestational weight gain) was collected by medical chart abstraction when possible.
Anthropometric and body-composition variables
Crown-to-heel length was obtained by using a Seca 416 infantometer (Seca) in duplicate with both measures having to be within 0.1 cm; in the event they fell outside of these predefined parameters, a third measure was obtained with the 2 closest values averaged. Nude body weight was obtained by using a Seca 728 scale in duplicate with both measures having to be within 10 g; in the event they fell outside of these predefined parameters, a third measure was obtained with the 2 closest values averaged. The relative percentage of fat and absolute total body composition (total fat and lean mass) and trunk fat mass were collected by using a Lunar iDXA scanner (GE Healthcare) described previously (33, 34) while the infant wore only a diaper and was swaddled with the use of a light receiving blanket provided by the study team to ensure minimal movement. The principal investigator (DAF) positioned all of the infants and performed subsequent scan analyses.
Breast-milk collection and HMO analysis
Mothers were encouraged to pump the entire contents of a single breast expression for the analyses of breast milk described by our group previously (33). HMO analysis was performed at the University of California, San Diego, as previously described, by using HPLC after fluorescent derivatization (35). Raffinose was added to each milk sample as an internal standard for absolute quantification. The total concentration of HMOs was calculated as the sum of the specific oligosaccharides detected. The following 16 HMOs were detected on the basis of retention time comparison with commercial standard oligosaccharides and mass spectrometry analysis: 2′-fucosyllactose (2′-FL), 3-fucosyllactose, 3′-sialyllactose, lacto-N-tetraose (LNT), lacto-N-neotetraose (LNnT), lacto-N-fucopentaose (LNFP) I, LNFPII, LNFPIII, sialyl-LNT (LST) b, LSTc, difucosyl-LNT, disialyl-LNT (DSLNT), fucosyl-lacto-N-hexaose, difucosyl-lacto-N-hexaose, fucosyl-disialyl-lacto-N-hexaose (FDSLNH), and disialyl-lacto-N-hexaose. Secretor status was defined by the presence of 2′-FL or LNFP. Simpson’s Diversity index D was calculated as the reciprocal sum of the square of the relative abundance of each of the measured HMOs. Simpson’s Equitability (evenness, E) was calculated by dividing the actual D index for each sample by Dmax (maximum D index in the theoretical case that all measured HMOs have the same relative abundance). E can be between 0 and 1; the closer E is to 1, the more even the HMO composition. E reflects the distribution of various HMOs based on concentrations in micrograms per milliliter. A paired t test on the change or log change from ages 1 to 6 mo was used.
Statistical analysis
Of the 37 mother-infant pairs enrolled in this study, 25 were included in the final analysis. One participant did not have enough breast milk for analysis, 4 were excluded due to missing data for weight gain during pregnancy, 6 due to missing measures at 6 mo, and 1 due to missing profiling of breast milk at 1 mo. Changes or log changes in infant variables and HMOs were examined by using paired t test on the means. A priori covariates included mother’s prepregnancy BMI (kg/m2), pregnancy weight gain, sex, and age (in days) of the infant at 1 mo.
Relations between HMOs and infant’s weight and body composition were examined by using multiple linear regression. There were 16 distinct HMOs of interest as well as HMO diversity and evenness. Outcomes included infant weight, length, lean mass, fat mass, and percentage fat. Therefore, we examined 90 models to identify possible relations between HMOs and infant growth and body composition at 1 and 6 mo. At this stage of analysis, only single HMOs were included in each model. When examining 6-mo dependent variables, the baseline dependent variable was included in the model and 6-mo age was used in place of 1-mo age. The inclusion of breast-milk insulin concentrations in each model at 1 and 6 mo did not significantly change our results and was therefore not included in the final model (data not shown). For outcomes at 1 and 6 mo, we adjusted for all a priori covariates and conducted a univariate analysis of HMOs. Those with a P ≤ 0.20 were further investigated within a compressive model containing all HMOs that were identified from the initial univariate analysis. Analyses were performed in SAS version 9.4 and an a priori significance level was set at P < 0.05. All assumptions of multiple linear regression were satisfied, and results are presented as means ± SDs unless noted otherwise. Given our small sample size, we report results unadjusted for multiple comparisons, because results were nonsignificant on the basis of the Holm procedure.
RESULTS
Table 1 displays the mean physical characteristics of the 25 mother-infant pairs. Overall, mothers were ~29.5 y of age, overweight (BMI: 27.9 ± 7.5) before conception, and gained an average of 10.8 kg during pregnancy. As expected, infants significantly increased their weight, length, and measures of fat and lean mass over the 6-mo study period (P < 0.001). As shown in Table 2, almost all of the measured HMOs significantly changed from 1 to 6 mo. Only 2′-FL, LSTb, fucosyl-lacto-N-hexaose, and Simpson’s Diversity and Simpson’s Equitability (evenness) were unchanged over the course of the study.
TABLE 1.
Physical characteristics of mother-infant pairs1
| Infant age | |||
| 1 mo | 6 mo | Change | |
| Mother | |||
| Age, y | 29.5 ± 4.80 | — | — |
| BMI,2 kg/m2 | 25.5 (10.7) | — | — |
| Pregnancy weight gain, kg | 10.8 ± 7.92 | — | — |
| Gestational age, wk | 39.6 ± 1.23 | — | — |
| Secretor, n yes/no (%) | 18/7 (72) | — | — |
| Infant | |||
| Sex, n F/M (%) | 8/17 (32) | — | — |
| Age,2,3 d | 39.0 (6.00) | 167.0 (4.00) | 128.0 (7.00)‡ |
| Birth weight, kg | 3.56 ± 0.48 | — | — |
| Birth length, cm | 52.0 ± 2.30 | — | — |
| Weight, g | 4720.84 ± 757.9 | 7193.6 ± 1191.3 | 2472.8 ± 729.9‡ |
| Length,2,3 cm | 55.7 (2.60) | 65.8 (2.60) | 9.30 (2.50)‡ |
| Fat mass, % | 23.7 ± 2.97 | 32.6 ± 3.67 | 8.84 ± 3.33‡ |
| Total fat mass, g | 1190.5 ± 318.3 | 2457.8 ± 615.8 | 1267.0 ± 455.3‡ |
| Lean mass, g | 3693.2 ± 526.3 | 4865.4 ± 719.5 | 1172.2 ± 518.6‡ |
| Total trunk fat mass,2,3 g | 371.0 (109.0) | 723.0 (468.0) | 360.0 (376.0)‡ |
Values are means ± SDs unless otherwise indicated for the 25 mother-infant pairs included in this study. Paired t test on the change or log change (where noted) from ages 1 to 6 mo was used. ‡P < 0.0001.
Values are medians with IQRs in parentheses for variables that were not normally distributed.
Log changes are shown.
TABLE 2.
HMOs1
| Infant age | |||
| HMO | 1 mo, μg/mL | 6 mo, μg/mL | Change, μg/mL |
| 2′-FL | 2750.0 (3738.7) | 2430.9 (2798.8) | −13.5 (932.5) |
| 3-FL2 | 162.7 (130.2) | 515.7 (439.1) | 291.0 (229.9)‡ |
| 3′-SL2 | 756.3 (432.1) | 1125.4 (284.3) | 408.4 (400.5)‡ |
| DFLNH2 | 235.4 (145.7) | 41.0 (49.7) | −160.7 (183.6)‡ |
| DFLNT2 | 1219.8 (1157.9) | 901.8 (688.6) | −260.2 (354.5)† |
| DSLNH2 | 191.9 (160.0) | 43.6 (54.8) | −127.5 (137.8)‡ |
| DSLNT2 | 247.0 (244.7) | 183.7 (133.7) | −51.5 (125.3)§ |
| FDSLNH2 | 84.8 (61.4) | 45.3 (39.4) | −40.3 (53.2)† |
| FLNH | 66.9 (77.0) | 68.0 (35.8) | 8.3 (88.8) |
| LNFPI | 971.4 (1,537.2) | 437.9 (181.5) | −436.0 (708.8)† |
| LNFPII2 | 1340.1 (1111.9) | 1616.1 (1459.0) | 342.8 (586.2)† |
| LNFPIII2 | 71.1 (46.6) | 161.4 (99.0) | 93.4 (120.2)‡ |
| LNnT | 39.2 (32.1) | 105.3 (65.9) | 55.6 (78.2)† |
| LNT2 | 1422.6 (1250.7) | 1226.5 (1043.1) | −436.2 (522.2)‡ |
| LSTb2 | 96.2 (97.6) | 148.9 (165.7) | 35.5 (74.6) |
| LSTc | 206.0 (136.3) | 76.8 (57.6) | −131.7 (123.0)‡ |
| Sum | 11,285.8 (2555.1) | 10,408.1 (1645.6) | −877.6 (1403.3)† |
| Diversity | 5.14 (1.18) | 5.20 (1.29) | 0.06 (0.80) |
| Evenness | 0.32 (0.07) | 0.33 (0.08) | 0.004 (0.05) |
Values are medians (IQRs) when variables were not normally distributed for the 25 mothers included in this study. Paired t test on the change or log change (where noted) from ages 1 to 6 mo. ‡P < 0.0001, §P ≤ 0.002, †P ≤ 0.005. DFLNH, difucosyl-lacto-N-hexaose; DFLNT, difucosyl-lacto-N-tetraose; DSLNH, disialyl-lacto-N-hexaose; DSLNT, disialyl-lacto-N-tetraose; FDSLNH, fucosyl-disialyl-lacto-N-hexaose; FLNH, fucosyl-lacto-N-hexaose; LNFP, lacto-N-fucopentaose; LNnT, lacto-N-neotetraose; LNT, lacto-N-tetraose; LST, sialyl-lacto-N-tetraose; 2′-FL, 2′-fucosyllactose; 3-FL, 3-fucosyllactose; 3′-SL, 3′-sialyllactose.
Log changes are shown.
HMOs, infant growth, and adiposity at age 1 mo
At 1 mo, each 1-μg/mL increase in LNFPI was associated with a 0.40-g lower infant weight (β = −0.40, P = 0.03). As shown in Figure 1 and Table 3, HMO diversity and evenness at 1 mo were inversely related to 1-mo fat mass (β = −119.7, P = 0.04, and β = −1915.4, P = 0.04, respectively) and 1-mo percentage fat (β = −1.23, P = 0.02, and β = −19.69, P = 0.02, respectively). No other HMOs at 1 mo were related to 1-mo growth or body composition.
FIGURE 1.
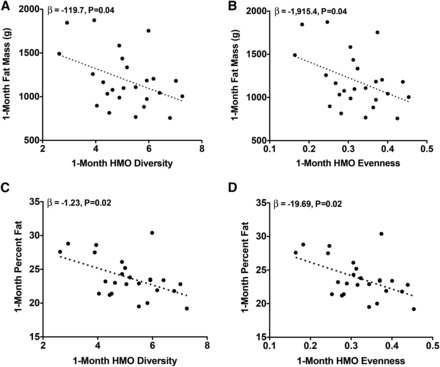
One-month adiposity is inversely related to 1-mo HMO diversity and evenness. Unadjusted values for infant fat mass (A and B) and percentage fat (C and D) compared with breast-milk evenness and diversity are shown. Multiple linear regression was performed to obtain the parameter estimates (β) after adjustment for mother’s prepregnancy BMI, pregnancy weight gain, sex, and 1-mo infant age (n = 25). HMO, human milk oligosaccharide.
TABLE 3.
Cumulative R2 for infant body composition at 1 mo1
| Model | β | Cumulative R2 | R 2 P value |
| Weight | |||
| Base model | 0.20 | ||
| +1-mo LNFPI2 | −0.40* | 0.38 | 0.03 |
| Fat mass | |||
| Base model | 0.17 | ||
| + Diversity | −119.7* | 0.34 | 0.04 |
| Base model | 0.17 | ||
| + Evenness | −1915.4* | 0.34 | 0.04 |
| Percentage fat | |||
| Base model | 0.25 | ||
| + Diversity | −1.23* | 0.45 | 0.02 |
| Base model | 0.25 | ||
| + Evenness | −19.69* | 0.45 | 0.02 |
Multiple linear regression was performed to examine the change in the R2 with the addition of each human milk oligosaccharide. The base model included sex, prepregnancy BMI, weight gain during pregnancy, and 1-mo infant age. Parameter estimates (β) are from the full model (n = 25). *P < 0.05.
LNFPI, lacto-N-fucopentaose I.
HMOs, infant growth, and adiposity at age 6 mo
At 6 mo, each 1-μg/mL increase in DSLNT was associated with a 0.01-cm increase in 6-mo length (β = 0.01, P = 0.04). As shown in Figure 2, each 1-μg/mL increase in 6-mo LNFPI was associated with a 1.11-g lower weight (β = −1.11, P = 0.03), a 0.85-g lower lean mass (β = −0.85, P = 0.01), and a 0.79-g lower fat mass (β =−0.79, P = 0.02). Conversely, as shown in Figure 3, each 1-μg/mL increase in 6-mo DSLNT and LNFPII was associated with a 1.92-g (β = 1.92, P = 0.02) and 0.42-g (β = 0.42, P = 0.02) greater fat mass, respectively. Interestingly, a 1-μg/mL increase in 1-mo LNFPII predicted a 0.33-g lower fat mass (β = −0.33, P = 0.03). As shown in Figure 4, each 1-μg/mL increase in 6-mo LNnT was associated with a 0.03% lower body fat (β = −0.03, P < 0.01) and a 1-μg/mL increase in 6-mo FDSLNH was associated with a 0.04% higher body fat (β = 0.04, P = 0.03). No other HMOs at 6 mo were related to 6-mo growth or body composition.
FIGURE 2 .
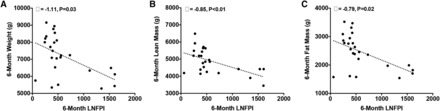
Six-month infant body composition is inversely related to 6-mo LNFPI. Unadjusted values for weight (A), lean mass (B), and fat mass (C) compared with breast milk LNFPI at 6 mo are shown. Multiple linear regression was performed to obtain the parameter estimates (β) after adjustment for mother’s prepregnancy BMI, pregnancy weight gain, and infant sex, 6-mo infant age, and the dependent variable at 1 mo (n = 25). LNFPI, lacto-N-fucopentaose I.
FIGURE 3 .
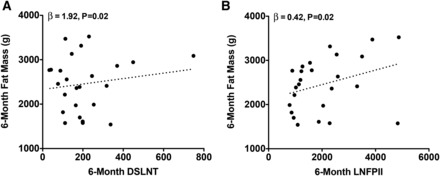
Six-month fat mass is positively related to DSLNT and LNFPII. Unadjusted values for body fat mass compared with breast-milk DSLNT and LNFPII at 6 mo are shown. Multiple linear regression was performed to obtain the parameter estimates (β) after adjustment for mother’s prepregnancy BMI, pregnancy weight gain, and infant sex, 6-mo infant age, and the dependent variable at 1 mo (n = 25). DSLNT, disialyl-lacto-N-tetraose; LNFPII, lacto-N-fucopentaose II.
FIGURE 4 .
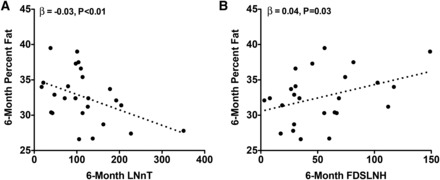
Six-month body fat percentage is inversely related to 6-mo LNnT and positively related to 6-mo FDSLNH. Unadjusted values for infant percentage fat compared with breast-milk LNnT (A) and FDSLNH (B) at 6 mo are shown. Multiple linear regression was performed to obtain the parameter estimates (β) after adjustment for mother’s prepregnancy BMI, pregnancy weight gain, and infant sex, 6-mo infant age, and the dependent variable at 1 mo (n = 25). FDSLNH, fucosyl-disialyl-lacto-N-hexaose; LNnT, lacto-N-neotetraose.
HMOs and variance in body composition at ages 1 and 6 mo
As shown in Table 3 and Table 4, even after adjustment for maternal BMI and gestational weight gain, specific HMOs accounted for a significant increase in the percentage of the observed variance in infant body composition in our sample. At 1 mo, including LNFPI in the model explained 18% more of the variance in 1-mo infant weight (R2 = 0.20 compared with 0.38; P = 0.03). In addition, including both 1-mo HMO diversity and evenness in the model explained 20% more of the variance in 1-mo percentage fat (R2 = 0.25 compared with 0.45; P = 0.02). At 6 mo, the inclusion of DSLNT in the model explained 7% more of the variance in 6-mo length (R2 = 0.68 compared with 0.75; P = 0.04). The inclusion of LNFPI at 6 mo explained 6% more of the variance in 6-mo weight (R2 = 0.76 compared with 0.82; P = 0.03) and 13% more of the variance in lean mass (R2 = 0.66 compared with 0.79; P = 0.01). When examined in the same model, LNFPI, DSLNT, and FDSLNH explained 33% (R2 = 0.54 compared with 0.87) more of the variance in infant fat mass. Last, the inclusion of LNnT in the model at 6 mo explained 23% of the variance in 6-mo percentage fat (R2 = 0.34 compared with 0.57; P < 0.01).
TABLE 4.
Cumulative R2 for infant body composition at 6 mo1
| Model | β | Cumulative R2 | R 2 P value |
| Length | |||
| Base model | 0.28 | ||
| +1-mo length | 0.94‡ | 0.68 | <0.0001 |
| +1-mo DSLNT | −0.0001 | 0.68 | 0.87 |
| +6-mo DSLNT | 0.01* | 0.75 | 0.04 |
| Weight | |||
| Base model | 0.11 | ||
| +1-mo weight | 1.33‡ | 0.76 | <0.0001 |
| +1-mo LNFPI | 0.44 | 0.76 | 0.73 |
| +6-mo LNFPI | −1.11* | 0.82 | 0.03 |
| Lean mass | |||
| Base model | 0.17 | ||
| +1-mo lean mass | 0.94† | 0.66 | <0.0001 |
| +1-mo LNFPI | 0.17 | 0.68 | 0.23 |
| +6-mo LNFPI | −0.85† | 0.79 | 0.01 |
| Fat mass | |||
| Base model | 0.07 | ||
| +1-mo fat mass | 1.39† | 0.54 | <0.001 |
| +1-mo LNFPI | 0.18 | 0.55 | 0.52 |
| +6-mo LNFPI | −0.84† | 0.67 | 0.02 |
| +1-mo DSLNT | 0.31 | 0.67 | 0.62 |
| +6-mo DSLNT | 1.66* | 0.82 | <0.01 |
| +1-mo FDSLNH | −2.63* | 0.87 | 0.04 |
| +6-mo FDSLNH | 1.84 | 0.87 | 0.43 |
| Percentage fat | |||
| Base model | 0.18 | ||
| +1-mo percentage fat | 0.35 | 0.33 | 0.06 |
| +1-mo LNnT | 0.001 | 0.34 | 0.65 |
| +6-mo LNnT | −0.03† | 0.57 | <0.01 |
Multiple linear regression was performed to examine the change in the R2 with the addition of each human milk oligosaccharide. The base model included sex, prepregnancy BMI, weight gain during pregnancy, and 6-mo infant age. Parameter estimates (β) are from the full model (n = 25). *P < 0.05, ‡P < 0.0001, †P ≤ 0.01. DSLNT, disialyl-lacto-N-tetraose; FDSLNH, fucosyl-disialyl-lacto-N-hexaose; LNFPI, lacto-N-fucopentaose I; LNnT, lacto-N-neotetraose.
DISCUSSION
To our knowledge, this is the first study to consider variation in HMOs and how they relate to infant growth and obesity during early development. Increasing evidence suggests that nonnutritive substances in human breast milk affect growth and body composition early in life (33, 36, 37). In a group of 25 breastfeeding mother-infant pairs, our primary objective was to test whether HMOs were related to infant growth and body composition at 1 and 6 mo of infant age. Although far from conclusive, emerging data also suggest that increased leptin (38–42) and insulin in breast milk may influence infant body weight (43). Building on this work, our study suggests that HMOs at both 1 and 6 mo are associated with infant body weight, fat mass, and lean mass. With regard to body composition, results from this study indicate that 6-mo LNFPII and 6-mo DSLNT were associated with 6-mo fat mass. Specifically, a 1-SD increase in LNFPII and DSLNT was associated with a 398- and 856-g greater fat mass, which was ~16% and 35% of the average fat mass observed at 6 mo. When examined collectively, LNFPI, DSLNT, and FDSLNH explained 33% more of the variance in infant fat mass than did sex, prepregnancy BMI, weight gain during pregnancy, and 6-mo infant age alone.
One of the most prominent relations between HMOs and infant body composition was LNFPI, in which 1-mo LNFPI was inversely associated with 1-mo infant weight and 6-mo LNFPI was inversely associated with infant weight, lean mass, and fat mass. Results from this study show that at 6 mo, a 1-SD increase in LNFPI was associated with a 677-g lower weight, a 519-g lower lean mass, and a 482-g lower fat mass. Importantly, 1- and 6-mo LNFPI explained 18% and 6% more of the variance in infant weight at each time point than did other important covariates such as maternal prepregnancy BMI and pregnancy weight gain. A recent study in 10 mother-infant pairs found that certain HMOs, such as LNFPI, have better correlations between mother’s milk and infant plasma than urine. As suggested by the authors, these findings may indicate selective intestinal or systemic utilization of LNFPI (5), which could contribute to some of our findings. The opposing associations between LNFPI and LNFPII with infant body composition were intriguing given that a recent proof-of-concept study found that the presence of these HMOs in infant stool dramatically changed during early life in which LNFPII increased whereas LNFPI decreased over 13 wk (44).
HMOs are thought to aid in the growth and metabolic efficacy of the developing infant microbiome (21). Traditionally, measures of diversity and evenness have been used to characterize the microbiome in which diversity is a measure of the variety of bacterial species and evenness is a measure of the relative proportion of each respective species. To our knowledge, this is the first study to explore HMO diversity and evenness and how it relates to infant growth and body composition. We showed robust inverse associations between 1-mo HMO diversity and evenness with measures of adiposity at 1 mo in which a 1-SD increase in either diversity or evenness was associated with an ~6.3% lower fat mass. At the same time, we found that HMO diversity and evenness explained between 17% and 20% more of the variance in adiposity than did other important factors such as maternal prepregnancy BMI and pregnancy weight gain.
Although we did not collect stool samples, preliminary findings observed in the current study may be partially attributed to the prebiotic effects of HMOs. In support of this, a recent study found a distinct fecal microbiota composition in breastfed compared with formula-fed infants, in which the fecal microbiota in breastfed infants correlated with the HMOs consumed (particularly LNFPI and DSLNT) (23). Another study in adults found that gut microbial richness correlated with obesity and metabolic markers (45), lending support to the theory that variations in breast-milk composition (46) may modulate the gut flora, alter gastrointestinal activities, and influence inflammatory processes, thereby affecting infant growth and body composition. Future studies will need to show whether HMO diversity and evenness are associated with microbiome diversity and evenness and whether those links contribute to early infant body composition.
Given the small sample size included in this study, our results do not provide definitive evidence of independent effects of HMOs on infant growth and body composition. Because the current findings did not withstand multiple correction testing, we conclude that the overall composition of HMOs in breast milk appears to be related to infant growth and body composition. Future work should be performed in larger samples with longer follow-up to identify the exact contribution of specific HMOs to infant development. Because data were only collected at ages 1 and 6 mo, we are unable to draw definitive conclusions with regard to the relations between HMOs and infant outcomes. HMO composition may have direct interactions with infant growth and body composition due to effects on epithelial cell responses in the gut (16, 24–26) or through systemic effects because they are absorbed and reach the circulation (5, 27, 28). For example, HMOs may also affect neural development, which is important for the control of infant feeding behavior. It is also possible that HMOs appear to be associated with infant growth and body composition due to natural variations over time. The generalizability of our results is limited because we were unable to explore whether these relations differed by obesity status or race-ethnicity. Furthermore, additional work is needed to fully understand the mechanistic links between HMOs and infant development as well as the involvement of the infant gut microbiome and metabolome. Last, because our definition of breastfeeding only restricted the use of infant formulas, solid food introduction may have occurred in some infants and contributed to growth and body composition. Despite these limitations, results from this study provide preliminary evidence that the specific makeup and diversity of HMOs found in breast milk may contribute to infant growth and body composition.
Acknowledgments
We thank Catherine Wolf (study recruitment and testing of subjects) and April Teague (who performed all breast-milk analyses) for their work on the study.
The authors’ responsibilities were as follows—LB, MIG, and DAF: designed the research; TLA, CA, BEB, and RK: conducted the research; TLA, LB, MIG, and DAF: analyzed the data, performed statistical analysis, and wrote the manuscript; and LB and MIG: had primary responsibility for final content. Mead Johnson Nutrition provided financial support for the milk collection but provided no financial support for the analysis, and the final decision on content was exclusively retained by the authors. All authors read and approved the manuscript as submitted. None of the authors declared a conflict of interest.
ABBREVIATIONS
- DSLNT
disialyl-lacto-N-tetraose
- FDSLNH
fucosyl-disialyl-lacto-N-hexaose
- HMO
human milk oligosaccharide
- LNFP
lacto-N-fucopentaose
- LNnT
lacto-N-neotetraose
- LNT
lacto-N-tetraose
- LST
sialyl-lacto-N-tetraose
- 2′-FL
2′-fucosyllactose
- 3′-SL
3′-sialyllactose
FOOTNOTES
Mead Johnson Nutrition provided financial support for the milk collection.
Preliminary data in 19 subjects irrespective of maternal BMI from this study were published previously [Fields DA, Demerath EW. Relationship of insulin, glucose, leptin, IL-6 and TNF-alpha in human breast milk with infant growth and body composition. Pediatr Obes 2012;7(4):304–12].
REFERENCES
- 1. Ogden CL, Carroll MD, Kit BK, Flegal KM.. Prevalence of childhood and adult obesity in the United States, 2011-2012. JAMA 2014;311:806–14. [DOI] [PMC free article] [PubMed] [Google Scholar]
- 2. Graversen L, Sørensen TIA, Petersen L, Sovio U, Kaakinen M, Sandbaek A, Laitinen J, Taanila A, Pouta A, Järvelin M-R, et al. Stability of the associations between early life risk indicators and adolescent overweight over the evolving obesity epidemic. PLoS One 2014;9:e95314. [DOI] [PMC free article] [PubMed] [Google Scholar]
- 3. Deshmukh-Taskar P, Nicklas TA, Morales M, Yang SJ, Zakeri I, Berenson GS.. Tracking of overweight status from childhood to young adulthood: the Bogalusa Heart Study. Eur J Clin Nutr 2006;60:48–57. [DOI] [PubMed] [Google Scholar]
- 4. Marcus MD, Foster GD, Ghormli El L.. Stability of relative weight category and cardiometabolic risk factors among moderately and severely obese middle school youth. Obesity (Silver Spring) 2014;22:1118–25. [DOI] [PMC free article] [PubMed] [Google Scholar]
- 5. Dotz V, Rudloff S, Meyer C, Lochnit G, Kunz C.. Metabolic fate of neutral human milk oligosaccharides in exclusively breast-fed infants. Mol Nutr Food Res 2015;59:355–64. [DOI] [PubMed] [Google Scholar]
- 6. Zhu Y, Hernandez LM, Dong Y, Himes JH, Hirschfeld S, Forman MR.. Longer breastfeeding duration reduces the positive relationships among gestational weight gain, birth weight and childhood anthropometrics. J Epidemiol Community Health 2015;69:632–8. [DOI] [PubMed] [Google Scholar]
- 7. Rousseaux J, Duhamel A, Turck D, Molnar D, Salleron J, Artero EG, De Henauw S, Dietrich S, Manios Y, Piccinelli R, et al. Breastfeeding shows a protective trend toward adolescents with higher abdominal adiposity. Obes Facts 2014;7:289–301. [DOI] [PMC free article] [PubMed] [Google Scholar]
- 8. Moss BG, Yeaton WH.. Early childhood healthy and obese weight status: potentially protective benefits of breastfeeding and delaying solid foods. Matern Child Health J 2014;18:1224–32. [DOI] [PubMed] [Google Scholar]
- 9. Owen CG, Martin RM, Whincup PH, Smith GD, Cook DG.. Effect of infant feeding on the risk of obesity across the life course: a quantitative review of published evidence. Pediatrics 2005;115:1367–77. [DOI] [PubMed] [Google Scholar]
- 10. Gillman MW, Rifas-Shiman SL, Camargo CA, Berkey CS, Frazier AL, Rockett HR, Field AE, Colditz GA.. Risk of overweight among adolescents who were breastfed as infants. JAMA 2001;285:2461–7. [DOI] [PubMed] [Google Scholar]
- 11. Martin RM, Patel R, Kramer MS, Guthrie L, Vilchuck K, Bogdanovich N, Sergeichick N, Gusina N, Foo Y, Palmer T, et al. Effects of promoting longer-term and exclusive breastfeeding on adiposity and insulin-like growth factor-I at age 11.5 years: a randomized trial. JAMA 2013;309:1005–13. [DOI] [PMC free article] [PubMed] [Google Scholar]
- 12. Grummer-Strawn LM, Mei Z.. Centers for Disease Control and Prevention Pediatric Nutrition Surveillance System. Does breastfeeding protect against pediatric overweight? Analysis of longitudinal data from the Centers for Disease Control and Prevention Pediatric Nutrition Surveillance System. Pediatrics 2004;113:e81–6. [DOI] [PubMed] [Google Scholar]
- 13. Butte NF, Wong WW, Fiorotto M, Smith EO, Garza C.. Influence of early feeding mode on body composition of infants. Biol Neonate 1995;67:414–24. [DOI] [PubMed] [Google Scholar]
- 14. Jing H, Xu H, Wan J, Yang Y, Ding H, Chen M, Li L, Lv P, Hu J, Yang J.. Effect of breastfeeding on childhood BMI and obesity: the China Family Panel Studies. Medicine (Baltimore) 2014;93:e55. [DOI] [PMC free article] [PubMed] [Google Scholar]
- 15. Horta BL, Victora CG.. Long-term effects of breastfeeding: a systematic review. Geneva (Switzerland): WHO Press; 2013. [Google Scholar]
- 16. Bode L, Jantscher-Krenn E.. Structure-function relationships of human milk oligosaccharides. Adv Nutr 2012;3(Suppl):383S–91S. [DOI] [PMC free article] [PubMed] [Google Scholar]
- 17. Bode L.. Human milk oligosaccharides: every baby needs a sugar mama. Glycobiology 2012;22:1147–62. [DOI] [PMC free article] [PubMed] [Google Scholar]
- 18. Turnbaugh PJ, Ley RE, Mahowald MA, Magrini V, Mardis ER, Gordon JI.. An obesity-associated gut microbiome with increased capacity for energy harvest. Nature 2006;444:1027–31. [DOI] [PubMed] [Google Scholar]
- 19. Ley RE, Turnbaugh PJ, Klein S, Gordon JI.. Microbial ecology: human gut microbes associated with obesity. Nature 2006;444:1022–3. [DOI] [PubMed] [Google Scholar]
- 20. Subramanian S, Blanton LV, Frese SA, Charbonneau M, Mills DA, Gordon JI.. Cultivating healthy growth and nutrition through the gut microbiota. Cell 2015;161:36–48. [DOI] [PMC free article] [PubMed] [Google Scholar]
- 21. Newburg DS, Morelli L.. Human milk and infant intestinal mucosal glycans guide succession of the neonatal intestinal microbiota. Pediatr Res 2015;77:115–20. [DOI] [PubMed] [Google Scholar]
- 22. Ridaura VK, Faith JJ, Rey FE, Cheng J, Duncan AE, Kau AL, Griffin NW, Lombard V, Henrissat B, Bain JR, et al. Gut microbiota from twins discordant for obesity modulate metabolism in mice. Science 2013;341:1241214. [DOI] [PMC free article] [PubMed] [Google Scholar]
- 23. Wang M, Li M, Wu S, Lebrilla CB, Chapkin RS, Ivanov I, Donovan SM.. Fecal microbiota composition of breast-fed infants is correlated with human milk oligosaccharides consumed. J Pediatr Gastroenterol Nutr 2015;60:825–33. [DOI] [PMC free article] [PubMed] [Google Scholar]
- 24. Holscher HD, Davis SR, Tappenden KA.. Human milk oligosaccharides influence maturation of human intestinal Caco-2Bbe and HT-29 cell lines. J Nutr 2014;144:586–91. [DOI] [PubMed] [Google Scholar]
- 25. Chichlowski M, De Lartigue G, German JB, Raybould HE, Mills DA.. Bifidobacteria isolated from infants and cultured on human milk oligosaccharides affect intestinal epithelial function. J Pediatr Gastroenterol Nutr 2012;55:321–7. [DOI] [PMC free article] [PubMed] [Google Scholar]
- 26. Kuntz S, Rudloff S, Kunz C.. Oligosaccharides from human milk influence growth-related characteristics of intestinally transformed and non-transformed intestinal cells. Br J Nutr 2008;99:462–71. [DOI] [PubMed] [Google Scholar]
- 27. Ruhaak LR, Stroble C, Underwood MA, Lebrilla CB.. Detection of milk oligosaccharides in plasma of infants. Anal Bioanal Chem 2014;406:5775–84. [DOI] [PMC free article] [PubMed] [Google Scholar]
- 28. Goehring KC, Kennedy AD, Prieto PA, Buck RH.. Direct evidence for the presence of human milk oligosaccharides in the circulation of breastfed infants. PLoS ONE 2014;9:e101692. [DOI] [PMC free article] [PubMed] [Google Scholar]
- 29. Thurl S, Henker J, Taut H, Tovar K, Sawatzki G.. Variations of neutral oligosaccharides and lactose in human milk during the feeding. Z Ernahrungswiss 1993;32:262–9. [DOI] [PubMed] [Google Scholar]
- 30. Thurl S, Munzert M, Henker J, Boehm G, Müller-Werner B, Jelinek J, Stahl B.. Variation of human milk oligosaccharides in relation to milk groups and lactational periods. Br J Nutr 2010;104:1261–71. [DOI] [PubMed] [Google Scholar]
- 31. Asakuma S, Urashima T, Akahori M, Obayashi H, Nakamura T, Kimura K, Watanabe Y, Arai I, Sanai Y.. Variation of major neutral oligosaccharides levels in human colostrum. Eur J Clin Nutr 2008;62:488–94. [DOI] [PubMed] [Google Scholar]
- 32. Chaturvedi P, Warren CD, Altaye M, Morrow AL, Ruiz-Palacios G, Pickering LK, Newburg DS.. Fucosylated human milk oligosaccharides vary between individuals and over the course of lactation. Glycobiology 2001;11:365–72. [DOI] [PubMed] [Google Scholar]
- 33. Fields DA, Demerath EW.. Relationship of insulin, glucose, leptin, IL-6 and TNF-α in human breast milk with infant growth and body composition. Pediatr Obes 2012;7:304–12. [DOI] [PMC free article] [PubMed] [Google Scholar]
- 34. Chandler-Laney PC, Gower BA, Fields DA.. Gestational and early life influences on infant body composition at 1 year. Obesity (Silver Spring) 2013;21:144–8. [DOI] [PubMed] [Google Scholar]
- 35. Bode L, Kuhn L, Kim H-Y, Hsiao L, Nissan C, Sinkala M, Kankasa C, Mwiay M, Thea DM, Aldrovandi GM.. Human milk oligosaccharide concentration and risk of postnatal transmission of HIV through breastfeeding. Am J Clin Nutr 2012;96:831–9. [DOI] [PMC free article] [PubMed] [Google Scholar]
- 36. Woo JG, Guerrero ML, Altaye M, Ruiz-Palacios GM, Martin LJ, Dubert-Ferrandon A, Newburg D, Morrow AL.. Human milk adiponectin is associated with infant growth in two independent cohorts. Breastfeed Med 2009;4:101–9. [DOI] [PMC free article] [PubMed] [Google Scholar]
- 37. Woo JG, Guerrero ML, Guo F, Martin LJ, Davidson BS, Ortega H, Ruiz-Palacios GM, Morrow AL.. Human milk adiponectin affects infant weight trajectory during the second year of life. J Pediatr Gastroenterol Nutr 2012;54:532–9. [DOI] [PMC free article] [PubMed] [Google Scholar]
- 38. Uysal FK, Onal EE, Aral YZ, Adam B, Dilmen U, Ardiçolu Y.. Breast milk leptin: its relationship to maternal and infant adiposity. Clin Nutr 2002;21:157–60. [DOI] [PubMed] [Google Scholar]
- 39. Bronsky J, Karpísek M, Bronská E, Pechová M, Jancíková B, Kotolová H, Stejskal D, Průša R, Nevoral J.. Adiponectin, adipocyte fatty acid binding protein, and epidermal fatty acid binding protein: proteins newly identified in human breast milk. Clin Chem 2006;52:1763–70. [DOI] [PubMed] [Google Scholar]
- 40. Miralles O, Sánchez J, Palou A, Picó C.. A physiological role of breast milk leptin in body weight control in developing infants. Obesity (Silver Spring) 2006;14:1371–7. [DOI] [PubMed] [Google Scholar]
- 41. Schueler J, Alexander B, Hart AM, Austin K, Larson-Meyer DE.. Presence and dynamics of leptin, GLP-1, and PYY in human breast milk at early postpartum. Obesity (Silver Spring) 2013;21:1451–8. [DOI] [PMC free article] [PubMed] [Google Scholar]
- 42. Brunner S, Schmid D, Zang K, Much D, Knoeferl B, Kratzsch J, Amann-Gassner U, Bader BL, Hauner H.. Breast milk leptin and adiponectin in relation to infant body composition up to 2 years. Pediatr Obes 2015;10:67–73. [DOI] [PubMed] [Google Scholar]
- 43. Ley SH, Hanley AJ, Sermer M, Zinman B, O’Connor DL.. Associations of prenatal metabolic abnormalities with insulin and adiponectin concentrations in human milk. Am J Clin Nutr 2012;95:867–74. [DOI] [PubMed] [Google Scholar]
- 44. De Leoz MLA, Kalanetra KM, Bokulich NA, Strum JS, Underwood MA, German JB, Mills DA, Lebrilla CB.. Human milk glycomics and gut microbial genomics in infant feces show a correlation between human milk oligosaccharides and gut microbiota: a proof-of-concept study. J Proteome Res 2015;14:491–502. [DOI] [PMC free article] [PubMed] [Google Scholar]
- 45. . Le Chatelier E, Nielsen T, Qin J, Prifti E, Hildebrand F, Falony G, Almeida M, Arumugam M, Batto J-M, Kennedy S, et al. Richness of human gut microbiome correlates with metabolic markers. Nature 2013;500:541–6. [DOI] [PubMed] [Google Scholar]
- 46. . Newburg DS, Ruiz-Palacios GM, Morrow AL.. Human milk glycans protect infants against enteric pathogens. Annu Rev Nutr 2005;25:37–58. [DOI] [PubMed] [Google Scholar]