

ABSTRACT
The intestinal microbiome produces various metabolites that may harm or benefit the host. However, the production pathways of these metabolites have not been well characterised.
The polyamines putrescine and spermidine required for physiological process are also produced by intestinal microbiome. The production and release of these polyamines by microbiome are poorly understood, though we have confirmed that intestinal bacteria produced putrescine from arginine. In this study, we characterised polyamine synthesis by analysing the collective metabolic functions of the intestinal microbiome. In particular, we analysed polyamines and their intermediates in faecal cultures, as well as the colonic contents of rats injected with isotope-labelled arginine through a colon catheter, using mass spectrometry.
Isotope-labelled putrescine was detected in faecal cultures and colonic contents of rats injected with isotope-labelled arginine. Putrescine is produced through multiple pathways, and its extracellular intermediates are exchanged between bacterial species. Additionally, we demonstrated that the collective metabolic pathway depends on a complex exchange of metabolites released into the colonic lumen.
This study demonstrates the existence of putrescine biosynthetic pathways based on the collective metabolic functions of the intestinal microbial community. Our findings provide knowledge to manipulate the levels of intestinal microbial products, including polyamines, that may modulate host health.
KEYWORDS: Intestinal microbiome, Polyamines, arginine degradation, metabolomics, stable isotope
Introduction
The intestinal microbiome, a complex community, metabolizes food components that are not digested by the host, and supplies nutrients, including vitamins and essential amino acids, that are not synthesised by the host.1–3 In addition to nutrients, intestinal bacteria produce biologically active substances such as short-chain fatty acids, secondary bile acids, and trimethylamine.4–6 Consequently, intestinal luminal metabolites produced by the intestinal microbiome are associated with the health of the host, and affect immune homeostasis,7 as well as the development of obesity,8 cardiovascular disease,5 autism spectrum disorder,9 and cancer.10 Indeed, the new germ theory states that commensal bacteria provide a core set of genes or biological functions.11 Notably, metagenomic analysis has revealed few differences in the functional gene composition of the microbiome, despite extensive differences in species diversity.12 Today, the intestinal microbiome is considered an important component of the digestive system, and is believed to possess metabolic functions.
Polyamines, which include putrescine, spermidine, and spermine, are low-molecular-weight organic cations required for structural stability of DNA and RNA, protein synthesis, cell growth, and differentiation.13 Accordingly, polyamines have multiple physiological roles. For example, polyamines suppress inflammation by inhibiting inflammatory cytokine synthesis in macrophages,14 exert antimutagenic effects,15,16 and inhibit aberrant gene methylation.17 In intestinal epithelial cells, polyamines play a role in occludin protein synthesis and stability,18 regulate E-cadherin transcription,19 regulate apoptosis,20 and increase cell proliferation.21 Furthermore, spermidine enhances longevity in bacteria, yeast, worms, and flies by promoting autophagy.22 In mammals, the abundance of polyamines in the body decreases with age,23,24 and the concentration of intestinal luminal polyamines is lower in the elderly.25 Most dietary polyamines are absorbed in the small intestine.26 In contrast, putrescine and spermidine are produced by intestinal bacteria in the colon.27 Recently, Kibe et al.28 demonstrated that administration of arginine, a polyamine precursor, results in a dose-dependent increase in putrescine concentration in the rat and mouse colonic lumen and that increasing polyamine abundance in the mouse colonic lumen delays senescence. Therefore, intestinal bacteria are considered an important source of polyamines in the lower intestinal tract.
By in silico screening for orthologues, Burrell et al. revealed that arginine decarboxylation is the dominant pathway for polyamine biosynthesis in the 55 most abundant species in the human intestinal microbiome.29 However, 20 of these species cannot produce putrescine on their own because their biosynthesis pathways are incomplete, although each species harbours some components of putrescine biosynthesis genes. Hence, we speculate that these species acquire the required biosynthetic intermediates from other species, i.e. the intestinal microbiome synthesises putrescine from arginine via an extracellular intermediate by a collective biosynthetic pathway. However, these pathways have not been characterised to date.
The purpose of this study was to investigate the production of putrescine by the collective metabolic functions of the intestinal microbiome as a community. Using capillary electrophoresis-time of flight mass spectrometry (CE-TOF MS) and gas chromatography (GC-MS), we analysed extracellular polyamines and polyamine intermediates in faecal cultures grown in the presence of isotope-labelled arginine, as well as in colonic contents of rats injected with isotope-labelled arginine via a catheter.
Results
Putrescine and its intermediates in faecal cultures supplemented with arginine
First, we investigated the time course of the change in the concentrations of arginine, putrescine, and spermidine and the biosynthetic intermediates, ornithine, citrulline and agmatine in the supernatant of faecal cultures supplemented with arginine. Arginine was rapidly consumed in faecal cultures, and almost depleted after 2 h (Fig. 1a). Accordingly, the concentrations of the intermediates citrulline and ornithine increased and decreased rapidly, with peak concentrations at 2 h (Fig. 1a). However, the concentration of agmatine was comparable between cultures supplemented with or without arginine (Fig. 1a). Putrescine also accumulated rapidly between 2 h and 6 h, and stabilised by 12 h (Fig. 1a). In contrast, spermidine levels decreased with time (Fig. 1a). The pH of culture medium with or without arginine decreased over time (Fig. 1b). Fig. 1c shows the total molar concentrations of citrulline, ornithine, and putrescine in cultures supplemented with arginine, calculated as a percentage of the molar concentration of arginine at 0 h. The proportion of the total molar concentration of citrulline, ornithine, and putrescine relative to that of arginine was 84.0% at 2 h and 78.1% at 4 h.
Figure 1.
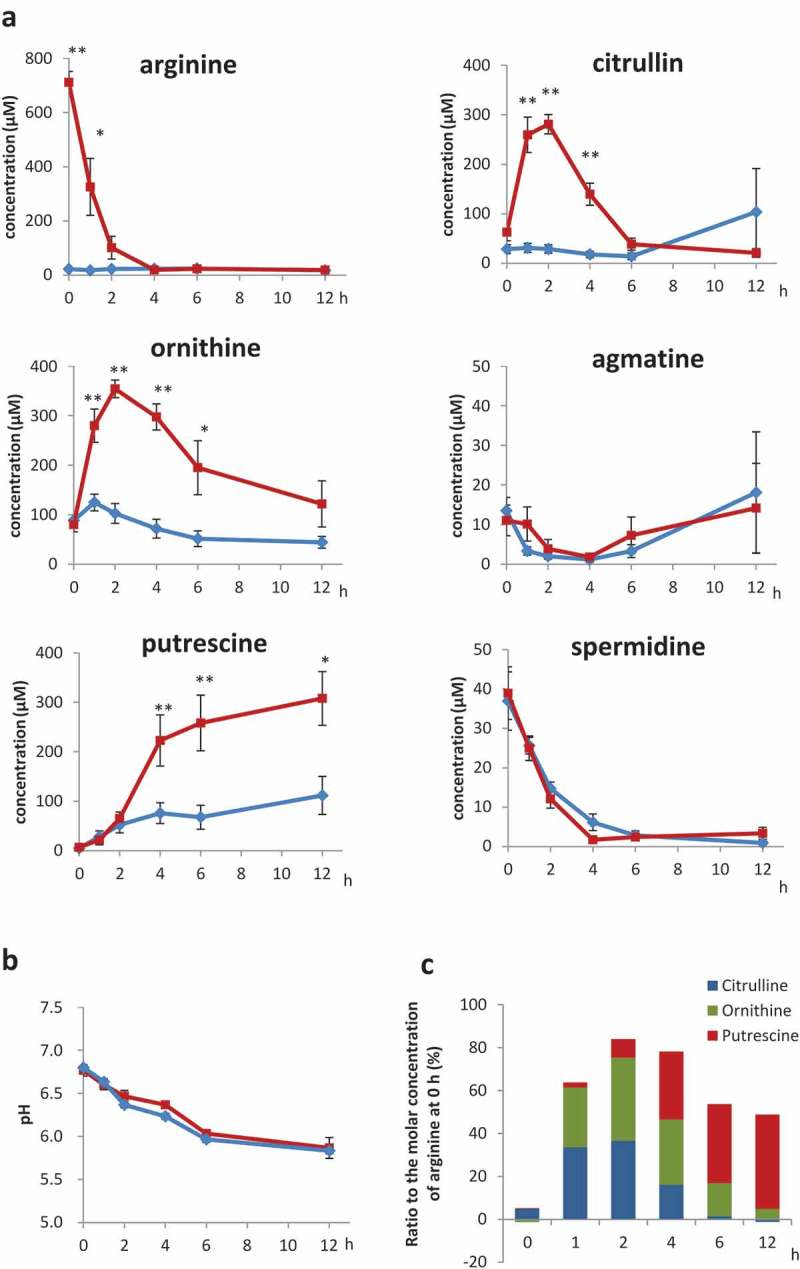
Polyamines and intermediates in faecal cultures Time course of (a) arginine, citrulline, ornithine, agmatine, putrescine and spermidine, as measured by UPLC, and (b) pH of faecal cultures supplemented with 1 mM arginine (red) or PBS (blue) (c) Ratio of total citrulline, ornithine, and putrescine to the molar concentration of arginine at 0 h; error bars indicate standard error (n = 7); *, p < 0.05; **, p < 0.01 compared with PBS by two-way analysis of variance without replication, followed by post-hoc Bonferroni multiple comparison test (a, b).
Isotope-labelled putrescine in faecal cultures supplemented with isotope-labelled arginine
We investigated the putrescine concentration and isotope ratio in faecal cultures supplemented with isotope-labelled L-arginine −13C6,15N4 (M + 10) using GC-MS to ascertain whether arginine was converted to putrescine. GC-MS analysis revealed the putrescine concentration in faecal cultures increased rapidly between 2 and 6 h when supplemented with isotope-labelled arginine (Fig. 2a). Additionally, isotope-labelled putrescine (M + 6) synthesised via a linear pathway from isotope-labelled arginine (M + 10) was detected in all faecal cultures from three individual rats (Fig. 2b). The proportion putrescine (M + 6) relative to total putrescine at 2, 4, 6, and 12 h was 72.9%, 70.6%, 65.2%, and 57.3%, respectively (Fig. 2b). Interestingly, putrescine (M + 5) not synthesised via a linear pathway from isotope-labelled arginine (M + 10) was also detected in all three cultures (Fig. 2b). Isotope-labelled spermidine and spermine were not detected (data not shown).
Figure 2.
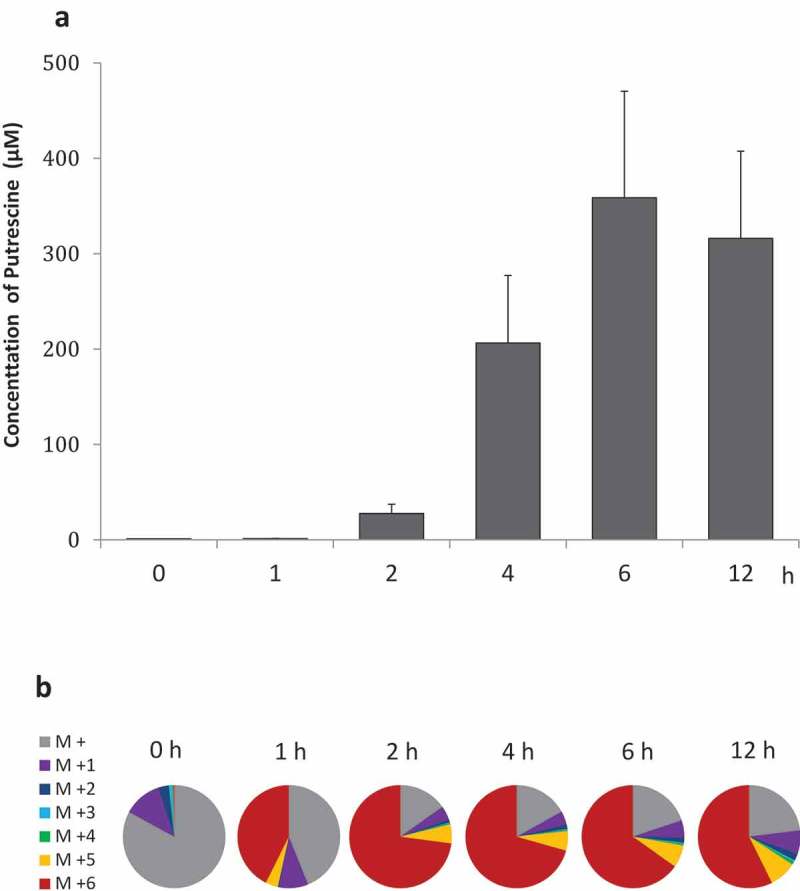
Isotope-labelled putrescine in faecal cultures Time course of (a) putrescine concentrations and (b) ratios of isotope-labelled putrescine in faecal cultures supplemented with isotope-labelled arginine (n = 3), as measured by GC-MS.
Isotope-labelled metabolites in colonic contents
To investigate whether the metabolism observed in faecal cultures also occurs in the intestinal lumen of the host, we performed a targeted metabolomic analysis of rat colonic contents injected with isotope-labelled arginine via a colon catheter. The colonic contents of rats were collected 6 h post-injection and the metabolites were extracted with phosphate-buffered saline (PBS). Subsequently, the target metabolites listed in Table S1 were analysed using CE-TOF MS.
The isotope-labelled metabolites detected in rat colonic contents are listed in Table 1. Isotope-labelled putrescine (M + 6) was detected in all rats injected with isotope-labelled arginine (M + 10). The average proportion of labelled putrescine (M + 6) relative to total putrescine was 22.7%. Putrescine (M + 5) not produced via linear pathway from isotope-labelled arginine (M + 10) was detected in two of three rats. Spermidine (M + 6) derived from putrescine (M + 6) was detected in all rats at an average proportion of 2.0% of the total spermidine. Isotope-labelled amino acids were also detected. Arginine (M + 7, M + 9, and M + 10), ornithine (M + 5, M + 6, and M + 7), and citrulline (M + 7 and M + 9) were detected in all rats, whereas agmatine (M + 6 and M + 9), citrulline (M + 6 and M + 8), and glutamic acid (M + 5) were detected in only one of three rats. The collective metabolic pathway speculated from these data is shown in Fig. 3a, b. Citrulline (M + 9), ornithine (M + 7), and agmatine (M + 9) are intermediates of putrescine synthesis via a linear pathway from isotope-labelled arginine (M + 10) (Fig. 3a, b, red arrows). Arginine (M + 7 and M + 9), ornithine (M + 5 and M + 6), citrulline (M + 6, M + 7 and M + 8), and agmatine (M + 6) are not produced by the forward linear pathways of arginine deiminase, ornithine decarboxylase, and arginine decarboxylase. These metabolites were produced via a reverse pathway (Fig. 3a, green arrows). For the other 45 metabolites, the isotope ratio was not remarkably higher than natural levels (Table S2).
Table 1.
Isotope-labeld metabolites in rat colonic content.
| Relative area (%) | ||||||||
|---|---|---|---|---|---|---|---|---|
| |
Arginine |
|
Ornithine |
|
Citrulline |
|
Agmatine |
|
| M+ | 87.8±0.94 | (3/3) | 73.8±2.88 | (3/3) | 84.3±1.24 | (3/3) | 96.3±6.36 | (3/3) |
| M + 1 | 6.30±0.26 | (3/3) | 5.62±0.35 | (3/3) | 6.33±0.19 | (3/3) | 1.82 | (1/3) |
| M + 2 | 0.62±0.04 | (3/3) | ND | 0.89±0.45 | (2/3) | ND | ||
| M + 3 | ND | ND | ND | ND | ||||
| M + 4 | ND | ND | ND | ND | ||||
| M + 5 | ND | 0.55±0.01 | (3/3) | ND | ND | |||
| M + 6 | ND | 3.93±0.29 | (3/3) | 0.32 | (1/3) | 0.65 | (1/3) | |
| M + 7 | 1.24±0.25 | (3/3) | 16.1±3.00 | (3/3) | 3.81±0.15 | (3/3) | ND | |
| M + 8 | ND | ND | 0.33 | (1/3) | ND | |||
| M + 9 | 0.59±0.10 | (3/3) | ND | 4.04±0.75 | (3/3) | 1.24 | (1/3) | |
| M + 10 |
3.45±0.66 |
(3/3) |
|
ND |
|
ND |
|
ND |
| Concentration (µM) | ||||||||
| |
Arginine |
|
Ornithine |
|
Citrulline |
|
Agmatine |
|
| 475±219 | 777±247 | 529±238 | NC | |||||
| Relative area (%) | ||||||||
| |
Putrescine |
|
Spermidine |
|
Spermine |
|
Glutamic acid |
|
| M+ | 67.6±9.64 | (3/3) | 90.4±0.53 | (3/3) | 100±0 | (3/3) | 93.6±0.39 | (3/3) |
| M + 1 | 6.18±0.64 | (3/3) | 7.62±0.21 | (3/3) | ND | 5.53±0.31 | (3/3) | |
| M + 2 | ND | ND | ND | 0.85±0.05 | (3/3) | |||
| M + 3 | ND | ND | ND | ND | ||||
| M + 4 | ND | ND | ND | ND | ||||
| M + 5 | 3.50±1.78 | (3/2) | ND | ND | 0.03 | (1/3) | ||
| M + 6 |
22.7±8.83 |
(3/3) |
1.99±0.45 |
(3/3) |
|
ND |
|
ND |
| Concentration (µM) | ||||||||
| |
Putrescine |
|
Spermidine |
|
Spermine |
|
Glutamic acid |
|
| 160±62.8 | 307±26.4 | 17.5±5.35 | 5204±1020 | |||||
Values are represent as mean ± SE, n = 3. Values in parentheses represent the number of colonic content samples in which the compounds were detected/the number of colonic content samples examined. ND, not detected; NC, not calculated.
Figure 3.
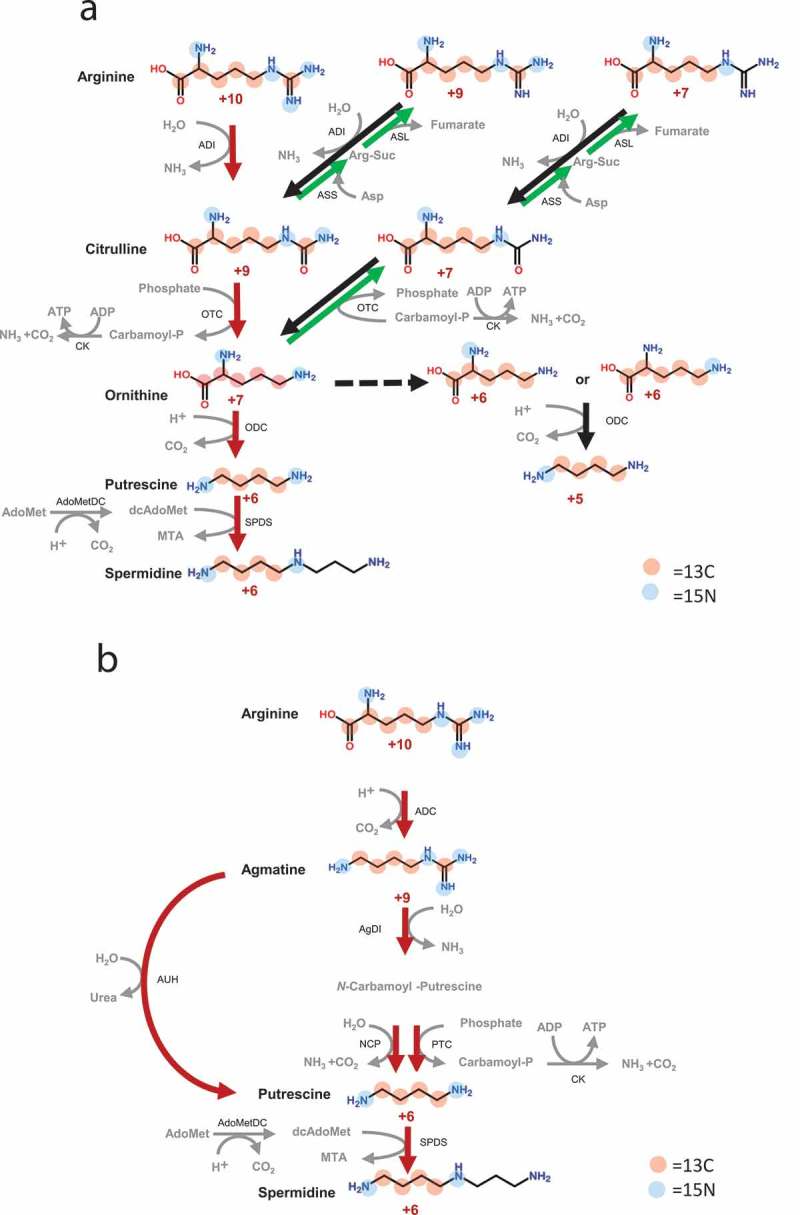
Putrescine collective biosynthetic pathway Proposed putrescine collective biosynthetic pathway via (a) ornithine or (b) agmatine in the intestinal microbiome; ADI, arginine deiminase; ADC, arginine decarboxylase; AgDI, agmatine deiminase; OTC, ornithine carbamoyltransferase; ODC, ornithine decarboxylase; CK, carbamate kinase; PTC, putrescine carbamoyltransferase; NCP, N-carbamoyl putrescine amidase; AdoMetDC, S-adenosylmethionine carboxy-lyase; SPDS, spermidine synthase; AUH, agmatine ureohydrolase; ASS, argininosuccinate synthetase; ASL, argininosuccinate lyase; Carbamoyl-P, carbamoylputrescine; Arg-Suc, argininosuccinate; AdoMet, S-adenosylmethionine; dcAdoMet, S-adenosylmethioninamine; MTA, 5’-methylthioadenosine. Red and blue circles represent 13C and 15N. Red arrows indicate the linear pathway from isotope-labelled arginine (M + 10), black arrows indicate the pathway from isotope-labelled arginine (not M + 10), and the green arrows indicate reverse pathways. Dashed lines show the putative pathway.
Putrescine production from extracellular ornithine, citrulline, and agmatine
The isotope was incorporated in vivo into the metabolic intermediates ornithine, citrulline and agmatine, and ornithine and citrulline levels increased early in faecal cultures; accordingly, we investigated putrescine production in faecal cultures supplemented with these intermediates. We found that exogenous ornithine, citrulline, or agmatine significantly increased putrescine production (p < 0.05, Fig. 4), confirming that the intestinal microbiome produces putrescine from arginine via shared extracellular intermediates.
Figure 4.
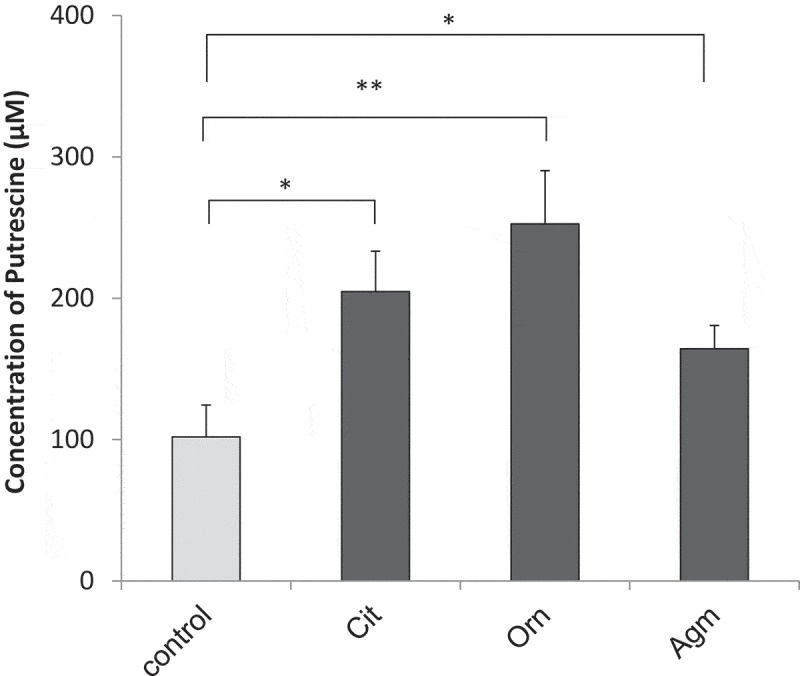
Putrescine production from exogenous intermediates Production of putrescine in faecal cultures supplemented with 1 mM citrulline (Cit), ornithine (Orn), and agmatine (Agm) (n = 7), as measured by UPLC; error bars represent standard error; *, p < 0.05; **, p < 0.01 by Student’s t-test versus control.
Composition of intestinal bacteria and presence of enzymes that catalyse polyamine synthesis
We investigated whether bacteria harbouring enzymes that synthesise polyamines from arginine are present in faeces, based on 16S rRNA gene sequencing data. On average, 35,115 usable sequence reads were obtained per faecal sample by using Ion PGM, a system for next-generation sequencing. The 2,400 OTUs detected in all samples were identified by RDP classifier as belonging to 48 genera (Table S3). All sequence data were deposited in the DDBJ sequence read archive database under accession number (DRA006802). Predictive functional gene profiling was performed by 16S rRNA gene sequencing using Piphillin, which utilizes 16S rRNA taxonomic information to predict functional attributes of microbial assemblages.30 Analysis using Piphillin suggested the presence of multiple polyamine synthesis genes, including arginine deiminase (ADI), ornithine carbamoyltransferase (OTC), ornithine decarboxylase (ODC), arginine decarboxylase (ADC), agmatine ureohydrolase (AUH), agmatine deiminase (AgDI), putrescine carbamoyltransferase (PCT), N-carbamoyl putrescine amidase (NCP), S-adenosylmethionine carboxy-lyase (AdoMetDC), spermidine synthase (SPDS), and carboxyspermidine decarboxylase (CASDC), in the microbial communities (Table 2). The results suggested that the microbiota in the rat intestine harbours enzymes that synthesise putrescine and spermidine from arginine.
Table 2.
The polyamine biosynthetic genes predicted to be presence in microbiota of rat colonic content.
| EC No. | KEGG orthology | Reaction | Predicted functional gene |
||
|---|---|---|---|---|---|
| Enzyme | Abundance (%) | Specimen | |||
| EC:3.5.3.6 | K01478 | Arginine + H2O → Citrulline + NH3 | ADI | 2.94 | (3/3) |
| EC:2.1.3.3 | K00611 | Citrulline + Phospate → Orn + Carbamoyl-P | OTC | 2.64 | (3/3) |
| EC:4.1.1.17 | K01581 | Ornithine → Putrescine + CO2 | ODC | 0.81 | (3/3) |
| EC:4.1.1.19 | K01584 | Arginine → Agmatine + CO2 | ADC | 0.97 | (3/3) |
| EC:3.5.3.11 | K01480 | Agmatine + H2O → Putrescine + Urea | AUH | 0.44 | (3/3) |
| EC:3.5.3.12 | K10536 | Agmatine + H2O → N-carbamoyl-putrescine + NH3 | AgDI | 0.82 | (3/3) |
| EC:2.1.3.6 | K13252 | N-carbamoyl-putrescine + Phospate → Putrescine + Carbamoyl-P | PTC | 0.62 | (3/3) |
| EC:3.5.1.53 | K12251 | N-carbamoyl-putrescine + H2O → Putrescine + CO2 + NH3 | NCP | 0.20 | (3/3) |
| EC:4.1.1.50 | K01611 | S-adenosylmethionine → S-adenosylmethioninamine + CO2 | AdoMetDC | 7.14 | (3/3) |
| EC:2.5.1.16 | K00797 | S-adenosylmethioninamine + Putrescine → 5ʹ-methylthioadenosine + Spermidine | SPDS | 0.45 | (3/3) |
| EC:1.5.1.43 | K13746 | Putrescine + Aspartate β-semialdehyde → Carboxyspermidine | CASDS | n.d. | (0/3) |
| EC:4.1.1.96 | K13747 | Carboxyspermidine → Spermidine+ CO2 | CASDC | 0.16 | (3/3) |
The functional genes which were predicted to be present in microbiome of colonic contents by Piphillin. Abundance (%), which was calculated as the ratio of OTUs predicted to have the gene to all OTUs. Values in parentheses represent the number of specimens in which the genes were detected/the number of specimens examined. ADI, arginine deiminase; OTC, ornithine carbamoyltransferase; ODC, ornithine decarboxylase; ADC, arginine decarboxylase; AUH, agmatin ureohydrolase; AgDI, agmatine deiminase; PTC, putrescine carbamoyltransferase; NCP, N-carbamoyl putrescine amidase; AdoMetDC, S-adenosylmethioninedecarboxylase; SPDS, spermidine synthase; CASDS, carboxyspermidine synthase; CASDC, carboxyspermidine decarboxylase.
Discussion
Various substances in the intestinal lumen are produced as a result of the collective metabolic functions of the intestinal microbiome. For example, aspartic acid and serine produced by intestinal Bifidobacterium longum are metabolised by E. coli O157 to succinic acid and acetic acid,31 respectively, and lactic acid produced by Streptococcus faecalis (currently reclassified as Enterococcus) was found to be metabolised to butyric acid by Clostridium butyricum.32 Although these observations represent valuable contributions to the field, investigation of the metabolism in individual species is insufficient to explain the metabolism of the intestinal microbiome as a whole. In contrast, a previous experiment, in which intestinal bacteria in an in vitro model generated lactate, acetate, butyrate, formate, ethanol, and glycerol from isotope-labelled glucose, was sufficient to explain carbohydrate metabolism at the community level.33 Taken together, these studies demonstrate the existence of collective metabolic pathways consisting of multiple pathways from different bacteria. We assume that most bacterial products in the intestinal lumen, which have physiological functions in the host, are produced via collective metabolic pathways at the community level, and not by a single species. Here, we demonstrated that intestinal luminal putrescine is produced by such a collective metabolic pathway. To the best of our knowledge, the present work is the first to use a stable isotope-labelled amino acid to trace metabolites produced by the intestinal microbiome as a community in vitro and in vivo. This approach demonstrated that the intestinal microbiome generates putrescine from arginine, in both faecal cultures and rat intestines injected with isotope-labelled arginine. In addition, several intermediate metabolites other than putrescine were labelled in the rat intestine, suggesting that putrescine is generated not via a single pathway, but rather via multiple parallel and simultaneous pathways. In particular, ornithine and citrulline, which were rapidly converted from arginine in faecal cultures and labelled in rat intestines, are key intermediates in multiple parallel and simultaneous pathways. Indeed, arginine was converted to ornithine and citrulline, and the total concentration of these intermediates was approximately equal to the concentration of supplemental arginine. Further, the rate of putrescine production was proportional to that of the disappearance of the intermediates citrulline and ornithine in the faecal cultures. Importantly, analysis of metabolic pools in the colonic lumen also suggests that these intermediates are released by intestinal bacteria to the extracellular space, or are generated by extracellular enzymes. Furthermore, in faecal culture supplemented with intermediates, putrescine production was increased compared to that in the control, suggesting that the extracellular intermediate was used to produce putrescine.
The main pathways by which ornithine is produced from arginine are the arginase or arginine deiminase pathways. The arginine deiminase pathway, which is the most widespread anaerobic route for arginine degradation, is common in intestinal commensal bacteria such as Clostridium, Enterococcus, Lactococcus, Streptococcus, and Lactobacillus.34–38 These genera were detected in the rat colonic lumen in this study, except for Lactococcus. In this pathway, arginine is initially hydrolysed to citrulline and NH3. Thereafter, citrulline is reacted with phosphate and converted to ornithine and carbamoyl-phosphate. Subsequently, carbamoyl-phosphate is catalysed to NH3 and CO2 to generate ATP, whereas ornithine is released (Fig. 3a). Thus, the complete functional pathway requires not only arginine deiminase, but also ornithine carbamoyltransferase and carbamate kinase.39 As this pathway is typically activated by depletion of an energy source,40 it seems only natural that the pathway is active in the colonic lumen, an energy-deficient environment. Furthermore, several studies have reported that NH3 production via this pathway confers resistance to acid stress.41,42 Indeed, a study in Lactobacillus sakei indicated that the pathway is sensitive to pH, i.e. that arginine depletion triggers conversion of citrulline to ornithine, between pH 5.0 and 6.0,42 and a study in Lactobacillus fermentum indicated that the main product of the pathway is ornithine in low-pH conditions.43 Accordingly, we observed a higher ratio of ornithine to citrulline at 4 h and 6 h, at which point faecal cultures had a lower pH. Taken together, these observations suggest that intestinal bacteria take up arginine and release ornithine via this pathway to acquire ATP, which confers resistance to acid stress and thereby maintains viability.
The released ornithine may then be used by other bacteria to produce putrescine. Indeed, putrescine levels gradually increased until 2 h, and after 4 h accumulated along with decreased ornithine levels in faecal cultures. This phenomenon suggests that ornithine was metabolised to putrescine by ornithine decarboxylase.
Alternatively, putrescine may be synthesised via agmatine, which is generated from arginine by arginine decarboxylase. In fact, the dominant species that colonise the human intestine have arginine decarboxylase,29 which catalyses the conversion of arginine to agmatine and CO2. Subsequently, agmatine may then be converted directly into putrescine and urea by agmatine ureohydrolase, or indirectly to N-carbamoylputrescine, through agmatine deiminase and subsequently into putrescine by putrescine carbamoyltransferase or n-carbamoyl putrescine amidase. We found that species that take up extracellular agmatine and subsequently release putrescine must also be present in the intestinal microbiome, as putrescine was significantly increased in faecal cultures supplemented with agmatine. In contrast, agmatine did not accumulate in faecal cultures supplemented with arginine. Additionally, isotope-labelled agmatine was detected in colonic contents from only one of three rats treated with isotope-labelled arginine, suggesting that agmatine in the extracellular space was rapidly utilised or released only in small amounts.
Putrescine was also significantly increased in faecal cultures supplemented with citrulline. To the best of our knowledge, no published reports have indicated that putrescine is produced from citrulline directly, with the exception of a somewhat dated report suggesting that E. coli decarboxylates citrulline to carbamoyl-putrescine.44 Thus, it is likely that putrescine is not produced from citrulline directly, but rather indirectly via ornithine.
Spermidine was also detected in colonic contents, suggesting that putrescine can be used to produce spermidine. It has been proposed that spermidine is synthesised by spermidine synthase or via carboxy-spermidine. Predictive functional gene profiling based on 16S rRNA gene sequencing data could predict the presence of AdoMetDC, SPDS, and CASDC, but not CASDS. Therefore, it appears that the pathway via spermidine synthase is the primary pathway in the rat intestinal microbiome. The reason why CASDS could not be detected might be that the number of bacteria having CASDS was relatively small; this point should be considered in a future study. Interestingly, isotope-labelled spermidine was detected only in the colonic contents, and not in faecal cultures. Hence, it is possible that spermidine is not released in faecal cultures, or rapidly utilised. Further investigations are required to clarify this point.
Notably, arginine (M + 9 and + 7), citrulline (M + 7), ornithine (M + 5, + 6, and + 7), and putrescine (M + 5) were detected in rats, even though these metabolites are not produced by the forward linear pathways of arginine deiminase, ornithine decarboxylase, or arginine decarboxylase. This result suggests that arginine (M + 9 and + 7) was produced from citrulline (M + 9 and + 7) via the reverse pathway; for example, by argininosuccinate synthetase and argininosuccinate lyase. The data also indicate that citrulline (M + 7) was produced from ornithine (M + 7) by ornithine carbamoyltransferase, a bidirectional enzyme, suggesting that reverse metabolic pathways are also driven by exchange of metabolites between species. In contrast, putrescine (M + 5) may be produced from ornithine (M + 5 or + 6), which may, in turn, be produced by replacement of labelled amino groups with non-labelled amino groups via enzymes such as ornithine aminotransferase. This phenomenon provides insight into the level of complexity in collective biosynthetic pathways at the community level.
Conclusions
The results demonstrate that, in the colonic lumen, putrescine is produced from arginine via several extracellular intermediates and a collective biosynthetic pathway, consisting of multiple pathways catalysed by enzymes derived from multiple bacterial species. Additionally, we demonstrated that this collective biosynthetic pathway depends on a complex exchange of metabolites released into the colonic lumen.
Our findings provide the knowledge to manipulate levels of intestinal microbial products that may modulate host health, including the level of polyamines, which we investigated as a representative case.
Methods
Animals
Male Crl:CD (SD) rats (eight weeks of age) were purchased from Charles River Laboratories Japan, Inc. (Kanagawa, Japan). Animals were housed individually in 263 × 420 × 20 mm plastic cages (Clea Japan, Inc., Tokyo, Japan) under a 12 h light/dark cycle at 25 ± 1°C in conventional conditions, and provided standard pellet chow and water ad libitum. Faeces were collected for microbiological culture. For collection of colonic contents, eight-week-old male SD rats fitted with proximal colon catheters were purchased from Charles River Laboratories Japan, Inc., acclimated for one week in the animal facility, and maintained in the same conditions as described above. This study was conducted in accordance with protocols approved by the Kyodo Milk Animal Use Committee (Permit Number: 2012–02).
Isotope-labelled arginine
L-Arg-13C6,15N4 1・HCl with atomic purity > 98% was purchased from Sigma-Aldrich (St. Louis, MO, USA), solubilised in saline, and neutralised to pH 7.0.
Faecal cultures in the presence of arginine or isotope-labelled arginine
Fresh faecal samples from rats were diluted 5-fold with Dulbecco’s phosphate-buffered saline (D-PBS) containing 1 mM arginine or isotope-labelled arginine, and cultured anaerobically at 37°C. Samples of the aqueous fraction were collected at 0, 1, 2, 4, 6, and 12 h, and centrifuged for 5 min at 10,000 × g and 4°C; under these conditions, bacterial cell walls remained intact. The resulting supernatant from faecal cultures with arginine was collected and analysed by UPLC to determine the concentration of polyamines and biosynthetic intermediates. The resulting supernatant from faecal cultures with isotope-labelled arginine was analysed by GC-MS to determine the concentration of polyamines, as well as the amount of isotope incorporated in polyamines.
Gc-ms
The supernatant of faecal cultures grown with isotope-labelled arginine was mixed with an equal volume of 20% trichloroacetic acid, and incubated on ice for 20 min to precipitate proteins. The sample was then clarified by centrifugation for 10 min at 15,000 × g and 4 °C, and 500 µL of the resulting supernatant was supplemented with 10 µL of 0.01% 1,6-diaminohexane as an internal standard. Subsequently, the mixture was extracted by vortexing for 1 min in 2 mL of diethyl ether. The emulsion was then fractionated by centrifugation at 15,000 × g for 5 min at 4°C, and the ether layer containing lipids, carbohydrates, and other potential contaminants was discarded. The aqueous layer was extracted in the same manner one additional time, derivatised using ethylchloroformate and trifluoroacetic acid anhydride, and analysed by GC-MS (GCMS-QP2010, Shimadzu Co., Kyoto, Japan), as previously described.45 Fragment ions were monitored in selected ion monitoring mode, and ions with m/z + 355, + 480, and + 609 were used as basis fragments for putrescine, spermidine, and spermine, respectively. Extraction and derivatisation rates were standardised using 1,6-diaminohexane, and metabolites were quantified using the corresponding external calibration curves.
Uplc
The supernatant from faecal cultures was heated in a boiling water bath for 2 min to precipitate proteins, which were then removed by centrifugation at 15,000 × g for 10 min at 4°C. The resulting supernatant was derivatised with 6-aminoquinolyl-N-hydroxysuccinimidyl carbamate (Synchem UG & Co., KG Altenburg, Germany). Putrescine, spermidine, spermine, arginine, ornithine, citrulline, and agmatine were identified and quantified on an ACQUITY UPLC system coupled to a fluorescence spectrophotometer (Waters Co., Ltd., Milford, USA). Chromatographic phases and parameters were used as described previously,46 with some key modifications. In particular, samples were eluted at 0.4 mL/min and in mobile phases consisting of 140 mM sodium acetate and 5.6 mM triethylamine, pH 4.62, in 50% phosphoric acid (solvent A) and 100% acetonitrile (solvent B). Samples (4 μL) were applied onto a 1.7-μm BEH C18 reversed-phase column (Waters) and eluted at 65°C along a linear gradient from 4% to 8% B until 4 min, from 8% to 35% B until 13.5 min, from 35% to 60% B until 13.75 min, and at 60% B until 14.5 min. Elution was monitored at an excitation wavelength of 250 nm and emission wavelength of 395 nm.
Detection of isotope-labelled metabolites in colonic contents
L-Arg-13C6,15N4 · 1 HCl in saline pH 7.0 was injected into rats (n = 3) via a colon catheter at 6.6 mg/kg body weight. Rats were euthanised 6 h post-injection, and the contents of the colon were collected, diluted 5-fold with D-PBS, and extracted three times by vigorous mixing for 1 min, followed by a 5-min incubation on ice. Samples were centrifuged as described at 10,000 × g for 5 min at 4°C, and the upper aqueous layer was collected along with pelleted cells. The pellet was used for DNA extraction. Next, 200 μL of the supernatant was filtered at 9,100 × g and 4°C through an Ultrafree-MC centrifugal filter with molecular weight cut-off 5 kDa (Millipore Co., Ltd., Burlington, MA, USA) to remove proteins. The filtrate was stored at −80°C until analysis by CE-TOF MS at Human Metabolome Technology Inc., Tsuruoka, Japan, as described previously.27
Composition of intestinal bacteria and predictive functional gene profiling
Cells collected as described were washed twice in 1 mL of D-PBS, and bacterial DNA was isolated using a modified version of previously described methods.47 The V1-V2 region of 16S rRNA was amplified using previously described primers48 (Table S4). Targets were amplified on a gradient thermocycler using 22.5 μL of Platinum PCR SuperMix (Thermo Fisher Scientific, Inc., Waltham, MA, USA), 0.25 μL of each primer (10 μM), and 2 μL of DNA template diluted 10 fold. Reactions consisted of initial denaturation at 94°C for 3 min, followed by 25 cycles of denaturation at 94°C for 30 s, annealing at 53°C for 30 s, and extension at 68°C for 30 s. PCR products were purified by PureLinK Quick PCR Purification Kit (Thermo Fisher Scientific), and quantified on a BioAnalyzer (Agilent Technologies, Inc., Santa Clara, CA, USA). Samples were pooled at approximately equal concentrations, and fragments with a size of approximately 400 bp were purified using the FastGene Gel/PCR Extraction Kit (Nippon Genetics Co., Ltd., Tokyo, Japan) and quantified on a BioAnalyzer. Amplicons were processed by emulsion PCR using the Ion OneTouch 400 Template Kit (Thermo Fisher Scientific) and OneTouch ES instrumenta (Thermo Fisher Scientific), in accordance with the manufacturer’s protocol. Pooled libraries were sequenced on an Ion PGM system (Thermo Fisher Scientific) and a 318 chip. Sequence data were obtained in fastq format and analysed using Qiime software.49 Raw sequences were sorted via barcode, and screened for quality (average quality score ≥ 20) and correctness of primer sequence. The trimmed sequences were clustered into OTUs at the level of 97% similarity using the uclust method50 and the farthest neighbour algorithm. The most abundant sequences in each OTU were selected as representative of the OTU. The representative sequences were aligned using the PyNAST algorithm.51 The aligned sequences were checked for potentially chimeric sequences using the ChimeraSlayer algorithm. Non-chimeric sequences were assigned taxonomy by RDP classifier with a confidence cutoff value of. 8052 Predictive functional gene profiling was based on 16S rRNA gene sequencing data using Piphillin (http://www.secondgenome.com/solutions/resources/data-analysis-tools/piphillin/) with a confidence cutoff value of 97.
Faecal culture with putrescine precursors
Fresh faecal samples were collected from rats (n = 7), diluted 5-fold in D-PBS supplemented with 1 mM ornithine, citrulline, or agmatine, and cultured anaerobically at 37°C. The aqueous fraction was collected at 6 h, cleared by centrifugation at 10,000 × g for 5 min at 4°C, and analysed by UPLC as described.
Statistical analysis
Data were analysed using IBM SPSS Statistics for Windows version 22 (IBM Corp., Amonk, NY, USA), and results were considered statistically significant at p < 0.05.
Competing interests
The authors declare that they have no competing financial interests.
Acknowledgments
We are grateful for the generous support provided by Dr. Yumi Shimomura (Kyodo Milk Industry Co., Ltd.) and Mr. Yusuke Kitada (Kyodo Milk Industry Co., Ltd.) for the 16S rRNA gene sequence analysis. We thank Dr. Ayano Yamasita (Kyodo Milk Industry Co., Ltd.) for assistance with the animal experiments.
Author contributions
A. Nakamura designed and performed experiments, analysed data, and drafted the manuscript. T. Ooga performed CE-TOF MS experiments and analysed CE-TOF MS data. M. Matsumoto designed the study and assisted in the drafting the manuscript.
Supplemental data
Supplemental data for this article can be accessed here.
References
- 1.Gibson GR, Roberfroid MB.. Dietary modulation of the human colonic microbiota: introducing the concept of prebiotics. J Nutr. 1995;125:1401–1412. [DOI] [PubMed] [Google Scholar]
- 2.Martens JH, Barg H, Warren MJ, Jahn D. Microbial production of vitamin B12. Appl Microbiol Biotechnol. 2002;58:275–285. [DOI] [PubMed] [Google Scholar]
- 3.Morowitz MJ, Carlisle EM, Alverdy JC. Contributions of intestinal bacteria to nutrition and metabolism in the critically ill. Surg Clin North Am. 2011;91:771–85,viii. [DOI] [PMC free article] [PubMed] [Google Scholar]
- 4.Lee WJ, Hase K. Gut microbiota-generated metabolites in animal health and disease. Nat Chem Biol. 2014;10:416–424. [DOI] [PubMed] [Google Scholar]
- 5.Wang Z, Klipfell E, Bennett BJ, Koeth R, Levison BS, Dugar B, Feldstein AE, Britt EB, Fu X, Chung YM, et al Gut flora metabolism of phosphatidylcholine promotes cardiovascular disease. Nature. 2011;472:57–63. [DOI] [PMC free article] [PubMed] [Google Scholar]
- 6.Louis P, Hold GL, Flint HJ. The gut microbiota, bacterial metabolites and colorectal cancer. Nat Rev Microbiol. 2014;12:661–672. [DOI] [PubMed] [Google Scholar]
- 7.Furusawa Y, Obata Y, Fukuda S, Endo TA, Nakato G, Takahashi D, Nakanishi Y, Uetake C, Kato K, Kato T, et al Commensal microbe-derived butyrate induces the differentiation of colonic regulatory T cells. Nature. 2013;504:446–450. [DOI] [PubMed] [Google Scholar]
- 8.Kimura I, Ozawa K, Inoue D, Imamura T, Kimura K, Maeda T, Terasawa K, Kashihara D, Hirano K, Tani T, et al The gut microbiota suppresses insulin-mediated fat accumulation via the short-chain fatty acid receptor GPR43. Nat Commun. 2013;4:1829. [DOI] [PMC free article] [PubMed] [Google Scholar]
- 9.Hsiao EY, McBride SW, Hsien S, Sharon G, Hyde ER, McCue T, Codelli JA, Chow J, Reisman SE, Petrosino JF, et al Microbiota modulate behavioral and physiological abnormalities associated with neurodevelopmental disorders. Cell. 2013;155:1451–1463. [DOI] [PMC free article] [PubMed] [Google Scholar]
- 10.Yoshimoto S, Loo TM, Atarashi K, Kanda H, Sato S, Oyadomari S, Iwakura Y, Oshima K, Morita H, Hattori M, et al Obesity-induced gut microbial metabolite promotes liver cancer through senescence secretome. Nature. 2013;499:97–101. [DOI] [PubMed] [Google Scholar]
- 11.Microbiology: BL. The new germ theory. Nature. 2010;468:492–495. [DOI] [PubMed] [Google Scholar]
- 12.Kurokawa K, Itoh T, Kuwahara T, Oshima K, Toh H, Toyoda A, Takami H, Morita H, Sharma VK, Srivastava TP, et al Comparative metagenomics revealed commonly enriched gene sets in human gut microbiomes. DNA Res. 2007;14:169–181. [DOI] [PMC free article] [PubMed] [Google Scholar]
- 13.Pegg AE. Mammalian polyamine metabolism and function. IUBMB Life. 2009;61:880–894. [DOI] [PMC free article] [PubMed] [Google Scholar]
- 14.Zhang M, Caragine T, Wang H, Cohen PS, Botchkina G, Soda K, Bianchi M, Ulrich P, Cerami A, Sherry B, et al Spermine inhibits proinflammatory cytokine synthesis in human mononuclear cells: a counterregulatory mechanism that restrains the immune response. J Exp Med. 1997;185:1759–1768. [DOI] [PMC free article] [PubMed] [Google Scholar]
- 15.Pillai SP, Shankel DM. Effects of antimutagens on development of drug/antibiotic resistance in microorganisms. Mutat Res. 1998;402:139–150. [DOI] [PubMed] [Google Scholar]
- 16.Matsumoto M, Benno Y. Consumption of Bifidobacterium lactis LKM512 yogurt reduces gut mutagenicity by increasing gut polyamine contents in healthy adult subjects. Mutat Res. 2004;568:147–153. [DOI] [PubMed] [Google Scholar]
- 17.Soda K, Kano Y, Chiba F, Koizumi K, Miyaki Y. Increased polyamine intake inhibits age-associated alteration in global DNA methylation and 1,2-dimethylhydrazine-induced tumorigenesis. PLoS One. 2013;8:e64357. [DOI] [PMC free article] [PubMed] [Google Scholar]
- 18.Guo X, Rao JN, Liu L, Zou T, Keledjian KM, Boneva D, Marasa BS, Wang JY. Polyamines are necessary for synthesis and stability of occludin protein in intestinal epithelial cells. Am J Physiol Gastrointest Liver Physiol. 2005;288:G1159–69. [DOI] [PubMed] [Google Scholar]
- 19.Liu L, Guo X, Rao JN, Zou T, Xiao L, Yu T, Timmons JA, Turner DJ, Wang JY. Polyamines regulate E-cadherin transcription through c-Myc modulating intestinal epithelial barrier function. Am J Physiol Cell Physiol. 2009;296:C801–10. [DOI] [PMC free article] [PubMed] [Google Scholar]
- 20.Li L, Rao JN, Bass BL, Wang JY. NF-kappaB activation and susceptibility to apoptosis after polyamine depletion in intestinal epithelial cells. Am J Physiol Gastrointest Liver Physiol. 2001;280:G992–G1004. [DOI] [PubMed] [Google Scholar]
- 21.Liu L, Guo X, Rao JN, Zou T, Marasa BS, Chen J, Greenspon J, Casero RA Jr., Wang JY. Polyamine-modulated c-Myc expression in normal intestinal epithelial cells regulates p21Cip1 transcription through a proximal promoter region. Biochem J. 2006;398:257–267. [DOI] [PMC free article] [PubMed] [Google Scholar]
- 22.Eisenberg T, Knauer H, Schauer A, Buttner S, Ruckenstuhl C, Carmona-Gutierrez D, Ring J, Schroeder S, Magnes C, Antonacci L, et al Induction of autophagy by spermidine promotes longevity. Nat Cell Biol. 2009;11:1305–1314. [DOI] [PubMed] [Google Scholar]
- 23.Nishimura K, Shiina R, Kashiwagi K, Igarashi K. Decrease in polyamines with aging and their ingestion from food and drink. J Biochem. 2006;139:81–90. [DOI] [PubMed] [Google Scholar]
- 24.Das R, Kanungo MS. Activity and modulation of ornithine decarboxylase and concentrations of polyamines in various tissues of rats as a function of age. Exp Gerontol. 1982;17:95–103. [DOI] [PubMed] [Google Scholar]
- 25.Matsumoto M, Benno Y. The relationship between microbiota and polyamine concentration in the human intestine: a pilot study. Microbiol Immunol. 2007;51:25–35. [DOI] [PubMed] [Google Scholar]
- 26.Uda K, Tsujikawa T, Fujiyama Y, Bamba T. Rapid absorption of luminal polyamines in a rat small intestine ex vivo model. J Gastroenterol Hepatol. 2003;18:554–559. [DOI] [PubMed] [Google Scholar]
- 27.Matsumoto M, Kibe R, Ooga T, Aiba Y, Kurihara S, Sawaki E, Koga Y, Benno Y. Impact of intestinal microbiota on intestinal luminal metabolome. Sci Rep. 2012;2:233. [DOI] [PMC free article] [PubMed] [Google Scholar]
- 28.Kibe R, Kurihara S, Sakai Y, Suzuki H, Ooga T, Sawaki E, Muramatsu K, Nakamura A, Yamashita A, Kitada Y, et al Upregulation of colonic luminal polyamines produced by intestinal microbiota delays senescence in mice. Sci Rep. 2014;4:4548. [DOI] [PMC free article] [PubMed] [Google Scholar]
- 29.Burrell M, Hanfrey CC, Murray EJ, Stanley-Wall NR, Michael AJ. Evolution and multiplicity of arginine decarboxylases in polyamine biosynthesis and essential role in Bacillus subtilis biofilm formation. J Biol Chem. 2010;285:39224–39238. [DOI] [PMC free article] [PubMed] [Google Scholar]
- 30.Iwai S, Weinmaier T, Schmidt BL, Albertson DG, Poloso NJ, Dabbagh K, DeSantis TZ. Piphillin: improved Prediction of Metagenomic Content by Direct Inference from Human Microbiomes. PLoS One. 2016;11:e0166104. [DOI] [PMC free article] [PubMed] [Google Scholar]
- 31.Nakanishi Y, Fukuda S, Chikayama E, Kimura Y, Ohno H, Kikuchi J. Dynamic omics approach identifies nutrition-mediated microbial interactions. J Proteome Res. 2011;10:824–836. [DOI] [PubMed] [Google Scholar]
- 32.Gea S. Inhibition of growth of some enteropathogenic strains in mixed cultures of Streptococcus faecalis and Clostridium butyricum. Microbios Lett. 1989;40:151-60. [Google Scholar]
- 33.De Graaf AA, Maathuis A, De Waard P, Deutz NE, Dijkema C, De Vos WM, Venema K. Profiling human gut bacterial metabolism and its kinetics using [U-13C]glucose and NMR. NMR Biomed. 2010;23:2–12. [DOI] [PubMed] [Google Scholar]
- 34.De Angelis M, Mariotti L, Rossi J, Servili M, Fox PF, Rollan G, Gobbetti M. Arginine catabolism by sourdough lactic acid bacteria: purification and characterization of the arginine deiminase pathway enzymes from Lactobacillus sanfranciscensis CB1. Appl Environ Microbiol. 2002;68:6193–6201. [DOI] [PMC free article] [PubMed] [Google Scholar]
- 35.Curran TM, Lieou J, Marquis RE. Arginine deiminase system and acid adaptation of oral streptococci. Appl Environ Microbiol. 1995;61:4494–4496. [DOI] [PMC free article] [PubMed] [Google Scholar]
- 36.Simon JP, Wargnies B, Stalon V. Control of enzyme synthesis in the arginine deiminase pathway of Streptococcus faecalis. J Bacteriol. 1982;150:1085–1090. [DOI] [PMC free article] [PubMed] [Google Scholar]
- 37.Ohtani K, Bando M, Swe T, Banu S, Oe M, Hayashi H, Shimizu T. Collagenase gene (colA) is located in the 3ʹ-flanking region of the perfringolysin O (pfoA) locus in Clostridium perfringens. FEMS Microbiol Lett. 1997;146:155–159. [DOI] [PubMed] [Google Scholar]
- 38.Chou L, Weimer BC, Cutler R. Relationship of arginine and lactose utilization by Lactococcus lactis ssp. Lactis ML3 International Dairy J. 2001;11:6. [Google Scholar]
- 39.Zuniga M, Perez G, Gonzalez-Candelas F. Evolution of arginine deiminase (ADI) pathway genes. Mol Phylogenet Evol. 2002;25:429–444. [DOI] [PubMed] [Google Scholar]
- 40.Stuart MR, Chou LS, Weimer BC. Influence of carbohydrate starvation and arginine on culturability and amino acid utilization of lactococcus lactis subsp. Lactis Appl Environ Microbiol. 1999;65:665–673. [DOI] [PMC free article] [PubMed] [Google Scholar]
- 41.Cotter PD, Hill C. Surviving the acid test: responses of gram-positive bacteria to low pH. Microbiol Mol Biol Rev. 2003;67: 429–453. table of contents. [DOI] [PMC free article] [PubMed] [Google Scholar]
- 42.Rimaux T, Riviere A, Illeghems K, Weckx S, De Vuyst L, Leroy F. Expression of the arginine deiminase pathway genes in Lactobacillus sakei is strain dependent and is affected by the environmental pH. Appl Environ Microbiol. 2012;78:4874–4883. [DOI] [PMC free article] [PubMed] [Google Scholar]
- 43.Vrancken G, Rimaux T, Weckx S, De Vuyst L, Leroy F. Environmental pH determines citrulline and ornithine release through the arginine deiminase pathway in Lactobacillus fermentum IMDO 130101. Int J Food Microbiol. 2009;135:216–222. [DOI] [PubMed] [Google Scholar]
- 44.Akamatsu N, Oguchi M, Yajima Y, Ohno M. Formation of N-carbamyl putrescine from citrulline in Escherichia coli. J Bacteriol. 1978;133:409–410. [DOI] [PMC free article] [PubMed] [Google Scholar]
- 45.Chen GG, Turecki G, Mamer OA. A quantitative GC-MS method for three major polyamines in postmortem brain cortex. J Mass Spectrom. 2009;44:1203–1210. [DOI] [PubMed] [Google Scholar]
- 46.Reguera RM, Balana-Fouce R, Showalter M, Hickerson S, Beverley SM. Leishmania major lacking arginase (ARG) are auxotrophic for polyamines but retain infectivity to susceptible BALB/c mice. Mol Biochem Parasitol. 2009;165:48–56. [DOI] [PMC free article] [PubMed] [Google Scholar]
- 47.Matsuki T, Watanabe K, Fujimoto J, Kado Y, Takada T, Matsumoto K, Quantitative TR. PCR with 16S rRNA-gene-targeted species-specific primers for analysis of human intestinal bifidobacteria. Appl Environ Microbiol. 2004;70:167–173. [DOI] [PMC free article] [PubMed] [Google Scholar]
- 48.Kim SW, Suda W, Kim S, Oshima K, Fukuda S, Ohno H, Morita H, Hattori M. Robustness of gut microbiota of healthy adults in response to probiotic intervention revealed by high-throughput pyrosequencing. DNA Res. 2013;20:241–253. [DOI] [PMC free article] [PubMed] [Google Scholar]
- 49.Caporaso JG, Kuczynski J, Stombaugh J, Bittinger K, Bushman FD, Costello EK, Fierer N, Pena AG, Goodrich JK, Gordon JI, et al QIIME allows analysis of high-throughput community sequencing data. Nat Methods. 2010;7:335–336. [DOI] [PMC free article] [PubMed] [Google Scholar]
- 50.Edgar RC. Search and clustering orders of magnitude faster than BLAST. Bioinformatics. 2010;26:2460–2461. [DOI] [PubMed] [Google Scholar]
- 51.Caporaso JG, Bittinger K, Bushman FD, DeSantis TZ, Andersen GL, Knight R. PyNAST: a flexible tool for aligning sequences to a template alignment. Bioinformatics. 2010;26:266–267. [DOI] [PMC free article] [PubMed] [Google Scholar]
- 52.Wang Q, Garrity GM, Tiedje JM, Cole JR. Naive Bayesian classifier for rapid assignment of rRNA sequences into the new bacterial taxonomy. Appl Environ Microbiol. 2007;73:5261–5267. [DOI] [PMC free article] [PubMed] [Google Scholar]
Associated Data
This section collects any data citations, data availability statements, or supplementary materials included in this article.