

ABSTRACT
We investigated the Lactobacillus plantarum bacteriocin plantaricin EF (PlnEF) system for its contributions to L. plantarum mediated benefits in a mouse model of diet-induced obesity. C57BL/6J mice on a high-fat diet (HFD) were administered a rifampicin resistant mutant of L. plantarum NCMIB8826 (NICMB8826-R) or an isogenic ΔplnEFI mutant strain, LM0419, every 48 h for nine weeks. Mice fed wild-type L. plantarum, but not LM0419, reduced their consumption of the HFD starting three weeks into the study and exhibited an overall 10% reduction in weight gain. The responses were independent of glucose homeostasis, as both NCMIB8826-R and LM0419 fed mice had improved oral glucose tolerance compared to sham controls. Although bacteriocins have antibacterial properties, the ileal, cecal, and fecal microbiota and cecocolic metabolomes were unchanged between mice fed either wild-type L. plantarum or the ΔplnEFI mutant. Instead, only mice fed NCMIB8826-R showed an increased production of ZO-1 in ileal tissues. To verify a potential role for the plantaricin EF system in supporting intestinal epithelial function, synthesized PlnEF peptides were applied to Caco-2 cell monolayers challenged with TNF-α and IFN-γ. The combination of PlnE and PlnF were required to prevent sustained cytokine-induced losses to Caco-2 cell para- and transcellular permeability and elevated IL-8 levels. In conclusion, this study shows that probiotic L. plantarum ameliorates the effects of obesogenic diets through a mechanism that involves the plantaricin EF system and likely includes L. plantarum – induced fortification of the intestinal epithelium.
KEYWORDS: Probiotics, lactobacillus, obesity, bacteriocins, high-fat, weight gain, intestinal barrier integrity, microbiome, metabolome
Introduction
Diets high in fats and simple sugars (HFD) can result in excessive weight gain, a risk factor for type 2 diabetes, cardiovascular diseases, and other disorders. Symptoms of impaired physiologic function caused by HFD are due in part to decreased gut barrier integrity observed in humans1 and animal models.2 Translocation of bacterial lipopolysaccharide (LPS) and other microbial products to sites distal from the gut (e.g. adipose tissues) leads to low-grade, systemic inflammation and endotoxemia.2–4 Therefore, strategies that target the intestinal epithelium have immense potential to improve pathologies associated with HFD, even without significant dietary restriction.
The ingestion of living bacteria such as strains of Lactobacillus and Bifidobacterium as probiotics is an emerging approach to prevent or attenuate the effects of obesity.5,6 Specific for this study, strains of Lactobacillus plantarum were found to reduce weight gain and liver and adipose tissue inflammation in obese humans7,8 and diet induced obese (DIO) mice.9,10 Unlike some other Lactobacillus species, L. plantarum is also associated with leanness.11 As recently shown for Akkermansia muciniphila,12 an important route through which intestinal bacteria can benefit human health is by inducing improvements to intestinal epithelial barrier integrity. This possibility has also been demonstrated in numerous studies on L. plantarum WCFS1 (a single colony isolate of strain NCIMB8826). Ingestion of L. plantarum WCFS1 resulted in significant increases in the production of tight junction proteins in the duodenum of healthy adults.13,14 The capacity of this strain to alter the intestinal epithelium was confirmed in healthy and Simian Immunodeficiency Virus (SIV)-infected rhesus macaques.15 Introduction of L. plantarum into the rhesus macaque ileum rapidly improved epithelial tight junctions and resulted in the reversal of the IL-1β induced gut epithelial damage caused by SIV. These findings indicate that probiotic L. plantarum might also prevent weight gain and related impairments by improving gut barrier integrity.
Plantaricin EF (PlnEF) is a well-characterized two-peptide bacteriocin that induces cell membrane disruption in bacteria.16 Like other bacteriocins, PlnEF is ribosomally-synthesized and potent in the picomolar to nanomolar range.17 Bacteriocins are distinguished from antibiotics by their small size (< 30 kDa) and narrow inhibitory spectra, typically against relatives from the same or highly-related species.18 The human gut microbiota has the genetic potential to produce thousands of bacteriocins,19,20 although Lactobacillus bacteriocins have been of particular interest for their capacity to modify the gut microbiota.21,22 For example, Lactobacillus salivarius bacteriocin biosynthetic capacity was shown to be required to prevent Listeria monocytogenes infection in mice23 and to modulate the gut microbiota in pigs24 and healthy24 and DIO mice.21
In silico genotype-phenotype matching previously indicated that PlnEF together with the cognate immunity protein (PlnI) and the extracellular transporter (PlnG) gave L. plantarum the capacity to alter cytokine synthesis by human peripheral blood mononuclear cells25 and dendritic cells.26 Compared to wild-type L. plantarum WCFS1, plantaricin deficient mutants induced the production of TNF-α and IL-10 as well as higher IL10/IL12 ratios,25,26 thereby indicating that PlnEF or PlnI might directly interact with the mucosal immune system. More recently, we observed that a PlnEFI-deficient mutant of L. plantarum NCIMB8826-R was ineffective at reducing markers of colonic inflammation associated with chemically-induced colitis in mice.27 plnEFI operon expression was also significantly increased in the gastrointestinal (GI) tracts of human subjects and mice as opposed to laboratory culture media,28,29 thereby providing more evidence of the potential relevance of that L. plantarum bacteriocin system in the mammalian intestinal ecosystem.
Because of the known associations of L. plantarum plantaricin with anti-inflammatory responses, we hypothesized that this bacteriocin system could counter the effects of obesogenic diets by either directly interacting with the intestinal epithelium and/or altering the gut microbiota. Herein, we investigated this by administering a rifampicin resistant mutant of L. plantarum NCIMB8826 (NCIMB8826-R) or a PlnEFI-deficient mutant of that strain to mice on a HFD. Weight gain and food intake were measured for nine weeks after which host intestinal and systemic responses as well as intestinal microbiota and metabolites were assessed. The PlnEF peptides were also evaluated for the capacity to support epithelial barrier integrity after direct application in cell culture.
Results
plnEFI is required for LP-induced reductions in weight gain of mice on a HFD
C57BL/J6 mice were administered 109 cells of L. plantarum NCIMB8826-R (LP) or a PlnEFI-deficient mutant LM0419 (MU) once every other day while being maintained on a HFD for nine weeks. Mice administered either L. plantarum strain contained significantly reduced concentrations of serum glucose levels over two hours after glucose administration compared with sham-fed HFD controls (HF) (P < 0.05, Fig. S1A, and Figure 1A), without affecting serum insulin levels (Fig. S1B). Mice fed strain LM0419 (HF-MU) had weights equivalent to controls for the duration of the study (Figure 1B-C). In contrast, mice fed wild-type LP (HF-LP) gained less total weight compared to the HF controls (P < 0.05, Figure 1B). The differences in the weights of mice given LP were observable at approximately seven weeks (47 days) (HF vs HF-LP, P < 0.05, Figure 1C) and amounted to a 10% reduction in weight gain. Starting at week three, those mice also had a lower daily food intake (Fig. S2), and significant reductions in cumulative food intake were found by the end of the study (P < 0.001, Figure 1D). The changes occurred independently from alterations in feed efficiency (weight gained/kcal consumed) (Fig. S3A) or fat pad weight (Fig. S3B-C).
Figure 1.
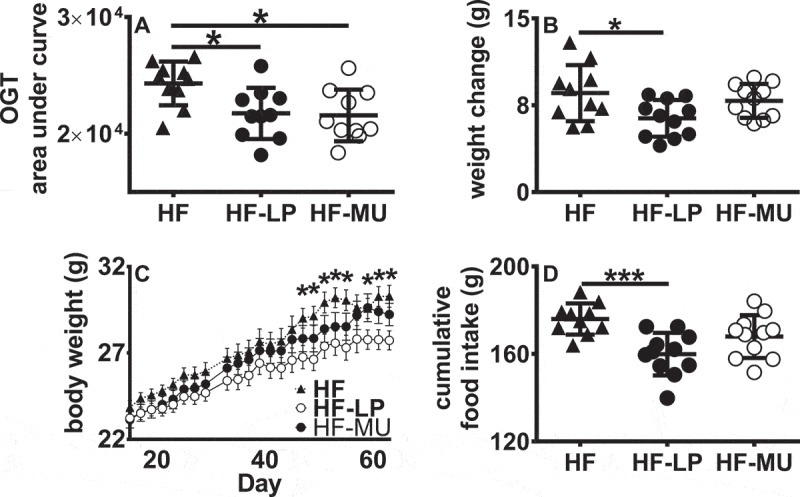
Supplementation with LP but not the MU strain reduced weight gain in DIO mice. A) Oral glucose tolerance was conducted during week nine. Data are presented as area under curve from plots of glucose concentrations in blood taken over 2 h after oral challenge. B) Difference in individual mouse weights at the beginning and end of the nine-week study. C) Mouse body weight over time. Asterisks denote significant differences in body weight between HF and HF-LP fed mice. D) Cumulative food intake over nine weeks. For A, B, and D a one-way ANOVA with Tukey’s multiple comparisons test was used, for C a repeated ANOVA was used. (*, P < 0.05; ***, P < 0.001).
LP and MU caused different systemic responses
There were numerous changes to the serum and liver metabolomes in response to LP and MU feeding (Table 1). Compared with the HF controls, alanine, isobutyrate, and urea levels were elevated in the serum of mice fed LP, whereas concentrations of other metabolites in the liver, including choline, glucose, and multiple amino acids, were significantly reduced in mice fed MU. Between mice fed either LP or MU, serum urea and liver alanine concentrations were significantly increased with LP feeding (Table 1). Conversely, MU resulted in increased quantities of serum leucine and liver acetone and reductions in liver tyrosine concentrations.
Table 1.
Extra-intestinal metabolites significantly changed between at least two groups.
| Metabolite | HFa | HF-LP | HF-MU | HF vs HF-LPb | HF vs HF-MU | HF-LP vs HF-MU | |
|---|---|---|---|---|---|---|---|
| Serum | |||||||
| Alanine | 484.8 ± 16.9 | 591.2 ± 24.4 | 546.9 ± 33.1 | 0.0281 | 0.2616 | 0.4793 | |
| Isobutyrate | 5.5 ± 1.1 | 10.8 ± 8.2 | 8.2 ± 1.1 | 0.0083 | 0.2489 | 0.2244 | |
| Leucine | 118.6 ± 4.6 | 117.9 ± 3.6 | 139.9 ± 7.7 | 0.9959 | 0.0457 | 0.0324 | |
| Urea | 2816.7 ± 110.8 | 3661 ± 167.7 | 3145 ± 124.9 | 0.0009 | 0.2555 | 0.0376 | |
| Liver | |||||||
| 3-hydroxybutyrate | 219.6 ± 16.2 | 144.8 ± 12.2 | 166.8 ± 17.8 | 0.0035 | 0.0386 | 0.5385 | |
| Acetone | 17.8 ± 0.7 | 18.3 ± 0.5 | 21.3 ± 0.4 | 0.7722 | 0.0002 | 0.0011 | |
| Alanine | 4101.4 ± 193.6 | 4586.3 ± 130.8 | 3968.1 ± 129.9 | 0.0878 | 0.8101 | 0.0201 | |
| Asparagine | 294.9 ± 10.9 | 276.5 ± 11.4 | 248.9 ± 12.8 | 0.5314 | 0.0256 | 0.2368 | |
| Choline | 444.7 ± 32.3 | 365.5 ± 26.6 | 323.9 ± 26.4 | 0.1471 | 0.0142 | 0.5576 | |
| Glucose | 69320.2 ± 1432 | 65858.8 ± 1301 | 63388.9 ± 1130.4 | 0.1648 | 0.0074 | 0.3704 | |
| Guanosine | 26.6 ± 1.5 | 22.2 ± 20 | 17.16 ± 1.0 | 0.1264 | 0.0004 | 0.0631 | |
| Isoleucine | 295.5 ± 13.1 | 286.5 ± 9.1 | 258.2 ± 7.7 | 0.8075 | 0.0345 | 0.1301 | |
| Lysine | 564.9 ± 25.8 | 540.3 ± 22.1 | 466.4 ± 18.3 | 0.7203 | 0.0097 | 0.0602 | |
| Phenylalanine | 263.6 ± 9.7 | 239.4 ± 9.1 | 216.5 ± 10.5 | 0.218 | 0.0054 | 0.2374 | |
| Tyrosine | 403 ± 10.3 | 387.7 ± 8.4 | 334.9 ± 9.9 | 0.5175 | 0.0001 | 0.0016 | |
| Uridine | 465.9 ± 12.3 | 396.3 ± 13.8 | 391.9 ± 9.0 | 0.0009 | 0.0003 | 0.9601 | |
| Valine | 550.7 ± 23.9 | 538.3 ± 15.9 | 480.2 ± 15.8 | 0.8897 | 0.0322 | 0.0884 | |
aAverage ± SEM. Concentrations are in nmol/ml (serum) or nmol/g (liver).
bOne-way ANOVA with Tukey’s multiple comparison test. P values < 0.05 are shown in bold.
In adipose tissue, LP resulted in a significant decrease in plasminogen activator inhibitor-1 (PAI-1) concentrations compared to the HF controls (P < 0.05, Figure 2A), while MU left PAI-I levels unchanged (HF vs MU P > 0.99.) There were also modest reductions of leptin in adipose tissue of mice given LP compared to MU or HF alone (P = 0.19, Figure 2B). Other inflammatory cytokines in adipose tissue (TNF-α, MCP-1, and IL-6, Fig. S4) and markers of metabolic dysfunction (adiponectin and resistin, data not shown) were unchanged between the mice.
Figure 2.
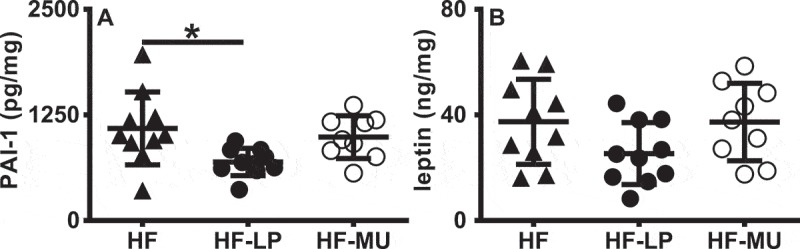
LP supplementation during HFD consumption decreases adipose associated inflammation. A) PAI-1 and B) leptin were measured by ELISA and data are presented relative to total protein concentrations. A) Statistics were calculated with the Kruskal-Wallis and Dunn’s multiple comparisons test or B) one-way ANOVA and Tukey’s multiple comparisons test (*, P < 0.05).
LP did not alter the gut microbiota composition of DIO mice
Diet-induced alterations to the gut microbiota were confirmed at six and nine weeks after the start of the HFD. Bacterial species richness (α-diversity) and community composition (β-diversity) in the feces were significantly changed compared to baseline when a chow diet was consumed (Figure 3A and Fig. S5A-B). Among the predominant taxa, Turicibacterales was significantly enriched with the HFD, whereas proportions of Bacteroidales were reduced (Fig. S5C). These changes occurred independently of L. plantarum consumption (Figure 3D and Fig. S5A-B).
Figure 3.
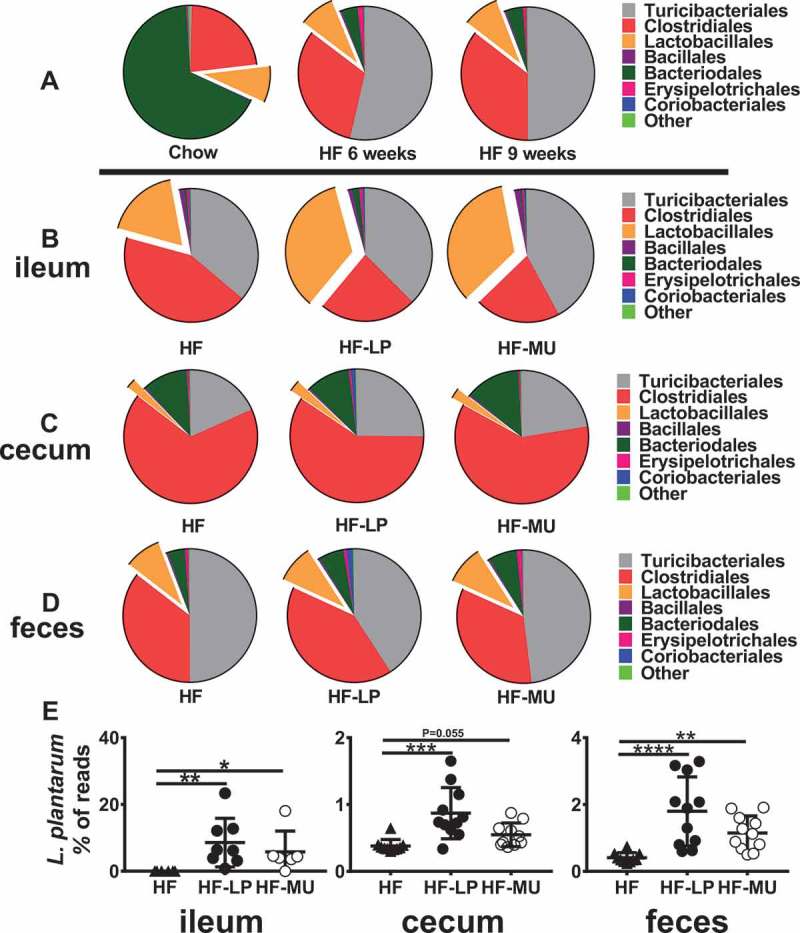
Consumption of a HFD alters the intestinal microbiota regardless of L. plantarum-feeding. 16S rRNA marker gene sequencing of A) fecal samples from all mice collected at the start of the study when the mice were on the chow diet and after six and nine weeks on the HFD. Bacterial composition of the B) ileum, C) cecum, and D) feces at week nine. E) Percentage of total reads assigned to L. plantarum in the ileum, cecum, and feces. The pie charts contain the average percentage of reads assigned at order level. Statistics were calculated with the Kruskal-Wallis and Dunn’s multiple comparisons test. (*, P < 0.05; **, P < 0.01; ***, P < 0.001; ****, P < 0.0001).
Administration of either WT or MU L. plantarum did not result in alterations to the intestinal microbiota compared to the HF controls in either the stools or intestine (Figure 3B-D and Fig. S6-8). To this regard, there were no significant differences between groups in OTU richness (data not shown), PD whole tree rarefaction curves, or β-diversity (Fig. S6-8).
Lactobacillus, and specifically, L. plantarum was the only taxon that was significantly altered in the ileum, cecum, and feces and was enriched in mice fed either LP or MU (Figure 3E). Other intestinal lactobacilli were unaffected (Fig. S9). Although the ileal microbiota of mice fed either LP or MU were enriched in Lactobacillales (17.8% ± 4.3 (HF), 34.7% ± 6.7 (LP), and 34.2% ± 7.6 (MU) of total reads), this increase was not significant (Fig. S6C). Lactobacillales comprised a smaller percentage of the microbiota in the cecum (Fig. S7C) and feces (Fig. S8C) and was also unchanged between feeding groups.
Viable cell enumerations of L. plantarum from feces were consistent with an enrichment of L. plantarum in both LP and MU fed mice, and no rifampicin-resistant lactobacilli were recovered from HF control mice (data not shown). There were no statistically significant differences in L. plantarum numbers between mice given LP and MU as quantified by 16S rRNA sequencing (Figure 3E) and L. plantarum enumeration by qPCR (Fig. S10).
LP feeding did not alter the intestinal metabolome
In agreement with the lack of interaction between the gut microbiota and PlnEFI biosynthetic capacity of L. plantarum, there were no significant changes in the cecal and colonic metabolites found in the LP and MU fed mice. PCoA of Bray-Curtis distances between cecal (Figure 4A) and fecal (Figure 4B) metabolomes of HF, LP and MU-fed mice did not reveal any significant clustering by feeding group. Instead, both LP and MU fed mice had reduced concentrations of cholate in the cecum (P < 0.05, Figure 4C) and threonine in the colon (P < 0.05, Figure 4D) compared to the HF controls.
Figure 4.
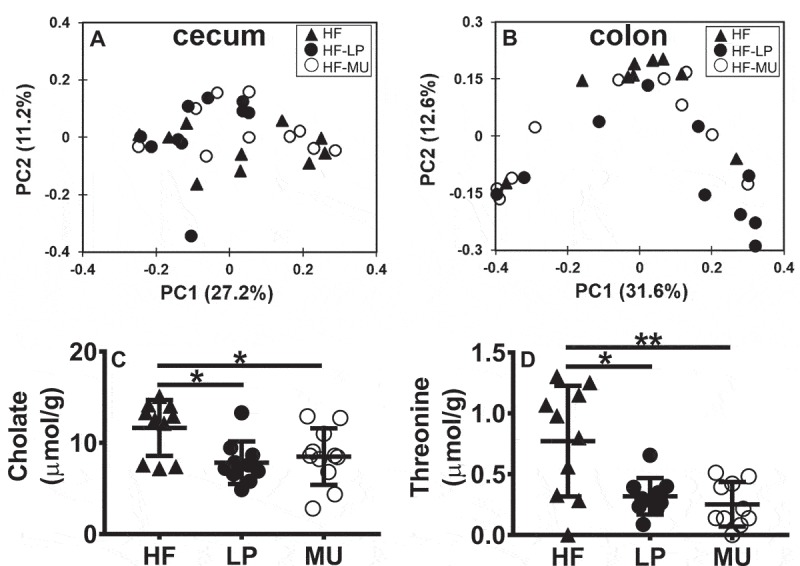
Lactobacillus-feeding does not alter global composition of cecal or colon metabolites. A) PCoA of Bray-Curtis distances between A) cecal and B) colon metabolomes. Concentrations of C) cholate and D) threonine in the cecum and colon, respectively. Statistics were calculated with one-way ANOVA with Tukey’s multiple comparisons test. (*, P < 0.05; **, P < 0.01).
Production of ileal tight junction protein ZO-1 is increased by feeding LP to mice on a HFD
To determine whether the L. plantarum plantaricin EF system modulates the intestinal epithelial tight junction system, thin sections of ileal tissue were immuno-fluorescently labeled for the tight junction protein Zonula Occludens-1 (ZO-1) and imaged with high-resolution Z-stack microscopy followed by surface fitting and object volume quantification. The quantity of ZO-1 protein was significantly increased in mice fed LP when compared to mice fed the MU strain (P < 0.05) or the HF controls (P < 0.05, Figure 5A, 5B, and Fig. S11). There was also an increase in transcript levels of ZO-1 mRNA in whole ileal tissues in response to LP-feeding, however this change was not significant (Figure 5C).
Figure 5.
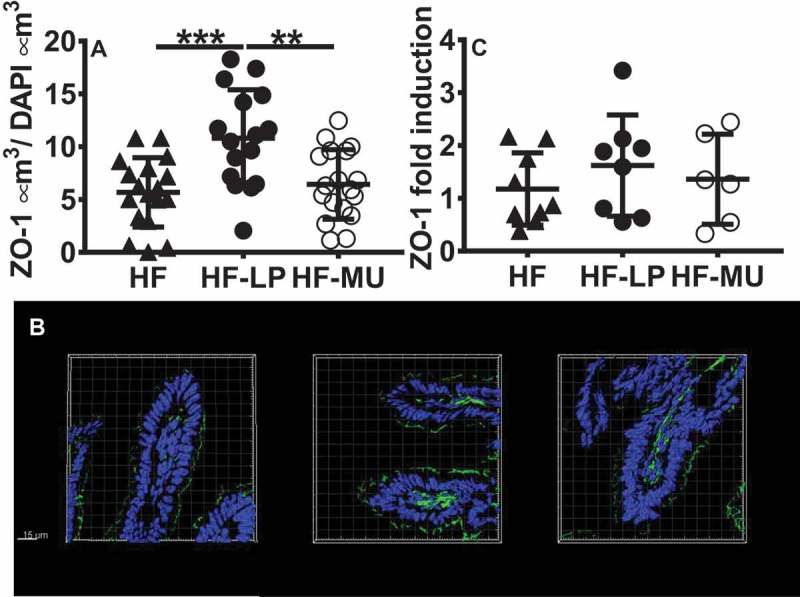
L. plantarum (LP) but not a plantaricin deficient mutant of L. plantarum (MU) significantly improves production of ZO-1 in ileum tissues of mice fed a HFD. A) ZO-1 was quantified in 3D space and data are presented relative to nuclei volume. Each point represents the average of ZO-1 and nuclei enumerated in two slides per mouse. HF n = 9, LP n = 8, MU n = 9. B) ZO-1 transcripts were quantified relative to HF control mice. qPCR was only performed on RNA with quality scores (RIN) above 7 and resulted in testing of HF n = 8, LP n = 8, MU n = 6 mice. C) Representative images of ileal tissue ZO-1 (green) and DAPI-stained nuclei (blue). Statistics were calculated with one-way ANOVA and Tukey’s multiple comparisons test (*, P < 0.05).
PlnEF peptides alleviate the effects of pro-inflammatory cytokines on epithelial barrier integrity in vitro
Polarized monolayers of the intestinal epithelial cell line Caco-2 were used to measure the effects of the PlnEF peptides more directly. Exposure of the apical surfaces of monolayers to PlnEF peptides prevented TNF-α and IFN-γ induced reductions in transepithelial resistance (Figure 6A) and reduced paracellular transport of FITC-dextran for up to 3 h post-cytokine stimulation (Figure 6B). Whereas the individual peptides, PlnE or PlnF, were capable of temporary alleviation of cytokine-induced barrier disruption at 24 h (Figure 6A and Fig. S12A), only combined PlnEF resulted in a sustained effect at 36 and 48 h post-cytokine stimulation. Furthermore, concentrations of the monocyte chemokine IL-8 were significantly reduced in basolateral supernatants from Caco-2 cells treated with PlnEF (P < 0.05, Figure 6C), but not PlnE (P = 0.45) or PlnF alone (P = 0.067). Notably, we did not detect significant changes in ZO-1 gene expression in the Caco-2 monolayers, even for the TNF-α and IFN-γ treated controls (data not shown). There was also no evidence of cytotoxic effects or depreciation of barrier integrity (as measured by FITC-dextran translocation and TER reduction) when the peptides were applied in the absence of TNF-α and IFN-γ. These results indicate that PlnEF can induce a protective state in colonic epithelial cells and that both peptides might be required for biological activity.
Figure 6.
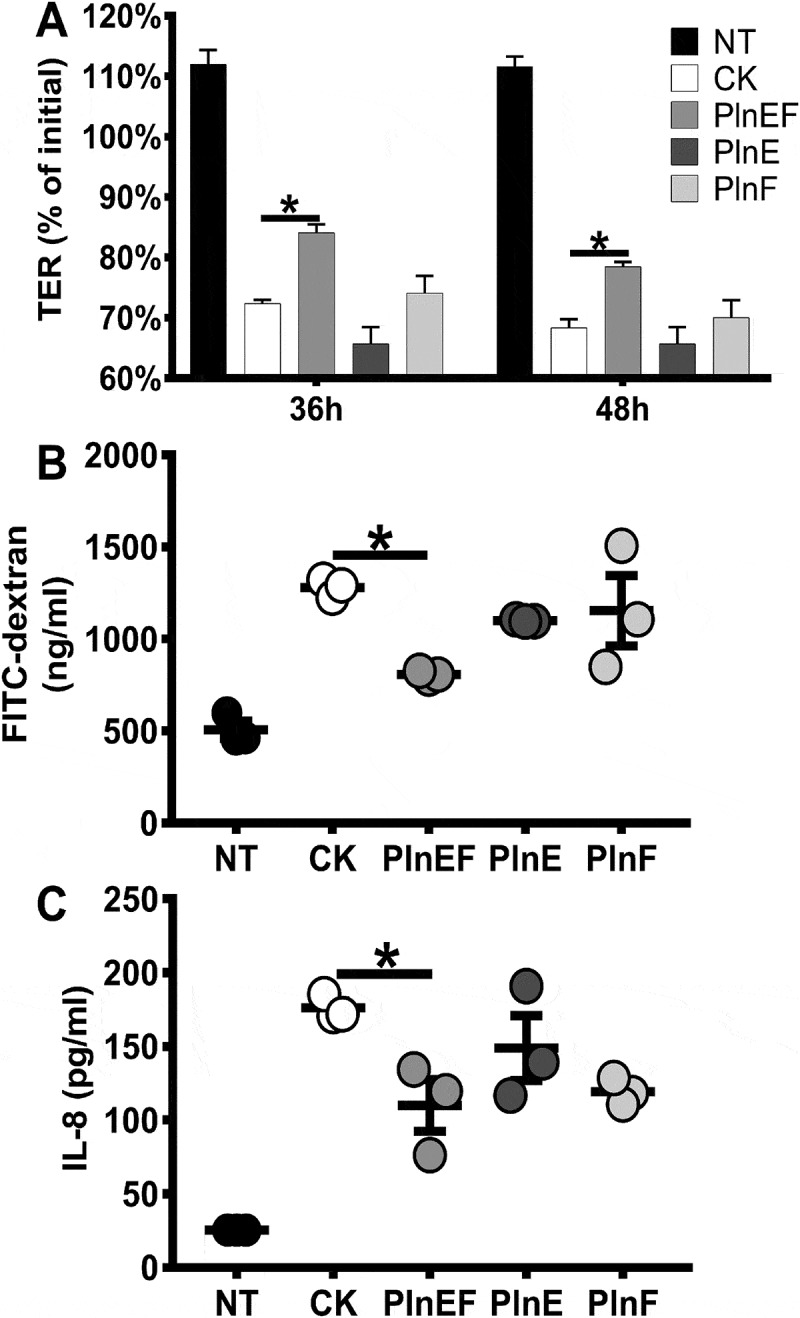
PlnEF alleviates the effects of pro-inflammatory cytokines on epithelial barrier integrity and IL-8 production in Caco-2 cells. Caco-2 monolayers were either untreated (black bars/circles) or basally stimulated with IFN-γ (100 ng/mL) for 24 h before stimulation with TNF-α (10 ng/mL) (open bars/circles). Plantaricin peptides were added or omitted before cytokine exposure. A) A decrease in TER was observed over 48 h after cytokine exposure. TER was significantly lower for all Caco-2 cells exposed to IFN-γ and TNF-α compared to the non-treated controls (P < 0.05, Kruskal-Wallis and Dunn's multiple comparison test). FITC-dextran (2 mg/mL) was added into the apical side of the Caco-2 monolayer 3 h post cytokine stimulation, and basolateral supernatants were measured for fluorescence after 1 h. FITC quantities were significantly higher for all treatments exposed to IFN-γ and TNF-α compared to non-treated controls (black circles) (P < 0.05). C) Basolateral concentrations of IL-8 were measured 2 h after cytokine stimulation. IL-8 quantities were significantly higher for all treatments exposed to IFN-γ and TNF-α compared to non-treated controls (black circles) (P < 0.01). For B and C, one-way ANOVA and Tukey’s multiple comparisons test was used. For all panels (*, P < 0.05) and n = 3 per treatment. The results of one representative experiment are shown. NT = not treated, CK = cytokine treated, PlnEF = 500 nM plantaricin EF, PlnE = 500 nM plantaricin E, PlnF = 500 nM plantaricin F.
Discussion
Probiotics are attractive for their potential to maintain and improve human health in numerous ways. However, relatively few effector compounds (e.g. proteins, metabolites, polysaccharides) required for altering host epithelial and immune response pathways have been identified. Herein, we provide evidence that the L. plantarum bacteriocin plantaricin EF system is a probiotic effector. Plantaricin biosynthetic capacity was necessary and sufficient for L. plantarum to induce reductions in weight gain and food intake among mice on a HFD. This occurred in the absence of measurable changes to intestinal microbiota and metabolome composition in response to either wildtype or mutant L. plantarum feeding. Instead, the plantaricin EF system potentially benefits DIO mice via a mechanism that results in fortifying tight junctions between intestinal epithelial cells. This is supported by our finding that the PlnEF peptides are sufficient to prevent cytokine-induced disruptions to epithelial barrier integrity in vitro. Although the effects of direct inflammatory insults caused by TNF-α and IFN-γ are not equivalent to barrier disruptions induced by high fat diets, the findings here indicate that the plantaricin system is a direct modulator of the intestinal epithelium.
The NCIMB8826-R strain caused reductions in food intake and cumulative reductions in weight gain in the nine week study. Production of PAI-1 in adipose tissue was also significantly diminished by LP feeding but not MU. Additionally, the liver and serum metabolomes were distinct between mice fed the LP and MU strains. The ΔplnEFI mutant resulted in significant decreases in the concentrations of numerous liver metabolites, including glucose as well as several amino acids and nucleotides, which were non-significantly altered by the wildtype NICMB8826-R strain. Only hepatic levels of 3-hydroxybutyrate, a metabolite linked with high-fat diet consumption and non-alcoholic fatty liver disease,30 were similarly reduced with the administration of either L. plantarum strain.
Other strains of L. plantarum were shown to reduce weight gain, adipose tissue deposits, systemic triglycerides, and improve oral glucose tolerance, and liver fatty acid oxidation in DIO mice.31–34 Although we found few significant changes in adipose tissue and systemic metabolic markers, LP was fed less frequently than in those studies and other factors such as diet formulation could account for these differences. Similarly, L. plantarum WCFS1 was found to be less effective than A. muciniphila in improving gut barrier function in DIO mice.35 However, in that study L. plantarum was only fed for four weeks and the diet contained a higher percentage of fat (60% kcal) than the 43% fat diet used here.
Unlike the Abp118 bacteriocin deficient mutant of L. salivarius in DIO mice,21 NCIMB8826-R resulted in persistent, rather than transient, reductions in weight gain; a finding which indicates that LP altered gut-brain axis signaling. This could have occurred via a mechanism by which plantaricin-producing L. plantarum increased the levels of satiety hormones PYY and GLP-1 made by intestinal enteroendocrine cells. Although intestinal PYY transcripts were elevated with wild-type NICMB8826-R feeding to DIO mice in an obesity treatment study,36 we did not detect changes in intestinal satiety hormone PYY or GLP-1 here.
Alternatively, others have shown that the intestinal barrier is rapidly permeabilized (within one week) when rodents are fed a high fat diet37 and subsequent contact between LPS and host intestinal cells culminates in desensitization of the vagal neurons to anorexigenic hormones such as cholecystokinin and leptin.38 The importance of plantaricin biosynthetic capacity for L. plantarum to alter the intestinal epithelium was demonstrated with the significantly higher levels of ZO-1 in the ileum following administration of wild-type L. plantarum NCIMB8826-R and not the ΔplnEFI mutant strain LM0419. L. plantarum was previously shown to increase ZO-1 protein quantities in the human duodenum14 and rhesus macaques.15 Moreover, ZO-1 transcript levels were elevated in the ileum of DIO mice fed wild-type strain NCIMB8826-R,36 however the L. plantarum protein or metabolite responsible for conferring these effects was not identified.
We thus envision that the satiety-inducing effects of the plantaricin EF system occurs through one of the following mechanisms: (i) direct interaction of the plantaricin system with the epithelium to result in increased fortification of tight junctions and eventual improvements in satiety sensing and reduced weight gain, (ii) increased satiety hormone signaling and eventual modification in intestinal tight junctions because of reduced food intake, or (iii) antibacterial activity against members of the gut microbiome and multiple resultant alterations in mucosal responses.
Contrary to the third hypothesis, the homogeneity of the intestinal microbiota and metabolomes between the LP and MU fed mice indicates that L. plantarum PlnEFI biosynthesis did not modify the intestinal microbiota. Even though PlnEF is effective at killing related Lactobacillus species in vitro,16 there was no change in the proportions of the other Lactobacillus genera in mice fed either L. plantarum strain. The only consistent difference between L. plantarum-fed (WT and MU) and HF control mice was an increase in Lactobacillus in the ileum, cecum, and feces. These bacteria were confirmed to be L. plantarum by multiple methods (16S rRNA marker gene sequencing, qPCR, and viable cell enumerations) and constituted approximately 7% and 1% of total bacteria present in the ileum and colon, respectively, when measured 48 h after ingestion.
While it is possible that the different L. plantarum strains resulted in some divergent changes to metabolic or other functional pathways expressed by the intestinal microbiota or exclusive interactions with a limited number of mucosally-associated bacteria, the lack of response in the cecal and colonic metabolomes between the WT and MU fed mice signifies otherwise. Out of > 60 metabolites measured, only cecal cholate and fecal threonine concentrations were altered compared to the HF controls. Cholate concentrations in the ceca of mice fed either WT or MU L. plantarum were significantly lower compared to the controls. Cholate is a primary bile acid, and because L. plantarum produces bile salt hydrolases,39 this finding could indicate that L. plantarum was directly altering bile acid metabolism in the intestine. Unfavorable bile acid metabolism has consistently been associated with increased insulin resistance in obese individuals.40 Hence, it is notable that both LP and MU resulted in improved oral glucose tolerance compared to the controls but did not result in changes to serum insulin levels. Additionally, fecal concentrations of threonine were reduced in mice fed either L. plantarum strain. Because we did not observe changes in the proportions of intestinal bacteria capable of threonine metabolism41 or metabolites potentially linked to threonine metabolism (propionate), the significance of this finding and systemic consequences on the host are not clear.
PlnEF-specific effects on human Caco-2 cell barrier functioning is consistent with a scenario whereupon the plantaricin system results in improved intestinal barrier function and such effects potentially precede increased satiety.42 The application of purified PlnEF peptides to Caco-2 cells exposed to pro-inflammatory cytokines prevented reductions in macromolecular permeability, transepithelial resistance, and reduced production of IL-8. Although another L. plantarum bacteriocin, PlnA, was previously shown to improve barrier function and cell viability when incubated with differentiated Caco-2 cells challenged with IFN-γ,43 a higher concentration of PlnA was applied than used here and the result was not confirmed in vivo. Similar to individual PlnE and PlnF peptides, in our in vitro model of intestinal inflammation, we noticed that PlnA prevented cytokine induced reductions in TER 24 h post-induction, but only combined PlnEF sustained this protective effect for an additional 24 h (Fig. S12A-B).
Taken together, there appears to be a broader role for Lactobacillus bacteriocin interactions with the intestinal epithelium. This is reinforced by the previous findings that a L. salivarius mutant unable to synthesize the bacteriocin Abp118 exhibited an improved barrier-protective outcome compared to the wild-type strain in a Caco-2 cell model.44 Nonetheless, further study is needed to identify the precise order of events and primary and secondary responses to L. plantarum consumption. This work should include identifying the signaling pathways activated by L. plantarum resulting in increased ZO-1 production, localization of the ZO-1 to the tight junctions in response to PlnEF, and quantifying effects of L. plantarum on other proteins in the tight junctions regulating intestinal barrier integrity.
Moreover, although it is possible that the PlnEF immunity protein plantaricin I (PlnI) also contributed to the differences between WT and MU L plantarum in vivo, the findings from the Caco-2 studies on PlnEF and the distinction that plantaricin E and plantaricin F are small, diffusible peptides rather than membrane bound as predicted for plantaricin I suggest that the differences between the ΔplnEFI and wild-type strain were due to the loss of PlnEF and not PlnI. To this regard, differentiating between individual PlnE, PlnF, and combined PlnEF and PlnI specific effects as well as providing the purified peptides to mice (in a protected format) require additional investigation.
Modulation of the gut microbiota is frequently regarded to be the primary mechanism of probiotic-mediated health benefits.45 Here, our investigation of L. plantarum PlnEF suggests that L. plantarum effects on the gut microbiome are very modest and instead L. plantarum modulates weight gain via direct impacts on the host intestinal epithelium. Bacterial cell components that have been evaluated to improve epithelial barrier function (in vitro or in vivo) are currently limited to an outer membrane protein produced in high abundance by A. muciniphila,12 extracellular peptidoglycan hydrolases p40 and p75 from L. rhamnosus GG,46 and L. brevis-secreted polyphosphate.47 Importantly, each of these molecules induce different mechanisms resulting in barrier function protection. This knowledge informs efforts to elucidate signaling pathways induced by PlnEF and supports the possibility of combining probiotic strains and/or effectors for improving the likelihood of mitigating pathologies caused by the habitual consumption of obesogenic diets.
Materials and methods
Bacterial strains and growth conditions
Isolation of the rifampicin resistant mutant L. plantarum NCIMB8826-R28 and construction of strain LM0419, a plnEFI deletion mutant of L. plantarum NCIMB8826-R27 were described previously. L. plantarum strains were routinely grown statically at 37 °C in MRS medium (BD, 288130). For selective enrichment of L. plantarum NCIMB8826-R and LM0419 from mouse stools, rifampicin (Thermo-Fisher, BP267925) was included in MRS agar at a concentration of 50 μg/mL.
Plantaricin peptides
Peptides plantaricin A (PlnA) (KSSAYSLQMGATAIKQVKKLFKKWGW), PlnE (FNRGGYNFGKSVRHVVDAIGSVAGIRGILKSIR), and PlnF (VFHAYSARGVRNNYKSAVGPADWVISAVRGFIHG) were chemically synthesized either by GenScript (PlnA and PlnE) or Thermo-Fisher (PlnF).
Mouse study design
A total of 30 C57BL6/J male mice at six weeks old were obtained from the Jackson Laboratory. Mice were housed and acclimated to the facility as previously described.36,48 Mice were divided into three groups to achieve equal weight distributions and then were given 20μl of either 2 × 10⁹ cells of L. plantarum NICMB8826-R (HF-LP) in PBS, 2 × 10⁹ cells of LM0419 (HF-MU) in PBS, or PBS (HF), orally, on alternate days, for nine weeks. During that time, the mice were fed a high-fat diet (HFD) (Harlan Laboratories) formulated to contain 43% kcal from fat (mainly lard) for the duration of nine weeks (Table S1).
Mouse weight and food intake were monitored every other day. Freshly expelled mouse stools were collected once a week (including before the HFD started) for plating and DNA sequencing. During the final week, mice were fasted for 14 h and tested for oral glucose tolerance (OGT). At the time of sacrifice, the mice were anesthetized under 2% isoflurane (VetOne, 501017) prior to blood collection. Termination was then ensured by cervical dislocation. Epididymal and mesenteric fat depots and ileal, cecal and colonic tissues and contents were collected, weighed and stored at −80 °C until analysis. Proximal ileal whole tissue sections were preserved in O.C.T. cryopreserving medium (Sakura Finetek, 25608–930) and stored at −80 °C.
Protein measurements in blood and adipose tissue
Blood and adipose tissue were processed as previously described.36,48 Metabolic markers insulin and leptin were measured in the sera using the Meso Scale Discovery platform (Rockville) according to the manufacturer’s instructions with a duplex Mouse metabolic kit (Meso Scale, K15124C-1).
Adipose tissue concentrations of adiponectin, IL-6, leptin, MCP-1, PAI-1, resistin and TNFα were quantified using a Mouse Adipocyte Magnetic Bead kit (Millipore-Sigma, MADKMAG-71K) on a Bio-plex Magpix multiplex reader (Bio-Rad), and data were analysed with the Bio-Plex Manager software version 6.1.
Gene expression analysis
Total RNA was isolated from ileal tissue using the phenol-chloroform extraction method.49 Purified RNA was confirmed for quality, DNAse treated and translated into cDNA as previously described.36,48 RNA samples with RNA integrity numbers (RIN) > 7 were used for further experiments. Real-time quantitative PCR (qPCR) was performed as previously described36,48 using primers listed in Table S2. Data were analysed using the 2−ΔΔCt method corrected for primer efficiencies according to50 using HF group average as the reference condition. β-actin was used for transcript normalization.
Bacterial composition analysis
DNA was extracted and amplified as previously described36,48 using barcoded F515 primers and the R806 primer.51,52 DNA library preparation and paired-end Illumina Mi-Seq (PE250) sequencing (Illumina Inc.) was performed at the UC Davis Genome Center (http://dnatech.genomecenter.ucdavis.edu/). DNA sequence analysis was performed using the pipeline Quantitative Insights Into Microbial Ecology (QIIME) version 1.8.053 as previously described for paired-end assembly.36,48 α-diversity was assessed through OTU counts and whole tree phylogenetic diversity.54 The β diversity was assessed by comparing weighted UniFrac distances55 and visualized with XLSTAT ver. 2017.5 (Addinsoft, Paris, France). Quantification L. plantarum 16S rRNA gene copy numbers in the intestinal contents was performed as previously described.27
Metabolomics
Liver, sera, ceca and colon samples were processed for Nuclear Magnetic Resonance (NMR) analysis as previously described.36,48 Analytes measured in each tissue type are listed in Table S3. The β diversity between intestinal metabolomes was determined using principal coordinates analysis (PCoA) plot on Bray-Curtis distances and visualized with XLSTAT ver. 2017.5.
Immunofluorescence staining
Ileal tissues were sectioned on a Frigocut 2800n Cryostat (Leica) into 5 μM sections at the Center for Comparative Medicine (https://ccm.ucdavis.edu/) and applied to Superfrost Plus microscope slides (22037246) prior to storage at −20 °C. All slides and reagents for immunofluorescence staining were purchased from Thermo-Fisher.
Tissues were fixed with 4% paraformaldehyde (R37814) and washed in Tris-buffered saline (28358) with 0.1% Triton X-100 (X100-100ML). Non-specific binding was blocked by addition of 10% bovine serum albumin (15561020). Primary antibody (ZO-1, 61–7300) was applied and incubated in a moist chamber overnight at 4 °C. Slides were then washed before applying secondary antibody (Alexa-488, A11008). Slides were washed again and incubated with 4’,6-Diamidino-2-Phenylindole, dihydrochloride (DAPI, D1306). Subsequently, slides were washed before mounting with Prolong Diamond anti-fade mounting media (P36961), and then dried overnight prior to imaging. Two slides per mouse taken from non-serial ileal sections were imaged. As controls, some slides were stained with secondary antibody only or with serially diluted primary antibody.
Tissues were imaged on a TCS SP8 STED 3X (Leica) with a 63X/1.4 oil immersion objective at the Center for Advanced Imaging (http://www.vetmed.ucdavis.edu/advanced-imaging/index.cfm). All images were taken with identical laser, threshold and filtering settings to eliminate background fluorescence. Z-stacks were collected in 0.2 µm steps at 1.25x capturing the full thickness of individual channels. Surface fitting and quantification of the images was completed with Imaris software version 8.4 (Bitplane) to include areas above a fixed voxel number as previously described.56 Objects in images were quantified as volume in µm3 and expressed as total volume of ZO-1 relative to total volume of DAPI.
Cell culture
The human intestinal Caco-2 cell line ATCC HTB-37 was cultured as previously described.57 Transepithelial resistance (TER) was measured with an epithelial volt-ohm-meter equipped with STX-2 chopstick electrodes (EVOM). Caco-2 monolayers with an initial TER more than 250 ohms▪cm2 were used. PlnEF was applied in a concentration of 500 nM onto the apical surface 3 h prior to the addition of IFN-γ (100 ng/ml; R&D Systems, 285-IF) into the basolateral compartment. The cells were then incubated overnight at 37 °C before supplementing the basolateral compartment with TNF-α (10 ng/ml; R&D Systems, P01375) and measuring TER over time.
Basolateral supernatants were harvested 2 h after TNF-α treatment and stored at −80 °C until quantification with the IL-8 Human ELISA kit according to manufacturer’s instructions (Thermo-Fisher, KHC0081). Thereafter, paracellular permeability was determined by the flux of fluorescein isothiocyanate-dextran (FITC-dextran; 4 kDa; Millipore-Sigma, 46944). FITC-dextran (2 mg/ml) was added to the apical compartment, and FITC-dextran concentrations on the basolateral side were measured after 1 h incubation by comparison to a standard curve. Fluorescence was measured on a Synergy 2 spectrophotometer (Biotek) with an excitation wavelength of 485 nm and an emission wavelength of 538 nm.
Statistical analysis
Data were analyzed using GraphPad Prism 6 (GraphPad Software, Inc., La Jolla, CA, USA). Unless otherwise stated, data are presented as individual mice, with mean ± standard error of the mean (SEM) represented as solid bars. Group means were compared by one-way ANOVA or the Kruskal-Wallis test followed by an appropriate post-hoc test. For analyzing average body weight over time and daily food intake, a repeated measure ANOVA with the Greenhouse-Geisser correction was used followed by Tukey’s multiple comparisons test to compute P values. A P value < 0.05 was considered significant.
Supplementary Material
Funding Statement
The authors would like to acknowledge the financial support of the American Diabetes Association (grant # 1-13-GSK-29). DDH is supported by the National Science Foundation (NSF) Graduate Research Fellowship (grant # 1148897).
Acknowledgments
The authors would like to thank Roy Martin for advisement on experimental procedures and analysis and Beau Parry for assistance on the development of the IHC staining protocol.
Data sharing statement
Access to microbiota data has been made publicly available at European Bioinformatics Institute (EMBL-EBI) with accession number: ERP104560. All other data is available upon request to corresponding author.
Conflict of interest statement
All authors have completed the Unified Competing Interest form (available on request from the corresponding author) and declare: no support from any organization for the submitted work; no financial relationships with any organizations that might have an interest in the submitted work in the previous three years, no other relationships or activities that could appear to have influenced the submitted work.
Contributions
All authors have contributed to and approved the manuscript.
Transparency declaration
The lead author affirms that the manuscript is an honest, accurate, and transparent account of the study being reported; that no important aspects of the study have been omitted; and that any discrepancies from the study as planned have been explained.
Ethical approval statement
The mouse study was conducted under approval of the UC Davis Animal Care and Use Committee (protocol #17500).
References
- 1.Gummesson A, Carlsson LMS, Storlien LH, Bäckhed F, Lundin P, Löfgren L, Stenlöf K, Lam Y, Fagerberg B, Carlsson B.. Intestinal permeability is associated with visceral adiposity in healthy women. Obesity. 2011;19(11):2280–2282. doi: 10.1038/oby.2011.251. [DOI] [PubMed] [Google Scholar]
- 2.Cani PD, Possemiers S, van de Wiele T, Guiot Y, Everard A, Rottier O, Geurts L, Naslain D, Neyrinck A, Lambert DM, et al. Changes in gut microbiota control inflammation in obese mice through a mechanism involving GLP-2-driven improvement of gut permeability. Gut. 2009;58(8):1091–1103. doi: 10.1136/gut.2008.165886. [DOI] [PMC free article] [PubMed] [Google Scholar]
- 3.Sato J, Kanazawa A, Ikeda F, Yoshihara T, Goto H, Abe H, Komiya K, Kawaguchi M, Shimizu T, Ogihara T, et al. Gut dysbiosis and detection of ‘Live gut bacteria’ in blood of Japanese patients with type 2 diabetes. Diabetes Care. 2014;37(8):2343–2350. doi: 10.2337/dc13-2817. [DOI] [PubMed] [Google Scholar]
- 4.Cani PD, Osto M, Geurts L, Everard A. Involvement of gut microbiota in the development of low-grade inflammation and type 2 diabetes associated with obesity. Gut Microbes. 2012;3(4):279–288. doi: 10.4161/gmic.19625. [DOI] [PMC free article] [PubMed] [Google Scholar]
- 5.Heeney DD, Gareau MG, Marco ML. Intestinal Lactobacillus in health and disease, a driver or just along for the ride? Curr Opin Biotechnol. 2018;49:140–147. doi: 10.1016/j.copbio.2017.08.004. [DOI] [PMC free article] [PubMed] [Google Scholar]
- 6.Cani PD, Van Hul M. Novel opportunities for next-generation probiotics targeting metabolic syndrome. Curr Opin Biotechnol. 2015;32:21–27. doi: 10.1016/j.copbio.2014.10.006. [DOI] [PubMed] [Google Scholar]
- 7.Kim M, Kim M, Kang M, Yoo HJ, Kim MS, Ahn Y-T, Sim J-H, Jee SH, Lee J. Effects of weight loss using supplementation with Lactobacillus strains on body fat and medium-chain acylcarnitines in overweight individuals. Food Funct. 2017;8(1):250–261. doi: 10.1039/c6fo00993j. [DOI] [PubMed] [Google Scholar]
- 8.Barreto FM, Colado Simão AN, Morimoto HK, Batisti Lozovoy MA, Dichi I, Helena da Silva Miglioranza L. Beneficial effects of Lactobacillus plantarum on glycemia and homocysteine levels in postmenopausal women with metabolic syndrome. Nutrition. 2014;30(7):939–942. doi: 10.1016/j.nut.2013.12.004. [DOI] [PubMed] [Google Scholar]
- 9.Lee K, Paek K, Lee HY, Park JH, Lee Y. Antiobesity effect of trans-10, cis-12-conjugated linoleic acid-producing Lactobacillus plantarum PL62 on diet-induced obese mice. J Appl Microbiol. 2007;103(4):1140–1146. doi: 10.1111/j.1365-2672.2007.03336.x. [DOI] [PubMed] [Google Scholar]
- 10.Park D-Y, Ahn Y-T, Park S-H, Huh C-S, Yoo S-R, Yu R, Sung M-K, McGregor RA, Choi M-S. Supplementation of Lactobacillus curvatus HY7601 and Lactobacillus plantarum KY1032 in diet-induced obese mice Is associated with gut microbial changes and reduction in obesity. PLoS One. 2013;8(3):1–12. doi: 10.1371/journal.pone.0059470. [DOI] [PMC free article] [PubMed] [Google Scholar]
- 11.Million M, Angelakis E, Paul M, Armougom F, Leibovic L, Raoult D. Comparative meta-analysis of the effect of Lactobacillus species on weight gain in humans and animals. Microb Pathog. 2012;53(2):100–108. doi: 10.1016/j.micpath.2012.05.007. [DOI] [PubMed] [Google Scholar]
- 12.Ottman N, Reunanen J, Meijerink M, Pietilä TE, Kainulainen V, Klievink J, Huuskonen L, Aalvink S, Skurnik M, Boeren S. Pili-like proteins of Akkermansia muciniphila modulate host immune responses and gut barrier function. PLoS One. 2017;12(3):1–18. doi: 10.1371/journal.pone.0173004. [DOI] [PMC free article] [PubMed] [Google Scholar]
- 13.Mujagic Z, de Vos P, Boekschoten MV, Govers C, Pieters HJ, de Wit N, Bron P, Masclee AD, Troost F. The effects of Lactobacillus plantarum on small intestinal barrier function and mucosal gene transcription; a randomized double-blind placebo controlled trial. Sci Rep. 2016;7(40128):1–11. doi: 10.1038/srep40128. [DOI] [PMC free article] [PubMed] [Google Scholar]
- 14.Karczewski J, Troost FJ, Konings I, Dekker J, Kleerebezem M, Brummer RJ, Wells JM. Regulation of human epithelial tight junction proteins by Lactobacillus plantarum in vivo and protective effects on the epithelial barrier. AJP Gastrointest Liver Physiol. 2010;298(6):851–859. doi: 10.1152/ajpgi.00327.2009. [DOI] [PubMed] [Google Scholar]
- 15.Hirao LA, Grishina I, Bourry O, Hu WK, Somrit M, Sankaran-Walters S, Gaulke CA, Fenton AN, Li JA, Crawford RW, et al. Early mucosal sensing of SIV infection by paneth cells induces IL-1beta production and initiates gut epithelial disruption. PLoS Pathog. 2014;10(8):1–15. doi: 10.1371/journal.ppat.1004311. [DOI] [PMC free article] [PubMed] [Google Scholar]
- 16.Anderssen EL, Diep DB, Nes IF, Eijsink VGH, Nissen-Meyer J. Antagonistic activity of Lactobacillus plantarum C11: two new two- peptide bacteriocins, plantaricins EF and JK, and the induction factor plantaricin A. Appl Environ Microbiol. 1998;64(6):2269–2272. [DOI] [PMC free article] [PubMed] [Google Scholar]
- 17.Dobson A, Cotter PD, Paul Ross R, Hill C. Bacteriocin production: A probiotic trait? Appl Environ Microbiol. 2012;78(1):1–6. doi: 10.1128/AEM.05576-11. [DOI] [PMC free article] [PubMed] [Google Scholar]
- 18.Cotter PD, Hill C, Ross PR. Bacteriocins: developing innate immunity for food. Nat Rev Microbiol. 2005;3(10):777–788. doi: 10.1038/nrmicro1273. [DOI] [PubMed] [Google Scholar]
- 19.Zheng J, Gänzle MG, Lin XB, Ruan L, Sun M. Diversity and dynamics of bacteriocins from human microbiome. Environ Microbiol. 2015;17(6):2133–2143. doi: 10.1111/1462-2920.12662. [DOI] [PubMed] [Google Scholar]
- 20.Walsh CJ, Guinane CM, Hill C, Ross RP, O’Toole PW, Cotter PD. In silico identification of bacteriocin gene clusters in the gastrointestinal tract, based on the Human Microbiome Project’s reference genome database. BMC Microbiol. 2015;15(183):1–11. doi: 10.1186/s12866-015-0515-4. [DOI] [PMC free article] [PubMed] [Google Scholar]
- 21.Murphy EF, Cotter PD, Hogan A, O’Sullivan O, Joyce A, Fouhy F, Clarke S, Marques T, O’Toole PW, Stanton C. Divergent metabolic outcomes arising from targeted manipulation of the gut microbiota in diet-induced obesity. Gut. 2013;62(2):220–226. doi: 10.1136/gutjnl-2011-300705. [DOI] [PubMed] [Google Scholar]
- 22.Umu ÖCO, Bäuerl C, Oostindjer M, Pope PB, Hernández PE, Pérez-Martínez G, Diep DB. The potential of class II bacteriocins to modify gut microbiota to improve host health. PLoS One. 2016;11(10):1–22. doi: 10.1371/journal.pone.0164036. [DOI] [PMC free article] [PubMed] [Google Scholar]
- 23.Corr SC, Li Y, Riedel CU, O’Toole PW, Hill C, Gahan CGM. Bacteriocin production as a mechanism for the antiinfective activity of Lactobacillus salivarius UCC118. Proc Natl Acad Sci. 2007;104(18):7617–7621. doi: 10.1073/pnas.0700440104. [DOI] [PMC free article] [PubMed] [Google Scholar]
- 24.Riboulet-Bisson E, Sturme MHJ, Jeffery IB, O’Donnell MM, Neville BM, Claesson MJ, Harris H, Gardiner GE, Casey PG, Lawlor PG. Effect of Lactobacillus salivarius bacteriocin ABP118 on the mouse and pig intestinal microbiota. PLoS One. 2012;7(2):1–12. doi: 10.1371/journal.pone.0031113. [DOI] [PMC free article] [PubMed] [Google Scholar]
- 25.van Hemert S, Meijerink M, Molenaar D, Bron P, de Vos P, Kleerebezem M, Wells JM, Marco ML. Identification of Lactobacillus plantarum genes modulating the cytokine response of human peripheral blood mononuclear cells. BMC Microbiol. 2010;10(1):1–13. doi: 10.1186/1471-2180-10-293. [DOI] [PMC free article] [PubMed] [Google Scholar]
- 26.Meijerink M, van Hemert S, Taverne N, Wels M, de Vos P, Bron P, Savelkoul HF, van Bilsen J, Kleerebezem M, Wells JM. Identification of genetic loci in Lactobacillus plantarum that modulate the immune response of dendritic cells using comparative genome hybridization. PLoS One. 2010;5(5):1–12. doi: 10.1371/journal.pone.0010632. [DOI] [PMC free article] [PubMed] [Google Scholar]
- 27.Yin X, Heeney DD, Srisengfa Y, Golomb B, Griffey S, Marco ML. Bacteriocin biosynthesis contributes to the anti-inflammatory capacities of probiotic Lactobacillus plantarum. Benef Microbes. 2018;9(2):333–344. doi: 10.3920/BM2017.0096. [DOI] [PubMed] [Google Scholar]
- 28.Tachon S, Lee B, Marco ML. Diet alters probiotic Lactobacillus persistence and function in the intestine. Environ Microbiol. 2014;16(9):2915–2926. doi: 10.1111/1462-2920.12297. [DOI] [PubMed] [Google Scholar]
- 29.Marco M, Peters THF, Bongers RS, Molenaar D, van Hemert S, Sonnenburg JL, Gordon JI, Kleerebezem M. Lifestyle of Lactobacillus plantarum in the mouse cecum. Environ Microbiol. 2009;11(10):2747–2757. doi: 10.1111/j.1462-2920.2009.02001.x.LIFESTYLE. [DOI] [PMC free article] [PubMed] [Google Scholar]
- 30.Svop JV, Hvid H, Damgaard J, Nygaard H, Ingvorsen C, Wulff EM, Lykkesfeldt J, Fledelius C. Dietary fat stimulates development of NAFLD more potently than dietary fructose in Sprague–dawley rats. Diabetol Metab Syndr. 2018;10(4):1–13. doi: 10.1186/s13098-018-0307-8. [DOI] [PMC free article] [PubMed] [Google Scholar]
- 31.Park S, Ji Y, Jung H-Y, Park H, Kang J, Choi S-H, Shin H, Hyun C-K, Kim K-T, Holzapfel WH. Lactobacillus plantarum HAC01 regulates gut microbiota and adipose tissue accumulation in a diet-induced obesity murine model. Appl Microbiol Biotechnol. 2017;101(4):1605–1614. doi: 10.1007/s00253-016-7953-2. [DOI] [PubMed] [Google Scholar]
- 32.Ivanovic N, Minic R, Dimitrijevic L, Radojevic Skodric S, Zivkovic I, Djordjevic B. Lactobacillus rhamnosus LA68 and Lactobacillus plantarum WCFS1 differently influence metabolic and immunological parameters in high fat diet-induced hypercholesterolemia and hepatic steatosis. Food Funct. 2015;6(2):558–565. doi: 10.1039/c4fo00843j. [DOI] [PubMed] [Google Scholar]
- 33.Andersson U, Bränning C, Ahrné S, Molin G, Alenfall J, Önning G, Nyman M, Holm C. Probiotics lower plasma glucose in the high-fat fed C57BL/6J mouse. Benef Microbes. 2010;1(2):189–196. doi: 10.3920/BM2009.0036. [DOI] [PubMed] [Google Scholar]
- 34.Park J-E, Oh S-H, Cha Y-S. Lactobacillus plantarum LG42 isolated from gajami sik-hae decreases body and fat pad weights in diet-induced obese mice. J Appl Microbiol. 2014;116(1):145–156. doi: 10.1111/jam.12354. [DOI] [PubMed] [Google Scholar]
- 35.Everard A, Belzer C, Geurts L, Ouwerkerk JP, Druart C, Bindels LB, Guiot Y, Derrien M, Muccioli GG, Delzenne NM, et al. Cross-talk between Akkermansia muciniphila and intestinal epithelium controls diet-induced obesity. Proc Natl Acad Sci U S A. 2013;110(22):9066–9071. doi: 10.1073/pnas.1219451110. [DOI] [PMC free article] [PubMed] [Google Scholar]
- 36.Martinic A, Barouei J, Bendiks Z, Mishchuk D, Heeney DD, Martin R, Marco ML, Slupsky CM. Supplementation of Lactobacillus plantarum improves markers of metabolic dysfunction induced by a high fat diet. J Proteome Res. 2018;A–M. doi: 10.1021/acs.jproteome.8b00282. [DOI] [PubMed] [Google Scholar]
- 37.Hamilton MK, Boudry G, Lemay DG, Raybould HE. Changes in intestinal barrier function and gut microbiota in high-fat diet-fed rats are dynamic and region dependent. Am J Physiol Liver Physiol. 2015;308(10):840–851. doi: 10.1152/ajpgi.00029.2015. [DOI] [PMC free article] [PubMed] [Google Scholar]
- 38.de La Serre CB, de Lartigue G, Raybould HE. Chronic exposure to low dose bacterial lipopolysaccharide inhibits leptin signaling in vagal afferent neurons. Physiol Behav. 2015;139(2015):188–194. doi: 10.1016/J.PHYSBEH.2014.10.032. [DOI] [PMC free article] [PubMed] [Google Scholar]
- 39.Lambert JM, Bongers RS, de Vos WM, Kleerebezem M. Functional analysis of four bile salt hydrolase and penicillin acylase family members in Lactobacillus plantarum WCFS1. Appl Environ Microbiol. 2008;74(15):4719–4726. doi: 10.1128/AEM.00137-08. [DOI] [PMC free article] [PubMed] [Google Scholar]
- 40.Legry V, Francque S, Haas JT, Verrijken A, Caron S, Chávez-Talavera O, Vallez E, Vonghia L, Dirinck E, Verhaegen A, et al. Bile acid alterations are associated with insulin resistance, but not with NASH, in obese subjects. J Clin Endocrinol Metab. 2017;102(10):3783–3794. doi: 10.1210/jc.2017-01397. [DOI] [PubMed] [Google Scholar]
- 41.Mardinoglu A, Shoaie S, Bergentall M, Ghaffari P, Zhang C, Larsson E, Bäckhed F, Nielsen J. The gut microbiota modulates host amino acid and glutathione metabolism in mice. Mol Syst Biol. 2015;11(834):1–15. doi: 10.15252/msb.20156487. [DOI] [PMC free article] [PubMed] [Google Scholar]
- 42.Bauer PV, Hamr SC, Duca FA. Regulation of energy balance by a gut-brain axis and involvement of the gut microbiota. Cell Mol Life Sci. 2016;73(4):737–755. doi: 10.1007/s00018-015-2083-z. [DOI] [PMC free article] [PubMed] [Google Scholar]
- 43.Di Cagno R, De Angelis M, Calasso M, Vincentini O, Vernocchi P, Ndagijimana M, De Vinczenzo M, Dessi MR, Guerzoni ME, Gobbetti M. Quorum sensing in sourdough Lactobacillus plantarum DC400: induction of plantaricin a (PlnA) under co-cultivation with other lactic acid bacteria and effect of PlnA on bacterial and Caco-2 cells. Proteomics. 2010;10(11):2175–2190. doi: 10.1002/pmic.200900565. [DOI] [PubMed] [Google Scholar]
- 44.Miyauchi E, O’Callaghan J, Butto LF, Hurley G, Melgar S, Tanabe S, Shanahan F, Nally K, O’Toole PW. Mechanism of protection of transepithelial barrier function by Lactobacillus salivarius: strain dependence and attenuation by bacteriocin production. AJP Gastrointest Liver Physiol. 2012;303(9):1029–1041. doi: 10.1152/ajpgi.00003.2012. [DOI] [PubMed] [Google Scholar]
- 45.Hill C, Guarner F, Reid G, Gibson GR, Merenstein DJ, Pot B, Morelli L, Canani RB, Flint HJ, Salminen S, et al. Expert consensus document: the International Scientific Association for Probiotics and Prebiotics consensus statement on the scope and appropriate use of the term probiotic. Nat Rev Gastroenterol Hepatol. 2014;11(Aug):506–514. doi: 10.1038/nrgastro.2014.66. [DOI] [PubMed] [Google Scholar]
- 46.Yan F, Cao H, Cover TL, Whitehead R, Washington MK, Polk DB. Soluble proteins produced by probiotic bacteria regulate intestinal epithelial cell survival and growth. Gastroenterology. 2007;132(2):562–575. doi: 10.1053/j.gastro.2006.11.022. [DOI] [PMC free article] [PubMed] [Google Scholar]
- 47.Segawa S, Fujiya M, Konishi H, Ueno N, Kobayashi N, Shigyo T, Kogho Y. Probiotic-Derived polyphosphate enhances the epithelial barrier function and maintains intestinal homeostasis through integrin-p38 MAPK pathway. PLoS One. 2011;6(8):1–15. doi: 10.1371/journal.pone.0023278. [DOI] [PMC free article] [PubMed] [Google Scholar]
- 48.Barouei J, Bendiks Z, Martinic A, Mishchuk D, Heeney DD, Hsieh Y-H, Kieffer D, Zaragoza J, Martin R, Slupsky C, et al. Microbiota, metabolome, and immune alterations in obese mice fed a high-fat diet containing type 2 resistant starch. Mol Nutr Food Res. 2017;61(11):1700184. doi: 10.1002/mnfr.201700184. [DOI] [PubMed] [Google Scholar]
- 49.Sambrook J, Russell DW. Purification of nucleic acids by extraction with phenol: chloroform. Cold Spring Harb Protoc. 2006;2006(1):pdb.prot4455. doi: 10.1101/pdb.prot4455. [DOI] [PubMed] [Google Scholar]
- 50.Pfaffl MW. A new mathematical model for relative quantification in real-time RT-PCR. Nucleic Acids Res. 2001;29(9):2002–2007. doi: 10.1093/nar/29.9.e45. [DOI] [PMC free article] [PubMed] [Google Scholar]
- 51.Bokulich NA, Joseph CML, Allen G, Benson AK. Next-generation sequencing reveals significant bacterial diversity of botrytized wine. PLoS One. 2012;7(5):1–10. doi: 10.1371/journal.pone.0036357. [DOI] [PMC free article] [PubMed] [Google Scholar]
- 52.Caporaso JG, Lauber CL, Walters WA, Berg-Lyons D, Lozupone CA, Turnbaugh TJ, Fierer N, Knight R. Global patterns of 16S rRNA diversity at a depth of millions of sequences per sample. Proc Natl Acad Sci U S A. 2011;108(1):4516–4522. doi: 10.1073/pnas.1000080107. [DOI] [PMC free article] [PubMed] [Google Scholar]
- 53.Caporaso JG, Kuczynski J, Stombaugh J, Bittinger K, Bushman FD, Costello EK, Fierer N, Peña AG, Goodrich JK, Gordon JI, et al. QIIME allows analysis of high-throughput community sequencing data. Nat Methods. 2010;7(5):335–336. doi: 10.1038/nmeth.f.303. [DOI] [PMC free article] [PubMed] [Google Scholar]
- 54.Faith DP. Conservation evaluation and phylogenetic diversity. Biol Conserv. 1992;61(1):1–10. doi: 10.1016/0006-3207(92)91201-3. [DOI] [Google Scholar]
- 55.Lozupone C, Lladser ME, Knights D, Stombaugh J, Knight R. UniFrac: an effective distance metric for microbial community comparison. ISME J. 2011;5(2):169–172. doi: 10.1038/ismej.2010.133. [DOI] [PMC free article] [PubMed] [Google Scholar]
- 56.Paul D, Cowan AE, Ge S, Pachter JS. Novel 3D analysis of Claudin-5 reveals significant endothelial heterogeneity among CNS microvessels. Microvasc Res. 2013;86:1–10. doi: 10.1016/j.mvr.2012.12.001. [DOI] [PMC free article] [PubMed] [Google Scholar]
- 57.Hubatsch I, Ragnarsson EGE, Artursson P. Determination of drug permeability and prediction of drug absorption in Caco-2 monolayers. Nat Protoc. 2007;2(9):2111–2119. doi: 10.1038/nprot.2007.303. [DOI] [PubMed] [Google Scholar]
Associated Data
This section collects any data citations, data availability statements, or supplementary materials included in this article.