ABSTRACT
The intestinal microbiota is involved in ulcerative colitis (UC) pathogenesis. Prebiotics are hypothesized to improve health through alterations to gut microbiota composition and/or activity. Our aim was therefore to determine if inulin-type fructans induce clinical benefits in UC, and identify if benefits are linked to compositional and/or functional shifts of the luminal (fecal) and mucosal (biopsy) bacterial communities. Patients (n = 25) with mild/moderately active UC received 7.5 g (n = 12) or 15 g (n = 13) daily oral oligofructose-enriched inulin (Orafti®Synergy1) for 9 weeks. Total Mayo score, endoscopic activity and fecal calprotectin were assessed. Fecal and mucosal bacterial communities were characterized by 16S rRNA tag sequencing, and short chain fatty acids (SCFA) production were measured in fecal samples. Fructans significantly reduced colitis in the high-dose group, with 77% of patients showing a clinical response versus 33% in the low-dose group (P = 0.04). Fructans increased colonic butyrate production in the 15 g/d dose, and fecal butyrate levels were negatively correlated with Mayo score (r = −0.50; P = 0.036). The high fructan dose led to an increased Bifidobacteriaceae and Lachnospiraceae abundance but these shifts were not correlated with improved disease scores. In summary, this pilot study revealed that 15 g/d dose inulin type fructans in UC produced functional but not compositional shifts of the gut microbiota, suggesting that prebiotic-induced alterations of gut microbiota metabolism are more important than compositional changes for the benefits in UC. The findings warrant future well-powered controlled studies for the use of β-fructans as adjunct therapy in patients with active UC.
KEYWORDS: Ulcerative colitis, fructans, inulin, FOS, intestinal microbiota, pyrosequencing, butyrate
Introduction
Crohn’s disease (CD) and ulcerative colitis (UC), collectively called inflammatory bowel disease (IBD), are chronic inflammatory conditions of the intestine. Chronic intestinal inflammation is likely induced by an exacerbated immune response to resident intestinal bacteria in genetically susceptible hosts1–3 as most susceptibility genes for UC relate to innate immunity and antimicrobial defence.4 The microbial community in IBD is altered, showing a reduced diversity and stability both at the luminal and mucosal sites compared to non-IBD controls.5–7 Metagenomic studies identified a reduced abundance of butyrate-producing bacteria and an increase in putative pathobionts that can induce inflammation.8–10 Modulation of the gut microbiota through dietary intervention may reduce disease activity in IBD. Probiotic bacteria have shown efficacy in the treatment of UC and chronic pouchitis.11 Inulin-type β-fructans are non-digestible carbohydrates that beneficially alter activity of gut microbiota12 and thus are classified as prebiotics.13 β-Fructans, were also shown to reduce intestinal inflammation in rodent colitis models.14 Their efficacy in managing inflammation in IBD, however, is not as well documented as the effect of probiotics and it remains disputed whether their activity relates to the stimulation of specific members of the intestinal microbiota, or metabolic alterations such as an increased production of short chain fatty acids (SCFAs).12,13,15
A randomized placebo-controlled trial in patients with mild to moderately active CD reported increased anti-inflammatory cytokines in mucosal samples from the fructan treated group but no clinical benefits.16 In contrast, UC patients treated with inulin-type fructans alone or in combination with probiotic bacteria showed reduction in fecal calprotectin17 and decreased pro-inflammatory cytokines TNF-α and IL-1α mRNA expression in colonic mucosa.18 However, the duration of treatment in these studies was too short to assess clinical and endoscopic improvement, nor were the colonic microbiota analyzed.
The aim of this pilot exploratory study was to compare the clinical effects of two different doses of a dietary supplementation of inulin-type fructans, namely oligofructose-enriched inulin, in mild to moderately active UC for 9 weeks, and also to test whether benefits are associated with compositional shifts in the fecal and mucosal microbiota, or to an altered metabolic activity. To achieve this aim, the clinical response, changes in the inflammatory stool marker fecal calprotectin, the composition of fecal and mucosal microbiota, the fecal short-chain fatty acids production and butyrate metabolism were analyzed, and associations between the parameters were systematically tested.
Results
Clinical outcome
In this pilot exploratory clinical study assessing the efficacy, safety and tolerability of inulin type β-fructans (Synergy1, Orafti) in active UC, 53 patients were screened of which 31 were eligible for the study based on the inclusion and exclusion criteria. Eligible patients were randomly assigned to receive either 7.5 or 15 g/d of Synergy1. A summary of patients’ flow is shown in Figure 1. Demographic and baseline characteristics of patients who completed the trial are given in Table 1. Twenty five patients completed the treatment (12 in the 7.5 g dose group and 13 in the 15 g group). Six patients withdrew from the study before completion due to incompliance (n = 4; 3 in the 7.5 g dose, 1 in the 15 g dose) or deterioration of symptoms (n = 2; 1 patient per dose group) (Figure 1). Fourteen patients (56%) showed clinical response at the end of the study period, defined as a decrease of the total Mayo score by 3 or more compared to baseline or total Mayo score of less than 2 (remission) at the end of the study.19 Analysis per treatment group identified that significantly more patients with clinical improvement/response (77%, n = 10) were assigned to the 15 g/d of inulin-type fructans versus only 33% (n = 4) in the 7.5 g/d group (P = 0.04). More importantly, a significantly higher number of patients in the 15 g/d dose group entered clinical remission (n = 8) in comparison to the 7.5 g/d group (n = 2) (P = 0.02). At the start of the study, both treatment groups had similar mean total Mayo score (6.1 ± 0.4 for 7.5 g dose group; 5.5 ± 0.5 for 15 g dose group) and endoscopic score (respectively 2 ± 0.2 and 1.7 ± 0.2 for 7.5 g/d and 15 g/d doses), while fecal calprotectin was not significantly higher in the 15g/d dose group (respectively 603.9 ± 194.7 µg/g stool and 934.6 ± 157.3 µg/g stool for 7.5 g/d and 15 g/d doses, P = 0.33) (Figure 2). Treatment with 15 g/d but not 7.5 g/d inulin-type fructans significantly decreased the Mayo score and fecal calprotectin (Figure 2A-C), suggesting that a daily dose of 15 g Synergy1 was beneficial in reducing the clinical symptoms and colitis in active UC. The other clinical parameters were not significantly changed. Sex-based comparison identified no significant difference in fecal calprotectin levels between males and females at baseline (P > 0.9999), or at the end of the study (P = 0.33) (Suppl. Figure 1). Shifts in the Mayo score were strongly correlated to fecal calprotectin (r = 0.58, P = 0.006) (Figure 2D), confirming fecal calprotectin as an objective marker for colonic inflammation.20 One third of the patients reported increased flatulence and bloating (n = 7), particularly 48–72 h after starting β-fructans intake. Those patients were mainly allocated to the high dose (n = 6) (P = 0.03), confirming that a dose of 15 g/d β-fructans may initially produce mild to moderate gastro-intestinal sensations as flatulence and bloating.21,22 These adverse effects were transient and showed improvement over the study period (Suppl. Figure 2). Altogether, these findings suggest a dose of 15 g/d of inulin type fructans to be beneficial in reducing the clinical symptoms in UC patients with active disease with tolerable side effects related to flatulence.
Figure 1.
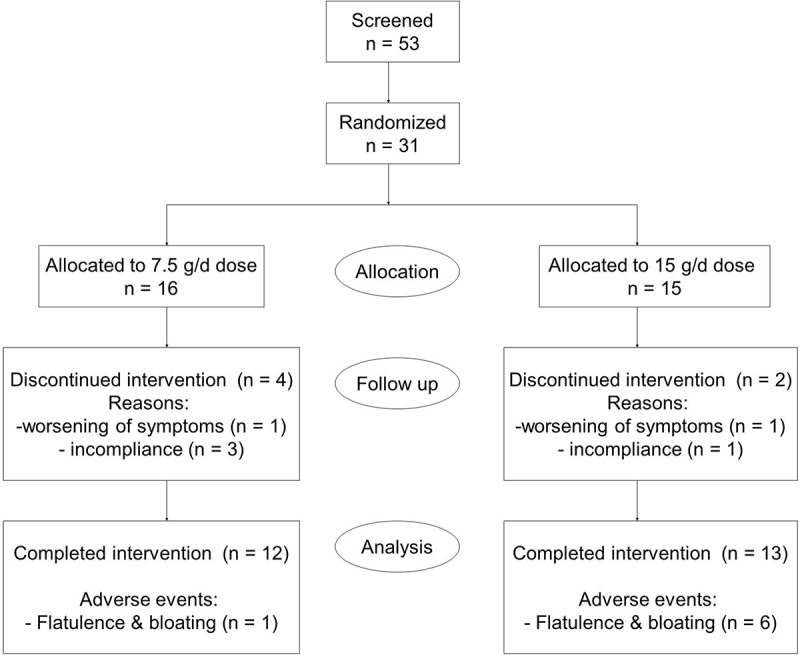
Recruitment and patients flow scheme.
Table 1.
Patient demographic and baseline characteristics.
| Characteristic | 7.5 g FOS/inulin group | 15 g FOS/inulin group |
|---|---|---|
| Number of patients (n) | 12 | 13 |
| Gender | ||
| Male | 6 (50%) | 5 (38%) |
| Female | 6 (50%) | 8 (62%) |
| Mean age at entry (yr) | 36 (range 18 – 58) | 39 (range 20 – 65) |
| Disease location | ||
| Left-sided colitis | 9 (75%) | 11 (85%) |
| Pancolitis | 3 (25%) | 2 (15%) |
| Concomitant medications | ||
| No medication | 1 (8%) | 4 (30%) |
| 5-animosalicylic acid (5-ASA) | 11 (92%) | 9 (70%) |
Figure 2.
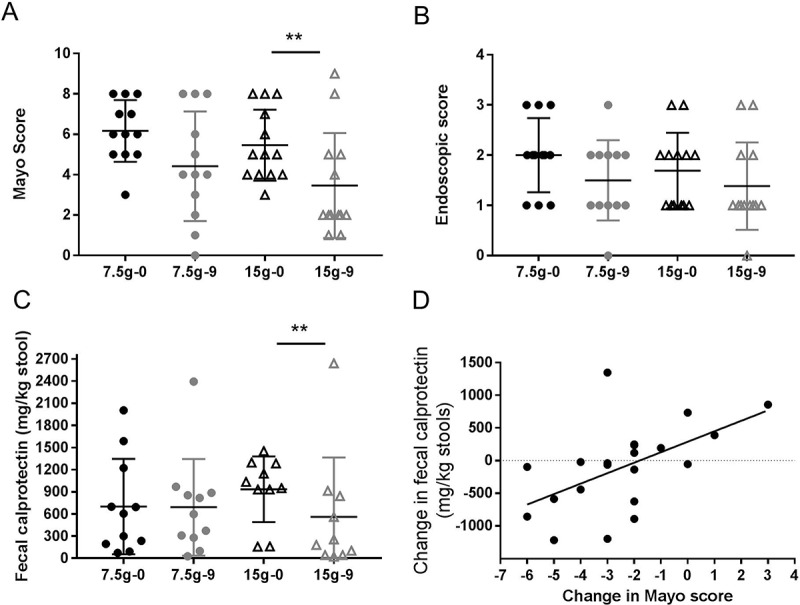
Mayo Clinical Score (A), endoscopic activity score (B) and fecal calprotectin (C) at 0 and 9 weeks for each of the treatment groups (7.5 g/d low dose n = 12; 15 g/d high dose n = 13). Black color – measures at baseline (0 week); grey color – measures at end of the study (9 week); (●) 7.5 g/d low dose; (▲) 15 g/d high dose. Values are shown as scatter plot. “**” Means that significantly different from week 0 (P < 0.05). Spearman correlation analysis between Mayo score and fecal calprotectin (D) (r = 0.58, P = 0.006. Values are expressed as changes in the clinical markers Mayo score and fecal calprotectin at week 9 versus baseline.
Characterization of the baseline fecal and biopsy microbiota in patients with active UC
In order to assess if the observed reduction in disease activity was associated with shifts in the gut microbiota composition, the bacteria communities in stool and biopsy samples were characterized by high throughput sequencing of 16S rRNA gene tags. Sixty-four genera from 37 families were identified in the biopsies, in comparison to 39 genera from 22 families in feces (Suppl. Table 1). The baseline microbiota composition, both in stool and biopsies, showed a high degree of inter-individual variation and did not differ between the patient groups. UniFrac distance analysis identified distinct clustering between stool and biopsy microbiota (Figure 3). Compositional differences between mucosal and fecal microbiota were observed at phylum, class, family and genus levels (Figure 4). Stool samples were characterized both by higher abundance of strictly anaerobic Firmicutes from the class Clostridia, such as Ruminococcaceae and Veillonellaceae, as well as a significantly higher abundance of the Bacteroidetes phylum. In contrast, microbial communities in biopsy samples were distinguished with higher abundance of facultative anaerobes belonging to class Bacilli from the Firmicutes phylum as well as the Proteobacteria phylum (Figure 4A,B). It is important to note that the compositional difference was attributed to several aerobic or facultative anaerobic genera such as Leuconostoc, Weissella, Enterococcus, Acidovorax, Microvirgula, Enhydrobacter, Comamonas, Klebsiella, Vitreoscilla and Pseudomonas, which were exclusively detected in biopsy samples (Figure 4C), likely due to oxygen that is present in mucosal micro-environment.23 These findings confirm previous reports that the mucosal microbiota differs from that in the lumen,24 warranting an analysis of both the fecal and mucosal sites in our study.
Figure 3.
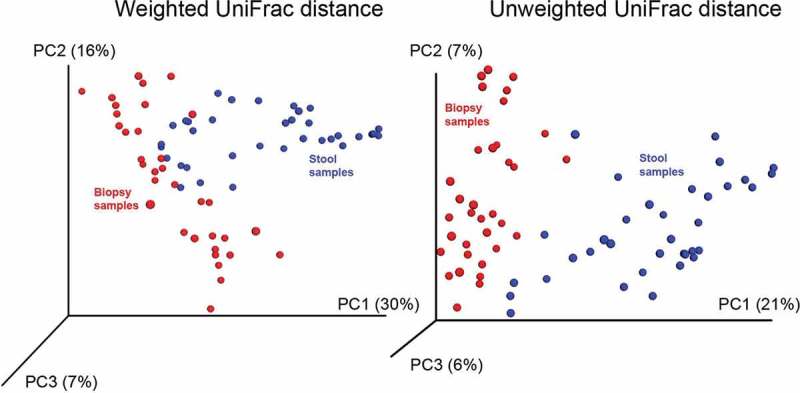
Bacterial communities in stool and biopsy samples of patients with active ulcerative colitis treated with stable doses of 5-aminosalicylic acid (5-ASA) clustered using principle coordinate analysis of weighted and unweighted UniFrac distance matrix. Blue points correspond to fecal samples, red points denote for samples with colonic biopsy origin. Both PCA analyses distinct microbial communities based on their sample origin.
Figure 4.
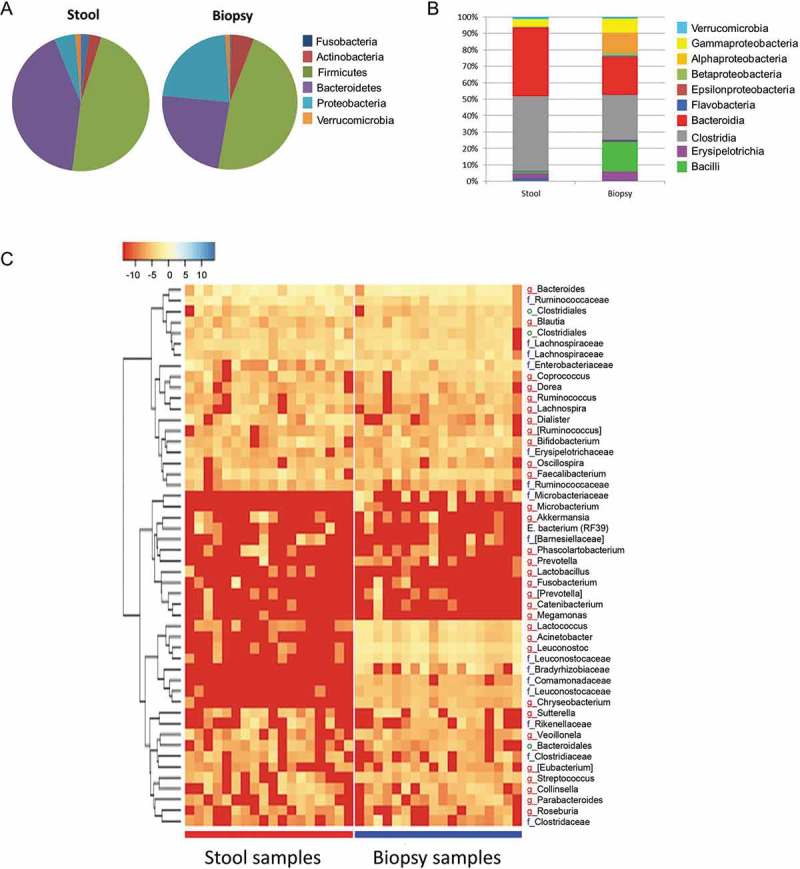
Relative bacterial abundance (%) on (A) phylum and (B) class level in stool and biopsies at baseline (0 week) of UC patients with active mild to moderate disease treated with two doses of inulin-type fructans. (C) Heatmap based on the hierarchical clustering solution (Bray–Curtis distance metric and complete clustering method) of the genus-level microbiota in stool and biopsy samples at baseline (0 week). Rows represent the first 50 dominant genera, columns represent the different subjects. The values in the heatmap represent the square-root-transformed relative percentage of each bacterial genus. The square-root-transformed values for bacterial genus are depicted by colour intensity with the legend indicated at the upper left corner of the figure.
β-fructan-induced compositional changes in the gut microbiota of active UC patients
To explore the impact of fructans on the gut microbiota, we performed a principle component analysis (PCA) comparing the changes in the relative abundance of bacterial taxa at family level (determined as percentage abundance at the end of the study minus baseline) from stool and colonic biopsies in the low dose versus the high dose. However no significant clustering between the treatment groups was observed (Suppl. Figure 3 A, B). We then performed a sub-group analysis of baseline versus end of study microbiota per treatment dose (7.5 g/d and 15 g/d) and sample type (stool and colonic biopsy) (Suppl. Figure 3C-F), yet no considerable clustering was determined, suggesting that β-fructans at the studied doses did not produce significant impact on the overall bacterial community structure in stool or biopsies.
In order to sharpen the separation between groups, we conducted partial least squares discriminant analysis (PLS-DA). PLS-DA analysis of bacterial relative abundance at family-level in stool confirmed that a dose of 7.5 g/d β-fructans did not produce significant shifts in the overall microbial composition (Figure 5A). Variable importance in projection scores (VIP) and absolute regression coefficients (coefficients) identified family Ruminicoccaceae as the only variable defining the group clustering in low dose stool (Figure 5C,E). Wilcoxon matched-pairs signed rank test confirmed the significance of family Ruminococcaceae (P = 0.027) as the only taxon that increased in the stool of patients treated with 7.5 g/d β-fructans (Figure 5G). This was also reflected by an increased abundance of genus Faecalibacterium (P = 0.039) and unclassified Ruminococcaceae (P = 0.007) (Table 2).
Figure 5.
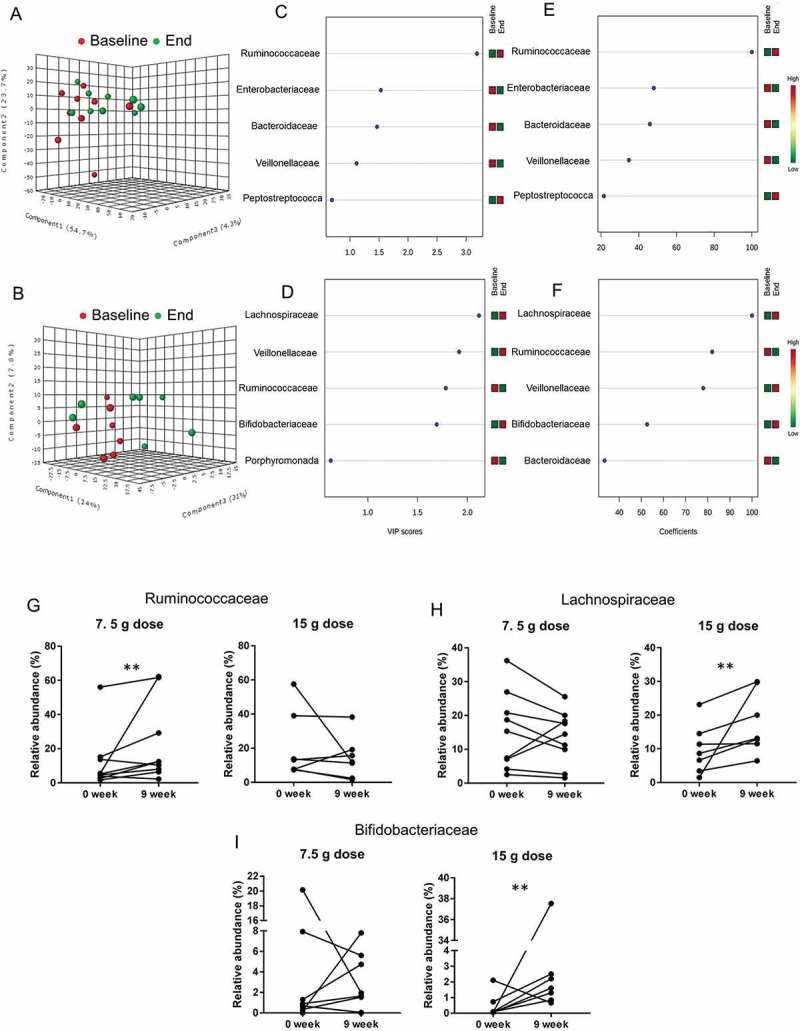
Effect of two doses of inulin-type β-fructans on fecal microbiota in patients with active ulcerative colitis treated with product Synergy1 for 9 weeks. Initial discriminant analysis was performed with partial least squares discriminant analysis (PLS-DA) at family-level in the 7.5 g/d dose (A) and 15 g/d dose (B) treatment groups. Red symbols (●) represent individual microbiota at baseline (0 week), green symbols (●) correspond to individual microbiota at the end of the study (9 week). Variable importance in projection (VIP) scores (C) and (D), and weighted sum of absolute regression coefficients (coef) (E) and (F) respectively for PLS-DA in 7.5 g/d and 15 g/d dose treatments were used for selection of variables that defined the group clustering. The colored boxes on the right indicate the relative abundance (low in green, high in red) of the corresponding bacterial families at baseline and end of study. Wilcoxon matched-pairs signed rank test was used to confirm the significance of the discriminating variables Ruminococcaceae (G), Lachnospiraceae (H) and Bifidobacteriaceae (I). “**” Means that significantly different from week 0 (P < 0.05).
Table 2.
Relative abundance of dominant bacterial families (>1%) and genera that were altered in stool of active UC patients treated with two different doses of inulin-type fructans for 9 weeks.
| 7.5 g FOS/inulin group |
15 g FOS/inulin group |
|||||
|---|---|---|---|---|---|---|
| 0 week | 9 week | P value | 0 week | 9 week | P value | |
| Bifidobacteriaceae | 3.50 ± 2.24 | 2.59 ± 0.93 | NS | 0.45 ± 0.28 | 2.65 ± 1.36 | 0.031 |
| Bifidobacterium | 3.37 ± 2.17 | 2.55 ± 0.92 | NS | 0.46 ± 0.29 | 2.44 ± 1.27 | 0.033 |
| Ruminococcaceae | 12.1 ± 5.71 | 22.7 ± 7.80 | 0.027 | 20.9 ± 7.43 | 14.3 ± 4.67 | NS |
| Faecalibacterium | 2.62 ± 0.92 | 11.41 ± 6.43 | 0.039 | 3.14 ± 0.91 | 5.11 ± 1.87 | NS |
| Unclass. Ruminococcaceae | 1.67 ± 0.51 | 3.30 ± 0.81 | 0.0078 | 3.74 ± 1.32 | 3.44 ± 1.29 | NS |
| Lachnospiraceae | 15.5 ± 3.79 | 13.5 ± 2.65 | NS | 9.9 ± 2.77 | 17.7 ± 3.48 | 0.015 |
| Veillonellaceae | 7.28 ± 4.62 | 3.52 ± 1.01 | NS | 4.63 ± 1.75 | 11.6 ± 5.13 | NS |
| Bacteroidaceae | 34.8 ± 8.34 | 29.9 ± 8.27 | NS | 30.2 ± 6.52 | 28.8 ± 9.06 | NS |
| Porphyromonadaceae | 4.18 ± 2.37 | 4.46 ± 2.58 | NS | 4.5 ± 3.15 | 2.19 ± 1.75 | NS |
| Enterobacteriacea | 6.02 ± 3.95 | 0.87 ± 0.37 | NS | 1.34 ± 1.22 | 0.24 ± 0.11 | NS |
Taxonomic identification was achieved using 16S rDNA-tags pyrosequencing. Results are presented as means of the relative abundance (%) and standard error of the mean. NS = not significant.
In contrast, PLS-DA analysis of the gut microbiota in stool from 15 g/d dose group showed significant separation at family level based on the time of collection (Figure 5B), suggesting that this dose may have an effect on the stool microbiota composition. Lachnospiraceae, Veillonellaceae, Ruminococcaceae and Bifidobacteriaceae were determined as the variables directing the separation in the PLS-DA plot (Figure 5D,F). Wilcoxon matched-pair test validated a significant increase in Lachnospiraceae (P = 0.015) and Bifidobacteriaceae (P = 0.031) relative abundance (Figure 5H,I) (Table 2).
Similarly, we performed PLS-DA analysis of the bacterial relative abundance at family level in colonic biopsies from patients treated with low or high dose β-fructans (Figure 6). This analysis confirmed that a dose of 7.5 g/d inulin-type fructans had no significant effect on the mucosa-associated intestinal microbiota at family level in patients with active UC (Figure 6A). Furthermore no significant shifts at genus level were identified (Wilcoxon matched-pairs test).
Figure 6.
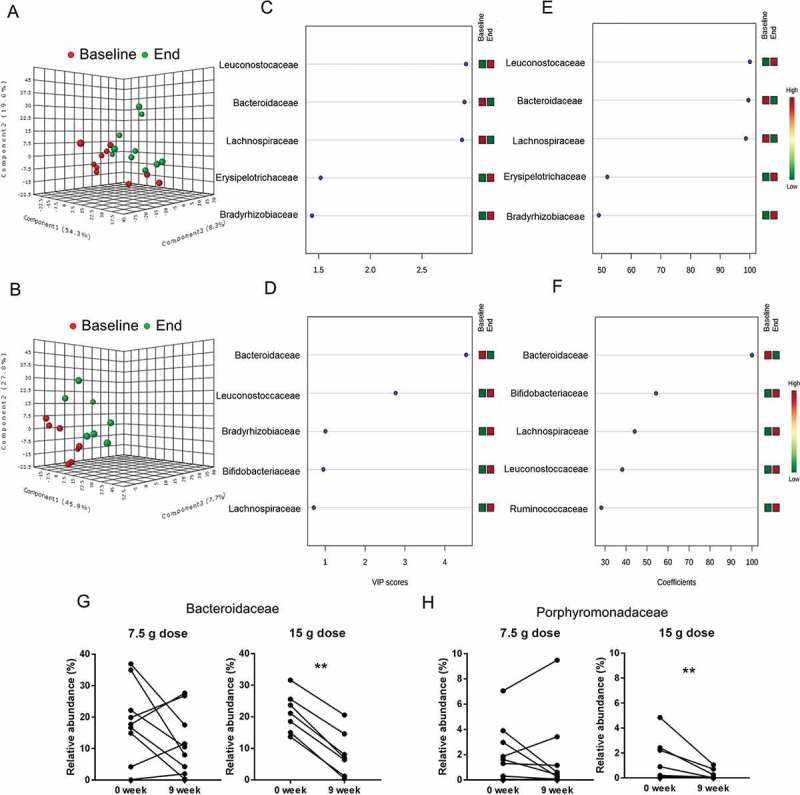
Effect of two doses of inulin-type β-fructans on colonic biopsy microbiota in patients with active ulcerative colitis treated with product Synergy1 for 9 weeks. Initial discriminant analysis was performed with partial least squares discriminant analysis (PLS-DA) at family-level in the 7.5 g/d dose (A) and 15 g/d dose (B) treatment groups. Red symbols (●) represent individual microbiota at baseline (0 week), green symbols (●) correspond to individual microbiota at the end of the study (9 week). Variable importance in projection (VIP) scores (C) and (D), and weighted sum of absolute regression coefficients (coef) (E) and (F) respectively for PLS-DA in 7.5 g/d and 15 g/d dose treatments were used for selection of variables that defined the group clustering. The colored boxes on the right indicate the relative abundance (low in green, high in red) of the corresponding bacterial families at baselineand end of study. Wilcoxon matched-pairs signed rank test was used to confirm the significance of the discriminating variables for Bacteroidaceae (G) and Porphyromonadaceae (H). “**” Means that significantly different from week 0 (P < 0.05).
PLS-DA discriminant analysis of taxa in biopsies from patients treated with 15 g/d dose β-fructans determined a shift at the end of the study period (Figure 6B) mainly defined by reduction of Bacteroidaceae relative abundance (Figure 6D,F). Wilcoxon matched-pairs test validated the significant decrease of Bacteroidaceae (P = 0.015) (Figure 6G) as well as reduction of Porphyromonadaceae (P = 0.031) (Figure 6H), further illustrated by reduction in the relative abundance of genera Bacteroides and Parabacteroides (Table 3) (Suppl. Figure 4C, D).
Table 3.
Relative abundance of dominant bacterial families (>1%) and genera that were altered in biopsies of active UC patients treated with two different doses of inulin-type fructans for 9 weeks.
| 7.5 g FOS/inulin group |
15 g FOS/inulin group |
|||||
|---|---|---|---|---|---|---|
| 0 week | 9 week | P value | 0 week | 9 week | P value | |
| Bifidobacteriaceae | 1.83 ± 0.63 | 2.53 ± 1.32 | NS | 1.88 ± 1.36 | 4.61 ± 2.19 | NS |
| Leuconostocaceae | 13.1 ± 2.07 | 19.1 ± 2.83 | NS | 15.2 ± 4.94 | 23.1 ± 7.40 | NS |
| Streptococcaceae | 2.86 ± 0.50 | 4.22 ± 0.86 | NS | 3.29 ± 1.16 | 4.55 ± 1.55 | NS |
| Erysipelotrichaceae | 1.85 ± 0.88 | 4.93 ± 3.74 | NS | 0.70 ± 0.37 | 1.25 ± 0.74 | NS |
| Ruminococcaceae | 4.61 ± 1.17 | 3.48 ± 1.42 | NS | 7.48 ± 2.29 | 8.28 ± 4.16 | NS |
| Lachnospiraceae | 14.0 ± 3.48 | 8.17 ± 1.86 | NS | 15.1 ± 3.74 | 17.1 ± 5.22 | NS |
| Bacteroidaceae | 16.8 ± 4.07 | 10.8 ± 3.22 | NS | 21.3 ± 2.37 | 8.30 ± 2.70 | 0.015 |
| Bacteroides | 16.8 ± 4.70 | 10.8 ± 3.22 | NS | 21.3 ± 2.37 | 8.30 ± 2.70 | 0.015 |
| Porphyromonadaceae | 1.91 ± 0.70 | 1.55 ± 0.94 | NS | 1.99 ± 0.71 | 0.46 ± 0.23 | 0.031 |
| Parabacteroides | 1.60 ± 0.70 | 1.20 ± 0.88 | NS | 1.51 ± 0.66 | 0.29 ± 0.16 | 0.031 |
| Bradyrhizobiaceae | 17.8 ± 7.54 | 20.7 ± 6.75 | NS | 1.61 ± 1.29 | 4.49 ± 4.47 | NS |
| Moraxellaceae | 2.95 ± 0.75 | 4.19 ± 1.04 | NS | 4.37 ± 1.50 | 4.60 ± 1.60 | NS |
| Enterobacteriaceae | 3.83 ± 1.13 | 3.24 ± 0.77 | NS | 4.70 ± 1.11 | 3.85 ± 1.28 | NS |
Taxonomic identification was achieved using 16S rDNA-tags pyrosequencing. Results are presented as means of the relative abundance (%) and standard error of the mean. NS = not significant.
These findings suggest both dose and site dependent effects of inulin-type fructans. Only the high dose β-fructans exerted a bifidogenic effect in fecal but not biopsy samples. The reduction of the abundance in the phylum Bacteroidetes in biopsy samples was also dose dependent. Therefore, future studies assessing the effect of dietary fibers on gut microbiota composition should clearly identify the doses used in the experimental set.
β-fructan-induced changes in fecal SCFA production
Short chain fatty acids are the end products of the fermentation by the intestinal microbiota. Carbohydrates are main substrates for colonic SCFA production, while branched-chain fatty acids (isobutyrate and isovalerate) are produced by fermentation of amino acids.25 To determine whether supplementation of β-fructans affected microbial metabolic activity, fecal SCFA were quantified. The initial amount of fecal total SCFA in both treatment groups was comparable (84 ± 15 µmol/g stool in 7.5 g/d dose versus 85 ± 21 µmol/g in 15 g/d dose) (Figure 7A) (Table 4). Supplementation with β-fructans for 9 weeks significantly increased total SCFA production in the high dose group (126 ± 24 µmol/g at week 9) (P = 0.03), but not in the low-dose group (Figure 7A). β-Fructans also altered the composition of SCFAs. Figure 7B–F shows changes in relative concentrations, expressed as a percentage to the total SCFA. Interestingly, the two doses showed divergent effect on SCFA composition. Fecal samples from patients on the 7.5 g/d dose β-fructans had a reduction in acetate concentration (P = 0.03) (Figure 7B), but concentrations of other SCFA were not different from baseline values. In contrast, branched-chain fatty acids were reduced in samples from patients consuming the high dose (isobutyrate P = 0.009; isovalerate P = 0.02) (Figure 7E,F), indicating that SCFA production from carbohydrates inhibited amino acid fermentation, likely by lowering the pH.26 A trend toward lower propionate production (P = 0.08) and improved butyrate production (P = 0.06) in the 15g/d dose was also observed (Figure 7C, D). Interestingly, by adding acetate and butyrate relative concentrations, a statistical significance was detected (P = 0.002) (Figure 7G), which could be explained by the increased abundance of acetate-producing Bifidobacteriacea and butyrate-producing Lachnospiraceae in the high dose group (Table 2).27
Figure 7.
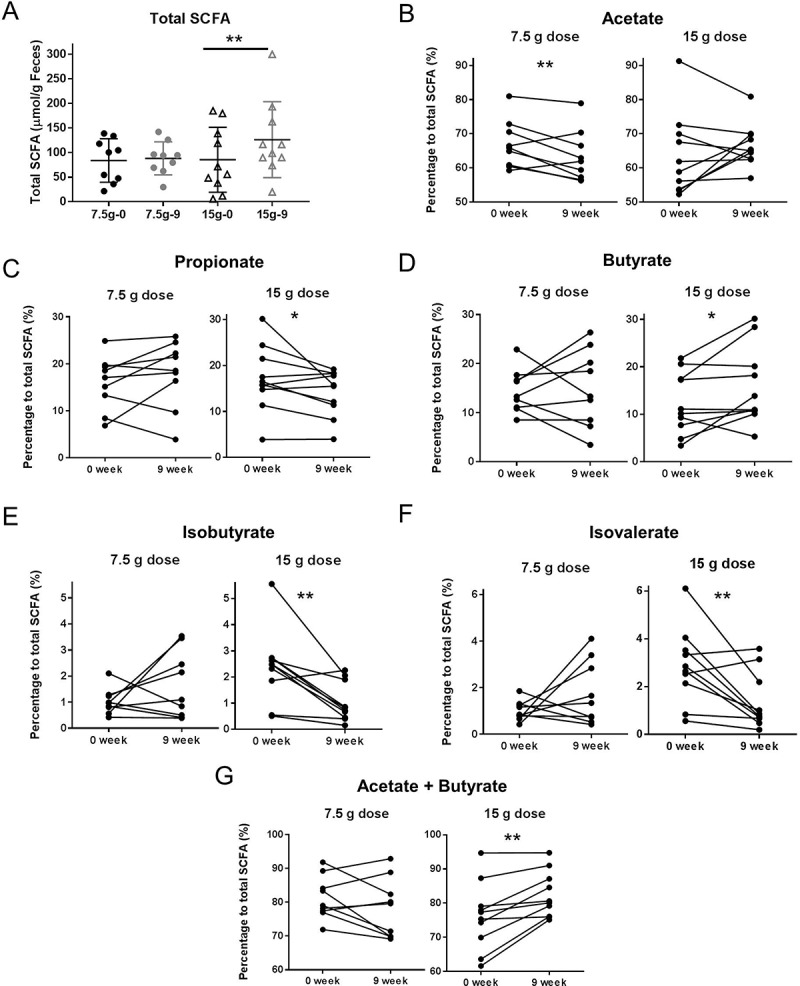
Short chain fatty acids measured in stool samples from patients treated with 7.5g/d dose or 15g/d dose β-fructans for 9 weeks. Individual SCFAs are shown as relative concentrations to total SCFA. (A) Total SCFA; Black color – measures at baseline (0 week); grey color – measures at end of the study (9 week); (●) 7.5 g/d low dose; (▲) 15 g/d high dose. (B) Acetate; (C) Propionate; (D) Butyrate; (E) Isobutyrate; (F) Isovalerate; (G) Acetate plus butyrate. “**” Means that significantly different from week 0 (P < 0.05). “*” Means a tread for significant difference from week 0 (P = 0.06).
Table 4.
Short chain fatty acids (SCFA) measured in stool samples from patients with active UC treated with 7.5 g/d or 15 g/d doses of β-fructans for 9 weeks.
| 7.5 g FOS/inulin group |
15 g FOS/inulin group |
|||||
|---|---|---|---|---|---|---|
| 0 week | 9 week | P value | 0 week | 9 week | P value | |
| Total SCFA (μmol/g) | 83.89 ± 14.78 | 88.17 ± 11.17 | NS | 85.39 ± 20.88 | 126.10 ± 24.41 | 0.02 |
| Acetate (%) | 66.90 ± 2.32 | 63.34 ± 2.51 | 0.03 | 63.76 ± 3.82 | 66.60 ± 2.01 | NS |
| Propionate (%) | 15.91 ± 1.91 | 17.85 ± 2.37 | NS | 17.16 ± 2.26 | 14.05 ± 1.59 | 0.08 |
| Butyrate (%) | 14.43 ± 1.46 | 14.88 ± 2.60 | NS | 12.35 ± 2.06 | 15.86 ± 2.60 | 0.06 |
| Isobutyrate (%) | 1.02 ± 0.16 | 1.64 ± 0.42 | NS | 2.38 ± 0.44 | 1.03 ± 0.23 | 0.009 |
| Isovalerate (%) | 1.01 ± 0.14 | 1.76 ± 0.45 | NS | 2.86 ± 0.50 | 1.36 ± 0.37 | 0.02 |
Individual SCFAs are shown as relative concentration (%) to total SCFA. Results are presented as means of the relative concentration (%) and standard error of the mean. Comparisons were performed using Wilcoxon matched-pairs signed rank test. NS = not significant.
The SCFA analysis was complemented by a quantification of the gene encoding butyryl-CoA transferase, representing a key enzyme in bacterial butyrate formation, and by quantification of mRNA encoding MCT1, a transport protein mediating butyrate transport in colonic epithelial cells.28 Neither butyryl-CoA transferase copy numbers nor MCT1 transcript levels differed between the two treatment groups at the end of the treatment period (Suppl. Figure 5). In addition, these two measurements did not correlate with fecal butyrate concentrations suggesting that other metabolic pathways might be complementing butyrate formation, or that butyryl-Co-A harboring bacteria are not enhanced in numbers but are metabolically more active.
Associations of the gut microbiota composition with intestinal inflammation in UC
To determine whether the changes in colonic inflammation were associated with compositional shifts of intestinal microbiota from stool and biopsy samples, a multivariate analysis employing principal component analysis (PCA), partial least squares discriminant analysis (PLS-DA), Wilcoxon signed rank test and Spearman’s correlation analysis was performed. Based on clinical response, patients were defined as non-responders (worsening in the clinical Mayo score or reduction of total Mayo score with ≤2) and responders (reduction of total Mayo score by ≥3, or entering remission with total Mayo < 2 at week 9).
PCA analysis plotting the shifts in microbial communities from stool and biopsy samples in association with clinical response (based on changes in total Mayo score) measured at week 9 subtracted from their baseline values showed no clear clustering between responding and non-responding patients (Suppl. Figure 6A, B), suggesting that at this small sample size we could not determine any significant changes in the overall bacterial community structure in association with inflammation. To further account for individual response, we performed a sub-group analysis of baseline versus end of study microbiota per response group (non-responders and responders) and sample type (stool and colonic biopsy) (Figure 8). The resulting PCA plots demonstrated no significant shifts in the stool microbiota at genus-level in association with clinical response (Figure 8A,B). Wilcoxon matched-pairs test confirmed the lack of significant differences in the genus relative abundance in the stool per response group. This finding suggests that fecal microbiota composition does not differentiate UC patients with active versus inactive disease. Interestingly the fecal taxa enhanced by β-fructans intake, notably fecal Ruminococcocaea, Bifidobacteriacea and Lachnospiraceae, showed no correlation with inflammatory markers (respectively P = 0.48, P = 0.37, P = 0.71), thus suggesting that the microbial groups induced by the studied fiber were not directly responsible for its clinical effect.
Figure 8.
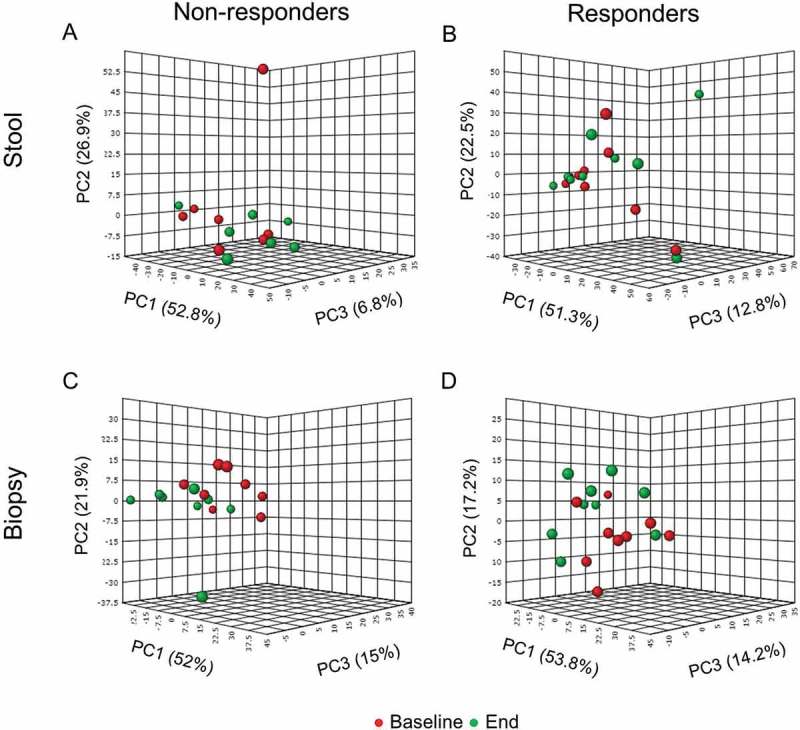
Principle component analysis (PCA) of stool (A) and (B) and biopsy (C) and (D) samples from patients with mild to moderate active UC based on abundance of bacterial groups at genus-level determined by 16SrRNA tags pyrosequencing. Based on clinical response patients were defined as non-responders (worsening in the clinical score or reduction of total Mayo score with ≤2) and responders (reduction of total Mayo score by ≥3, or entering remission with total Mayo < 2 at week 9). Red symbols (●) represent individual microbiota at baseline (0 week), green symbols (●) correspond to individual microbiota at the end of the study (9 week).
PCA analysis of the baseline versus end of study microbiota per response group (non-responders and responders) in biopsies also demonstrated a weak clustering particularly in the non-responders group (Figure 8C). The subsequent PLS-DA analysis of bacterial relative abundance at genus-level in biopsies from non-responders (Figure 9A) confirmed that the separation may be driven by increased relative abundance of Leuconostoc, Weissella and Coprobacillus (Figure 9C,E) at the end of study period. PLS-DA analysis of biopsy microbiota from responders also demonstrated clustering at baseline versus end of the study (Figure 9B). Variable importance in projection scores (VIP) and absolute regression coefficients (coefficients) identified Faecalibacterium and Clostridium as the only variables defining the group clustering in the responders’ biopsies (Figure 9D,F). Further longitudinal analysis of microbiota changes over the 9 weeks period of treatment validated these findings to be only relevant to non-responding patients (Table 5; Figure 10). Thus patients who did not improve showed a significant increase in the relative abundance of Leuconostoc (P = 0.015), Weissella (P = 0.015), Enterococcus (P = 0.039) and Acidovorax (P = 0.015) (Figure 10A–D), as well as significant reduction of Roseburia (P = 0.031) and Faecalibacterium (P = 0.039) relative abundance (Figure 11E,F).
Figure 9.
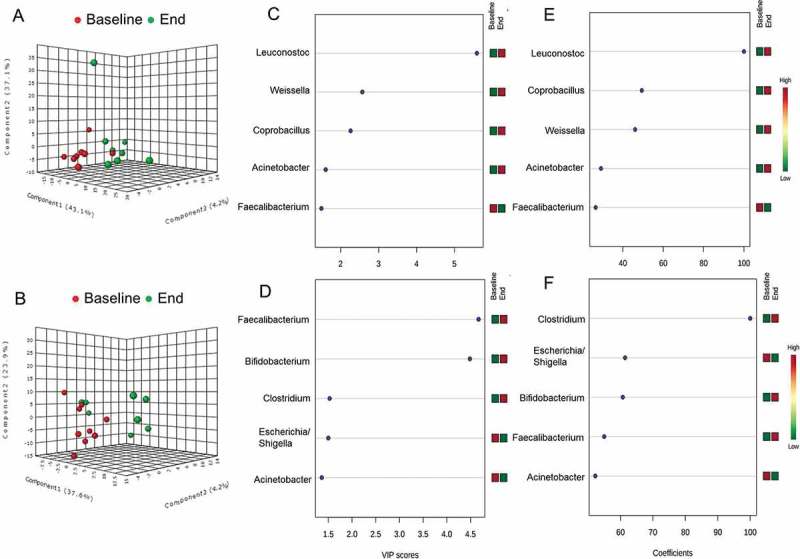
Effect of inflammation on colonic biopsy microbiota in patients with active ulcerative colitis treated with product Synergy1 for 9 weeks. Based on clinical response patients were defined as non-responders (worsening in the clinical score or reduction of total Mayo score with ≤2) and responders (reduction of total Mayo score by ≥3, or entering remission with total Mayo < 2 at week 9). Initial discriminant analysis was performed with partial least squares discriminant analysis (PLS-DA) at genus-level in the non-responders (A) and responders (B). Red symbols (●) represent individual microbiota at baseline (0 week), green symbols; (●) correspond to individual microbiota at the end of the study (9 week). Variable importance in projection (VIP) scores (C) and (D), and weighted sum of absolute regression coefficients (coef) (E) and (F) respectively for PLS-DA in non-responders and responders to treatment group were used for selection of variables that defined the group clustering. The colored boxes on the right indicate the relative abundance (low in green, high in red) of the corresponding bacterial genera at baseline and end of study.
Table 5.
Relative abundance of bacterial taxa in biopsies differentially present in responders and non-responders in patients with active UC after 9 weeks of combined treatment with 5-ASA and inulin-type β-fructans. Based on the clinical response patients were divided into responders (reduction of total Mayo by ≥3, or entering remission with total Mayo < 2 at week 9) and non-responders (worsening in the clinical score or reduction of total Mayo score with less than 3).
| Responders |
Non-Responders |
|||||
|---|---|---|---|---|---|---|
| 0 week | 9 week | P value | 0 week | 9 week | P value | |
| Firmicutes | 45.1 ± 4.40 | 52.7 ± 5.55 | NS | 46.9 ± 4.54 | 52.4 ± 5.01 | NS |
| Leuconostocaceae | 16.1 ± 3.41 | 15.6 ± 4.21 | NS | 11.7 ± 3.01 | 26.6 ± 4.81 | 0.0078 |
| Leuconostoc | 11.6 ± 2.40 | 10.8 ± 2.92 | NS | 8.34 ± 2.09 | 18.1 ± 2.96 | 0.015 |
| Weissella | 4.28 ± 1.02 | 4.36 ± 1.24 | NS | 3.13 ± 0.88 | 7.63 ± 1.86 | 0.015 |
| Enterococcaceae | 0.58 ± 0.17 | 0.47 ± 0.14 | NS | 0.37 ± 0.13 | 0.92 ± 0.21 | 0.015 |
| Enterococcus | 0.57 ± 0.17 | 0.43 ± 0.14 | NS | 0.36 ± 0.13 | 0.86 ± 0.20 | 0.039 |
| Ruminococcaceae | 5.02 ± 1.49 | 8.35 ± 3.32 | NS | 6.65 ± 1.92 | 2.19 ± 0.96 | 0.015 |
| Faecalibacterum | 1.99 ± 0.62 | 5.28 ± 2.28 | NS | 4.08 ± 1.15 | 1.34 ± 0.71 | 0.039 |
| Lachnospiraceae | 13.1 ± 2.94 | 14.7 ± 4.39 | NS | 17.5 ± 3.81 | 7.15 ± 2.10 | NS |
| Roseburia | 0.76 ± 0.22 | 0.68 ± 0.23 | NS | 0.81 ± 0.28 | 0.18 ± 0.07 | 0.031 |
| Proteobacteria | 23.7 ± 5.84 | 22.3 ± 7.3 | NS | 20.3 ± 8.01 | 28.2 ± 6.5 | NS |
| Comamonadaceae | 0.39 ± 0.12 | 0.27 ± 0.10 | NS | 0.33 ± 0.14 | 0.71 ± 0.18 | 0.107 |
| Acidovorax | 0.25 ± 0.09 | 0.19 ± 0.08 | NS | 0.21 ± 0.07 | 0.47 ± 0.12 | 0.015 |
Results are presented as means of the relative abundance (%) and standard error of the mean. Bacterial identification was achieved after 16S rDNA tags pyrosequencing. Wilcoxon matched-pairs signed rank test was used in the comparison and P < 0.05 was considered significant. NS = not significant.
Figure 10.
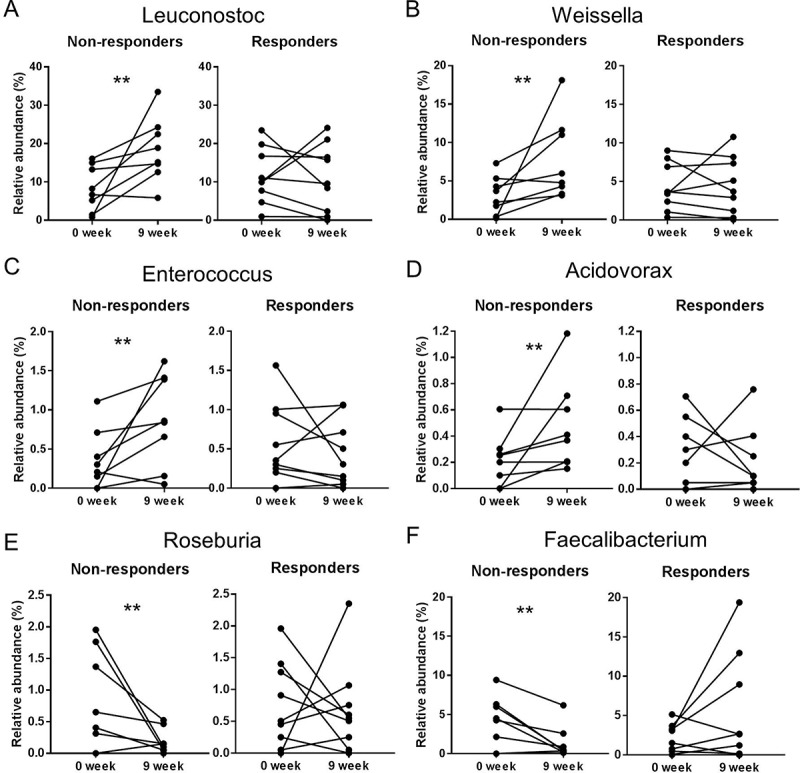
Changes in the relative abundance of bacterial groups (genus-level) from biopsy samples of patients with active mild to moderate ulcerative colitis who showed no clinical improvement (non-responders) (n = 11) and clinical improvement (responders) (n = 14) following treatment with two doses of inulin-type β-fructans for 9 weeks. Changes were determined by Wilcoxon matched-pairs signed rank test comparing relative abundance at the end of the study (week 9) versus the baseline (week 0). “**” Means that significantly different from week 0 (P < 0.05). (A) Leuconostoc (P = 0.0156); (B) Weissella (P = 0.0156); (C) Enterococcus (P = 0.0391); (D) Acidovorax (P = 0.0156); (E) Faecalibacterium (P = 0.0391); (F) Roseburia (P = 0.0313). Taxonomic identification was achieved using 16S rRNA gene-tag pyrosequencing.
Figure 11.
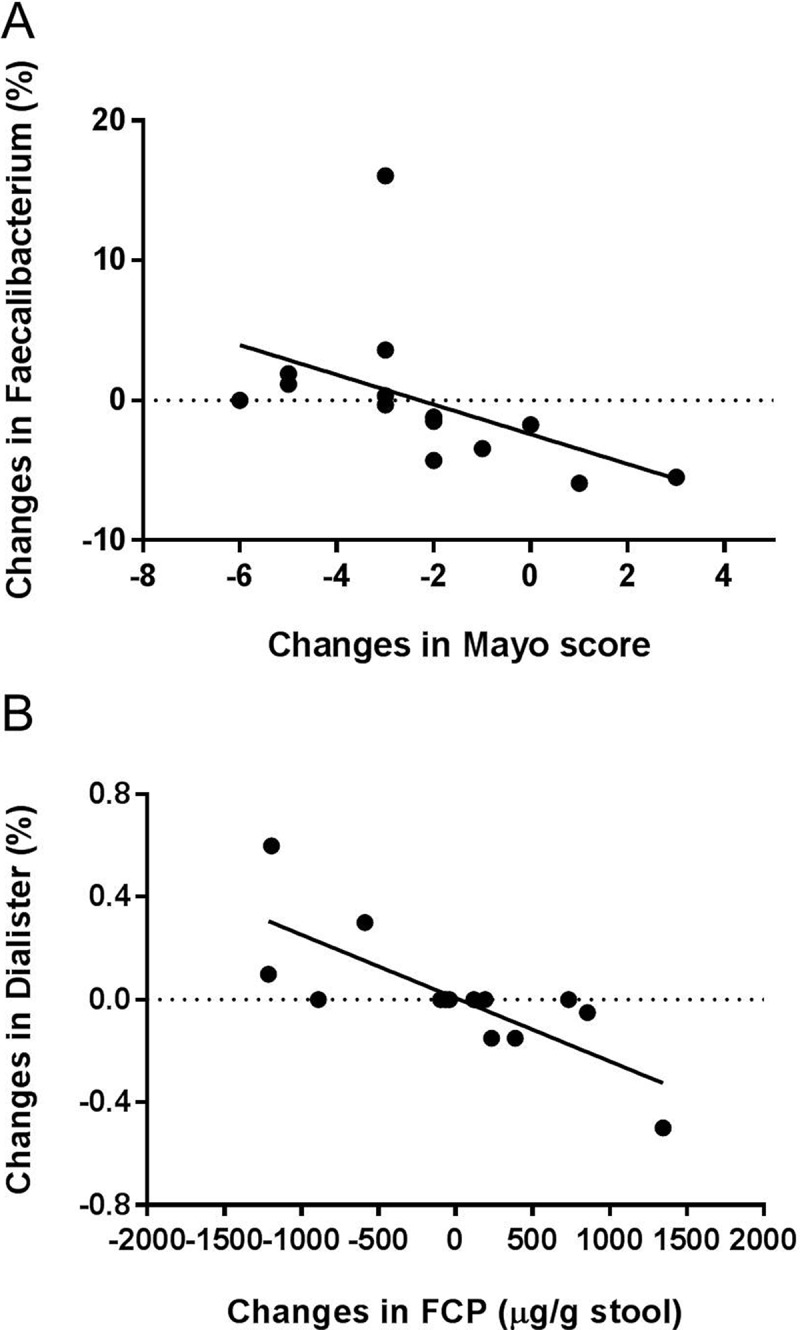
Spearman correlation analysis between disease activity measured by fecal calprotectin and Mayo score with (A) Faecalibacterium (r = −0.82, q = 0.024) and (B) Dialister (r = −0.83, q = 0.007) from biopsy samples of patients with mild to moderate active UC. Values represent the changes in the studies parameters (Mayo score, fecal calprotectin, bacterial taxa) measured at week 9 subtracted from their baseline values.
The diversity of mucosal microbiota, measured by Shannon’s and Simpson’s indices, was negatively correlated to colonic inflammation as assessed by fecal calprotectin (r = −0.64, P = 0.001 for Shannon’s index; r = −0.55, P = 0.008 for Simpson’s index respectively). Spearman’s correlation analysis corrected by FDR confirmed significant associations between colonic inflammation and mucosa-associated bacterial community. The reduction of colitis was strongly associated with increased abundance of the strict anaerobes Faecalibacterium (r = −0.82 q = 0.024, Figure 11A), and Dialister (r = −0.83, q = 0.007, Figure 11B). Butyrate-producing Roseburia and Faecalibacterium were reported to be under-represented in UC and have been suggested to be anti-inflammatory.8–10 Under-representation of Dialister was reported in CD patients29 but not in UC. Dialister was associated with reduced plasma IL-6 concentrations in healthy subjects consuming whole grains.30 Our results demonstrated that this taxon was virtually absent in biopsy samples from all inflamed patients at the end of the study. Therefore, Dialister seems to be associated with reduced colonic inflammation in UC. Interestingly, mucosa-associated Bacteroidaceae and Porphyromnadaceae that were altered by the 15 g/d high dose β-fructan treatment produced no associations with inflammatory markers. It is therefore very likely that the detected correlations are a result of the inflammation and not a cause.
Changes in SCFA pattern in association with colitis reduction
To identify if inflammation was associated with colonic microbiota activity, a correlation analysis of shifts in SCFA concentrations and inflammation markers was performed. Patients who improved clinically in their colitis (reduction in Mayo score by ≥3 or at remission at the end of the study period, responders) had overall higher concentrations of total SCFA at the beginning of the study (98 ± 19 µmol/g stool) in comparison to non-responders (64 ± 16 µmol/g stool), although these differences were not significant (P = 0.15) (Figure 12A; Table 6). At the end of the treatment period, only responders showed significantly enhanced total SCFA production (135 ± 22 µmol/g stool) (P = 0.02), while non-responders remained with lower SCFA concentrations (79 ± 13 µmol/g stool) (Figure 12A) (Table 6). Changes in colitis inflammation were associated with shifts in SCFA as well. Figure 12B–F shows the changes in the relative concentrations, expressed as a percentage to the total SCFA, Table 6 summarizes the SCFA relative concentrations per response group and time point. Butyrate production was significantly enhanced at the end of the study only in the responders compared to their baseline value (P = 0.04, Wilcoxon matched-pairs signed rank test) (Figure 12D). Shifts in butyrate relative concentrations (expressed as a percentage to total SCFA) were inversely correlated with the inflammation measured by Mayo score (r = −0.50; P = 0.036) (Figure 12G). Branched-chain fatty acids isobutyrate and isovalerate were also significantly reduced in responding patients (isobutyrate P = 0.01; isovalerate P = 0.04) (Figure 12E,F). However, changes in their concentrations did not directly correlate with the Mayo score or fecal calprotectin. Interestingly, the same SCFAs and BCFAs (butyrate, isobutyrate, and isovalerate) that differed between responders and non-responders were also identified to be significantly altered through the high β-fructan dose. These findings suggest that the prebiotic activity of β-fructans is based on a metabolic effect of the intestinal microbiota in UC patients reflected by changes in fecal SCFA patters towards increased butyrate production.
Figure 12.
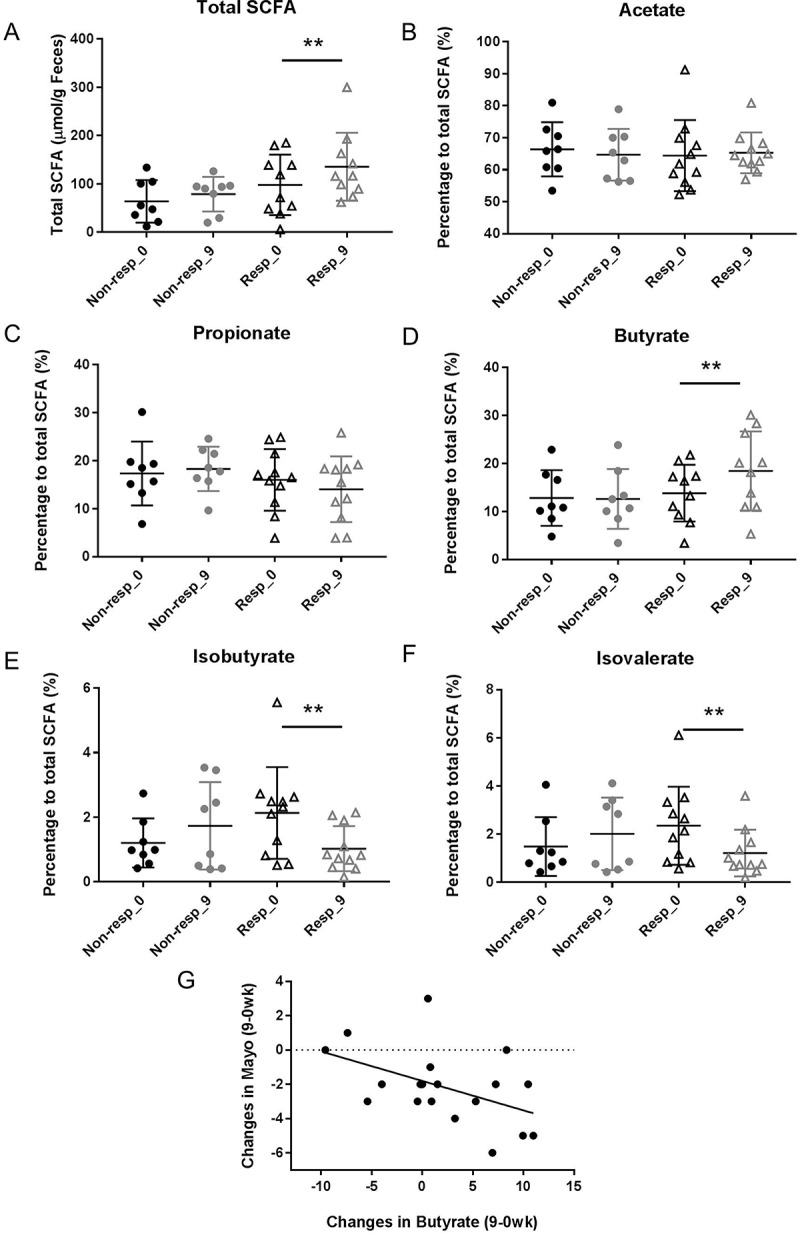
Short chain fatty acids measured in stool samples from patients who showed no clinical improvement (non-responders) (n = 11) and clinical improvement (responders) (n = 14) following treatment with two doses of inulin-type β-fructans for 9 weeks. Individual SCFAs are shown as relative concentrations to total SCFA. Black color – measures at baseline (0 week); grey color – measures at end of the study (9 week); (●) non-responders; (▲) responders. (A) Total SCFA; (B) Acetate; (C) Propionate; (D) Butyrate; (E) Isobutyrate; (F) Isovalerate. “**” Means that significantly different from week 0 (P < 0.05) (Wilcoxon matched-pairs signed rank test); (G) Spearman correlation analysis between the changes in Mayo score and changes in butyrate relative concentrations (r = −0.50, P = 0.036).
Table 6.
Short chain fatty acids (SCFA) measured in stool samples from UC patients with active mild to moderate disease that show clinical improvement (responders) or no clinical improvement (non-responders) following treatment with β-fructans for 9 weeks.
| Responders |
Non-responders |
|||||
|---|---|---|---|---|---|---|
| 0 week | 9 week | P value | 0 week | 9 week | P value | |
| Total SCFA (μmol/g) | 97.98 ± 19.76 | 135.5 ± 22.23 | 0.021 | 63.89 ± 15.52 | 78.74 ± 12.7 | NS |
| Acetate (%) | 46.42 ± 3.34 | 65.31 ± 1.91 | NS | 66.39 ± 2.99 | 64.70 ± 2.86 | NS |
| Propionate (%) | 16.01 ± 1.93 | 14.07 ± 2.07 | NS | 17.34 ± 2.35 | 18.30 ± 1.64 | NS |
| Butyrate (%) | 13.82 ± 1.87 | 18.44 ± 2.60 | 0.040 | 12.81 ± 2.05 | 12.62 ± 2.20 | NS |
| Isobutyrate (%) | 2.13 ± 0.43 | 1.02 ± 0.43 | 0.018 | 1.20 ± 0.27 | 1.73 ± 0.48 | NS |
| Isovalerate (%) | 2.34 ± 0.49 | 1.21 ± 0.29 | 0.04 | 1.48 ± 0.43 | 2.01 ± 0.53 | NS |
Individual SCFAs are shown as relative concentration (%) to total SCFA. Results are presented as means of the relative concentration (%) and standard error of the mean. Comparisons were performed using Wilcoxon matched-pairs signed rank test. NS = not significant.
Discussion
IBD is associated with an altered intestinal microbiota31–33 and dietary intervention to redress these patterns may be a successful approach for the treatment of mild to moderately active IBD. Fructans reduced colitis in rat colitis model,14,34 but studies related to their clinical efficacy are limited. Previous clinical studies using β-fructans in active UC applied short treatment duration for 14 days, which may be insufficient to assess clinical as well as endoscopic efficacy, and did not assess potential protective mechanisms.17,18 This pilot study shows that consumption of β-fructans for 9 weeks by patients with active UC induced dose-dependent clinical benefits, and provides evidence on the distinct responses of luminal (as fecal) and mucosa-associated bacterial communities. Fecal microbiota responded primarily to β-fructan supplementation while the mucosal microbiota responded to inflammation. Our findings argue that only the higher dose of 15 g/d dose resulted in clinical benefits that were associated with improved butyrate production unrelated to specific bacterial taxa.
Most studies assessing the gut microbiota are based on the analysis of fecal samples because they are easily collected in a non-invasive manner. However, it is known that fecal communities poorly represent the bacterial communities living in the GI tract.24,35 Our analysis detected great differences of mucosal and fecal microbiota.36–38 The disparity between fecal and mucosal microbiome within individuals was also confirmed.39–41 In keeping with the presence of oxygen gradient at the interface of aerobic host tissue and the anaerobic gut lumen, fecal microbiota was dominated by strict anaerobic Bacteriodetes and Firmicutes, whereas facultative anaerobic Proteobacteria and Leuconostocaceae were the most abundant taxa in UC mucosal microbiota. However, even strict anaerobes as F. prausnitzii may grow at oxic-anoxic interphase when exogenous antioxidants, e.g. riboflavine and glutathione, are present.40 Major finding of this study was the effectiveness of β-fructans to reduce colitis at a dose of 15 g/d. The high dose of inulin and fructo-oligosaccharides supported the growth of a wider range of β-fructans-fermenting bacteria such as Lachnospiraceae and Bifidobacteriaceae and an induction of butyrate and acetate production. This could potentially be explained by the concurrent stimulation of Bifidobacterium and Lachnospiraceae (Anaerostipes, Eubacterium) by inulin which was previously observed in healthy adults and obese women.42,43 Inulin-type fructans are co-metabolized by acetate- and butyrate- producing bacterial taxa when a greater amount of the fiber is consumed (12–16 grams). Importantly, the abundance of mucosal Bacteroidetes decreased after the administration of the high dose inulin-type fructans, a result that has been previously reported to be likely due to a reduction in pH as a result of SCFA production.44 This result also validated that the observed ß-fructans effect on the fecal and mucosal microbiota is a common outcome (as in healthy adults and obese women),42,43 and irrespective of intestinal inflammation.
While changes in the fecal microbiome were mainly associated with the consumption of β-fructans, alterations of mucosa-associated microbiota were more connected to disease progression and intestinal inflammation. Colonic inflammation was associated with decreased richness of phylotypes, in addition to decreased abundance of strict anaerobes in the mucosa-associated microbial community, confirming previous observations.8,45 Specific bacterial taxa at mucosal sites but not in fecal samples were associated with colonic inflammation, supporting the hypothesis that mucosal microbes have greater impact on the host immune response compared to the fecal microbiome.46,39 However, our comparison of the microbiota shifts in responders and non-responders revealed that significant shifts were only found in non-responders, and they constituted mainly of an increase in bacteria that are facultative anaerobes and therefore likely to tolerate an increase in redox potential mediated by inflammation, while strict anaerobic bacteria decreased. The mucosal microbiome of non-responding patients particularly contained a high proportion of Leuconostoc spp. and Weissella spp. Occurrence of these food fermenting, heterofermentative lactic acid bacteria in human mucosal microbiota is uncommon but not unprecedented.37,47 Comparable to their role in other, food-related ecosystems, Weissella and Leuconostoc spp. may act as antagonists to the facultative anaerobic Enterobacteriaceae.48 These taxa were not associated with the inulin intake, and their abundance did not correlate to clinical outcomes; we therefore argue that this finding suggests that most of the differences in composition of mucosal microbiota are the consequence of the inflammatory state and not the cause of the benefits induced by the prebiotic substrate.
In contrast, our study established an induction of butyrate production by β-fructans as well as significantly higher butyrate production in responding patients versus non-responders with strong negative correlations between butyrate levels and clinical symptoms (Mayo score). These findings suggest that an induction of the anti-inflammatory butyrate is the likely mechanism for the benefits of β-fructans in UC. Overall, butyrate synthesis (in combination with acetate) was increased in the high dose treatment group, hence supporting the hypothesis that β-fructans reduce colonic inflammation possibly through the stimulation of butyrate-producing bacteria and their activity, as recently documented in other inflammatory conditions.49 A significant reduction of the branched-chain fatty acids isobutyrate and isovalerate was also noticed in those patients who had improvement in disease, however further correlation analysis did not support a direct association with inflammation. The biological function of isobutyrate and isovalerate in the gut is not well studied. Some studies showed a direct association with colonic inflammation in a rat colitis model,50 or an increase during pregnancy and lactation with no association to colonic health,51 but also protective function acting as an inhibitor to human monocarboxylate transporter 4 expressed in cancerous tissue.52 The detected reduction of isovalerate and isobutyrate was a result of a redirection in the bacterial metabolism towards more saccharolytic fermentation. Overall, our correlation analysis suggests that the beneficial effects of β-fructans are caused by an increase in butyrate formation but not a reduction of branched-chain fatty acids. Therefore improvement of butyrate production by colonic microbiota should be regarded as a potential target for treatment of immune dysfunction in patients.
Findings of this study established that the fructan-induced compositional shifts showed only insignificant associations with disease activity measured by well accepted disease indices. Therefore, our findings support the proposal by Bindels et al.53 to shift the focus of prebiotic applications away from the compositional microbiota shifts (which can not only be dose dependent but also independent from or the result of the physiological effects of the prebiotic), towards functional features of the microbiota more likely to be more relevant for host physiology, such as butyrate which has an established role in preventing inflammation.13
Some limitations must be considered when interpreting our results. First, this is a pilot exploratory study, and the small sample size necessitates caution in interpretation of conclusions related to clinical outcomes. The lack of a placebo control constitutes a weakness of the study to differentiate the independent effects of inflammation, medications, or diet,54 although our focus was to directly test the safety and efficiency of two different doses of β-fructans. To reduce the effect of inflammation and medication, only patients with similar disease status (mild to moderate ulcerative colitis, predominantly left-sided) and on stable dose of 5-ASA were included in the study. In addition, we measured many parameters in small groups, so we cannot rule out that some of the statistically significant changes are due to randomness rather than the intervention.
In conclusion, this small pilot exploratory study suggests that intake of 15 g/d inulin-type fructans throughout a 9-week study period improved markers of UC and induced significant changes in the intestinal microbiota when compared to baseline and a lower, 7.5 g/d dose, and identified increased numbers of Bifidobacteriaceae and butyrate-producing Firmicutes from Lachnospiraceae as the most relevant responses in the microbiota to the intervention. However, these shifts were not associated with the clinical improvement in colonic inflammation induced by β-fructans. In contrast, improvements in inflammation were associated with an increase in butyrate production. These findings suggest that high dose chicory-derived inulin-type fructan treatment improves colitis through a modification of gut microbiota metabolism, establishing a promise as adjunct treatment of mild to moderate UC. Well-powered placebo-controlled studies with these prebiotics are warranted.
Materials and methods
Patients, inclusion and exclusion criteria
Patients aged 18 – 65 years with histological and endoscopic confirmed diagnosis and mild to moderately active ulcerative colitis with clinical score in the range of 3 – 8 on the 12 point Mayo Clinical Score scale55 were eligible to participate. Inclusion criteria were treatment on stable doses of 5-aminosalicylic acid (5-ASA) or no medication for at least 2 weeks prior to the start of the trial, negative tests for Clostridium difficile toxin and stool pathogens.
Exclusion criteria were the use of oral steroids 1 month prior to the trial, use of antibiotics within 2 weeks before the study, use of immunosuppressives or anti-TNF agents 3 months before the trial, or anti-diarrheal drugs within 1 week of the screening visit.
Patients matching the inclusion and exclusion criteria were approached and only those who provided written informed consent were recruited into the study. The research protocol was approved by Health Research Ethics Board at the University of Alberta. The study is publicly accessible at the U.S. National Institute of Health database (Registration number NCT02093767)
Study design and medication
In this feasibility pilot study, eligible patients were randomly assigned to one of two doses of inulin-type fructans. Patients consumed either 7.5 g or 15 g of oligofructose-enriched inulin (Orafti®Synergy1) daily for 9 weeks. At the screening visit, each patient’s demographic characteristics, medical history and current medications were recorded (Table 1). Total Mayo score including endoscopic disease assessment of the mucosa was determined at baseline and at week 9. Biopsy samples (taken 15–20 cm from the anal verge) and fecal specimens for microbiome analysis and fecal calprotectin assay were collected at entry and at week 9.
Oligofructose-enriched inulin (Orafti®Synergy1) is a combination of chicory-derived inulin with selected chain lengths, enriched by a specific fraction of oligofructose, produced by partial hydrolysis of chicory inulin in an about 50/50 ratio. The preparation was provided by Beneo – Orafti (Tienen, Belgium). Fructo-oligosaccharides and inulin from chicory are β-(2→1)-linked polyfructans with a degree of polymerization ranging mainly between 2 – 8 and 2 – 60, respectively.
Clinical outcome
The primary end point of clinical response was defined as a decrease in the Mayo score of ≥3 compared to baseline in patients that remained with active disease (a Mayo score of ≥3) or an induction of clinical remission after 9 weeks of treatment (Mayo score < 2), a definition used in the Applied Clinical Trials [ACT] 1 and 2.19 Patients meeting these criteria were defined as clinical responders. Patients who did not meet these criteria were defined as non-responders.
Faecal calprotectin and short chain fatty acids
The BÜHLMANN Calprotectin ELISA test kit (ALPCO Diagnostics, NH, USA) was used following the manufacturer’s instructions to detect Calprotectin in fecal samples. The results are based on two independent ELISA experiments. Short-chain fatty acids (SCFA) were extracted from stool sample in 5% phosphoric acid and analyzed by gas chromatography as previously described.56 Total SCFA concentrations were calculated as a sum of all measured volatile fatty acids. Individual SCFAs were expressed as a relative percentage to total measured SCFA.
Genomic DNA extraction from feces and mucosal biopsies
Genomic DNA from stool and biopsies was extracted using the QIAamp DNA Stool Mini Kit (Qiagen, Mississauga, ON, Canada) with additional steps to assure bacterial cell lysis of gram positive bacteria. Briefly the samples were homogenized in 1 ml of TN150 buffer (10 mM Tris-HCl, 150 mM NaCl [pH 8.0]) followed by incubation with SDS (10% w/v) and proteinase K (20 mg ml−1) at 55°C for 2h. The cells were then physically disrupted with zirconium beads (diameter 0.1 mm) (500 mg) in a FastPrep-24 (MP Biomedicals, Solon, OH) in 3 cycles of 30-second bead-beating step at 4 m/s speed followed by cooling on ice for 5 min each. Subsequently, the samples were heated at 95°C for 15 min and further processed according to the kit protocol.
Total RNA extraction and reverse-transcription PCR
Total RNA from biopsies was isolated in TRIzol (Invitrogen, Burlington, ON, Canada) using the RNeasy kit (Qiagen). The total RNA concentration of each sample was quantified on NanoDrop ND-1000 Spectrophotometer (NanoDrop Technologies, Wilmington, USA) and 500 ng of the purified RNA was subjected to reverse transcription using QuantiTect Reverse Transcription kit (Qiagen).
Quantitative PCR
Quantitative PCR (qPCR) was performed on 7900HT Fast Real-Time PCR System (Applied Biosystems, Foster City, CA). Each reaction was run in duplicate in 20 μl consisting of 10 μl (2x) QuantiFast SYBR Green master mix (Qiagen), 1 μl (10 μM) of primers, and 1 μl (100 ng) of template DNA or cDNA. Absolute quantification of butyryl-coenzyme A (CoA) CoA transferase57 was achieved using standard curve generated by 10-fold serial dilutions of a PCR product with known concentration. Primer specificity was verified by determining the amplicon melting curve. Gene expression of monocarboxylate transporter 1 (MCT-1)58 was calculated by the 2−ΔΔCt method. Glyceraldehyde phosphate dehydrogenase (GAPDH) was used as a housekeeping gene for normalization of the cDNA levels.59 Biopsy samples collected at the entry of the study were used as the calibrator samples. The negative controls contained water or RT negative RNA instead of template DNA.
Sequencing and bioinformatic analysis of 16S rRNA sequence tags
Pyrosequencing using Roche 454 GS-FLX Titanium protocol was performed as previously described.60 Sequence analysis was conducted with Quantitative Insights Into Microbial Ecology (QIIME) pipeline.61 The total number of sequences used in the taxonomy based analysis was 198,919 for feces and 369,867 for biopsies for an average number of sequences of 5,526 ± 358 and 9,247 ± 786 for stool and biopsy samples, respectively. Operational taxonomic units (OTUs) were defined by clustering sequences using the UCLUST algorithm and a similarity threshold of 97% against the Greengenes database. The seed of each OTU was extracted as representative sequences. Non-abundant OTUs with a minimal counts fraction less than 0.00005 were filtered out from OTU table, as recommended by QIIME developers. Representative sequences were aligned with PyNAST, and the alignment filtered to remove positions that are gaps in all sequences. The alignment was used to build a phylogenetic tree with the FastTree algorithm. Core diversity analyses, including principal coordinate analysis (PcoA) and taxonomy assignments (with the RDP classifier), were performed on the filtered OTUs table and the phylogenetic tree created as above, using the core_diversity_analyses.py script of QIIME and a subsampling depth of 2000 sequences.
Species richness and diversity were estimated by Shannon and Simpson diversity indices and UniFrac, both metrics performed in QIIME.
Statistical analysis
Results are expressed as mean ± standard error of the mean (SEM). Data analysis was performed using GraphPad Prism (version 7.00, San Diego, CA). Within-individual differences in disease markers and microbiota relative abundance was tested using Wilcoxon matched-pairs signed rank test. Only taxa with average abundances > 0.1%, P values < 0.05, and low q values (i.e., low risk of false discovery) were considered significant. Principle component analysis (PCA) and partial least squares discriminant analysis (PLS-DA) of microbiota was performed using MetaboAnalyst (version4.0).62 Correlations between patient inflammatory markers and bacterial populations were assessed by Spearman’s correlation test followed by positive false discovery rate (FDR, q value) with the SAS multi-test procedure (PROC MULTTEST) to adjust p values for multiple comparisons. The numerical value of the change of a given tested parameter (parameter X, ΔX = X 9 weeks – X 0 weeks) was used in both PCA and correlation analyses.
Funding Statement
This study was sponsored by an Operating grant from the Canadian Institutes of Health Research (CIHR MOP-81396), Grants in Aid from the Crohn’s and Colitis Foundation of Canada (CCFC G599000767) and an industry grant from Beneo-Orafti. Dr. R. Valcheva was the recipient of a fellowship from the Canadian Association of Gastroenterology-CIHR-Abbott.
Acknowledgments
We would like to thank X. Sun and A. Farrant for their technical assistance. GILDR group at the University of Alberta Hospital is acknowledged for the clinical assistance in recruiting patients for the study. M. Sailer and S. Theis are acknowledged for the critical reading and recommendations during the manuscript preparation.
Conflict of Interest
L. Dieleman received research grants from CIHR, Broad Foundation, Agriculture Funding Consortium, and consultancy fees from Abbvie, Shire, Takeda, Johnson & Johnson for biologics unrelated to the submitted study. M. Gänzle received research grants from NSERC, ALMA, Al Bio, Ernst Böcker GmbH & Co, KG, Mindel as well honorarium as visiting professor at Hibei University of Technology, China. For the remaining authors none were declared.
Supplementary data
Supplemental data for this article can be accessed on the publisher’s website.
References
- 1.Duchmann R, Kaiser I, Hermann E, Mayet W, Ewe K, Meyer Zum Büschenfelde KH.. Tolerance exists towards resident intestinal flora but is broken in active inflammatory bowel disease (IBD). Clin Exp Immunol. 1995;102(3):448–455. [DOI] [PMC free article] [PubMed] [Google Scholar]
- 2.Rath HC, Herfarth HH, Ikeda JS, Grenther WB, Hamm TE Jr, Balish E, Taurog JD, Hammer RE, Wilson KH, Sartor RB. Normal luminal bacteria, especially Bacteroides species, mediate chronic colitis, gastritis, and arthritis in HLA-B27/human beta2 microglobulin transgenic rats. J Clin Invest. 1996;98(4):945–953. doi: 10.1172/JCI118878. [DOI] [PMC free article] [PubMed] [Google Scholar]
- 3.Sellon RK, Tonkonogy S, Schultz M, Dieleman LA, Grenther W, Balish E, Rennick DM, Sartor RB. Resident enteric bacteria are necessary for development of spontaneous colitis and immune system activation in interleukin-10-deficient mice. Infect Immun. 1998;66(11):5224–5231. [DOI] [PMC free article] [PubMed] [Google Scholar]
- 4.Rogler G. Interaction between susceptibility and environment: examples from the digestive tract. Dig Dis. 2011;29(2):136–143. doi: 10.1159/000323876. [DOI] [PubMed] [Google Scholar]
- 5.Ott SJ, Plamondon S, Hart A, Begun A, Rehman A, Kamm MA, Schreiber S. Dynamics of the mucosa-associated flora in ulcerative colitis patients during remission and clinical relapse. J Clin Microbiol. 2008;46(10):3510–3513. doi: 10.1128/JCM.01512-08. [DOI] [PMC free article] [PubMed] [Google Scholar]
- 6.Scanlan PD, Shanahan F, O’Mahony C, Marchesi JR. Culture-independent analyses of temporal variation of the dominant fecal microbiota and targeted bacterial subgroups in Crohn’s disease. J Clin Microbiol. 2006;44(11):3980–3988. doi: 10.1128/JCM.00312-06. [DOI] [PMC free article] [PubMed] [Google Scholar]
- 7.Walker AW, Sanderson JD, Churcher C, Parkes GC, Hudspith BN, Rayment N, Brostoff J, Parkhill J, Dougan G, Petrovska L. High-throughput clone library analysis of the mucosa-associated microbiota reveals dysbiosis and differences between inflamed and non-inflamed regions of the intestine in inflammatory bowel disease. BMC Microbiol. 2011;11:7. doi: 10.1186/1471-2180-11-7. [DOI] [PMC free article] [PubMed] [Google Scholar]
- 8.Machiels K, Joossens M, Sabino J, De Preter V, Arijs I, Eeckhaut V, Ballet V, Claes K, Van Immerseel F, Verbeke K, et al. A decrease of the butyrate-producing species Roseburia hominis and Faecalibacterium prausnitzii defines dysbiosis in patients with ulcerative colitis. Gut. 2014;63(8):1275–1283. doi: 10.1136/gutjnl-2013-304833. [DOI] [PubMed] [Google Scholar]
- 9.Willing BP, Dicksved J, Halfvarson J, Andersson AF, Lucio M, Zheng Z, Järnerot G, Tysk C, Jansson JK, Engstrand L. A pyrosequencing study in twins shows that gastrointestinal microbial profiles vary with inflammatory bowel disease phenotypes. Gastroenterology. 2010;139(6):1844–1854.e1. doi: 10.1053/j.gastro.2010.08.049. [DOI] [PubMed] [Google Scholar]
- 10.Rajilić-Stojanović M, Shanahan F, Guarner F, de Vos WM. Phylogenetic analysis of dysbiosis in ulcerative colitis during remission. Inflamm Bowel Dis. 2013. March;19(3):481–488. doi: 10.1097/MIB.0b013e31827fec6d. [DOI] [PubMed] [Google Scholar]
- 11.Jonkers D, Penders J, Masclee A, Pierik M. Probiotics in the management of inflammatory bowel disease: a systematic review of intervention studies in adult patients. Drugs. 2012;72(6):803–823. doi: 10.2165/11632710-000000000-00000. [DOI] [PubMed] [Google Scholar]
- 12.Flint HJ, Scott KP, Duncan SH, Louis P, Forano E. Microbial degradation of complex carbohydrates in the gut. Gut Microbes. 2012;3(4):289–306. doi: 10.4161/gmic.19897. [DOI] [PMC free article] [PubMed] [Google Scholar]
- 13.Yan Y, Hu Y, Gänzle MG. Prebiotics, FODMAPs and dietary fibre –conflicting concepts in development of functional food products? Curr Op Food Sci. in press. [Google Scholar]
- 14.Koleva PT, Valcheva RS, Sun X, Gänzle MG, Dieleman LA. Inulin and fructo-oligosaccharides have divergent effects on colitis and commensal microbiota in HLA-B27 transgenic rats. Br J Nutr. 2012;108(9):1633–1643. doi: 10.1017/S0007114511007203. [DOI] [PubMed] [Google Scholar]
- 15.Bindels LB, Neyrinck AM, Salazar N, Taminiau B, Druart C, Muccioli GG, François E, Blecker C, Richel A, Daube G, et al. Non digestible oligosaccharides modulate the gut microbiota to control the development of leukemia and associated cachexia in mice. PLoS One. 2015;10(6):e0131009. doi: 10.1371/journal.pone.0131009. [DOI] [PMC free article] [PubMed] [Google Scholar]
- 16.Benjamin JL, Hedin CR, Koutsoumpas A, Ng SC, McCarthy NE, Hart AL, Kamm MA, Sanderson JD, Knight SC, Forbes A, et al. Randomised, double-blind, placebo-controlled trial of fructo-oligosaccharides in active Crohn’s disease. Gut. 2011;60(7):923–929. doi: 10.1136/gut.2010.232025. [DOI] [PubMed] [Google Scholar]
- 17.Casellas F, Borruel N, Torrejón A, Varela E, Antolin M, Guarner F, Malagelada JR. Oral oligofructose-enriched inulin supplementation in acute ulcerative colitis is well tolerated and associated with lowered faecal calprotectin. Aliment Pharmacol Ther. 2007;25(9):1061–1067. doi: 10.1111/j.1365-2036.2007.03288.x. [DOI] [PubMed] [Google Scholar]
- 18.Furrie E, Macfarlane S, Kennedy A, Cummings JH, Walsh SV, O’neil DA, Macfarlane GT. Synbiotic therapy (Bifidobacterium longum/Synergy 1) initiates resolution of inflammation in patients with active ulcerative colitis: a randomised controlled pilot trial. Gut. 2005;54(2):242–249. doi: 10.1136/gut.2004.044834. [DOI] [PMC free article] [PubMed] [Google Scholar]
- 19.Rutgeerts P, Sandborn WJ, Feagan BG, Reinisch W, Olson A, Johanns J, Travers S, Rachmilewitz D, Hanauer SB, Lichtenstein GR, et al. Infliximab for induction and maintenance therapy for ulcerative colitis. N Engl J Med. 2005;353(23):2462–2476. doi: 10.1056/NEJMoa050516. [DOI] [PubMed] [Google Scholar]
- 20.Theede K, Holck S, Ibsen P, Kallemose T, Nordgaard-Lassen I, Nielsen AM. Fecal calprotectin predicts relapse and histological mucosal healing in Ulcerative colitis. Inflamm Bowel Dis. 2016;22(5):1042–1048. doi: 10.1097/MIB.0000000000000736. [DOI] [PubMed] [Google Scholar]
- 21.Bruhwyler J, Carreer F, Demanet E, Jacobs H. Digestive tolerance of inulin-type fructans: a double-blind, placebo-controlled, cross-over, dose-ranging, randomized study in healthy volunteers. Int J Food Sci Nutr. 2009;60(2):165–175. doi: 10.1080/09637480701625697. [DOI] [PubMed] [Google Scholar]
- 22.Bonnema AL, Kolberg LW, Thomas W, Slavin JL. Gastrointestinal tolerance of chicory inulin products. J Am Diet Assoc. 2010;110(6):865–868. doi: 10.1016/j.jada.2010.03.025. [DOI] [PubMed] [Google Scholar]
- 23.Zheng L, Kelly CJ, Colgan SP. Physiologic hypoxia and oxygen homeostasis in the healthy intestine. A review in the theme: cellular responses to Hypoxia. Am J Physiol Cell Physiol. 2015. September 15;309(6):C350–60. doi: 10.1152/ajpcell.00191.2015. [DOI] [PMC free article] [PubMed] [Google Scholar]
- 24.Dong LN, Wang JP, Liu P, Yang YF, Feng J, Han Y. Faecal and mucosal microbiota in patients with functional gastrointestinal disorders: correlation with toll-like receptor 2/toll-like receptor 4 expression. World J Gastroenterol. 2017;23(36):6665–6673. doi: 10.3748/wjg.v23.i36.6665. [DOI] [PMC free article] [PubMed] [Google Scholar]
- 25.Nisman B. The Stickland reaction. Bacteriol Rev. 1954;18(1):16–42. [DOI] [PMC free article] [PubMed] [Google Scholar]
- 26.Korpela K. Diet, microbiota, and metabolic health: trade-off between saccharolytic and proteolytic fermentation. Annu Rev Food Sci Technol. 2018;9:65–84. doi: 10.1146/annurev-food-030117-012830. [DOI] [PubMed] [Google Scholar]
- 27.Rios-Covian D, Gyeimonde M, Duncan SH, Flint HJ, de Los Reyes-Gavilan CG. Enhanced butyrate formation by cross-feeding between Faecalibacterium prausnitzii and Bifidobacterium adolescentis. FEMS Microbiol Lett. 2015;362(21):pii:fnv176. doi: 10.1093/femsle/fnv176. [DOI] [PubMed] [Google Scholar]
- 28.Cuff MA, Lambert DW, Shirazi-Beechey SP. Substrate-induced regulation of the human colonic monocarboxylate transporter, MCT1. J Physiol. 2002;539(Pt 2):361–371. [DOI] [PMC free article] [PubMed] [Google Scholar]
- 29.Joossens M, Huys G, Cnockaert M, De Preter V, Verbeke K, Rutgeerts P, Vandamme P, Vermeire S. Dysbiosis of the faecal microbiota in patients with Crohn’s disease and their unaffected relatives. Gut. 2011;60(5):631–637. doi: 10.1136/gut.2010.223263. [DOI] [PubMed] [Google Scholar]
- 30.Martínez I, Lattimer JM, Hubach KL, Case JA, Yang J, Weber CG, Louk JA, Rose DJ, Kyureghian G, Peterson DA, et al. Gut microbiome composition is linked to whole grain-induced immunological improvements. ISME J. 2013;7(2):269–280. doi: 10.1038/ismej.2012.104. [DOI] [PMC free article] [PubMed] [Google Scholar]
- 31.Morgan XC, Tickle TL, Sokol H, Gevers D, Devaney KL, Ward DV, Reyes JA, Shah SA, LeLeiko N, Snapper SB, et al. Dysfunction of the intestinal microbiome in inflammatory bowel disease and treatment. Genome Biol. 2012;13(9):R79. doi: 10.1186/gb-2012-13-9-r79. [DOI] [PMC free article] [PubMed] [Google Scholar]
- 32.Erickson AR, Cantarel BL, Lamendella R, Darzi Y, Mongodin EF, Pan C, Shah M, Halfvarson J, Tysk C, Henrissat B, et al. Integrated metagenomics/metaproteomics reveals human host-microbiota signatures of Crohn’s disease. PLoS One. 2012;7(11):e49138. doi: 10.1371/journal.pone.0049138. [DOI] [PMC free article] [PubMed] [Google Scholar]
- 33.Sokol H, Pigneur B, Watterlot L, Lakhdari O, Bermúdez-Humarán LG, Gratadoux JJ, Blugeon S, Bridonneau C, Furet JP, Corthier G, et al. Faecalibacterium prausnitzii is an anti-inflammatory commensal bacterium identified by gut microbiota analysis of Crohn disease patients. Proc Natl Acad Sci USA. 2008;105(43):16731–16736. doi: 10.1073/pnas.0804812105. [DOI] [PMC free article] [PubMed] [Google Scholar]
- 34.Hoentjen F, Welling GW, Harmsen HJ, Zhang X, Snart J, Tannock GW, Lien K, Churchill TA, Lupicki M, Dieleman LA. Reduction of colitis by prebiotics in HLA-B27 transgenic rats is associated with microflora changes and immunomodulation. Inflamm Bowel Dis. 2005;11(11):977–985. [DOI] [PubMed] [Google Scholar]
- 35.Durbán A, Abellán JJ, Jiménez-Hernández N, Ponce M, Ponce J, Sala T, D’Auria G, Latorre A, Moya A. Assessing gut microbial diversity from feces and rectal mucosa. Microb Ecol. 2011;61(1):123–133. doi: 10.1007/s00248-010-9738-y. [DOI] [PubMed] [Google Scholar]
- 36.Willing B, Halfvarson J, Dicksved J, Rosenquist M, Järnerot G, Engstrand L, Tysk C, Jansson JK. Twin studies reveal specific imbalances in the mucosa-associated microbiota of patients with ileal Crohn’s disease. Inflamm Bowel Dis. 2009;15(5):653–660. doi: 10.1002/ibd.20783. [DOI] [PubMed] [Google Scholar]
- 37.Momozawa Y, Deffontaine V, Louis E, Medrano JF. Characterization of bacteria in biopsies of colon and stools by high throughput sequencing of the V2 region of bacterial 16S rRNA gene in human. PLoS One. 2011;6(2):e16952. doi: 10.1371/journal.pone.0016952. [DOI] [PMC free article] [PubMed] [Google Scholar]
- 38.Hong PY, Croix JA, Greenberg E, Gaskins HR, Mackie RI. Pyrosequencing-based analysis of the mucosal microbiota in healthy individuals reveals ubiquitous bacterial groups and micro-heterogeneity. PLoS One. 2011;6(9):e25042. doi: 10.1371/journal.pone.0025042. [DOI] [PMC free article] [PubMed] [Google Scholar]
- 39.Bajaj JS, Hylemon PB, Ridlon JM, Heuman DM, Daita K, White MB, Monteith P, Noble NA, Sikaroodi M, Gillevet PM. Colonic mucosal microbiome differs from stool microbiome in cirrhosis and hepatic encephalopathy and is linked to cognition and inflammation. Am J Physiol Gastrointest Liver Physiol. 2012;303(6):G675–85. doi: 10.1152/ajpgi.00152.2012. [DOI] [PMC free article] [PubMed] [Google Scholar]
- 40.Gorkiewicz G, Thallinger GG, Trajanoski S, Lackner S, Stocker G, Hinterleitner T, Gülly C, Högenauer C. Alterations in the colonic microbiota in response to osmotic diarrhea. PLoS One. 2013;8(2):e55817. doi: 10.1371/journal.pone.0055817. [DOI] [PMC free article] [PubMed] [Google Scholar]
- 41.Khan MT, Duncan SH, Stams AJ, van Dijl JM, Flint HJ, Harmsen HJ. The gut anaerobe Faecalibacterium prausnitzii uses an extracellular electron shuttle to grow at oxic-anoxic interphases. ISME J. 2012;6(8):1578–1585. doi: 10.1038/ismej.2012.5. [DOI] [PMC free article] [PubMed] [Google Scholar]
- 42.Vandeputte D, Falony G, Vieira-Silva S, Wang J, Sailer M, Theis S, Verbeke K, Raes J. Prebiotic inulin-type fructans induce specific changes in the human gut microbiota. Gut. 2017;66(11):1968–1974. doi: 10.1136/gutjnl-2016-313271. [DOI] [PMC free article] [PubMed] [Google Scholar]
- 43.Dewulf EM, Cani PD, Claus SP, Fuentes S, Puylaert PG, Neyrinck AM, Bindels LB, de Vos WM, Gibson GR, Thissen JP, et al. Insight into the prebiotic concept: lessons from an exploratory, double blind intervention study with inulin-type fructans in obese women. Gut. 2013;62(8):1112–1121. doi: 10.1136/gutjnl-2012-303304. [DOI] [PMC free article] [PubMed] [Google Scholar]
- 44.Deehan EC, Duar RM, Armet AM, Perez-Muñoz ME, Jin M, Walter J. Modulation of the gastrointestinal microbiome with nondigestible fermentable carbohydrates to improve human health. Microbiol Spectr. 2017;5(5). doi: 10.1128/microbiolspec.BAD-0019-2017. [DOI] [PMC free article] [PubMed] [Google Scholar]
- 45.Alipour M, Zaidi D, Valcheva R, Jovel J, Martínez I, Sergi C, Walter J, Mason AL, Wong GK, Dieleman LA, et al. Mucosal barrier depletion and loss of bacterial diversity are primary abnormalities in paediatric ulcerative colitis. J Crohns Colitis. 2016;10(4):462–471. doi: 10.1093/ecco-jcc/jjv223. [DOI] [PMC free article] [PubMed] [Google Scholar]
- 46.Lepage P, Seksik P, Sutren M, de la Cochetière MF, Jian R, Marteau P, Doré J. Biodiversity of the mucosa-associated microbiota is stable along the distal digestive tract in healthy individuals and patients with IBD. Inflamm Bowel Dis. 2005;11(5):473–480. [DOI] [PubMed] [Google Scholar]
- 47.Sanz Y, Sánchez E, Marzotto M, Calabuig M, Torriani S, Dellaglio F. Differences in faecal bacterial communities in coeliac and healthy children as detected by PCR and denaturing gradient gel electrophoresis. FEMS Immunol Med Microbiol. 2007;51(3):562–568. doi: 10.1111/j.1574-695X.2007.00337.x. [DOI] [PubMed] [Google Scholar]
- 48.Fusco V, Quero GM, Cho GS, Kabisch J, Meske D, Neve H, Bockelmann W, Franz CM. The genus Weissella: taxonomy, ecology and biotechnological potential. Front Microbiol. 2015;6:155. doi: 10.3389/fmicb.2015.00155. [DOI] [PMC free article] [PubMed] [Google Scholar]
- 49.Serrano-Villar S, Vázquez-Castellanos JF, Vallejo A, Latorre A, Sainz T, Ferrando-Martínez S, Rojo D, Martínez-Botas J, Del Romero J, Madrid N, et al. The effects of prebiotics on microbial dysbiosis, butyrate production and immunity in HIV-infected subjects. Mucosal Immunol. 2017;10(5):1279–1293. doi: 10.1038/mi.2016.122. [DOI] [PubMed] [Google Scholar]
- 50.Koleva P, Ketabi A, Valcheva R, Gänzle MG, Dieleman LA. Chemically defined diet alters the protective properties of fructo-oligosaccharides and isomalto-oligosaccharides in HLA-B27 transgenic rats. PLoS One. 2014;9(11):e111717. doi: 10.1371/journal.pone.0111717. [DOI] [PMC free article] [PubMed] [Google Scholar]
- 51.Jost T, Lacroix C, Braegger C, Chassard C. Stability of the maternal gut microbiota during late pregnancy and early lactation. Curr Microbiol. 2014;68(4):419–427. doi: 10.1007/s00284-013-0491-6. [DOI] [PubMed] [Google Scholar]
- 52.Futagi Y, Kobayashi M, Narumi K, Furugen A, Iseki K. Identification of a selective inhibitor of human monocarboxylate transporter 4. Biochem Biophys Res Commun. 2018. January 1;495(1):427–432. doi: 10.1016/j.bbrc.2017.10.025. [DOI] [PubMed] [Google Scholar]
- 53.Bindels LB, Delzenne NM, Cani PD, Walter J. Towards a more comprehensive concept for prebiotics. Nat Rev Gastroenterol Hepatol. 2015;12(5):303–310. doi: 10.1038/nrgastro.2015.47. [DOI] [PubMed] [Google Scholar]
- 54.Lewis JD, Chen EZ, Baldassano RN, Otley AR, Griffiths AM, Lee D, Bittinger K, Bailey A, Friedman ES, Hoffmann C, et al. Inflammation, antibiotics, and diet as environmental stressors of the gut microbiome in pediatric Crohn’s disease. Cell Host Microbe. 2015;18(4):489–500. doi: 10.1016/j.chom.2015.09.008. [DOI] [PMC free article] [PubMed] [Google Scholar]
- 55.Schroeder KW, Tremaine WJ, Ilstrup DM. Coated oral 5-aminosalicylic acid therapy for mildly to moderately active ulcerative colitis. A randomized study. N Engl J Med. 1987;317(26):1625–1629. doi: 10.1056/NEJM198712243172603. [DOI] [PubMed] [Google Scholar]
- 56.Htoo JK, Araiza BA, Sauer WC, Rademacher M, Zhang Y, Cervantes M, Zijlstra RT. Effect of dietary protein content on ileal amino acid digestibility, growth performance, and formation of microbial metabolites in ileal and cecal digesta of early-weaned pigs. J Anim Sci. 2007;85(12):3303–3312. doi: 10.2527/jas.2007-0105. [DOI] [PubMed] [Google Scholar]
- 57.Louis P, Flint HJ. Development of a semiquantitative degenerate real-time pcr-based assay for estimation of numbers of butyryl-coenzyme A (CoA) CoA transferase genes in complex bacterial samples. Appl Environ Microbiol. 2007;73(6):2009–2012. doi: 10.1128/AEM.02561-06. [DOI] [PMC free article] [PubMed] [Google Scholar]
- 58.Thibault R, De Coppet P, Daly K, Bourreille A, Cuff M, Bonnet C, Mosnier JF, Galmiche JP, Shirazi-Beechey S, Segain JP. Down-regulation of the monocarboxylate transporter 1 is involved in butyrate deficiency during intestinal inflammation. Gastroenterology. 2007;133(6):1916–1927. doi: 10.1053/j.gastro.2007.08.041. [DOI] [PubMed] [Google Scholar]
- 59.Thiele B, Weidemann W, Schnabel D, Romalo G, Schweikert HU, Spindler KD. Complete androgen insensitivity caused by a new frameshift deletion of two base pairs in exon 1 of the human androgen receptor gene. J Clin Endocrinol Metab. 1999;84(5):1751–1753. doi: 10.1210/jcem.84.5.5664. [DOI] [PubMed] [Google Scholar]
- 60.Martínez I, Kim J, Duffy PR, Schlegel VL, Walter J. Resistant starches types 2 and 4 have differential effects on the composition of the fecal microbiota in human subjects. PLoS One. 2010;5(11):e15046. doi: 10.1371/journal.pone.0015046. [DOI] [PMC free article] [PubMed] [Google Scholar]
- 61.Caporaso JG, Kuczynski J, Stombaugh J, Bittinger K, Bushman FD, Costello EK, Fierer N, Peña AG, Goodrich JK, Gordon JI, et al. QIIME allows analysis of high-throughput community sequencing data. Nat Methods. 2010;7(5):335–336. doi: 10.1038/nmeth.f.303. [DOI] [PMC free article] [PubMed] [Google Scholar]
- 62.Chong J, Soufan O, Li C, Caraus I, Shizhao L, Bourque G, Wishart DS, Xio J. MetaboAnalyst 4.0: towards more transparent and integrated metabolomics analysis. Nucleic Acid Res. 2018;46(W1):W486–W494. doi: 10.1093/nar/gky310.7. [DOI] [PMC free article] [PubMed] [Google Scholar]
Associated Data
This section collects any data citations, data availability statements, or supplementary materials included in this article.


