

ABSTRACT
Acquired tamoxifen resistance is a persistent problem for the treatment of estrogen receptor positive, premenopausal breast cancer patients and predictive biomarkers are still elusive. We here analyzed gene expression changes in a cellular model to identify early and late changes upon tamoxifen exposure and thereby novel prognostic biomarkers. Estrogen receptor positive MCF-7 cells were incubated with 4OH-tamoxifen (10 nM) and gene expression analyzed by array hybridization during 12 weeks. Array results were confirmed by nCounter- and qRT-PCR technique. Pathway enrichment analysis revealed that early responses concerned mainly amine synthesis and NRF2-related signaling and evolved into a stable gene expression pattern within 4 weeks characterized by changes in glucuronidation-, estrogen metabolism-, nuclear receptor- and interferon signaling pathways. As a large number of long non coding RNAs was subject to regulation, we investigated 5 of these (linc01213, linc00632 linc0992, LOC101929547 and XR_133213) in more detail. From these, only linc01213 was upregulated but all were less abundant in estrogen-receptor negative cell lines (MDA-MB 231, SKBR-3 and UACC3199). In a web-based survival analysis linc01213 and linc00632 turned out to have prognostic impact. Linc01213 was investigated further by plasmid-mediated over-expression as well as siRNA down-regulation in MCF-7 cells. Nevertheless, this had no effect on proliferation or expression of tamoxifen regulated genes, but migration was increased. In conclusion, the cellular model identified a set of lincRNAs with prognostic relevance for breast cancer. One of these, linc01213 although regulated by 4OH-tamoxifen, is not a central regulator of tamoxifen adaption, but interferes with the regulation of migration.
KEYWORDS: Breast cancer, tamoxifen, long-non coding RNAs, biomarker, gene expression
Introduction
Breast cancer is the most frequently occurring cancer in women worldwide [1]. Amongst classical pathological features, these tumors are primarily classified according to hormone receptor expression status [2] especially the estrogen receptor α (ER), which can be found in about 2/3 of all cases. The other important nuclear receptor, the progesterone receptor (PR) is expressed in about 70 per cent of ER-positive cases. Whether PR can be expressed in ER-negative cases has long been a point of debate but this phenotype seems to exist rarely [3]. About 20 per cent of breast tumors over-express the HER2/NEU receptor (erbB2) for epidermal growth factor (EGF). The remaining 15 per cent of the tumors expressing none of these receptors are called triple negative [4]. This class is closely related to the so called basal type breast cancers, which are defined by a gene expression signature [2]. Treatment of breast cancer is performed according to receptor expression and additional risk factors such as tumor size, the presence of tumor positive lymph nodes or expression of the mitosis indicating protein Ki67. Patients with ER-positive tumors are treated with anti-endocrine therapy inhibiting estrogen action by either aromatase inhibitors (AI) or selective estrogen receptor modulators (SERM) such as tamoxifen [5]. The latter is mainly used in premenopausal cases as aromatase inhibitors are more effective in menopausal women [6]. A major drawback of tamoxifen is therapy failure indicated by disease recurrence in about 20–30 per cent of tamoxifen-treated patients [7]. This might be due to the presence of hormone receptor negative cancer cells in heterogeneous tumors, mutated ER [8] or altered tamoxifen metabolism [9]. However most researchers attribute this problem to acquired tamoxifen resistance, where the cancer cells bypass the blocked estrogen proliferative signal by switching to other growth stimulating pathways i.e. epidermal growth factor (EGF) signaling [10]. Acquired tamoxifen resistance can be simulated in cell culture by long term exposure to tamoxifen or its more active, metabolic product 4-OH tamoxifen. Different regimes for this treatment have been developed varying amongst other factors in tamoxifen concentration and serum supply [11].
4-OH tamoxifen concentration in tissues of treated women was determined to range from 1 nM to 1 µM [12]. Interestingly, in cell cultures tamoxifen is also toxic to cells that do not express the ER [13]. This clearly indicates the presence of unspecific side effects and it has therefore been suggested not to use excessive tamoxifen doses in cancer treatment.
With such cell culture models, several important molecules for tamoxifen resistance have been identified [14]. For example, we and others have recently shown that increased expression of the alternative, membrane bound G-protein coupled estrogen receptor GPER1 (GPR-30) is associated with tamoxifen resistance in patients [15–18]. The application of specific GPER1 agonists (G1) [19] or antagonists (G15) [20] are therefore discussed as therapy option for tamoxifen resistant breast cancer. However, other membrane bound splice products of the estrogen receptor α, such as the ERα36 isoform, are also discussed as important factors for tamoxifen resistance [21,22]. Nevertheless, no predictive biomarker for tamoxifen resistance is currently available in the clinic, although this could greatly improve therapy success. We were therefore interested to analyze the adaption process to 4OH-tamoxifen further in a time resolved manner to discriminate early and late gene expression changes and to identify novel prognostic biomarkers.
Results
Verification of array results by nCounter technology
After obtaining the gene expression data from the array hybridizations, we first performed experiments to verify the data by unrelated techniques. We decided to apply nCounter elements chemistry (Nanostring technologies) as this method does not imply enzymatic reactions or amplifications that depend on RNA quality. A 48 gene set was selected (supplemement 1) that comprised 42 significantly regulated genes under 4OH-tamoxifen after 12 weeks adaption and 6 reference genes. The obtained data were analyzed by two means, first we compared the absolute signal that was obtained by the two methods of an individual RNA preparation with each other and second, we compared the gene expression changes in response to 4OH-tamoxifen adaption. In both analyzes, a satisfying consistence between the methods could be observed (Figure 1). Additionally, we analyzed the mRNA abundance of selected genes by qRT-PCR. Again, in most cases the results correlated well with each other (see Table 1 for lincRNAs).
Figure 1.
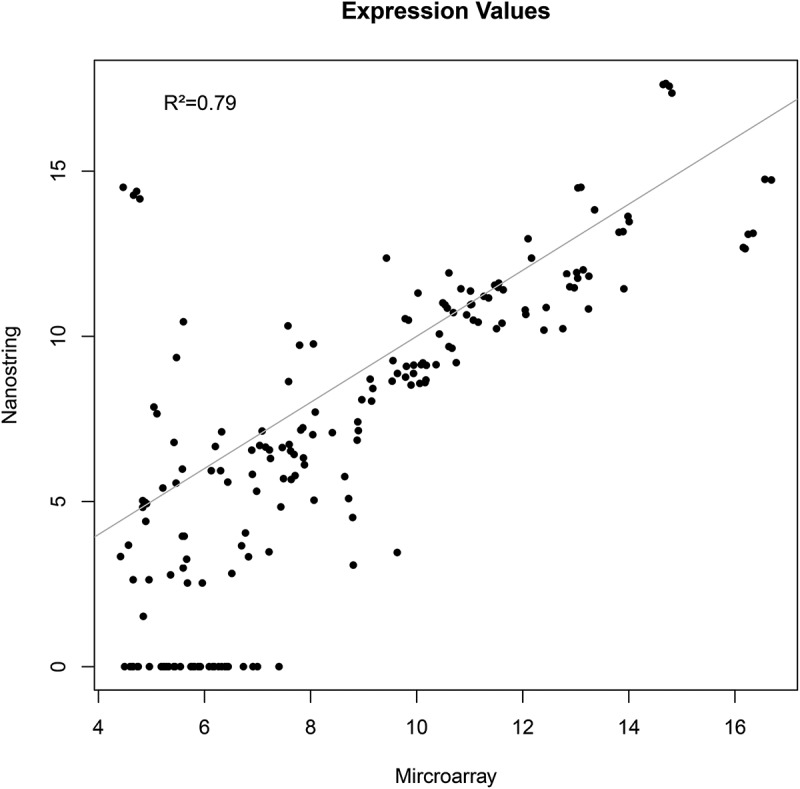
Correlation of nCounter results with array hybridization data by using absolute expression values. 48 genes were selected on the basis of significant tamoxifen regulation in the array experiments. 12 RNA preparations used for array-experiments were then re-analyzed by using the nCounter elements chemistry.
Table 1.
Comparison of lincRNA expression by array hybridization and qRT-PCR (logFc-values). Both datasets correlated with R2 = 0.92. Values for the nCounter analysis were not included because linc00992 could not be detected by the nCounter technique and detection of linc0632 and linc0683 failed in samples from Tam-adapted cells due to the observed reduction of abundance in these cells.
| Long-non-coding RNA | logFc qRT-PCR |
logFc array |
|---|---|---|
| LINC 01213 | 1,82 | 1,72 |
| LOC101929547 | −3,43 | −1,80 |
| LINC 00992 | −3,03 | −1,51 |
| XR 133213 | −3,40 | −1,54 |
| LINC 00632 | −2,62 | −0,28 |
4OH-tamoxifen (10 nM) blocked estrogen dependent gene expression
At a first step of data analysis we were interested to prove that the chosen 4OH-tamoxifen concentration indeed resulted in blockage of the ESR1 pathway. We selected the 500 most significantly regulated genes from the 24h data set and analyzed this list by the enrich database [23,24]. ESR1 turned out to be the most significant hit for ‘ENCODE and ChEA Consensus TFs from ChIP-X’ (adjusted p-value: 2.2 · 10−5). This data set in particular combines data from chromatin immunoprecipitations, thereby giving a good assessment of genes regulated by transcription factors [25]. We therefore concluded that ESR1 was indeed sufficiently blocked in our experiments.
Determination of a ‘top regulated’ gene set (12 weeks), gene ontology (GO) and cluster analysis
Next, we selected a set of genes that was most significantly influenced after 12 weeks of exposure to 4OH-tamoxifen. We here combined the top 500 genes of the three independent experiments based on the ANOVA test result and eliminated genes that showed significant discrepancies between the three replicates and were regulated by at least a factor of 2. This resulted in a list of 467 transcripts (273 up- and 204 downregulated), which we used for gene ontology (GO, Figure 2) and cluster analysis (Figure 3, supplementary table S2). GO analysis (Figure 2) was done using webgestalt [26]. Notably, this gene set contains several genes that have been described as relevant for breast cancer biology. Such genes were i.e. members of the CEACAM family [27] GPER1 [15], Keratin13 [28], MMP1 [29], and BCAS1 [30].
Figure 2.
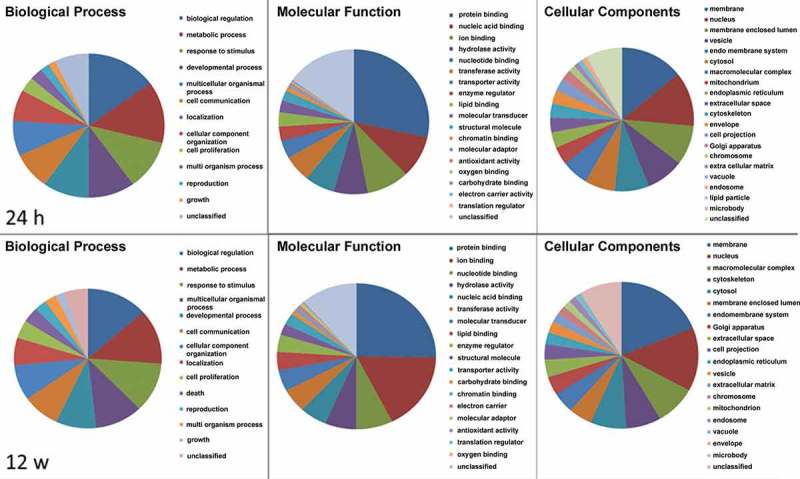
GO analysis of ‘top 467’ 4OH-tamoxifen-regulated genes using ‘webgestalt’ demonstrating differences between early responses (24 h) and adapted cells (12 week exposure).
Figure 3.
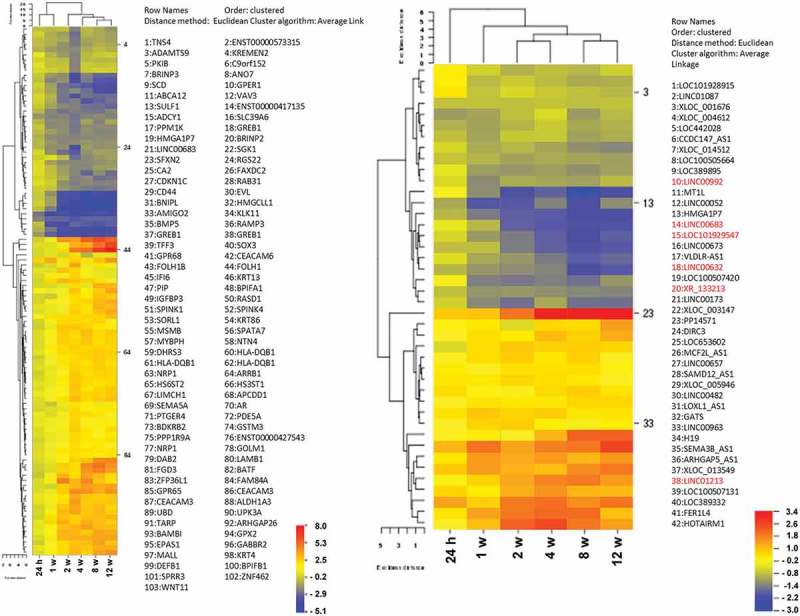
Cluster analysis. Left: 102 most regulated genes were selected from the combined ANOVA-lists and submitted to CIMMINER for Euclidian cluster analysis. Right: Euclidian cluster analysis of expression data for the 42 most significantly regulated lincRNAs (ANOVA). Red: lincRNA marked genes were re-analyzed by qRT-PCR.
Time resolved pathway analysis
One of our goals was to discriminate between early, stress related gene expression changes and the established gene expression pattern observed after long term adaption to 4OH-tamoxifen. We performed pathway analysis with all gene expression data by means of the pathvisio software, which uses the wikipathways collections. The Z-score output for all time points was used for Euclidian cluster analysis shown in Figure 4. Indeed, very early changes (24 h) were seen for pathways related to amine synthesis and metabolism as well as NRF2 signaling. This already changed at 1 week treatment, with highest scores for pathways associated with mitosis and cell cycle. After 2 weeks exposure the expression pattern started to stabilize and after 4 weeks a stable expression pattern started to develop with highest significance in glucuronidation, estrogen metabolism, nuclear receptor expression and interferon signaling. Similar to single gene analysis, early and late patterns were seen in the clustering observed for the top regulated gene list (Figure 3). When looking for genes that were differentially regulated at the beginning and end of the experiment we found only two met our criterion of inverse regulation by a factor of 2, namely the transcription factor SIM1 and inhibin βA (INHBA), which is involved in activin signalling [31].
Figure 4.
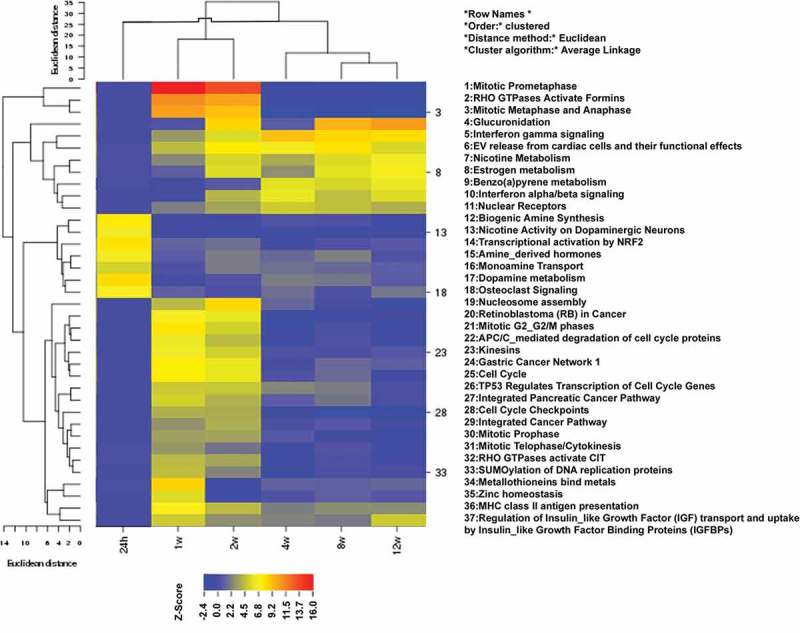
Time-resolved pathway cluster analysis. Pathway enrichment analysis was done by using the pathvisio software for all transcripts at all time points and the obtained Z-Scores were clustered using CIMMINER. For clarity the 24 h time point was shifted to the beginning of the cluster although it clustered at a different position. Only the most significant 37 pathways are shown.
lincRNA expression analysis in representative mammary carcinoma cell lines
We then determined the expression of the lincRNAs in MCF-7 and tamoxifen adapted MCF-7 cells by RT-PCR (Table 1) and also in a small number of breast cancer cell lines to test whether a correlation with receptor status (ESR1, HER2/Neu, TNBC) might become evident. Indeed all selected lincRNAs were lower expressed in ER-negative cell lines when compared to MCF-7 except linc01213 in SKBR-3 where it was expressed to a similar extend as in MCF-7 (Figure 5).
Figure 5.
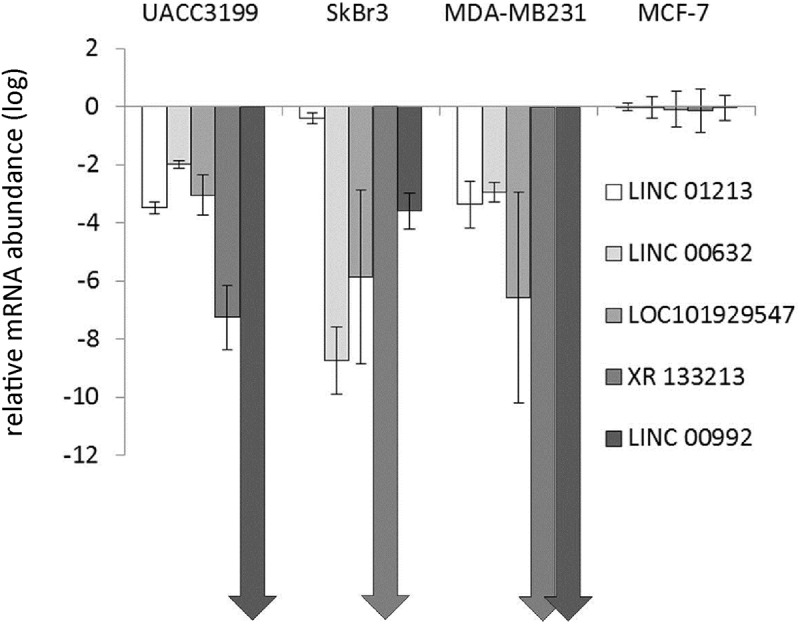
Relative abundance of lincRNAs in representative breast cancer cell lines as determined by qRT-PCR relative to RPL13. Data for MCF-7 were set to 1 and data shown as log2Fc values with standard deviation of 4 independent determinations. Arrows are shown when the lincRNA was below detection limit of the technique.
Long non coding RNAs, qRT-PCR data and Kaplan-Meier survival analysis
We then tested whether the identified lincRNAs are associated with patients´ outcome. This was done by using the KM-plotter web-based tool [32], which uses data from mRNA array hybridization. This database contained expression data only for two of the genes (linc01213 and linc00632). Also, the TCGA and METABRIC databases contained no expression data for all the 5 lincRNAs investigated here. The KM-plotter analysis revealed that linc01213 was only marginally correlated with outcome in the entire patient collection, but turned out to be significantly correlated with relapse free survival in endocrine treated patients (Figure 6). Linc00632 however, turned out to be correlated with relapse free survival in the complete data collection as well as in patients with endocrine treatment (Figure 6). In both cases, high expression was correlated with improved relapse free survival although the two genes were inversely regulated in the tamoxifen cell experiment.
Figure 6.
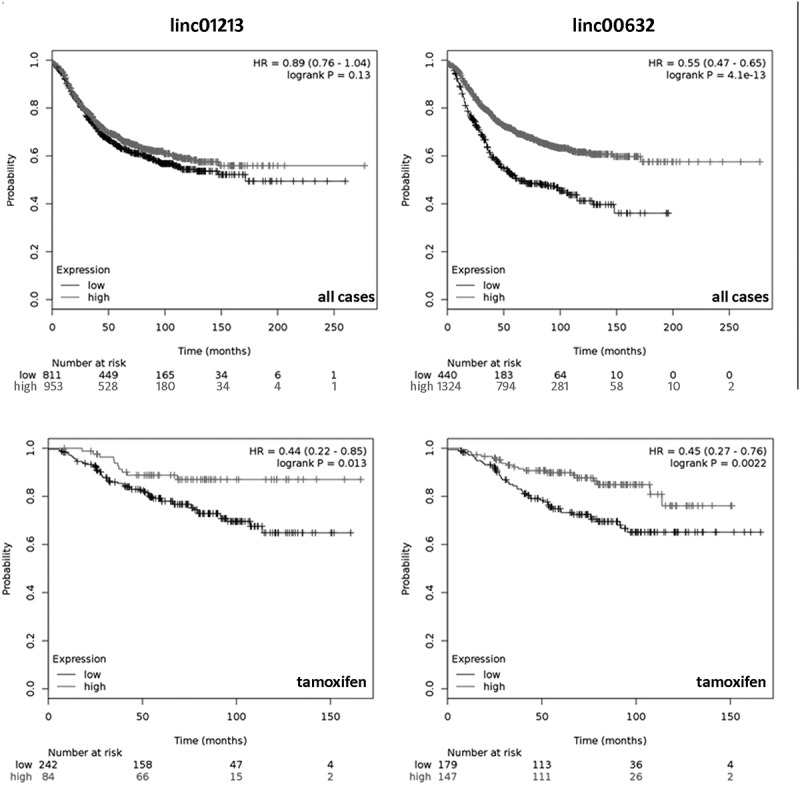
Kaplan Meier analysis of linc01213 (left panel) and linc00632 (right panel) performed by the KM-plotter online tool [32]. Upper panel shows all available cases, the lower panel depicts cases treated by endocrine therapy.
Manipulation of linc01213 expression
We decided to analyze the long intergenic non coding RNA linc01213 in more detail as it was the only lincRNA in our study that was higher expressed in tamoxifen adapted than in control cells and showed a correlation with outcome under endocrine therapy. We could obtain two cDNAs encoding two splice forms of the linc01213 (NR_110167.1; 522 bp) and NR_110168.1; 475 bp). Both isoforms share exon 3 and contain exon 1 or 2 respectively. These cDNAs were cloned into a mammalian expression vector (pTarget) and transiently and stably transfected into MCF-7 cells. In these cells we detected the resulting mRNA by in situ RNA hybridization using the RNAscope technology (Figure 7). However in untransformed MCF-7 and tamoxifen adapted cells, linc01213 mRNA could only be detected with fluorescent signal amplification. In all cells, the signal was located in the cytoplasm and not the nucleus. Occasionally, the signal was detected at the margin of a cell cluster (Figure 7(c)).
Figure 7.
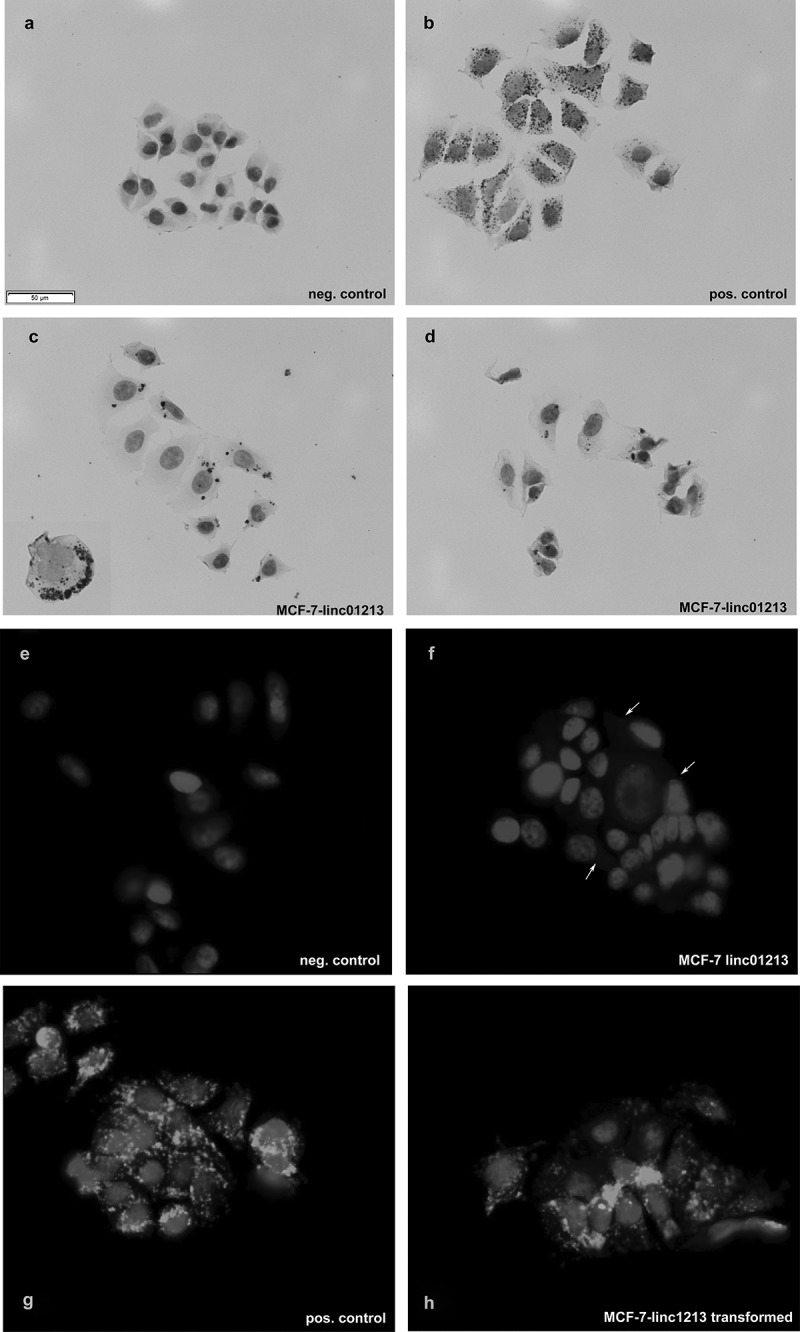
Overexpression of linc01213 in MCF-7 cells as shown by RNA in-situ hybridization detected either by DAB (a–d) or enhanced fluorescent detection (e–h). (a,e) negative control, (b,g) positive control, (f) linc01213 hybridization in control MCF-7 cells, C,D,H: linc01213 hybridization results in linc01213 over-expressing cells. In F some positive signals are marked by arrows for clarity. Scale bar represents 50 µm.
With the stable transformed cell lines, we analyzed proliferation with and without the presence of 4OH-tamoxifen and migration in scratch experiments. Proliferation was not changed compared to control transformed cells and also under 4OH-tamoxifen no changes in growth could be seen (data not shown). However in scratch assays, one linc01213 variant resulted in increased migration (Figure 8). We also performed downregulation by siRNA and analyzed proliferation and migration assays. siRNA reduced the linc01213 expression in MCF-7 by about 54 per cent and in Tam-adapted cells by 80 per cent resulting in linc01213 levels that are similar to MCF-7 control expression. Again, no effect on proliferation was observed, but the migration was enhanced at the 24 hour time point in siRNA-linc01213 treated cells but this effect disappeared at the 48h time point (Figure 9).
Figure 8.
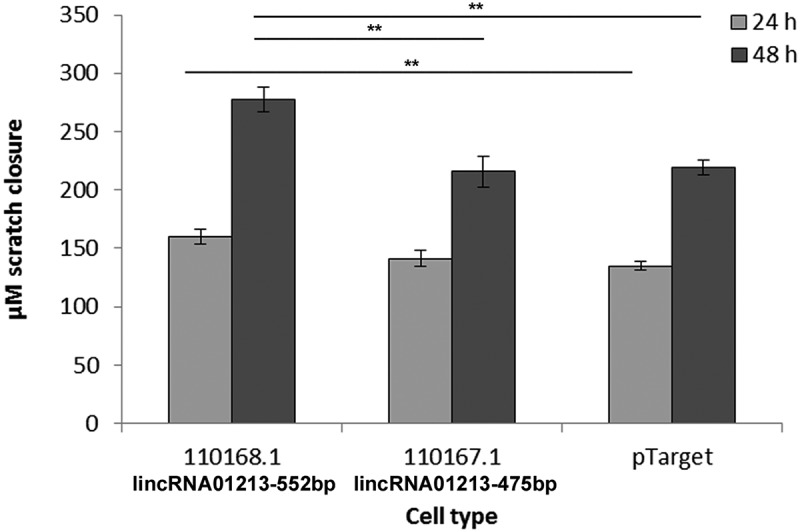
Analysis of cell migration of stably transformed MCF-7 cells by scratch assay. Cells were grown to confluence and then serum-starved for 24 h to stop cell divisions. After applying the scratches, cells were washed with serum-free medium and photographed every 24 h. Distance of the scratch margins was measured and difference to the time point 0 hours determined. Graph shows average of three independent experiments with 8 independent scratches each and standard error. **p < 0.01.
Figure 9.
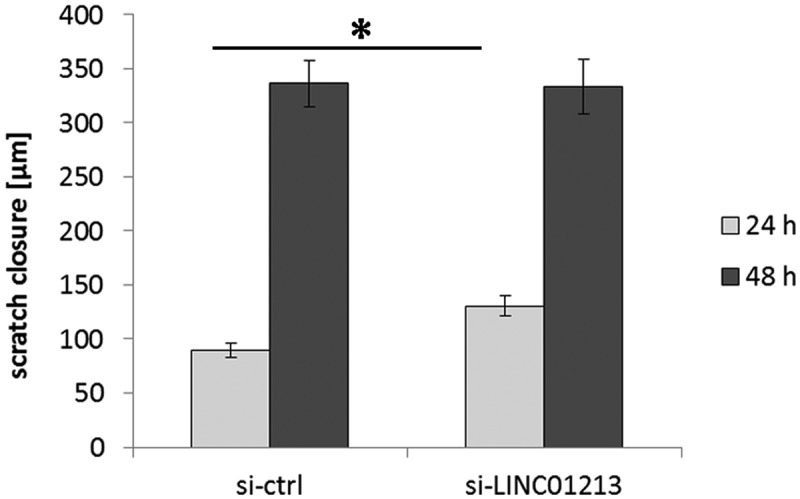
Scratch assay using siRNA treated MCF-7 cells. Data are average of 3 independent experiments. *p < 0.05.
Gene expression assays were done to determine whether the over- and under-expression of linc01213 had an effect on a small set of 4OH-tamoxifen regulated genes. For this analysis we have chosen the 4OH-Tamoxifen downregulated estrogen receptors ESR1, GPER1, the most upregulated gene FOLH1 and SIM1, which was upregulated in the first 2 weeks and downregulated in stably adapted MCF-7 cells. As these genes represent different modes of regulation, we expected changes in mRNA abundance in response to linc01213 expression manipulation, if linc01213 would act as a regulator in this process. However, no significant effects were seen, neither in siRNA-mediated downregulation or transient, plasmid mediated upregulation (Figure 10).
Figure 10.
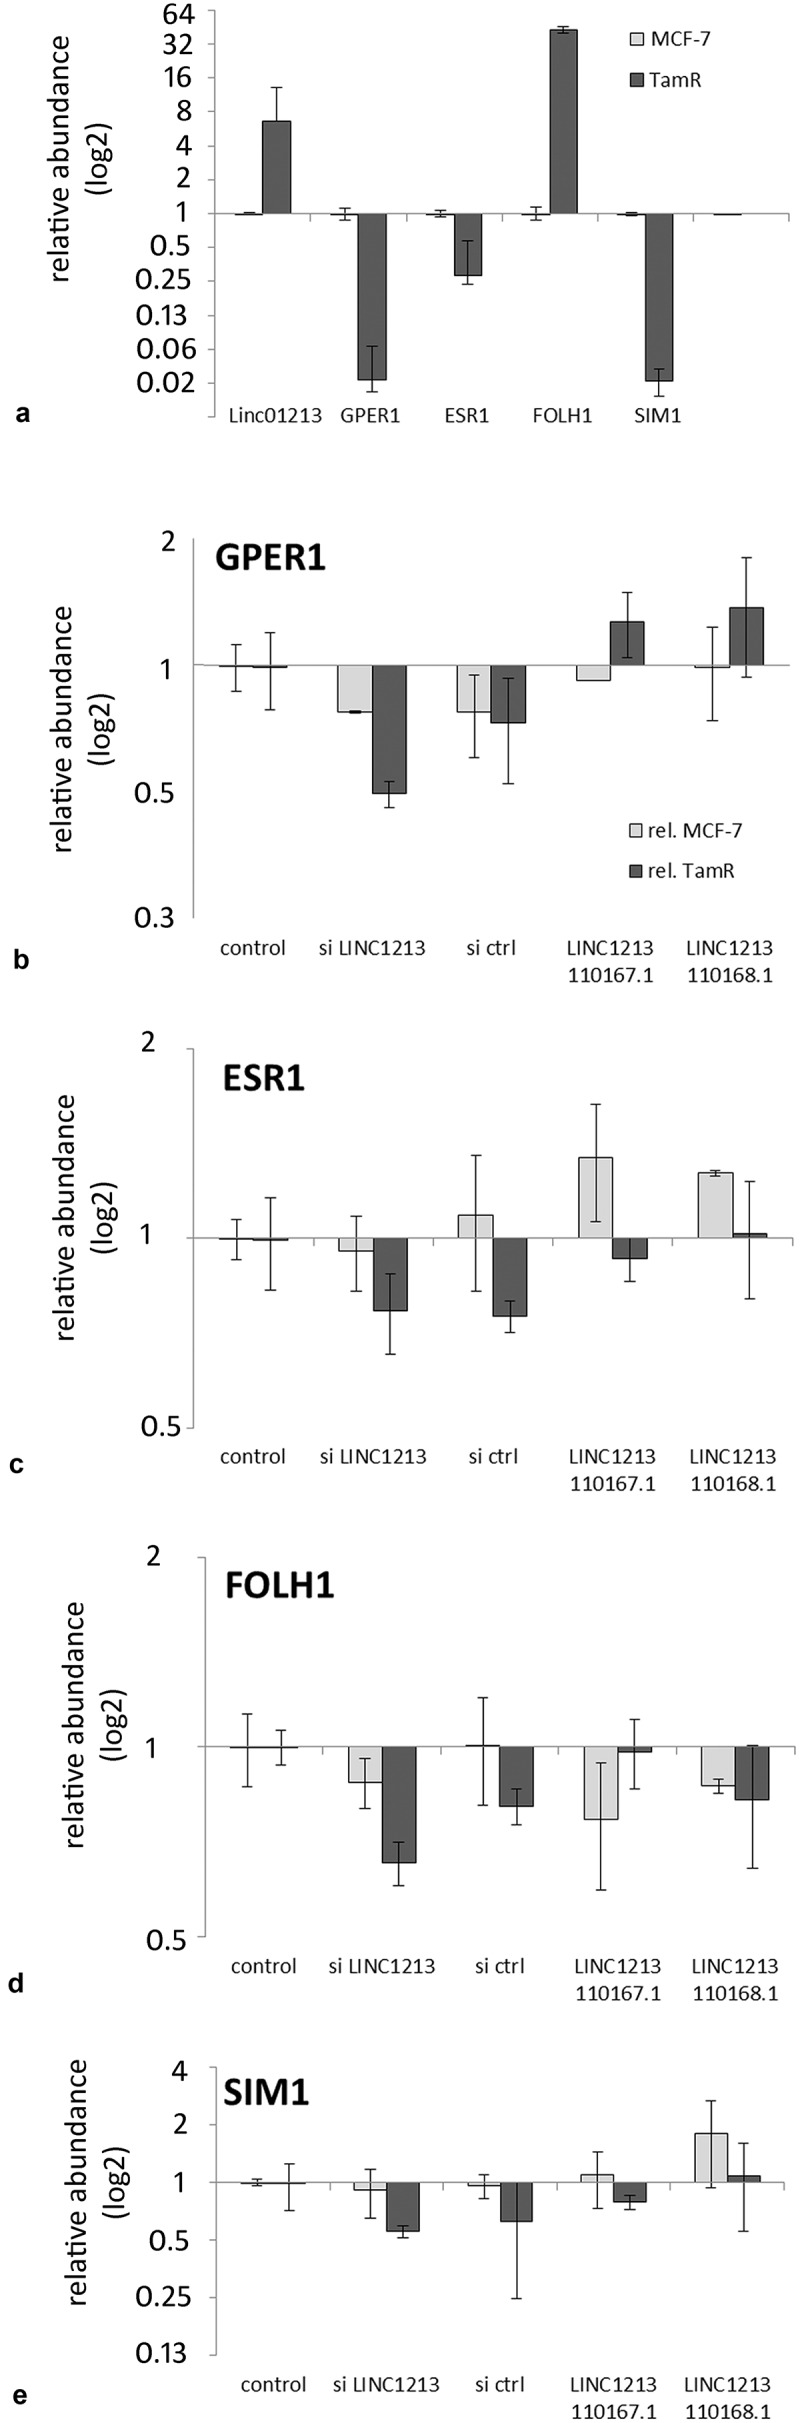
Effect of transient over-expression and siRNA-mediated downregulation of the linc01213 in MCF-7 cells on the expression of 4OH-tamoxifen regulated genes. A: relative expression in MCF-7 and 4OH-tamoxifen adapted MCF-7 cells. Experiments were performed three times and average as well as standard deviation is shown in log2-scale.
Detection of linc01213 in breast cancer samples
We then attempted to detect the linc01213 by RNA in-situ hybridization in a small set of breast cancer cases. It turned out that, consistent with the result for the MCF-7 cell cultures, linc01213 could hardly be detected by DAB staining. But by using signal amplification with TSA-fluorescent dyes, specific signals could be amplified. However, the low intensity of the staining and the presence of unspecific signals did not allow us to extend this method to our breasts cancer cohort in order to perform a Kaplan-Meier analysis to obtain further evidence for the Kaplan-Meier analysis that we performed by using the KMplotter website. Examples are shown in Figure 11.
Figure 11.
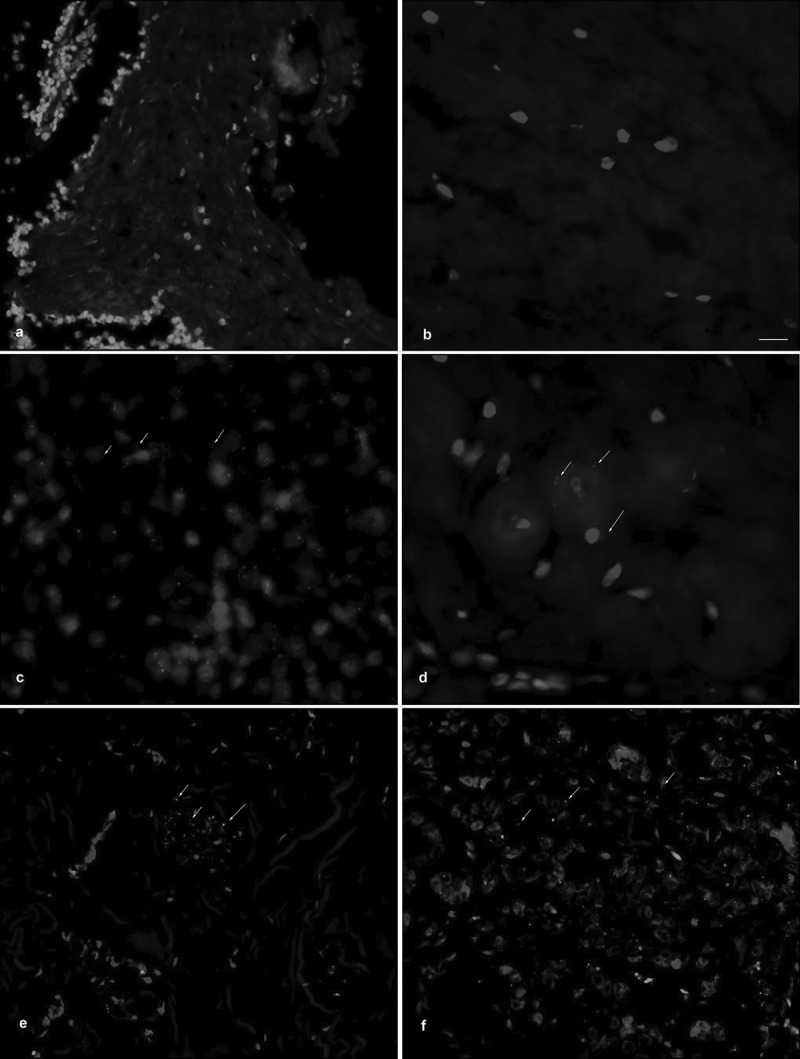
Detection of linc01213 expression by RNA in-situ hybridization in breast cancer samples using a TSA-fluorescent dye. Some positive signals are marked by arrows for illustration. Scale bar represents 50 µm. (a) invasive carcinoma, no special type (NST), G2, ER-positive. (b); invasive carcinoma, no special type (NST), G2, ER-positive, after chemotherapy, regression grade (Sinn):1. (c) invasive carcinoma, no special type (NST), G3, triple negative. (d) invasive carcinoma, no special type (NST), G2, ER-positive. (e) lobular carcinoma, G2, ER-positive, (f) invasive carcinoma, no special type (NST), G1, ER-positive.
Discussion
Acquired tamoxifen resistance still occurs in the clinic and it would be a valuable improvement for therapy to have reliable markers in hand predicting this condition. In such cases, anti-endocrine treatment could then be complemented or replaced by another treatment such as CDK inhibition [33]. An established strategy to identify novel biomarkers is the application of cellular model systems [14]. In case of tamoxifen resistance, a model employing the luminal-A type cell line MCF-7 and long term incubation with tamoxifen or 4OH-tamoxifen has been introduced in the 1980s [34] and frequently used with slight variations up to now [7,11]. By this method, several molecules have been associated with the development of acquired tamoxifen resistance such as the estrogen receptor α itself [35], alternative estrogen receptors such as splice products of ESR1 [21,22,36] or the membrane bound G-protein coupled estrogen receptor GPER1 [16,37,38]. Other signaling molecules such as EGF have also been shown to be able to replace estrogen receptor action [39,40] and additionally the inflammatory factor NF-κB was shown to be involved [41–43]. Moreover, signal transducing proteins such as the kinase FYN [44] or micro RNAs [45–48] could be linked to tamoxifen resistance by this approach. Recently, long non-coding RNAs and other RNA species, have been identified that might serve as biomarkers and therapy targets for tamoxifen resistance [49–52]. In particular, the long non-coding RNA DSCAM-AS1 and its interaction with the heterogeneous ribonucleoprotein L (hnRNPL) have been associated with tumor progression and tamoxifen resistance [53].
In this study, we evaluated gene expression changes that occur during adaption to 4OH-tamoxifen in a time resolved manner in order to identify early stress responses as well as to complement the existing gene expression studies on tamoxifen adaption [47,54,55] by using the active metabolite of tamoxifen in a dose that can be expected to be present in tissue under treatment [12]. This dose clearly resulted in repression of ER-mediated gene transcription. The microarray hybridization data could be verified by nCounter and also by qRT-PCR analysis for a selection of strongly regulated genes. Apparent differences can be explained by the different technical principles and associated detection limits as well as the measurement of different parts of the mRNAs, which were caused by the specific requirements for oligonucleotide probe design. Early gene expression changes should reflect a stress response to the missing proliferative estrogen signal. Suppression of such pathways might result in a blockage of the adaption process. At such early time points, pathway enrichment analysis delivered significant scores for amine metabolism and, may be more important, NRF2 signaling, which is associated with oxidative stress. This would hold for the involvement of reactive oxygen species in tamoxifen action as it has been described for i.e. glioma cells [56]. A further enhancement of oxidative stress might therefore support tamoxifen effects. Interestingly, on the basis of tamoxifen resistant MCF-7, we have already speculated that oxidative defense is important for tamoxifen resistance [43].
The analysis of the 12 week gene expression data revealed several genes that are already known to be associated with tamoxifen resistance or breast cancer aggressiveness. The top-listed genes for early and late time points as well as differentially regulated genes, such as FOLH1 or SIM1, might be involved in the adaption process, but we were especially intrigued by the appearance of several long non coding RNAs. Such RNAs can act via several mechanisms such as being a sponge for small RNAs i.e. microRNAs, or gluing protein complexes together [57].
A set of lincRNAs has already been associated with the outcome of breast cancer, however, only a few of the most regulated lincRNAs identified in this study, have been discussed in relation to breast cancer before [50,58]. One reason for this observation can be the different experimental systems, methods and databases applied. In public databases (KM-plot, METABRIC-study [59] and TCGA [60]), we could only find survival data for two of the lincRNAs analyzed here (linc01213 and linc00632). We think that the inclusion of such genes into the particular microarray platform used in this study is the reason that we could identify these additional lincRNAs. Indeed, for the two lincRNAs survival analysis indicated prognostic significance.
We analyzed the function of linc01213 further as it was significantly upregulated by tamoxifen in our experimental setting. As it is located in the cytoplasm, we think it is not part of the splicing complex or directly involved in regulation of transcription. It seems also not to be a master regulator for the tamoxifen adaption gene expression changes. But as effects of deregulating linc01213 could be observed in scratch assays, we propose that this lincRNA is interacting with proteins involved in migration of the cells. As this effect was only seen for over-expression of the shorter linc01213 transcript, the important sequences should be located on the first exon present only on this isoform. However, this and the target molecules should be analyzed in more detail.
In conclusion, this study showed that distinct pathways were regulated during the development of tamoxifen adaption. The data for the stable gene expression pattern in tamoxifen adapted cells identified additional, up to now, unidentified lincRNAs associated with tamoxifen. The here investigated five lincRNAs might represent useful biomarkers for breast cancer outcome, especially under anti-endocrine treatment. Additionally, a first analysis of one of these, however, revealed that it did not represent a central regulator of tamoxifen action. In further studies, we will therefore focus on the molecular function of the remaining candidate lincRNAs.
Materials and methods
Cell culture
MCF-7 cells were obtained from the ATCC stock center and cultivated in RPMI-1640 (Biochrom, Berlin, Germany) medium without phenol red, supplemented with Glutamax (Gibco-Thermo) and fetal calf serum (FCS, 10%) (Biochrom, Berlin, Germany) in cell-culture flasks (Nunc) at 37°C in humidified atmosphere supplemented with 5 per cent CO2. Medium was replaced every 3 days and the cells were transferred to fresh flasks weekly after detachment with trypsin/EDTA (Biochrom, Berlin, Germany).
For adaption experiments, the cells were incubated with 4-OH Tamoxifen (10 nM) (70% Z-isomer, Sigma-Aldrich, Munich, Germany) [16]. Cells were transferred to fresh flasks weekly and samples for RNA and protein extraction were taken at 24 h, 1 week 2 weeks, 4 weeks 8 weeks and 12 weeks after the start of the incubation. This experiment has been performed three times, but for two of these experiments only 12 week samples were analyzed by array hybridization.
RNA extraction and cDNA synthesis
For RNA extraction, cells were transferred to approximately 50 per cent confluence, washed with fresh medium the next day and lysed after further 24 h by lysis buffer (Macherey & Nagel, Düren, Germany). RNA was prepared with the Nucleo Spin RNA kit according to the manufacturer´s recommendations (Macherey & Nagel, Düren, Germany) including a DNAse treatment for 1 h. Microarray based gene expression analysis was performed by using the 8 × 60 K Agilent Microarray (ID 039494) at Oaklabs (Hennigsdorf, Germany). Validation of array data using nanostring technology was performed with a 48 gene set (see supplement) and the nCounter elements 48 tag set. For validation by qRT-PCR, 500 ng of RNA was reversed transcribed with Bioscript reverse transcriptase (Bioline) in two separate reactions using either oligo dT- or random primers (Promega, Mannheim, Germany). Both reactions were pooled for further analysis.
qRT-PCR
Real time PCR was performed in a LightCycler 2.0 system (Roche Applied Science, Mannheim, Germany) by using the LightCycler® FastStart DNA Master SYBR Green I kit or the LightCycler® TaqMan® Master Kit for TaqMan probes and ‘real time ready’ assays (Roche, Mannheim, Germany). Ct-values were determined and relative gene expression was calculated by using the 2ΔCt method.
Bioinformatical microarray analysis
First, we normalized raw microarray intensities for background noise with a convolution of normal and exponential distributions as described [61]. Secondly, a quantile normalization between arrays was performed. We then averaged the intensities of replicated microarray probes and then afterwards for probes representing the same transcript.
Nanostring analysis
For nCounter analysis, primers were designed by Nanostring Technologies and synthesized at Integrated DNA Technologies (IDT, Leuven, Belgium). Data were obtained with standard Nanostring ‘elements’ protocols. We normalized Nanostring nCounter raw counts for each sample with the NanoStringNorm R-package [62] by scaling with the geometric mean of all counts, then subtracting the mean plus two times the standard deviation of negative controls counts, followed by scaling with the geometric mean of counts from six housekeeping genes, i.e. ACTB, CLTC, GUSB, HPRT1, PGK1, and RPL13.
Differential gene expression analysis
After normalization we used the limma R-package [61] to fit a linear model on both microarray and nCounter data. We then computed statistics of differential expression by empirical Bayes moderation for pairwise comparisons as well as analyzes of variances (ANOVA).
Comparison of microarray with Nanostring data
We compared both, the absolute signal values of the different techniques as well as fold-changes to eliminate technology and transcript specific factors. Therefore, we compared log fold-changes as well as p-values as computed by the limma R-package from Nanostring nCounter and Agilent microarray data, computed Pearson’s correlations, and compared the significance of differential gene expression analysis.
Selection of ‘top regulated genes’ and pathway enrichment analysis
In all three experiments, a top 500 gene list was established based on ANOVA significance values. These lists were compiled, resulting in 1061 genes. Genes that behaved inconsistently in at least one experiment (inverse regulation) were deleted from this list resulting in 960 genes. We then selected genes that were regulated at least by a factor of 2 at the 12 week time point. This list then comprised 476 genes. For the 24 h time point only one experiment with 3 replicas was available. Here we used the original 500 gene list based on the ANOVA values for these arrays. These selections were then used in GO analysis by ‘webgestalt’ [26] and cluster analysis using the CIM-Miner Tool (https://www.discover.nci.nih.gov/cimminer/) [63]. For clarity reasons, cluster analysis presented in this manuscript was limited to a regulation factor (logFc) of 4, resulting in a short list of 104 genes. Pathway enrichment analysis was done with pathvisio [64], the Enrich Database [24] http://amp.pharm.mssm.edu/Enrichr/as well as the DAVID Bioinformatics Resources 6.8 [65,66] at https://david.ncifcrf.gov.
Genes that were upregulated in the first week and down-regulated at the end of the adaption process were selected by averaging data for 24 h and 1 week and 8 and 12 weeks followed by multiplication. A negative result indicated an inverse regulation at the beginning and end of the adaption process.
Manipulation of linc01213 expression by siRNA and plasmid transfection
A predesigned pool of siRNA directed against linc01213 and scrambled siRNA controls were obtained from Dharmacon (SMART-pool). Transfection of the cells was achieved by Dharmafect 2 as previously described [67]. EST cDNA clones of two linc01213 mRNAs were also obtained from Dharmacon. Sequencing (Abi-Prism) proved that the clones represented full length cDNAs of transcript variant 1 and −2 (accession numbers: NR_110167.1 and NR_110168.1). Both cDNAs were amplified by PCR (primer sequences: forward1: accaatgtgatgagtgtg, forward2: tgggcagaaatgcaccaggg, reverse primer: tttgaattgcaatttcacttc) and subcloned into the pTARGET expression vector (Promega). Expression of target sequences in this plasmid is under the control of the human cytomegalovirus (CMV) immediate-early enhancer/promoter. This vector was used for transient expression and stable transformation of MCF-7 cells. The empty vector was used for control transfections. Selection of stable linc01213 expressing cells was achieved by G418 selection (500 µg/mL) for 4 weeks. RNA extraction as well as qRT-PCR was performed as described above. RNA abundance was visualized by RNAscope technology (Advanced Cell Diagnostics, Newark, CA, USA) according to the manufacturer´s instructions using either DAB-staining or tyramide signal amplification (TSA-fluorescein, Perkin-Elmer, Rodgau, Germany).
Proliferation and migration assays
To analyze altered proliferation rate, cells were detached by trypsination and 5000 cells were seeded into each well of a 96 well plate. Every 24 hours resazurin was added a set of wells and the viability/cell number determined by reading the fluorescence (Glomax, Promega). pTarget transformed cells were used as a control and resazurin results with this cell line set to 1. For determining migration potential, scratch experiments were executed. Cells were seeded and grown to confluency in 24 well plates. After 24 h serum starvation, the cultures were scratched by using a 1 µL pipet tip and washed to remove floating cells. The scratch was photographed immediately afterwards and every 24 hours for further three days at the same position. The distance of the edges was determined three times per image by using the ImageJ software [68]. These data were averaged and used for further statistical calculations.
Funding Statement
This work was supported by the Deutsche Forschungsgemeinschaft [KA2663/3-1]. The German Centre for Integrative Biodiversity Research is funded as a research centre of the Deutsche Forschungsgemeinschaft [FZT118].
Acknowledgments
The authors greatly acknowledge Mrs. Kerstin Werner, Martina Stoklasek and Kerstin Körber-Ferl for excellent technical assistance.
Disclosure statement
No potential conflict of interest was reported by the authors.
Data availability statement
The data that support the findings of this study are available from the corresponding author, [NN], upon reasonable request.
Ethical approval
All procedures performed in studies involving human participants were in accordance with the ethical standards of the institutional and/or national research committee and with the 1964 Helsinki declaration and its later amendments or comparable ethical standards. This study has been approved by the ethics committee of the Medical Faculty of the Otto con Guericke University.
Supplementary material
Supplemental data for this article can be accessed here.
References
- [1].Servick K. Breast cancer: a world of differences. Science. 2014;343:1452–1453. [DOI] [PubMed] [Google Scholar]
- [2].Rakha EA, Green AR. Molecular classification of breast cancer: what the pathologist needs to know. Pathology. 2017;49:111–119. [DOI] [PubMed] [Google Scholar]
- [3].Kuroda H, Muroi N, Hayashi M, et al. Oestrogen receptor-negative/progesterone receptor-positive phenotype of invasive breast carcinoma in Japan: re-evaluated using immunohistochemical staining. Breast Cancer. 2018. [DOI] [PMC free article] [PubMed] [Google Scholar]
- [4].Anders C, Carey LA. Understanding and treating triple-negative breast cancer. Oncology. 2008;22:1233–1239; discussion 1239–1240, 1243. [PMC free article] [PubMed] [Google Scholar]
- [5].Chia SK, Wolff AC. With maturity comes confidence: EBCTCG tamoxifen update. Lancet. 2011;378:747–749. [DOI] [PubMed] [Google Scholar]
- [6].Tancredi R, Furlanetto J, Loibl S. Endocrine therapy in premenopausal hormone receptor positive/human epidermal growth receptor 2 negative metastatic breast cancer: between guidelines and literature. Oncologist. 2018;23:974–981. [DOI] [PMC free article] [PubMed] [Google Scholar]
- [7].Droog M, Beelen K, Linn S, et al. Tamoxifen resistance: from bench to bedside. Eur J Pharmacol. 2013;717:47–57. [DOI] [PubMed] [Google Scholar]
- [8].Lash TL, Lien EA, Sørensen HT, et al. Genotype-guided tamoxifen therapy: time to pause for reflection? Lancet Oncol. 2009;10:825–833. [DOI] [PMC free article] [PubMed] [Google Scholar]
- [9].Ring A, Dowsett M. Mechanisms of tamoxifen resistance. Endocr Relat Cancer. 2004;11:643–658. [DOI] [PubMed] [Google Scholar]
- [10].Fan P, Agboke FA, Cunliffe HE, et al. A molecular model for the mechanism of acquired tamoxifen resistance in breast cancer. Eur J Cancer Oxf Engl. 2014;50:2866–2876. [DOI] [PMC free article] [PubMed] [Google Scholar]
- [11].Guney Eskiler G, Cecener G, Tunca B, et al. An in vitro model for the development of acquired tamoxifen resistance. Cell Biol Toxicol. 2016;32:563–581. [DOI] [PubMed] [Google Scholar]
- [12].Kisanga ER, Gjerde J, Guerrieri-Gonzaga A, et al. Tamoxifen and metabolite concentrations in serum and breast cancer tissue during three dose regimens in a randomized preoperative trial. Clin Cancer Res Off J Am Assoc Cancer Res. 2004;10:2336–2343. [DOI] [PubMed] [Google Scholar]
- [13].Reddel RR, Murphy LC, Hall RE, et al. Differential sensitivity of human breast cancer cell lines to the growth-inhibitory effects of tamoxifen. Cancer Res. 1985;45:1525–1531. [PubMed] [Google Scholar]
- [14].Nass N, Kalinski T. Tamoxifen resistance: from cell culture experiments towards novel biomarkers. Pathol Res Pract. 2015;211:189–197. [DOI] [PubMed] [Google Scholar]
- [15].Ignatov A, Ignatov T, Weissenborn C, et al. G-protein-coupled estrogen receptor GPR30 and tamoxifen resistance in breast cancer. Breast Cancer Res Treat. 2011;128:457–466. [DOI] [PubMed] [Google Scholar]
- [16].Ignatov A, Ignatov T, Roessner A, et al. Role of GPR30 in the mechanisms of tamoxifen resistance in breast cancer MCF-7 cells. Breast Cancer Res Treat. 2010;123:87–96. [DOI] [PubMed] [Google Scholar]
- [17].Lappano R, Pisano A, Maggiolini M. GPER function in breast cancer: an overview. Front Endocrinol. 2014;5:66. [DOI] [PMC free article] [PubMed] [Google Scholar]
- [18].Sjöström M, Hartman L, Grabau D, et al. Lack of G protein-coupled estrogen receptor (GPER) in the plasma membrane is associated with excellent long-term prognosis in breast cancer. Breast Cancer Res Treat. 2014;145:61–71. [DOI] [PubMed] [Google Scholar]
- [19].Bologa CG, Revankar CM, Young SM, et al. Virtual and biomolecular screening converge on a selective agonist for GPR30. Nat Chem Biol. 2006;2:207–212. [DOI] [PubMed] [Google Scholar]
- [20].Dennis MK, Burai R, Ramesh C, et al. In vivo effects of a GPR30 antagonist. Nat Chem Biol. 2009;5:421–427. [DOI] [PMC free article] [PubMed] [Google Scholar]
- [21].Shi L, Dong B, Li Z, et al. Expression of ER-{alpha}36, a novel variant of estrogen receptor {alpha}, and resistance to tamoxifen treatment in breast cancer. J Clin Oncol Off J Am Soc Clin Oncol. 2009;27:3423–3429. [DOI] [PMC free article] [PubMed] [Google Scholar]
- [22].Li G, Zhang J, Jin K, et al. Estrogen receptor-α36 is involved in development of acquired tamoxifen resistance via regulating the growth status switch in breast cancer cells. Mol Oncol. 2013;7:611–624. [DOI] [PMC free article] [PubMed] [Google Scholar]
- [23].Chen EY, Tan CM, Kou Y, et al. Enrichr: interactive and collaborative HTML5 gene list enrichment analysis tool. BMC Bioinformatics. 2013;14:128. [DOI] [PMC free article] [PubMed] [Google Scholar]
- [24].Kuleshov MV, Jones MR, Rouillard AD, et al. Enrichr: a comprehensive gene set enrichment analysis web server 2016 update. Nucleic Acids Res. 2016;44:W90–97. [DOI] [PMC free article] [PubMed] [Google Scholar]
- [25].Lachmann A, Xu H, Krishnan J, et al. ChEA: transcription factor regulation inferred from integrating genome-wide ChIP-X experiments. Bioinforma Oxf Engl. 2010;26:2438–2444. [DOI] [PMC free article] [PubMed] [Google Scholar]
- [26].Wang J, Vasaikar S, Shi Z, et al. WebGestalt 2017: a more comprehensive, powerful, flexible and interactive gene set enrichment analysis toolkit. Nucleic Acids Res. 2017;45:W130-W137. [DOI] [PMC free article] [PubMed] [Google Scholar]
- [27].Michaelidou K, Tzovaras A, Missitzis I, et al. The expression of the CEACAM19 gene, a novel member of the CEA family, is associated with breast cancer progression. Int J Oncol. 2013;42:1770–1777. [DOI] [PubMed] [Google Scholar]
- [28].Sheng S, Barnett DH, Katzenellenbogen BS. Differential estradiol and selective estrogen receptor modulator (SERM) regulation of Keratin 13 gene expression and its underlying mechanism in breast cancer cells. Mol Cell Endocrinol. 2008;296:1–9. [DOI] [PMC free article] [PubMed] [Google Scholar]
- [29].Li Y, Cai G, Yuan S, et al. The overexpression membrane type 1 matrix metalloproteinase is associated with the progression and prognosis in breast cancer. Am J Transl Res. 2015;7:120–127. [PMC free article] [PubMed] [Google Scholar]
- [30].Maltoni R, Casadio V, Ravaioli S, et al. Cell-free DNA detected by “liquid biopsy” as a potential prognostic biomarker in early breast cancer. Oncotarget. 2017;8:16642–16649. [DOI] [PMC free article] [PubMed] [Google Scholar]
- [31].Lewis KA, Gray PC, Blount AL, et al. Betaglycan binds inhibin and can mediate functional antagonism of activin signalling. Nature. 2000;404:411–414. [DOI] [PubMed] [Google Scholar]
- [32].Györffy B, Lanczky A, Eklund AC, et al. An online survival analysis tool to rapidly assess the effect of 22,277 genes on breast cancer prognosis using microarray data of 1,809 patients. Breast Cancer Res Treat. 2010;123:725–731. [DOI] [PubMed] [Google Scholar]
- [33].Sutherland RL, Musgrove EA. CDK inhibitors as potential breast cancer therapeutics: new evidence for enhanced efficacy in ER+disease. Breast Cancer Res. 2009;11:112. [DOI] [PMC free article] [PubMed] [Google Scholar]
- [34].Miller MA, Lippman ME, Katzenellenbogen BS. Antiestrogen binding in antiestrogen growth-resistant estrogen-responsive clonal variants of MCF-7 human breast cancer cells. Cancer Res. 1984;44:5038–5045. [PubMed] [Google Scholar]
- [35].Thrane S, Lykkesfeldt AE, Larsen MS, et al. Estrogen receptor α is the major driving factor for growth in tamoxifen-resistant breast cancer and supported by HER/ERK signaling. Breast Cancer Res Treat. 2013;139:71–80. [DOI] [PubMed] [Google Scholar]
- [36].Wang Z, Zhang X, Shen P, et al. A variant of estrogen receptor-{alpha}, hER-{alpha}36: transduction of estrogen- and antiestrogen-dependent membrane-initiated mitogenic signaling. Proc Natl Acad Sci U S A. 2006;103:9063–9068. [DOI] [PMC free article] [PubMed] [Google Scholar]
- [37].Mo Z, Liu M, Yang F, et al. GPR30 as an initiator of tamoxifen resistance in hormone-dependent breast cancer. Breast Cancer Res BCR. 2013;15:R114. [DOI] [PMC free article] [PubMed] [Google Scholar]
- [38].Kang L, Zhang X, Xie Y, et al. Involvement of estrogen receptor variant ER-alpha36, not GPR30, in nongenomic estrogen signaling. Mol Endocrinol. 2010;24:709–721. [DOI] [PMC free article] [PubMed] [Google Scholar]
- [39].Santen RJ, Fan P, Zhang Z, et al. Estrogen signals via an extra-nuclear pathway involving IGF-1R and EGFR in tamoxifen-sensitive and -resistant breast cancer cells. Steroids. 2009;74:586–594. [DOI] [PubMed] [Google Scholar]
- [40].Yin L, Wang Z-Y. Roles of the ER-α36-EGFR/HER2 positive regulatory loops in tamoxifen resistance. Steroids. 2016;111:95–99. [DOI] [PubMed] [Google Scholar]
- [41].Oida K, Matsuda A, Jung K, et al. Nuclear factor-ĸB plays a critical role in both intrinsic and acquired resistance against endocrine therapy in human breast cancer cells. Sci Rep. 2014;4:4057. [DOI] [PMC free article] [PubMed] [Google Scholar]
- [42].Shah KN, Wilson EA, Malla R, et al. Targeting ribonucleotide reductase M2 and NF-κB activation with didox to circumvent tamoxifen resistance in breast cancer. Mol Cancer Ther. 2015;14:2411–2421. [DOI] [PubMed] [Google Scholar]
- [43].Nass N, Brömme H-J, Hartig R, et al. Differential response to α-oxoaldehydes in tamoxifen resistant MCF-7 breast cancer cells. PLoS One. 2014;9:e101473. [DOI] [PMC free article] [PubMed] [Google Scholar]
- [44].Elias D, Vever H, Lænkholm A-V, et al. Gene expression profiling identifies FYN as an important molecule in tamoxifen resistance and a predictor of early recurrence in patients treated with endocrine therapy. Oncogene. 2015;34:1919–1927. [DOI] [PubMed] [Google Scholar]
- [45].Ward A, Balwierz A, Zhang JD, et al. Re-expression of microRNA-375 reverses both tamoxifen resistance and accompanying EMT-like properties in breast cancer. Oncogene. 2013;32:1173–1182. [DOI] [PubMed] [Google Scholar]
- [46].Ward A, Shukla K, Balwierz A, et al. MicroRNA-519a is a novel oncomir conferring tamoxifen resistance by targeting a network of tumour-suppressor genes in ER+ breast cancer. J Pathol. 2014;233:368–379. [DOI] [PMC free article] [PubMed] [Google Scholar]
- [47].Joshi T, Elias D, Stenvang J, et al. Integrative analysis of miRNA and gene expression reveals regulatory networks in tamoxifen-resistant breast cancer. Oncotarget. 2016;7:57239–57253. [DOI] [PMC free article] [PubMed] [Google Scholar]
- [48].Wei Y, Lai X, Yu S, et al. Exosomal miR-221/222 enhances tamoxifen resistance in recipient ER-positive breast cancer cells. Breast Cancer Res Treat. 2014;147:423–431. [DOI] [PubMed] [Google Scholar]
- [49].Peng W-X, Huang J-G, Yang L, et al. Linc-RoR promotes MAPK/ERK signaling and confers estrogen-independent growth of breast cancer. Mol Cancer. 2017;16:161. [DOI] [PMC free article] [PubMed] [Google Scholar]
- [50].Wang K, Li J, Xiong Y-F, et al. A potential prognostic long noncoding RNA signature to predict recurrence among ER-positive breast cancer patients treated with tamoxifen. Sci Rep. 2018;8:3179. [DOI] [PMC free article] [PubMed] [Google Scholar]
- [51].Klinge CM. Non-coding RNAs in breast cancer: intracellular and intercellular communication. Noncoding RNA. 2018;4:40. [DOI] [PMC free article] [PubMed] [Google Scholar]
- [52].Klinge CM. Non-coding RNAs: long non-coding RNAs and microRNAs in endocrine-related cancers. Endocr Relat Cancer. 2018;25:R259–82. [DOI] [PubMed] [Google Scholar]
- [53].Niknafs YS, Han S, Ma T, et al. The lncRNA landscape of breast cancer reveals a role for DSCAM-AS1 in breast cancer progression. Nat Commun. 2016;7:12791. [DOI] [PMC free article] [PubMed] [Google Scholar]
- [54].Becker M, Sommer A, Krätzschmar JR, et al. Distinct gene expression patterns in a tamoxifen-sensitive human mammary carcinoma xenograft and its tamoxifen-resistant subline MaCa 3366/TAM. Mol Cancer Ther. 2005;4:151–168. [PubMed] [Google Scholar]
- [55].Huber-Keener KJ, Liu X, Wang Z, et al. Differential gene expression in tamoxifen-resistant breast cancer cells revealed by a new analytical model of RNA-Seq data. PLoS ONE. 2012;7:e41333. [DOI] [PMC free article] [PubMed] [Google Scholar]
- [56].Harmalkar M, Upraity S, Kazi S, et al. Tamoxifen-induced cell death of malignant glioma cells is brought about by oxidative-stress-mediated alterations in the expression of BCL2 family members and is enhanced on miR-21 inhibition. J Mol Neurosci. 2015;57:197–202. [DOI] [PubMed] [Google Scholar]
- [57].Wang KC, Chang HY. Molecular mechanisms of long noncoding RNAs. Mol Cell. 2011;43:904–914. [DOI] [PMC free article] [PubMed] [Google Scholar]
- [58].Guo W, Wang Q, Zhan Y, et al. Transcriptome sequencing uncovers a three-long noncoding RNA signature in predicting breast cancer survival. Sci Rep. 2016;6:27931. [DOI] [PMC free article] [PubMed] [Google Scholar]
- [59].Curtis C, Shah SP, Chin S-F, et al. The genomic and transcriptomic architecture of 2,000 breast tumours reveals novel subgroups. Nature. 2012;486:346–352. [DOI] [PMC free article] [PubMed] [Google Scholar]
- [60].Cancer Genome Atlas Network Comprehensive molecular portraits of human breast tumours. Nature. 2012;490:61–70. [DOI] [PMC free article] [PubMed] [Google Scholar]
- [61].Ritchie ME, Phipson B, Wu D, et al. limma powers differential expression analyses for RNA-sequencing and microarray studies. Nucleic Acids Res. 2015;43:e47. [DOI] [PMC free article] [PubMed] [Google Scholar]
- [62].Waggott D, Chu K, Yin S, et al. NanoStringNorm: an extensible R package for the pre-processing of NanoString mRNA and miRNA data. Bioinforma Oxf Engl. 2012;28:1546–1548. [DOI] [PMC free article] [PubMed] [Google Scholar]
- [63].Weinstein JN, Myers TG, O’Connor PM, et al. An information-intensive approach to the molecular pharmacology of cancer. Science. 1997;275:343–349. [DOI] [PubMed] [Google Scholar]
- [64].Kutmon M, van Iersel MP, Bohler A, et al. PathVisio 3: an extendable pathway analysis toolbox. PLoS Comput Biol. 2015;11:e1004085. [DOI] [PMC free article] [PubMed] [Google Scholar]
- [65].Huang DW, Sherman BT, Lempicki RA. Bioinformatics enrichment tools: paths toward the comprehensive functional analysis of large gene lists. Nucleic Acids Res. 2009;37:1–13. [DOI] [PMC free article] [PubMed] [Google Scholar]
- [66].Huang DW, Sherman BT, Lempicki RA. Systematic and integrative analysis of large gene lists using DAVID bioinformatics resources. Nat Protoc. 2009;4:44–57. [DOI] [PubMed] [Google Scholar]
- [67].Nass N, Sel S, Ignatov A, et al. Oxidative stress and glyoxalase-1 activity mediate dicarbonyl toxicity in MCF-7 mamma carcinoma cells and a tamoxifen resistant derivative. Biochim Biophys Acta. 2016;1860:1272–1280. [DOI] [PubMed] [Google Scholar]
- [68].Schneider CA, Rasband WS, Eliceiri KW. NIH Image to ImageJ: 25 years of image analysis. Nat Methods. 2012;9:671–675. [DOI] [PMC free article] [PubMed] [Google Scholar]
Associated Data
This section collects any data citations, data availability statements, or supplementary materials included in this article.
Supplementary Materials
Data Availability Statement
The data that support the findings of this study are available from the corresponding author, [NN], upon reasonable request.