Abstract
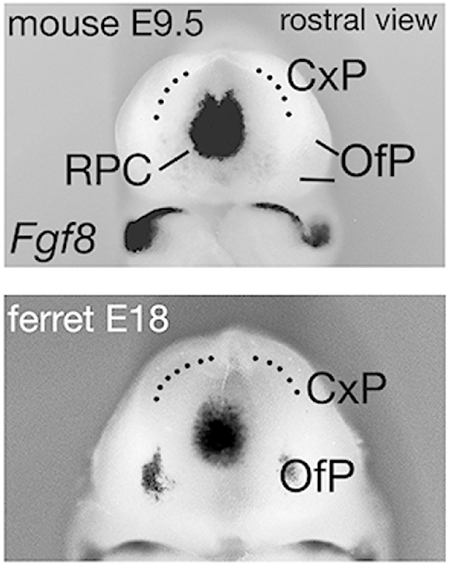
In the mouse, two telencephalic signaling centers orchestrate embryonic patterning of the cerebral cortex. From the rostral patterning center in the telencephalon (RPC), the Fibroblast Growth Factor, FGF8, disperses as a morphogen to establish the rostral to caudal (R/C) axis of the neocortical area map. FGF8 coordinates with Wnt3a from the cortical hem to regulate graded expression of transcription factors that position neocortical areas, and control hippocampal development. Whether similar signaling centers pattern the much larger cortices of carnivore and primate species, however, is unclear. The limited dispersion range of FGF8 and Wnt3a is inconsistent with patterning larger cortical primordia. Yet the implication that different mechanisms organize cortex in different mammals flies in the face of the tenet that developmental patterning mechanisms are conserved across vertebrate species. In the present study, both signaling centers were identified in the ferret telencephalon, as were expression gradients of the patterning transcription factor genes regulated by FGF8 and Wnt3a. Notably, at the stage corresponding to the peak period of FGF8 signaling in the mouse neocortical primordium (NP), the NP was the same size in ferret and mouse, which would allow morphogen patterning of the ferret NP. Subsequently the size of ferret neocortex shot past that of the mouse. Images from online databases further suggest that NP growth in humans, too, is slowed in early cortical development. We propose that if early growth in larger brains is held back, mechanisms that pattern the neocortical area map in the mouse could be conserved across mammalian species.
Keywords: Ferret, mouse, cerebral cortex, neocortical area map, FGF8, Wnt3a, morphogen, embryonic patterning, RRID: AB_514497, RRID:SCR 003070
Graphical Abstract
Embryonic morphogens, including FGF8, initiate functional division of mouse cerebral cortex. In ferrets, the cortex is far larger, but at the critical developmental stage, the cortical primordia of the mouse and ferret are the same size, suggesting that morphogens with a limited range can pattern ferret and even human cortex.
1. INTRODUCTION
The major components of the mammalian cerebral cortex are the neocortex and hippocampus, which, in turn, are subdivided into areas or fields. In neocortex, distinct areas mediate higher brain functions such as perception, decision, and complex motor control. These areas form a map across the sheet of the neocortex that is relatively consistent from one individual to another in the same species, and shares common features across species (Krubitzer & Stolzenberg, 2014; Nauta & Feirtag, 1986). The hippocampus comprises four fields with functions in memory consolidation and spatial navigation, and its field organization is conserved from mouse to human (Moser & Moser, 1998; Squire, 1987; Wallenstein, Eichenbaum, & Hasselmo, 1998).
Correct subdivision of the cerebral cortex is essential to brain function. Changes in the size of individual neocortical areas or hippocampal fields cause behavioral, cognitive and memory deficits in mice and humans (Caronia, Wilcoxon, Feldman, & Grove, 2010; Cooper et al., 2015; Leingartner et al., 2007; Rubenstein, 2010; Scearce-Levie et al., 2007; Zola-Morgan, Squire, & Amaral, 1986). Despite considerable investigation, however, the mechanisms that subdivide the cortical primordium are still far from understood (O’Leary, Chou, & Sahara, 2007; O’Leary & Sahara, 2008; Simi & Studer, 2018).
The prevailing model of how the neocortical area map is generated is based largely on research in the mouse, and findings support a version of the “protomap” model of intrinsic neocortical patterning, first proposed three decades ago (Rakic, 1988). That is, signaling events intrinsic to the embryonic neocortical primordium (NP) initiate area division of the neocortex, and subsequently neural signaling from thalamus to cortex refines area boundaries and area-specific features (Chou et al., 2013; Rakic, 1991; Rakic, Suner, & Williams, 1991; Simi & Studer, 2018).
Two signaling sources initiate patterning of the mouse cerebral cortex: the rostral telencephalic patterning center (RPC), which produces several FGFs (Borello et al., 2008; Cholfin & Rubenstein, 2007; Hoch, Clarke, & Rubenstein, 2015), and the cortical hem, in the dorsomedial telencephalon, rich in Wingless/Integrated (Wnt) proteins (Grove, Tole, Limon, Yip, & Ragsdale, 1998). From the RPC, FGF8 disperses through the NP in a rostral to caudal (R/C) gradient, providing progenitor cells with positional information (Assimacopoulos, Kao, Issa, & Grove, 2012; Cholfin & Rubenstein, 2008; Fukuchi-Shimogori & Grove, 2001; Garel, Huffman, & Rubenstein, 2003; Sato, Kikkawa, Saito, Itoi, & Osumi, 2017; Toyoda et al., 2010). Supporting the hypothesis that FGF8 sets up the R/C axis of the neocortical area map, experimentally augmenting the FGF8 source enlarges rostral areas at the expense of caudal areas, whereas depleting FGF8 has the opposite effect (Assimacopoulos et al., 2012; Cholfin & Rubenstein, 2008; Fukuchi-Shimogori & Grove, 2001; Garel et al., 2003; Sato et al., 2017). Most striking, introducing a second, caudal FGF8 source into the early NP reverses the local R/C axis, inducing the formation of mirror-reversed duplicate areas (Assimacopoulos et al., 2012 {Cholfin, 2007 #1489; Fukuchi-Shimogori & Grove, 2001; Huffman, Garel, & Rubenstein, 2004). Meanwhile, the (Wnt)-rich cortical hem is required for development of the hippocampus and caudomedial neocortex, and influences the medial to lateral (M/L) axis of the NP (Caronia-Brown, Yoshida, Gulden, Assimacopoulos, & Grove, 2014; Grove et al., 1998; Lee, Tole, Grove, & McMahon, 2000; Mangale et al., 2008; Muzio, Soria, Pannese, Piccolo, & Mallamaci, 2005).
Together, FGF8 and Wnt3a shape NP expression gradients of transcription factor genes, including Sp8, Emx2, Dmrt5 and Nr2f1, which control the size and position of areas in the neocortical map, as well as hippocampal development (Armentano et al., 2007; Bellefroid et al., 2013; Cholfin & Rubenstein, 2008; De Clercq et al., 2016; Fukuchi-Shimogori & Grove, 2003; Garel et al., 2003; Hamasaki, Leingartner, Ringstedt, & O’Leary, 2004; Muzio et al., 2005; Saulnier et al., 2012; Storm et al., 2006; Storm, Rubenstein, & Martin, 2003; Zembrzycki, Griesel, Stoykova, & Mansouri, 2007). For example, FGF8 represses Nr2f1 expression, which is accordingly strongest in the caudal NP. Nr2f1 suppresses rostral area identities, and balances the relative amount of the NP allotted to rostral versus caudal area fates (O’Leary et al., 2007). Conditional deletion of Nr2f1 causes a massive expansion of rostral areas, including motor cortex, and a severe contraction of caudal primary sensory areas (Armentano et al., 2007). Emx2 expression is downregulated by FGF8 and upregulated by Wnt3a, and consequently appears in a high caudomedial to low rostrolateral gradient in the NP (Caronia-Brown et al., 2014; Fukuchi-Shimogori & Grove, 2003; Garel et al., 2003; Muzio et al., 2005). Emx2 actively promotes caudal area fate, and Emx2 overexpression in the NP enlarges caudal sensory areas and reduces rostral areas (Hamasaki et al., 2004). Because in each of these experimental manipulations rostral areas expand at the expense of caudal areas, or vice versa, the cortical hemisphere maintains a normal overall size. Further supporting a protomap model, protodomains in the cortical primordium, identified by the activity of small enhancer elements that regulate expression of patterning genes, give rise to discrete regions in the mouse neocortex and hippocampus (Pattabiraman et al., 2014).
The original protomap model was based on observations of primate neocortex (Rakic, 1988), a reminder that the ultimate goal is to discover mechanisms that pattern cerebral cortex in all mammals, including humans. Whether the processes that pattern the small lissencephalic mouse cortex also shape the larger, gyrencephalic brains of carnivores and primates remains unknown. Patterning molecules, or morphogens, such as FGF8 and Wnt3a, have limited dispersion ranges of a few hundred microns (Farin et al., 2016; Parchure, Vyas, & Mayor, 2018; Scholpp & Brand, 2004). Larger, more complex cortices presumably derive from larger cortical primordia whose sheer size could prevent adequate morphogen dispersion. Yet, different basic mechanisms for neocortical patterning in different mammalian species does not fit with a central finding in developmental biology, namely the high conservation of patterning mechanisms across vertebrates (Alberts B, 2015). Consistent with conserved patterning processes primary sensory and motor areas take up similar relative positions in the neocortical maps of a wide range of mammals (Krubitzer & Stolzenberg, 2014; Nauta & Feirtag, 1986).
One way around the problem of patterning a larger brain would be to hold back growth at an early stage so that morphogen gradients can be effective in specifying individual brain components. We tested this possibility by determining if there is early restraint on the growth of the NP in the gyrencephalic carnivore, the ferret, Mustela putorius furo, whose mature brain is several times the volume of the adult mouse brain. The ferret was specifically selected for study because it belongs to a different mammalian superorder, Laurasiatheria, from primates and rodents. The latter are members of the superorder Euarchontoglires (Murphy et al., 2001). Ferrets and other carnivores are thus more distantly related phylogenetically to mice than are humans and other primates, suggesting that if cortical patterning mechanisms are similar in mouse and ferret, they hold for primates too.
In the present study, we focus on the stage in ferret telencephalic development that corresponds to the peak of morphogen-driven area patterning in the mouse embryo. At embryonic day (E) E9.5, FGF8 protein disperses in a classic morphogen gradient (Lander, Nie, & Wan, 2002; Wolpert, 1996), through the entire R/C extent of the NP (Toyoda et al., 2010), and, just after E9.5, Wnt3a is first expressed in the cortical hem (Lee et al., 2000). The area map remains malleable to manipulations of FGF8 until at least E11.5 (Fukuchi-Shimogori & Grove, 2001), however, and genetic ablation of the hem as late as E10.5 causes loss of the hippocampus and reduction of caudomedial neocortex (Caronia-Brown et al., 2014; Yoshida, Assimacopoulos, Jones, & Grove, 2006). The critical time of morphogen patterning in the mouse cortical primordium seems close to E9.5, though experimental manipulations can change regional fate for a short time afterwards.
The stages of mouse embryonic development, from implantation to birth, have been well-defined by examining features of both body and brain (Theiler, 1989). In contrast, only one study has described features of the ferret embryo over a substantial period of embryogenesis, concentrating on development of the body, and largely excluding the CNS (Gulamhusein & Beck, 1981). We therefore compared features of the body and brain in mouse embryos from E9.0 to E12.5 with ferret embryos from E17 to E23, generating a rough guide for equating ferret and mouse embryonic ages during early neural development. The cortical hem and RPC were identified in the ferret NP by gene expression, as was the graded expression of patterning transcription factor genes downstream of FGF8 and Wnt3a. Finally, the R/C extent of the NP was measured along its outer curved surface, and measurements compared between age-equivalent ferret and mouse. We found that at the stage at which FGF8 initiates patterning of the area map in mouse, the NP is a similar R/C length in the two species, and that, soon after, growth of the ferret telencephalon accelerates past that of the mouse.
2. METHODS
2.1. Animals
All animal procedures were conducted in accordance with the University of Chicago Institutional Animal Care and Use Committee (IACUC), and National Institutes of Health regulations. Timed-pregnant ferrets were obtained from Marshall BioResources (North Rose, NY) and were housed at the University of Chicago Animal Resources Center for 72 hours before use. The University of Chicago Transgenic Mouse and Embryonic Stem Cell Facility bred timed-pregnant CD-1 mice (from Charles River) in-house. CD-1 mice are the mice in which the cortical hem was originally identified, and in which the rostral FGF8 source was manipulated to alter the area map (Assimacopoulos et al., 2012; Fukuchi-Shimogori & Grove, 2001; Grove et al., 1998). Mice and ferrets were kept on the same 12:12 hour day/night cycle. Mice breed during the night, but ferrets at the beginning of the day. Therefore, for mouse timed-pregnancies, noon on the day a vaginal plug was seen was designated embryonic (E) day 0.5 (E0.5), and for ferrets, the day of mating was designated E0. Ferret and mouse embryos were collected at a range of ages and immersed in 4% paraformaldehyde at least overnight before further processing. Fixative may cause the embryonic tissue to contract, but both ferret and mouse embryos were treated in the same way, and as in a previous study in which FGF8 dispersion in the dorsal telencephalon was estimated (Toyoda et al., 2010). Whole embryos were used for anatomical observations, or processed with in situ hybridization (ISH) to show expression of specific genes, or both. Ferrets embryos were assessed at E17, E18, E19, E22 and E23. Mouse embryos were collected at E9.0, E9.5, E10.0, E10.5, E11.0, E11.5, E12.0 and E12.5. Numbers of animals examined at each age are given with the relevant observations in Results, and were obtained from at least two litters per age for ferrets, and at least three litters per age for mice.
2.2. cDNA preparation
Mouse cDNAs for riboprobes were generated previously, obtained from other laboratories or ordered from the IMAGE Consortium. All were sequenced before use. Mouse cDNAs for riboprobes included: Fgf8 (gift of G. Martin, UCSF); Emx2 (gift of P. Gruss, University of Gottingen); Wnt8b (Image Consortium #AA170920); Nr2f1 (gift of S. Tsai, Baylor College of Medicine). The Wnt3a riboprobe was previously generated in the senior author’s laboratory (Grove et al., 1998). Riboprobes for ferret were newly generated: cDNA was synthesized from minced, unfixed brains at ferret age E22. Total RNA was extracted using Trizol Reagent (Ambion), and cDNA was synthesized using the Superscript III 1st strand cDNA kit (Fisher Scientific)], following manufacturer instructions.
2.3. Molecular cloning
The full Mustela putorius furo genome has not yet been published so relevant DNA sequences were obtained through databases of partial sequences curated by the National Center for Biotechnology Information (NCBI). Polymerase chain reaction (PCR) primers were designed with Primer3 online software (bioinfo.ut.ee/primer3-0.4.0/). PCR reactions were performed with a GeneAmp 9700 (Applied Biosystems). 50ul PCR reaction mixtures contained 2uL cDNA, Platinum Taq DNA Polymerase (Invitrogen), and other standard reagents at concentrations following manufacturer instructions. Reaction solutions were heated to 94°C for 2 min, followed by 35 cycles of 94°C for 30 sec, 50–55°C for 30 sec, and 72°C for 1 min per kilobase of predicted product length. A final elongation step was performed at 72°C for 15 min. PCR products were ligated into plasmids and were sequenced at the University of Chicago Comprehensive Cancer Center DNA Sequencing Facility. For in situ hybridization (ISH), plasmids were linearized with appropriate restriction endonucleases and subjected to run-off in vitro transcription to prepare antisense RNA probes. Probes were purified, analyzed using gel electrophoresis to confirm successful transcription and concentration, re-suspended in RNase-free water and stored at −20°C before use.
Sequences of the ferret gene fragments (f) that were cloned and used to generate riboprobes were:
fFgf8 (1041 bp)
5’ GCTCGGCGCTCAGCTGCCTGTGAGTACGGCCGCCGCCCCCCGCGTCCCCGCCGGCCCCGCGCCGCCGCGCCCTCTCCGCTCACCCCGCGCCCTCTCTCTCCCGCCCGCTTTTGTCTCCCACAGGCTGTTGCACTTGCTGGTTCTCTGCCTCCAAGCCCAGGTAAGGCGCATTGCGCGGCGGCGGGGCCCGGGCGGGTCGGCGGGGGCCGCCAGTTGGCAAGGTCGGGCAGGGGCCCAAGGACCGACCCTGCGGCCAGCGCTGCAGGGCTGGGAGGAACCTTAGAAATCTAGCCCCGAACCTGCTTGGAGGGAGCCCGGGAACAGAGAGGGAGCGCCCTGCCTAAGGTAACACAGCTAGTGTGCAGCGAGGCTCGAACCCAAGGTTTCGGGCTCCAGCGCTGTCTCTCACACCTCCTAGCCAGGTTAGGGTGGATGGGGAACTCTACAGGCAGCCACACCTGGCTGCCGAGGAAGGCGGGGGAGCTGGGGCCAGGGAGCGTTCGTTGTCACAAGTCCCCGGGACGGCCGCAGGGACTCCCTTCGTGGCTCTCTGGGGAGACTTGTGGCGGGTCTGGCCGAAAGATCAGGTGCCTAGGCTCTCTGCGCTCTCAACATTTGCTCTGTAAATTTGTCTTTATAAATGTCAGCGGTTGGGTAGCGCTGCCTCCCTACTTAGAAGCGCCCTGCTTTTCTAGGAAGGCGTAGGGAGGGGGCGAGGGGCGGCCGCTCTGGGCAGAGAACTTGCTTCCCTGATCGGAGCTGGCGGGGAGTCCCAGGGTGTTTCCCAACAGGTAGGTCCATCCAGATCGGTCCAAGCTCATCCTTGCTAGGCTGGGTCTGCTCCACTTTCCTGGATTGGGTGCTGGGGCCTGAGCTGGCTTGTTGTGAGGGTAACCCCCCTCCAAGTTCTTGTAGGCTGCTTGGGGCAGTGGAGGCGTGTGCAGGGTGATGGGGGCCACTTGGGCCCCTGGGCAGAGTAGCATTATAACTGTTCAGTCCTCACCT-3’
fNr2f1 (724 bp)
5’-CATCCAGTGCTCCTAGACCTTGGGCGCTCCCCACCTGCCCCCGCCCCCCTAGAGACTCACTGGACCGGCGGGGGCCATGGACTCCAAAGCTGCGGGGACATCAGGCGGCTGTTGCAGGGTGCAGCCAGGCAGGGGGGAGGTGGGCCGGGCCGACAGGAGCAGCCCACCCTGCAGAAATGCAACCCGAGCTGCAAACCAGGAGAAAAAGAGACTCTCTTTAGGATCAGATCTGTGAACATGTTGGAAAGGAAAGAAAAAGGACTTTGTGTCTGGTGAGAAAAGGAAAAAAAAAATTGGAAGAGAGGACCATGAAAATTTTAATAAAACAGAAGGAGACTAATGGACCTTCCAGGATTTATTGTGGACGGATGTGGATATATTCTGTACAGAAAACAACACATGGAAGTGGACTGAATTCTATGTAGAAACACACACACACGCCCCAAACATTGTTATTCATTTTGTAAAATACTAGTCTTTATTTTCATTTTTTTGTAAAATTTAAACATCGTATGCACATAAAAAAGGAAACAAGAATTAGGGGAAAATAACATTTTCCAAATAATTATAAAAAAATTGTCCTGTGTCTATGTATCTATATCTGTTTTGTATTTTTTTCTGGTTCCAAACCAGATTTCCTGTGATTCTATACTAATAATTTTTGATATAACCCTTTGCTTCTTATAATGAGTGCGATATATGTTGTCAAGGCTGTTCTTCAAGA-3’
fWnt3a (637 bp)
5’-TCAGCATCCAGGAGTGTCAGCACCAGTTCCGCGGCCGCCGCTGGAATCGTACCACTGTGGACAACAGCCTGGCCATCTTTGGCCCTGTGCTGGACAGAGCCACGCGGGAATCTGCCTTTGTGCACGCCATCGCCTCTGCCGGCGTGGCCTTCGCTGTGACGCGCTCATGCGCTGAGGGCTCGGCGGCCATCTGTGGCTGCAGCAGCCGGCACCAGGGCTTGCCGGGCGAGGGCTGGAAGTGGGGCGGCTGCAGTGAGGACATCGAATTTGGCGGCATGGTGTCTCGGGAGTTTGCCGATGCGCGGGAGAACCGGCCAGACGCCCGCTCCGCGATGAACCGTCACAACAACGAGGCTGGCCGCCAGGCCATCGCCAGCCACATGCATCTCAAGTGCAAGTGCCACGGGCTGTCGGGCAGCTGTGAGGTGAAGACCTGCTGGTGGTCGCAGCCCGACTTCCGTGCCATCGGCGACTTCCTCAAGGACAAGTACGACAGCGCCTCGGAGATGGTCGTGGAGAAGCACCGCGAGTCGCGCGGCTGGGTGGAAACCCTGCGGCCGCGCTACACCTACTTCAAGGTGCCCACGGAGCGCGATCTGGTGTACTACGAGGCCTCGCCCAACTTCTGCGAACCCAA-3’
fWnt8b (559 bp)
5’-TAGAGACAGGACAGGATGCTCGCCCTTTCGGGCAGCCATGAACCTGCACAACAATGAGGCTGGCCGCAAGGCGGTGAAGGGCACCATGAAACGCACGTGTAAGTGCCACGGAGTGTCCGGCAGCTGCACCACGCAGACCTGCTGGCTGCAGCTGCCCGAGTTCCGCGAGGTGGGCGCGCACCTGAAGGAGAAGTACCACGCGGCTCTCAAGGTGGACCTGCTGCAGGGGGCCGGCAACAGTGCCGCCGGCCGAGGCGCCATCGCCGACACCTTCCGCTCCATCTCCACGCGGGAGCTGGTGCACTTGGAGGACTCTCCGGACTACTGCCTGGAGAACAAGACGCTGGGGCTGCTGGGGACAGAAGGCCGAGAGTGCCTGCGGCGCGGACGGGCCCTAGGCCGCTGGGAGCGCCGCAGCTGCCGCCGGCTCTGCGGGGACTGCGGGCTGGCGGTGGAGGAGCGCCGCGCCGAGACCGTGTCCAGCTGCAACTGCAAGTTCCACTGGTGCTGCGCGGTCCGCTGCGAGCAGTGCCGCCGCCGGGTCACCAAATACTTCTGC-3’
fEmx2 (839 bp) (ISH not shown)
5’-AACCGAACCCCACAGAAACGGACACCACGGAGCAAAACAGACAGGGAGAGGAGGGGTAGAAGAAAAACAAAAACAAGCTACAAAACAAAAACAAACCGCACACACACACACATACACACACAGTCACCGAGAAGAGGAAGAGGGAGTCAGAGAGTGTCGGCGCTTCGCGGACTTTGGGCAGCGAGGGCGCGGGGTCCTGATCCCAGGCTGCACGGAGATGGCAGAGGACGCAGGCTACTTGATCAACAGGCACCCCTTGTCTAAAGAGGCAGCTGAGAAAGAGAGAGCGAGAGAGAGAAAGAGAGTGAGACAGAGAAAGAGAGGGAGAGGGAGAGAGATCCAAATGTGGCACCGTGGAAGGCGCTCTGAACAAGGGAAGCTGTCAGTCAACGCCAGCCCAGCGAGACAAGATGATTGGCAGGTATTCCATTTATCGCAGTCCTGATTTTTTTTTTAAATAATAATGGTAATAATAATGATGGTAAAAGAAAACCCCAACCAGGCACAGGACTTTTTCTTTTGCACTTCGCAGAGTCTCCCCCCCACCAATCTTTAAAAAATAATTAGTAATACTAGCAATCGAAATTCCGTATCTAGCCCCAACCCACACCTGTTCAAAAACTTAAATTGCATGTTGCAGTTGTTGGGCGAATGGTGTCTAAAGACAGAAAATGAATTGTAATTTTCTTTTCCTTTGAAAGACAGGTTCTGTGTGCTTTTTATTTTGATTTTTTTTTCGAGAAATGTGCAGTCTGTAAACACTTCTTGATACCTTCTGATGTCAAAGTGATTGTGAAAGGTAAATGAAGTAGGCTCCGCGATAGTGGTCCTCTTACGGA-3’
2.4. Whole-mount in situ hybridization
Specimens were fixed in 4% paraformaldehyde, dehydrated in methanol and stored overnight at −20°C before rehydration. Small access holes were cut in the midbrain or the caudal telencephalon on one side to permit reagent access. Hybridization was overnight at 70°C in 5ml of hybridization solution with at least 800ng of antisense RNA probe. Post-hybridization, specimens were washed in a 50% formamide, 2× SSC and 1% SDS solution at 70°C, washed 3× in TBS with 1% Tween-20, and then blocked in 10% lamb serum in TBS with 1% Tween-20. Immunohistochemical detection of the probe used alkaline phosphatase (AP)-conjugated anti-digoxigenin (DIG) FAB fragments (Roche), and nitroblue tetrazolium chloride and 5-bromo-4-chloro-3-indolyl phosphate for visualization.
Antibody characterization:
Anti-DIG-AP binds to digoxigenin, which is not endogenous to vertebrate tissue. (Roche Diagnostics, sheep polyclonal, Fab fragments conjugated to alkaline phosphatase, catalog #11093274910, RRID: AB_514497; dilution used 1:5,000). In control experiments, digoxigenin-labeled RNA was omitted from the hybridization mixture. No signal was detected in the absence of digoxigenin-labeled riboprobes.
2.5. Descriptive embryology and image capture
Embryos were examined using a Leica MFLZ III microscope, either with transillumination, which gave a clear view of somites and other body features, or with illumination from above to see gene expression patterns. Images were obtained by photographing the embryos in several different views with an AxioCam HRc camera (for color images) or an AxioCam MRm camera (grayscale images) and storing images with AxioVision software (version 4.8, Zeiss). Greyscale images were used to determine which mouse and ferret ages corresponded most closely with respect to stage of embryonic development. Color images represented gene expression patterns. For figures, images were cropped and corrected for brightness and contrast using Photoshop CS6 (Adobe Systems). Specific observations included somite count and a descriptive survey of externally visible features. Measurements were made using ImageJ (NIH, public domain, RRID: SCR 003070). These included crown-rump length (CRL), greatest length (GL), and axial length (AL), which followed the entire curve of the embryo from the front of the head to the tip of the tail. The neocortical surface length (NSL) was drawn freehand along the outer surface of the telencephalon from the upper boundary of the FGF8 source (the likely border of the presumptive septum) to an inflection that marks the caudal end of the telencephalon (Toyoda et al., 2010). For each embryo in which the NSL was measured, a standard specimen of the same age, processed with ISH for Fgf8, was used for reference. Each embryo was measured three times, and the three values for AL and NSL were averaged; for GL and CRL, the largest measurement was taken. Student’s t test was used for statistical comparisons between ferret and mouse for NSL, CRL, GL, and AL measurements. The acceptable significance cut-off was set at p = 0.01.
2.6. Use of a human embryo image in Figure 12A
Figure 12. R/C length of the NP appears similar in CS13 human and E9.5 mouse.
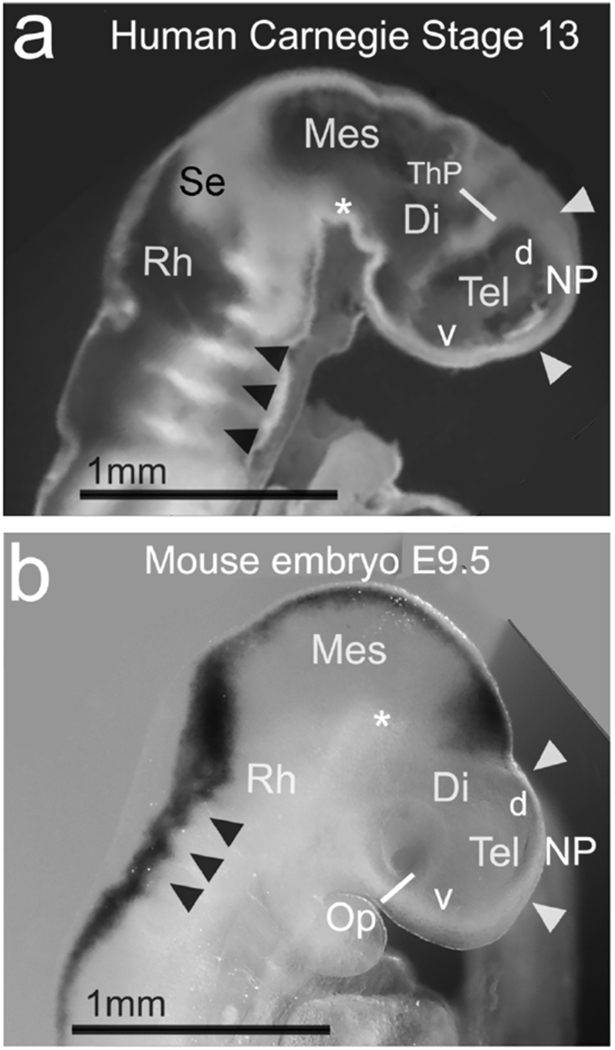
(a,b) A human and mouse embryo compared. The human embryo image in (a) is adapted from an image of a midline sagittal section through a CS13 human embryo, shown in movie 7.11 (Hill et al., 2016), and online (Hill, M.A., 2018, September 24, Embryology Stage 13 EFIC Movie 1.) Labeling is by the authors of the present study. The mouse embryo in lateral view in (b) is cropped from Figure 1b above, rotated, and enlarged to the same scale as in (a). (a,b) White arrowheads indicate our estimate of the rostral and caudal NP boundaries in each specimen. The two NPs appear comparable in size. Black arrowheads indicate rhombomeres, and white asterisks indicate the cephalic flexure in (a,b). Abbreviations: d, dorsal (telencephalon); Rh, rhombencephalon; ThP, thalamic primordium; v, ventral (telencephalon).
The image of a human embryo at Carnegie Stage 13 in Figure 12A was modified with permission from an image (a still from a movie) in the ebook, “Kyoto Embryo Collection”, Hill, M. A., Shiota, K., Yamada, S., & Lo, C. W. (2016). Kyoto Embryo Collection; UNSW Embryology Series; ISBN 978-0-7334-3528-7. The original image is also available in the online database “Kyoto Collection Embryology” at https://embryology.med.unsw.edu.au/embryology/index.php/Carnegie_stage_13.
3. RESULTS
3.1. Equating developmental stages of ferret and mouse embryos
With no direct information on when ferret embryos resemble mice at the critical stage of morphogen patterning in the dorsal telencephalon, we began by examining ferrets at E22 and E23, which, to a cursory view, resembled mouse embryos at E12.5 – E13.5. Ultimately, we compared ferret embryos at E17, E18, E19, E22, and E23 with CD-1 mouse embryos at E9.0, E9.5, E10.0, E10.5, E11.0, E11.5, E12.0 and E12.5, constructing a guide for equating ferret and mouse embryos at these ages. Examining mice at half-day intervals and ferrets at one-day intervals reflects the gestation periods of the mouse (18-19 days) and ferret (42 days).
Somite number is a standard metric for establishing embryonic stage because the rate of somite formation is stereotypical among embryos of a particular species. Equating the developmental stage of embryos from two different species by somite count, however, is problematic. The final number of somites correlates with the number of vertebrae in the adult, which differs among mice, ferrets and humans (Cook, 1965; Hedrich & Bullock, 2004; O’Rahilly & Müller, 2001; Theiler, 1989). Consistent with this, we found that somite counts in mouse and ferret were aligned at earlier embryonic ages, but not at later ages (Table 1). In addition to somite count, therefore, other developmental milestones were utilized. The anatomical justification for mouse/ferret “equivalencies” was the overall appearance of the specimen with respect to features of the head, neural tube, eyes, trunk and limbs.
Table 1.
Somite counts in early ferret and mouse embryos
| Species |
Age |
Number animals |
Maximum Somites |
Minimum Somites |
Mean Somites |
SEM |
|---|---|---|---|---|---|---|
| Ferret | E17 | 6 | 32 | 28 | 30 | 0.6 |
| E18 | 8 | 40 | 28 | 34 | 1.7 | |
| E19 | 5 | 49 | 44 | 47 | 1.0 | |
| Mouse | E9.0 | 8 | 22 | 18 | 19 | 0.5 |
| E9.5 | 16 | 30 | 21 | 27 | 0.7 | |
| E10.0 | 24 | 34 | 29 | 32 | 0.3 | |
| E10.5 | 10 | 44 | 32 | 37 | 1.3 | |
| E11.0 | 3 | 48 | 44 | 46 | 1.2 | |
| E11.5 | 9 | 54 | 45 | 49 | 1.1 | |
Equivalent stages of ferret and mouse embryo development cannot be determined with somite counts alone. Older ferret and mouse ages are not included in the table because by E22 in ferrets and E12.0 in mice, cervical somites are no longer visible.
3.1.1. E17 ferret equivalence with E9.5 mouse, Theiler stage 15
In E17 ferret and E9.5 mouse (Figure 1), the telencephalon, diencephalon, midbrain and hindbrain divisions of the neural tube were distinct. The rostral neuropore was closed in both species, but the caudal neuropore was still open in 3/7 ferret specimens, and in all mouse embryos examined (12/12). Three pharyngeal arches were present, and the maxillary and mandibular prominences of the first pharyngeal arch were visible (Figure 1c,d). The optic and otic vesicles were closed but not yet indented (Figure 1c,d), and no olfactory plate was obvious. Elsewhere in the trunk, the forelimb bud (FLB) had condensed (Figure 1a,b) but no hindlimb bud (HLB) was seen.
Figure 1. E17 ferret and E9.5 mouse, neural tube is closing and CNS structures are well defined.
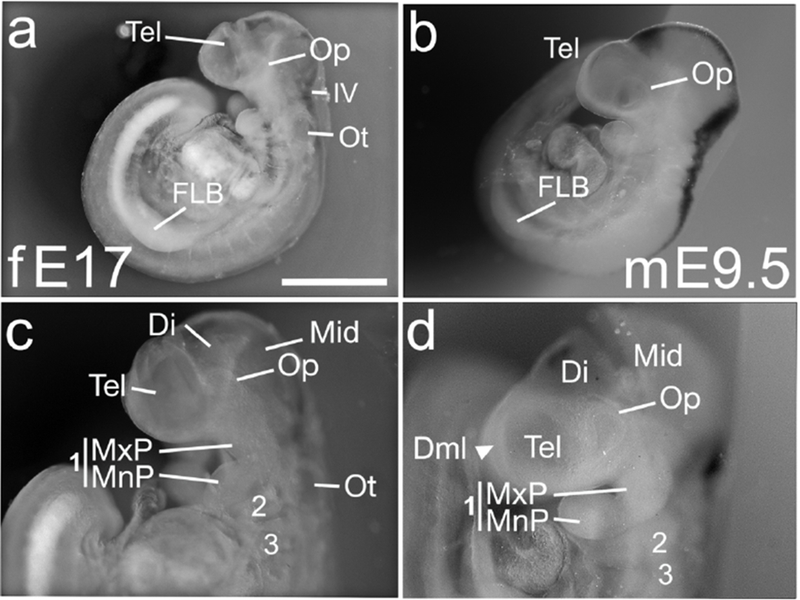
(a-d) Lateral views of E17 ferret (fE17) (a,c) and two E9.5 mice (mE9.5) (b,d). (a,c) Ferret embryo, 29 somites. Rostral neuropore is closed (a,c). Three pharyngeal arches (1,2 and 3) are evident, as are the maxillary and mandibular prominences of the first arch (MxP, MnP) (c). The embryo has a forelimb bud condensation (FLB) (a), and the optic and otic vesicles (Op, Ot) are closed (a,c). The telencephalon (Tel), diencephalon (Di), midbrain (Mes) and the fourth ventricle (IV) are all distinct (a,c). (b,d) An E9.5 mouse, 29 somites, exhibits the same features. The telencephalon of a second E9.5 mouse exhibits a dorsal midline (Dml), which will ultimately separate the two cortical hemispheres (d, arrowhead); the ferret telencephalon (c) does not. Black staining in (b, d) is from ISH not relevant to the figure. Scale bar in (a) is 1.0 mm for a, b; 0.5mm for c, d.
Chief differences between the species were, first, the caudal neuropore had begun to close in the ferret but not the mouse. In this, ferrets resemble humans, in which caudal neuropore closure is also accelerated relative to mice (Theiler, 1989). Second, the telencephalic dorsal midline (Dml) dividing the two cerebral hemispheres was already visible in the E9.5 mouse (Figure 1d, arrowhead), but not in the E17 ferret.
3.1.2. E18 ferret equivalence with E10.0 mouse, Theiler stage 16
The caudal neuropore was now closed in all ferret embryos (9/9) and in 10/12 mouse embryos, and the telencephalic vesicle in the ferret exhibited a dorsal midline (Figure 2c, Dml). Facial primordia, particularly the olfactory plate (OfP), were evident in both species (Figure 2c,d), and more prominent in mouse (Figure 2c,d). The hindlimb bud (HLB) was now visible and the tail bud (TLB) had condensed, evident by a caudal lordotic curve (Figure 2a, hidden in b).
Figure 2. E18 ferret and E10 mouse, a telencephalic midline, olfactory plate and indented lens.
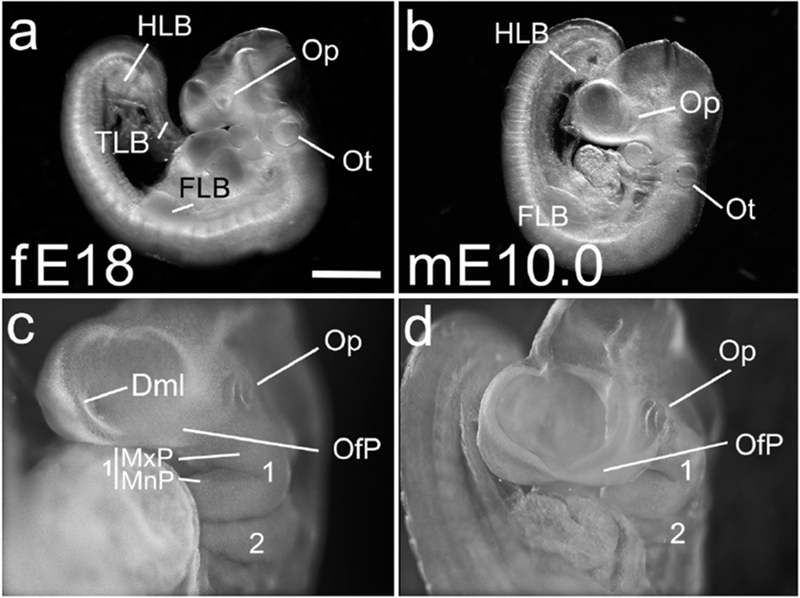
(a,c) E18 ferret embryo, 40 somites. The telencephalic midline (Dml) is evident in the E18 ferret (c), and an olfactory plate (OfP) is developing. The Op is now indented (shadow in (a), and seen clearly in a more frontal view (c). The FLB is now obvious (a), a hind limb bud (HLB) condensation is visible, and a tail limb bud (TLB) can be identified by its inward curve. (b,d) E10.0 mouse embryo, 33 somites, shows similar features to the ferret embryo, including a markedly indented Op (d). The OfP is more prominent in mouse than in ferret (compare c, d). Scale bar in (a) is 1.0 mm for a,b; 0.5mm for c,d.
At this period of embryogenesis, development of the optic vesicle and the limb buds are particularly helpful in judging developmental stage (Theiler, 1989) (Figures 3 and 4). At E17 in the ferret and E9.5 in the mouse, the distal surface of the optic vesicle (Op) was marginally convex (Figure 3a,b, arrowheads), whereas in E18 ferret and E10 mouse embryos the Op surface had become slightly concave (Figure 3c,d), sometimes visible as a shadow in the center of the optic vesicle (Figure 2a – d). In both E18 ferret and E10 mouse the forelimb and hindlimb buds were gently curved prominences (Figure 4a-d).
Figure 3. Optic vesicle development as a staging feature.
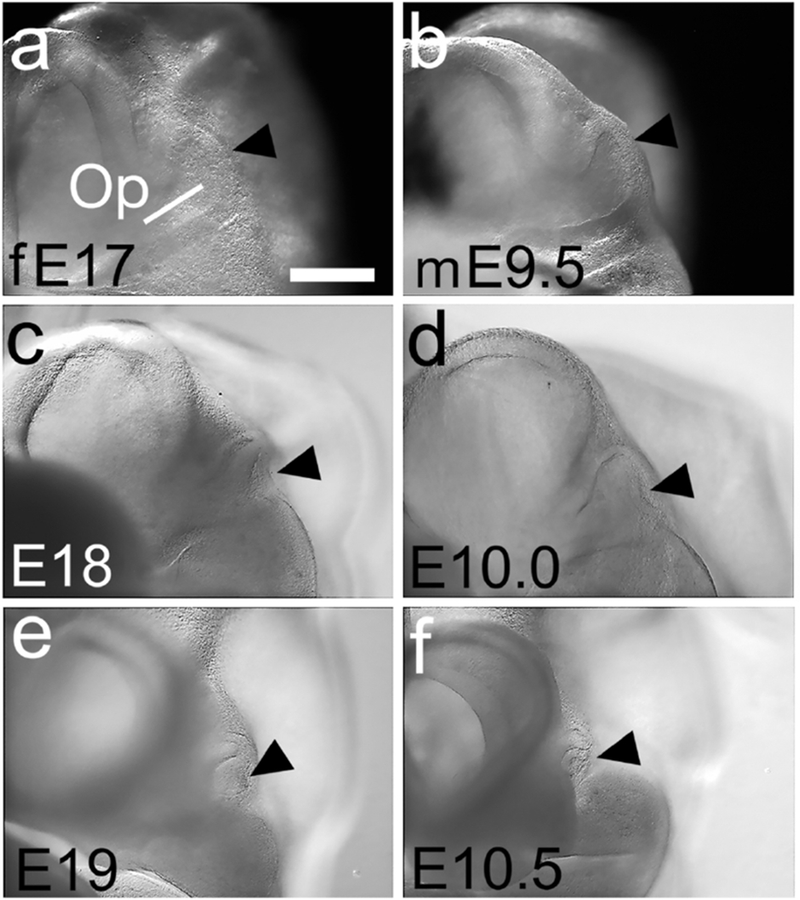
(a-f) Frontal views of three ferret and three mouse embryos at the ages marked. (a,c,e) The ferret Op epithelium has a smooth, slightly convex distal surface at E17 (a, black arrowhead), which progressively indents (c) and almost closes by E19 (e). (b,d,f) The mouse Op shows a similar progression (black arrowheads in b,d,f). Scale bar in (a) is 0.2mm for a,b; 0.3mm for c,d and 0.4 mm for e,f.
Figure 4. Limb-bud development as a staging feature.
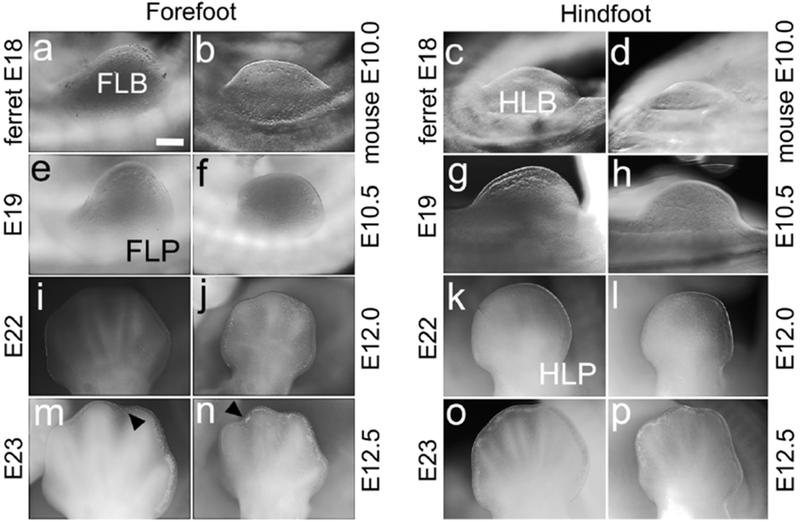
(a-p) Lateral views of the forelimb bud, forelimb plate, hindlimb bud and hindlimb plate (FLB, FLP, HLB and HLP) in ferret and mouse, ages marked. The FLB is distinct in E18 ferret and E10.0 mouse (a,b), is less rounded at E19 and E10.5, taking on the shape of an FLP (e,f). The FLP shows digit rays at E22 in ferret and E12.0 in mouse (i,j), and at E23 and E12.5 indentations begin to mark inter-digit spacing (m,n, black arrowheads). The HLB develops more slowly than the FLB. At E18 in ferret and E10.0 in mouse, the HLB protrudes less than the FLB (c,d), becomes rounded at E19 and E10.5 (g,h), and appears as a paddle-shaped HLP at E22 and E12.0 with digit rays barely evident (k,l). At E23 and E12.5, digit rays are clear (o,p). Scale bar in (a) is 0.2mm for a-d, 0.25mm for e-h, and 0.4mm for i-p.
3.1.3. E19 ferret equivalence with E10.5 mouse, Theiler stage 17
Both species showed substantial growth and maturation compared with the previous embryo pair (Figure 5a-d). In the head, the optic vesicle was extremely indented in both species, although not completely closed (Figure 3e,f). Nasal pits were distinct in both species, and somewhat deeper in the mouse (Figure 5b,d). In the trunk, the growing FLBs were more paddle-shaped, becoming forelimb plates (FLPs) (Figures 4e,f, Figure 5a,c), and the HLB was clear (Figure 4g,h).
Figure 5. In E19 ferret and E10.5 mouse the telencephalon is more developed in mouse.
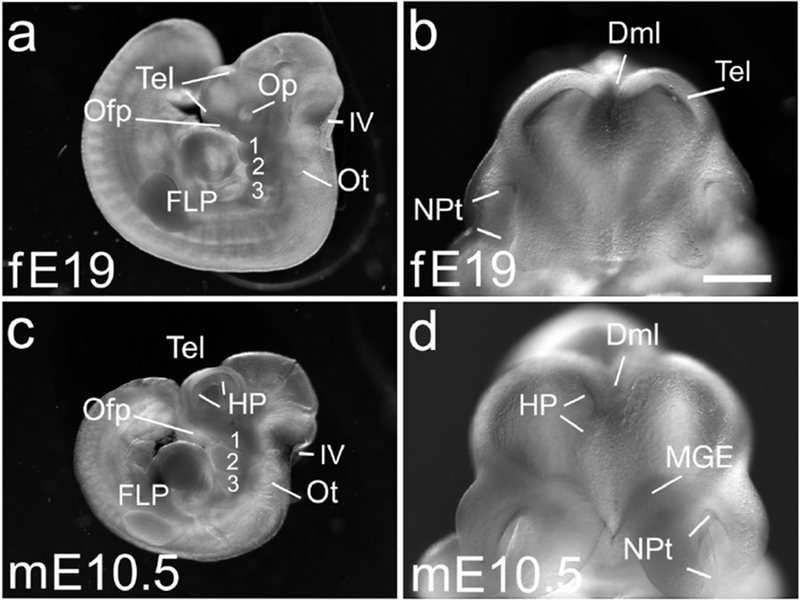
(a-d) Whole embryos (a,c) and frontal views of the heads (b,d) of an E19 ferret embryo, 44 somites (a,b), and an E10.5 mouse, 40 somites (c,d). The telencephalon is more developmentally advanced and wider in the E10.5 mouse than the E19 ferret (b,d). The mouse has a hippocampal primordium (HP) dorsally, and a medial ganglionic eminence (MGE) ventrally (d), but neither is present in the ferret embryo (b). The two cortical hemispheres are more clearly separated in the mouse than in ferret (b,d). In both species, the forelimb bud has become an FLP (a,c) and the Ofp has developed deep nasal pits (NPt), deeper in mouse (b,d). Scale bar in (b) is 0.5mm for b,d, and 1.5 mm in a,c.
A possible difference between species, suggested in the E17/E9.5 ferret/mouse pair, was emphasized in the E19 ferret and E10.5 mouse: telencephalic development was slowed in ferret compared with mouse. (Figure 5b,d). In the E19 ferret (n = 6 examined), the two medial edges of each future cortical hemisphere apposed one another (Figure 5b), resembling the dorsal midline as it initially forms in the mouse. By contrast, in the E10.5 mouse (n = 7 examined), cortical tissue at the dorsal midline was already diving down to form the hippocampal primordia (Figure 5d), and the cortical hemispheres were more obviously separated. Additionally, in the ventral telencephalon, the medial ganglionic eminence (MGE) appeared in the E10.5 mouse, but not yet in the E19 ferret (Figure 5b,d).
3.1.4. E22 and E23 ferret compared with E12.0 and E12.5 mouse (Theiler stages 20 – 21)
E20 and E21 ferret embryos were not available. At E22 (n=7) and E23 (n=6) ferret embryos were similar to each other, but very different from E19. The embryos had lengthened considerably, causing a general straightening of the embryo at the thorax (Figure 6a). E12.0 and E12.5 mouse embryos, while larger than previously, were smaller than the ferret embryos, and still highly curved (Figure 6b). Indeed, with respect to crown-rump length (CRL), greatest length (GL), and axial length (AL), we found that mice and ferret embryos were similar at the earlier ages, but had diverged by E22 (see below, and data not shown).
Figure 6. E23 ferret and E12.5 mouse, prominent development of face.
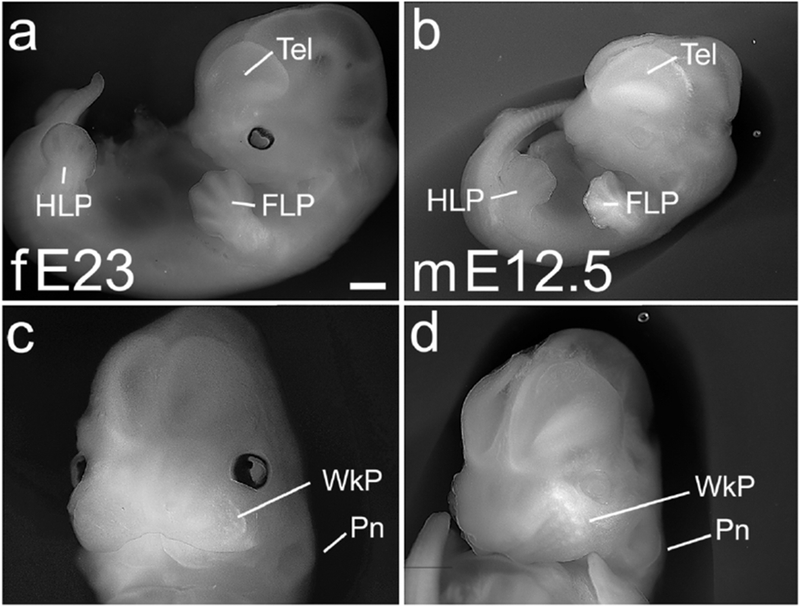
Whole embryo (a,b) and frontal head views (c,d) of an E23 ferret (a,c) and E12.5 mouse (b,d). The ferret at E23 shows accelerated overall growth compared with the mouse (a,b), but mouse and ferret share striking facial development. The facial prominences have coalesced, and both species show a prominent maxillary whisker pad (WkP) with rows of individual whisker primordia (c,d). The pinna of the ear (Pn) is also beginning to form (c,d). Eyes are pigmented in the ferret, but not in the albino mouse embryos (a,b). Scale bar in (a) is 1.0 mm in a,b, and 0.7mm in c,d.
Individual features, however, were similarly developed in the two species. By E12.0 to E12.5 in mouse, and E22 to E23 in ferret, the facial primordium was markedly advanced: the central frontonasal prominence had coalesced with the two maxillary prominences on either side, and individual whisker primordia could be seen in rows on the maxillary surface (Figure 6c,d). The FLP and hindlimb plate (HLP) had also matured: in the E22 ferret and E12.0 mouse, the FLP had developed digital rays, and by E23 and E12.5 showed indentations between the future digits (Figure 4i,j,m,n and Figure 6a,b). The paddle-shaped HLP was apparent in the E22 ferret and E12.0 mouse, and showed digital rays at E23 and E12.5 (Figure 4k,l,o,p, and Figure 6a,b).
3.1.5. Equivalencies between ferret and mouse
Our observations of mouse embryos are very similar to those of Theiler. Mice examined at E9.5 have the overall body features of Theiler (T) stage T15, E10 is T16, E10.5 is T17, E12 is T20, and E12.5 is between T20 and T21 (Theiler, 1989) (Table 2, columns 2 and 3). With respect to overall development, we found that E17 ferret embryos were comparable to E9.5 mouse embryos, E18 ferret to E10.0 mouse, and E19 ferret to E10.5 mouse (Table 2, columns 1 and 2). These equivalencies between ferret and mouse were determined using milestones in the development of the body and head, and provide a general guide for comparing ferret and mouse during an earlier period of ferret development than has been generally studied (Fernandez, Llinares-Benadero, & Borrell, 2016; Johnson et al., 2018; Kawasaki, Iwai, & Tanno, 2012; Reillo & Borrell, 2012).
Table 2.
Proposed Equivalences in Ferret and Mouse Embryo Ages
| Ferret Age | Equivalent Mouse Age, Overall | Corresponding Theiler stage | Corresponding Carnegie stage | Equivalent Mouse Age, Telencephalon |
| E17 | E9.5 | T15 | 12 | E9.0 |
| E18 | E10.0 | T16 | 13 | E9.5 |
| E19 | E10.5 | T17 | 14 | E10.0 |
| E22 | E12.0 | T20 | 17 | E11.5 |
| E23 | E12.5 | T20-21 | 17-18 | E12.0 |
Carnegie stages in human corresponding to Theiler mouse stages are those estimated by Theiler.
As we equated embryonic mouse and ferret ages by general features, we noticed that, particularly at the earlier time-points, the telencephalon frequently appeared smaller, rather than larger, in the ferret than in the corresponding mouse (see Figure 1a,b; Figure 5b,d). We focused more closely on the telencephalon and found that its structural development was slightly delayed in ferret compared with mouse. Thus, development at the dorsal telencephalic midline paired E18 ferret with E9.5 mouse (Figure 1d and Figure 2c), and E19 ferret with E10 mouse (Figure 5a-d). Growth of the ganglionic eminences in the ventral telencephalon paired E22 ferret with E11.5 mouse (Figure 7). Telencephalic equivalencies therefore matched each ferret age with a mouse age one half day younger than in the set of overall body equivalencies (Table 2, columns 1,2 and 5).
Figure 7. Development of the ganglionic eminences in E22 ferret is comparable to E11.5 mouse.
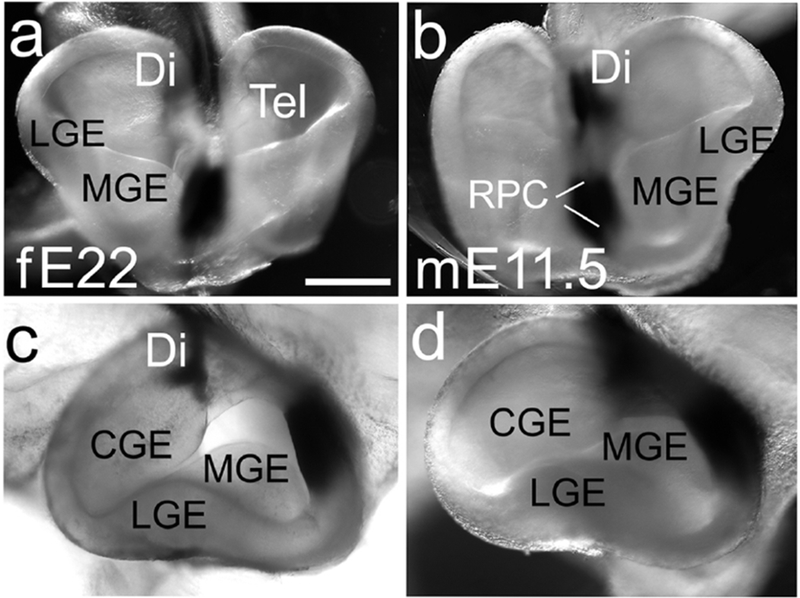
Frontal (a,b) and lateral views of the telencephalon (c,d). The medial and lateral ganglionic eminences (MGE, LGE) are evident in both species (a-d), and the caudal ganglionic eminence (CGE) is visible in lateral views (c,d). Scale bar is in (a) is 0.5mm for a,b and 0.35 for c,d. Brains were processed with ISH for Fgf8, appears as black stain.
This discrepancy could be related to the ferret’s unusually early stage of forebrain development at birth, which has made this species valuable to developmental neuroscience (Desai & McConnell, 2000; McConnell & Kaznowski, 1991; Sharma, Angelucci, & Sur, 2000; Sur, Garraghty, & Roe, 1988). The practical consequence for the present study is that we chose to compare telencephalic gene expression and the R/C surface length of the NP in ferret and mouse at ages when anatomical development in the telencephalon matched in the two species (Table 2, columns 1 and 5).
3.2. Gene expression in ferret associated with telencephalic signaling centers.
Fgf8 was expressed in the ferret, as in mouse, in the rostromedial telencephalon at E17 (Figure 8a-f). The domain of Fgf8 expression was smaller in the E17 ferret than in the E9.0 mouse, but virtually identical in E18 ferret and E9.5 mouse (Figure 8c,d). At the stage at which FGF8 from the mouse RPC initiates development of the neocortical area map, therefore, Fgf8 expression in the ferret indicates a comparable source of FGF8 in the same position (Figure 8a-d). The pattern of Fgf8 expression in the telencephalon remained highly similar between E22 ferret and E11.5 mouse, with a second expression domain appearing in the diencephalon (Figure 8e,f and Figure 7a,b). These observations suggest that, in ferret, as in mouse, FGF8 signaling has continued importance for several, more local, processes of cortical development.
Figure 8. Fgf8 and Nr2f1 expression in the ferret and mouse rostral telencephalon.
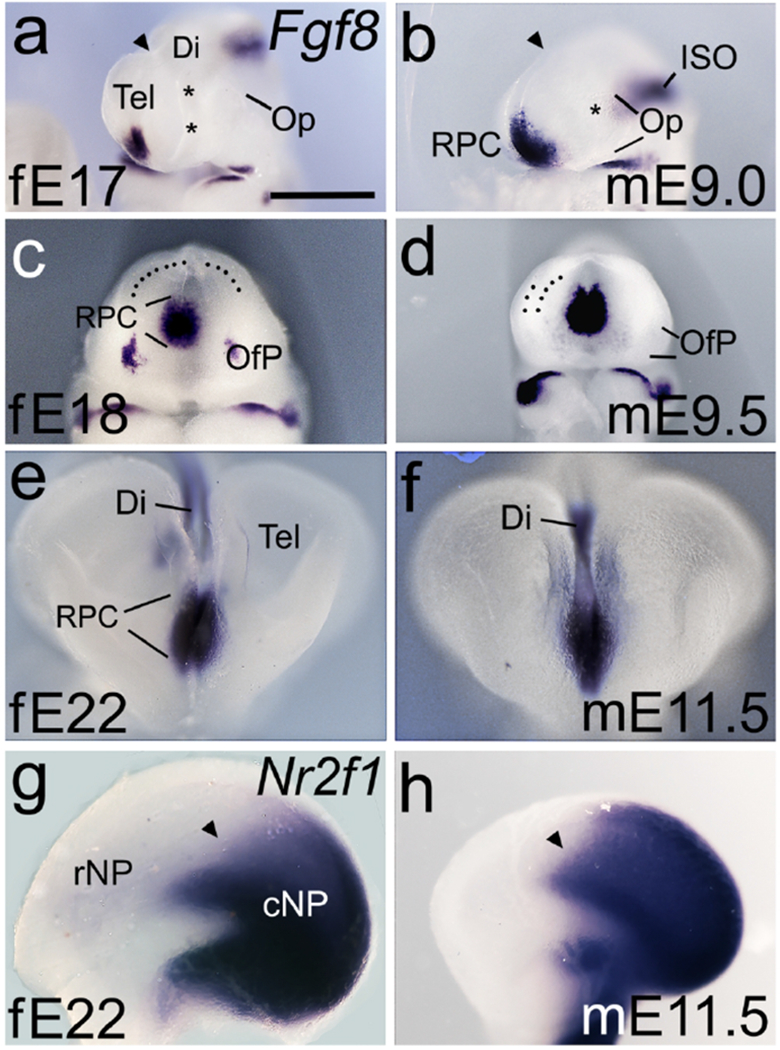
(a-h) Whole brains or hemispheres viewed from the lateral side (a,b,g,h), rostral is left, or frontal views (c-f). (a-f) Fgf8 expression is less robust in the E17 ferret than in the E9.0 mouse (a,b), but strengthens by E18 to match the Fgf8 expression domain in the mouse at E9.5 (c,d). Asterisks in (a,b) indicate position of the optic vesicle (Op). Dotted lines in (c,d) indicate inner (c) or both inner and outer surfaces of the NP. Rostral Fgf8 expression domains remain similar in ferret and mouse at later ages (e,f), compatible with FGF8 involvement in later steps of forebrain development. (g,h) Expression of Nr2f1, repressed by FGF8, is confined to a similar caudal domain of the NP in E22 ferret and E11.5 mouse. In both, Nr2f1 expression has a relatively sharp rostral border (arrowheads in g,h). Scale bar in (a) is 0.5mm for a, b, 0.65mm for c – f, and 0.8mm for g,h. Abbreviations: ISO, isthmic organizer; rNP, rostral NP; cNP, caudal NP. Note difference in rostrocaudal length between fE22 and mE11.5 in (g,h).
We next examined the expression of the transcription factor genes Nr2f1, and Emx2, both of which are implicated in patterning the neocortical area map. FGF8 represses expression of Nr2f1 and Emx2, causing low rostral to high caudal NP expression gradients for both. Nr2f1 suppresses rostral area identities, whereas Emx2 actively promotes caudal area fate. Consequently, the reduction of rostral Nr2f1 and Emx2 levels by FGF8 determines the position of caudal areas, and protects rostral area development (Armentano et al., 2007; Cholfin & Rubenstein, 2008; Fukuchi-Shimogori & Grove, 2003; Garel et al., 2003; Hamasaki et al., 2004). NP hemispheres from mouse and ferret showed similar caudal domains of Nr2f1 expression, with relatively sharp rostral boundaries (Figure 8g,h), consistent with active FGF8 signaling in the NP in both species. Further supporting graded FGF8 (and Wnt) activity through the early ferret NP, 2 we found that Emx was expressed in a similar high caudomedial to low rostrolateral gradient in both mouse and ferret (Fukuchi-Shimogori & Grove, 2003) (data not shown).
In E10.0 mouse and E19 ferret embryos Wnt3a expression marked the cortical hem in each cortical hemisphere (Figure 9a,b). The Wnt3a expression domain in the ferret sample illustrated (Figure 9a) was slightly more developed than in the mouse sample (Figure 9b), and showed the characteristic curve of the caudomedial hem (Grove et al., 1998). Later, in E23 ferret and E12 mouse, the curved bands of Wnt3a expression followed the edge of the hippocampal primordium (HP), immediately dorsal to the hem in each hemisphere (Figure 9c,d). Although not required for the hippocampus to form (Fotaki et al., 2010) Wnt8b expression outlines the HP. By E17 in ferret and E9.0 in mouse, the Wnt8b expression domain included the dorsal telencephalic midline and the early HP (Figure 10a,b). In E22 ferret and E11.5 mouse, the HP developed further and the domain of Wnt8b expression was expanded (Figure 10c,d).
Figure 9. Wnt3a expression in the cortical hem.
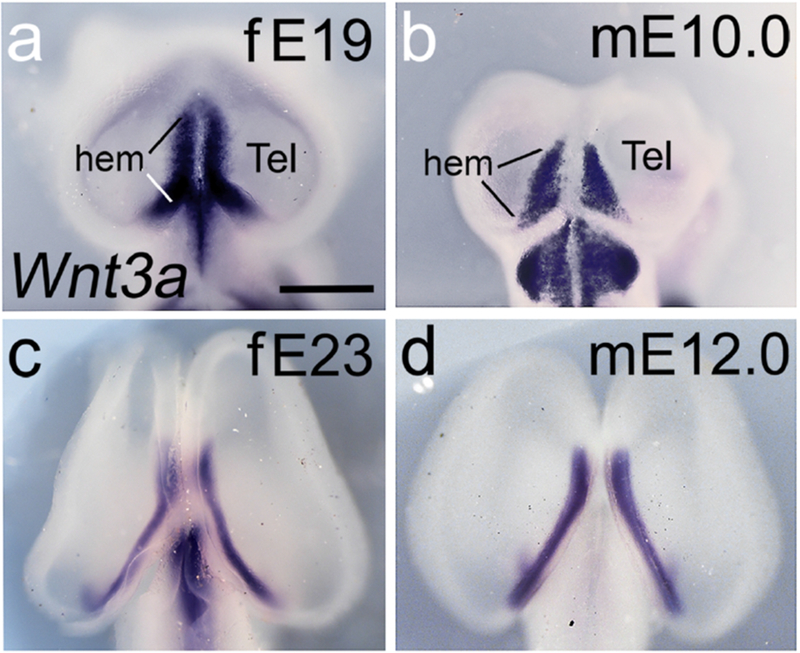
(a-d) Dorsal views of ferret and mouse embryo heads; rostral is up. In the E19 ferret, Wnt3a expression is strong in the cortical hem region, and more extensive than in the E10.0 mouse sample. Both E19 ferret and E10.0 mouse also express Wnt3a in the diencephalon; the latter is a separate, not continuous, domain. E23 ferret and E12.0 mouse continue to express Wnt3a strongly in the cortical hem. Scale bar in (a) is 0.5mm for a,b; 0.9mm for c, 0.6mm for d.
Figure 10. Wnt8b is expressed in the cortical hem and hippocampal primordium.
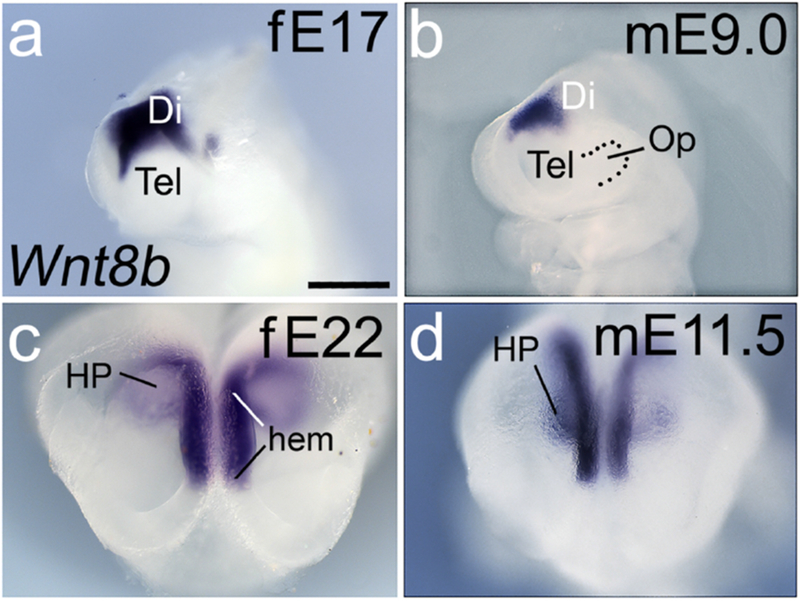
(a-d) Embryo heads in roughly lateral view, rostral to the left (a,b); or a rostrodorsal view that allows the hippocampal primordium (HP) to be seen best (c,d). Wnt8b expression in E19 ferret and E9.0 mouse embryos fills the putative hippocampal primordium (HP) (a,b). A few days later, the curving shape of the HP is morphologically apparent and demarcated by Wnt8b expression in both species (c,d). Wnt8b also labels the cortical hem, immediately adjacent to the HP (hem in c). Wnt8b expression in the hem and HP appears as one continuous domain. Scale bar in (a) is 0.3mm in a,b; 0.5mm in c,d.
3.3. Size of the NP at the stage when FGF8 initiates patterning of the area map
The hypothesis of this study is that the ferret cerebral cortex, though much larger than the mouse cortex in maturity, restrains its growth at the stage at which cortical components are specified. If so, signaling molecules such as Wnt3a and FGF8 could disperse across the cortical primordium to regulate formation of the hippocampus and pattern the neocortical area map. This possibility depends on both the size of the cortical primordium and the dispersion range of Wnt3a and FGF8. The distance over which Wnt3a disperses from the hem in the mouse is currently unknown. The spatial proximity of Wnt3a expression to the Wnt8b-expressing hippocampal primordium in the ferret, however, suggests the cortical hem is present in ferret and has the same relationship to hippocampal development as in the mouse.
Previous observations indicate that FGF8 spreads about 0.3 - 0.6 mm in an R/C gradient through the early mouse NP (Toyoda et al., 2010). Measurements of the NP in the previous study were taken close to the inner ventricular surface through which FGF8 disperses (Toyoda et al., 2010). In the present study the ventricular surface of the NP could not be consistently measured because it was not always visible through the lateral telencephalic wall. Instead, we measured the outer neocortical surface length (NSL) in lateral views of the hemisphere (see Methods 2.5). The NP is curved, making the inner surface shorter than the outer, so in the live embryo FGF8 would probably need to disperse a shorter distance than the NSL measured here. Most significant, however, is whether, and when, the NSL is comparable between stage-matched mouse and ferret.
We compared the NSL between mouse E9.0 (n = 8), E9.5 (n = 16), and E10 (n = 16), and ferret E17 (n = 4), E18 (n = 8) and E19 (n = 6). The NSL was measured following the curving outer surface of the telencephalon from the FGF8 source to an inflection that marks the caudal end of the telencephalon (Figure 11a, and see Methods 2.5). The mean NSL for both E9.0 mice and E17 ferrets was 0.4mm (sem = 0.01 for both) (Figure 11b), well within the range of FGF8 spread (Toyoda et al., 2010). Also within range, the mean NSLs for E9.5 mice and E18 ferrets were, respectively, 0.52mm (sem = 0.03) and 0.58mm (sem = 0.05) (Figure 11b). Student’s t-test showed no significant difference between the mouse and ferret NSL at either pair of ages (p = 0.1 and p = 0.3, respectively). Thus, at the embryonic stage at which, in mouse, FGF8 initiates area patterning along the R/C axis, the mouse and ferret NP are similar in rostrocaudal length.
Figure 11. Size of the ferret NP is similar to mouse at a critical period for morphogen patterning.
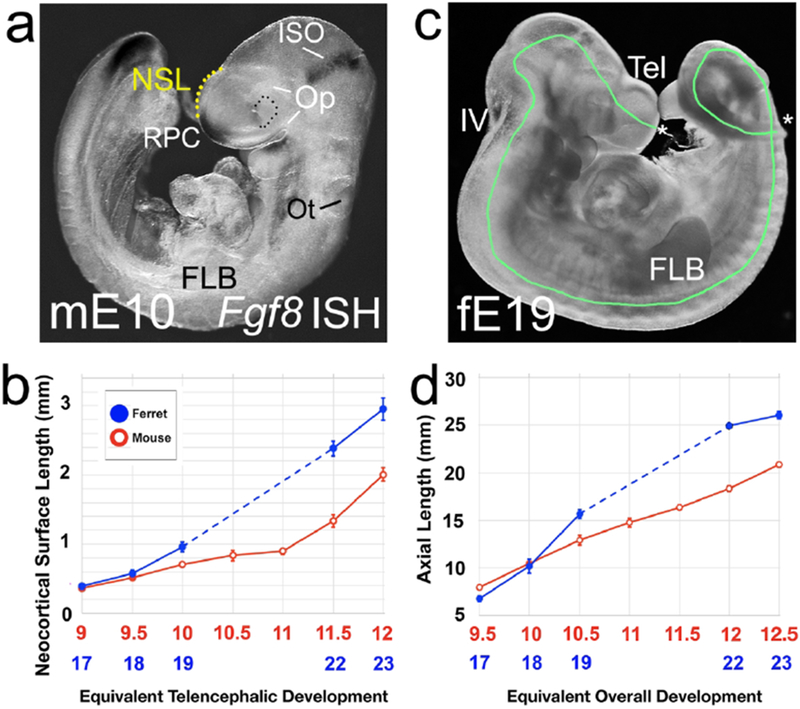
(a) Mouse E10 embryo, lateral view. Fgf8 expression is marked by ISH (black patches at the RPC, isthmus). Broken yellow line shows the NSL measurement. (c) Ferret E19 embryo, lateral view. Green line indicates the axial length (AL) measurement. Asterisks indicate the rostral tip of the telencephalon and the caudal tip of the tail, the two endpoints of the AL. (a, c) are not to scale. (c) The NSL measurement is the same in mouse and ferret at the two earliest ages, and then begins to diverge (d) Overall growth of the body shows s similar “hold then diverge” pattern. Broken lines in (b,d) indicate missing ferret ages and not NSL or AS.
Mean NSLs for E10 mice and E19 ferrets, however, were 0.7mm (sem = 0.02) and 0.9mm (sem = 0.1 (Figure 11b). Both were considered outside the likely FGF8 dispersion range, and the mouse and ferret groups were statistically different (p=0.01). For the older pairings, the mean NSL was far larger for ferrets than mice (Figure 11b). For E11.5 mice, the mean NSL was 1.3 mm (sem = 0.1, n=11), compared with 2.3mm (sem = 0.1, n=7) for E22 ferrets. In E12.0 mice the mean NSL was 2mm (sem = 0.1, n=8), and in E23 ferrets, 3mm (sem = 0.2, n=6). The two older pairings showed significant differences between mouse and ferret of p = 0.003, and p = 0. 00005.
These observations are consistent with the hypothesis that the same signaling molecules direct initial patterning of the neocortex in both mouse and ferret because growth of the ferret NP is held back at a crucial stage. Subsequently, growth of the ferret brain pulls away from that of the mouse.
4. DISCUSSION
Anatomical observations generated a set of equivalent embryonic ages in mouse and ferret, grounded in overall body and head development, and a second slightly shifted set of equivalencies, based on key features of telencephalic development. The chief focus was the particular stage at which FGF8 initiates NP patterning in the mouse, about E9.5 (Toyoda et al., 2010). Although the NP of the ferret is ultimately much larger than that of the mouse, we found that, at the critical stage of telencephalic development, the R/C length of the NP is the same in mouse and ferret. Thus, FGF8 could, in principle, disperse from rostral to caudal in the ferret NP and determine the R/C axis of the area map.
The distance Wnt3a disperses along the M/L axis in the mouse CP is still unknown, obviating a quantitative approach to whether Wnt signaling regulates this axis in ferret as in mouse. However, a conserved function of Wnt3a in hippocampal development is supported by the juxtaposition of the cortical hem to the presumptive hippocampal primordium in the ferret, as well as in humans (Abu-Khalil, Fu, Grove, Zecevic, & Geschwind, 2004).
How the same patterning mechanisms operate to make a similar overall body plan in animals of greatly varying size is a long-standing question in developmental biology, termed the scaling problem. Possible solutions include changes in morphogen levels, the morphogen gradient, or sensitivity to the morphogen (Cheung, Miles, Kreitman, & Ma, 2014; Umulis & Othmer, 2013; Uygur et al., 2016). Chick and finch embryos, for example, are different sizes, yet both achieve ventral patterning of the neural tube in response to the morphogen sonic hedgehog (Shh). In this case, the two species show differential activity of the Gli transcriptional activators and repressors downstream of Shh (Uygur et al., 2016). Of all possible solutions to the scaling problem, the simplest is that initial patterning is established when the relevant parts of the two embryos are the same size. Morphogen patterning is then followed by differential growth. Our data indicate this solution could apply to cortical patterning in ferret and mouse.
FGF8-induced patterning in the mouse NP at E9.5 precedes generation of neurons in the cortex, as does E18 in the ferret. In mouse, and potentially ferret, a first draft of the area map is therefore laid out in the layer of NP progenitor cells forming the ventricular zone (VZ). In mouse, the onset of neuron generation follows soon after, with production of subplate neurons and Cajal-Retzius cells beginning at E10, and generation of layer 6 neurons peaking at E12.5 (Molyneaux, Arlotta, Menezes, & Macklis, 2007). Neuronal generation in ferret is more prolonged, beginning by E21 - E22 with subplate neurons, and deep layer cells for the cortical plate (CPl) first produced as late as E28/E30 (McConnell & Kaznowski, 1991; Noctor, Scholnicoff, & Juliano, 1997). Our effort to match ferret and mouse ages using a standard embryological approach was therefore warranted. Had we simply examined the ferret embryo just before the onset of neuronal generation, the telencephalon would have appeared far too large to be patterned by secreted signaling molecules.
The greater volume of the cerebral cortex in the mature ferret, compared with mouse, is not only caused by longer neurogenesis. In carnivores and primates, diverse cortical progenitor cell types arise from earlier progenitors, generating neurons at different depths in the NP. This progenitor cell cascade amplifies the number of neurons generated (Reillo & Borrell, 2012), and may also cause neurons to disperse tangentially as they migrate to the CPl (LaMonica, Lui, Wang, & Kriegstein, 2012; Lui, Hansen, & Kriegstein, 2011; Nowakowski, Pollen, Sandoval-Espinosa, & Kriegstein, 2016). Too much tangential scatter could scramble an area map formed in the VZ, a second problem for the hypothesis that similar molecular mechanisms pattern the NP across mammalian species.
An early map is transferred from the VZ to the CPl if neighboring cohorts of neurons migrate consistently together. In the mouse, this occurs as neuronal clones migrate along the processes of radial glial cells into the CPl (He, Li, Ge, Yu, & Shi, 2015; Li et al., 2012). Yet, although the pathway is more convoluted in larger gyrencephalic cortices, in the ferret neurons from the same patch of the VZ have been observed to migrate together, in a fan-shape, to the same region of the CPl (Borrell, Kaspar, Gage, & Callaway, 2006). In the latter case, the initial draft of an area map could be correctly transferred. Notably a slight fanning out of neuronal clones occurs even in mouse, and is required for normal cortical column formation (Torii, Hashimoto-Torii, Levitt, & Rakic, 2009). Currently, the degree to which newborn neocortical neurons spread tangentially in non-rodent species remains a vexed question (Ma, Shen, Yu, & Shi, 2018).
Most decisive would be the results of experiments in ferrets similar to those in mouse that generated the current version of the protomap model. In mice, genetic approaches and in utero microelectroporation (IUME) were utilized to increase or decrease levels of FGF8 or transcription factors downstream of FGF8. These manipulations altered the relative size and position of areas within the map, even duplicating areas (Armentano et al., 2007; Assimacopoulos, Grove, & Ragsdale, 2003; De Clercq et al., 2016; Fukuchi-Shimogori & Grove, 2001; Garel et al., 2003; Hamasaki et al., 2004; Sato et al., 2017; Zembrzycki et al., 2007). At present, gene deletion in ferret is feasible though difficult (Johnson et al., 2018), and in utero electroporation has succeeded in ferret embryos at E30 (Kawasaki et al., 2012; Matsumoto, Shinmyo, Ichikawa, & Kawasaki, 2017). The IUME approach was not possible in the present study, however, because younger ferret embryos are not visible through the uterine wall using fiber optics. Thick layers of uterine tissue envelop each embryo at the critical stage of E17/E18 and beyond. Improved methods for visualizing the embryos, including ultrasound, should solve this problem.
A long-term goal is to discover if the RPC and hem signaling centers influence growth and patterning in the human cortical primordium. Human embryos have a cortical hem adjacent to the developing hippocampus (Abu-Khalil et al., 2004), suggesting the human hem regulates hippocampal formation. Human embryo brains have not yet been shown to have an RPC, but this seems likely, given conservation of the RPC signaling center in mice, chick and zebrafish (Crossley, Martinez, Ohkubo, & Rubenstein, 2001; Ohkubo, Chiang, & Rubenstein, 2002; Shanmugalingam et al., 2000; Shimamura & Rubenstein, 1997). Suggesting FGF8 plays a major role in cortical development, abnormalities in human cortex are linked to dysregulation of FGF8 or FGF receptor 3 signaling (Dubourg et al., 2016; Frank et al., 2002; Hevner, 2005). Further consistent with an FGF8 gradient establishing the R/C axis in human neocortex, increasing or reducing FGF8 in cortical cells derived from human pluripotential stem cells induces gene expression appropriate, respectively, to the rostral or caudal NP (Imaizumi et al., 2018).
Determining if the human NP is the right size at the right time for morphogen patterning, meanwhile, may be comparatively straightforward. Human embryo specimens in the Carnegie and Kyoto collections (Human Developmental Anatomy Center, Washington, DC) have been assigned to Carnegie stages, measured and imaged. Images, with scale bars, of first trimester embryos are available online and in e-book form (Hill, Shiota, Yamada, & Lo, 2016). As a first step, therefore, we compared images of E9.5 mouse embryos with those of Carnegie stages (CS) 12 and 13 human embryos, using the same developmental features as for mouse and ferret. We provisionally concluded that the telencephalon in E9.5 mouse was more developed than in CS12 human embryos, and resembled CS13 more closely (Figure 12). Initial comparisons of images of E9.5 mouse and CS13 human brains suggest the telencephalon, and NP, are roughly the same size (Figure 12). A more systematic study is warranted. Meanwhile, we propose that mammals with mature cortices of widely varying size may be patterned by common mechanisms if the early cortical primordium is kept, transiently, at a common size.
ACKNOWLEDGEMENTS:
Author Contributions: WDJ and EAG planned the research and WDJ and SG carried it out. WDJ and EAG analyzed the data and wrote the paper. Supported by NIH grants R21NS085679 and RO1MH103211 to E.A.G., and by a Biological Sciences Collegiate Division Summer Fellowship from the University of Chicago to W.D.J. We thank Stavroula Assimacopoulos for technical assistance. Particular thanks to Dr. Mark Hill, Anatomy, School of Medical Sciences, UNSW, Australia; Shigehito Yamada, M.D., Ph.D., Congenital Anomaly Research Center, Kyoto University Graduate School of Medicine, Kyoto, Japan; and Professor Cecilia Lo, Department of Developmental Biology, University of Pittsburgh School of Medicine, Pittsburgh, PA for their permission to use a modified human (CS 13) embryo image from the ebook, the “Kyoto Embryo Collection”.
REFERENCES
- Abu-Khalil A, Fu L, Grove EA, Zecevic N, & Geschwind DH (2004). Wnt genes define distinct boundaries in the developing human brain: implications for human forebrain patterning. J Comp Neurol, 474(2), 276–288. [DOI] [PubMed] [Google Scholar]
- Alberts B, J. A, Lewis J, Morgan D, Raff M, Roberts K, Walter P. (2015). Molecular Biology of the Cell (6th ed.): Garland Science. [Google Scholar]
- Armentano M, Chou SJ, Tomassy GS, Leingartner A, O’Leary DD, & Studer M (2007). COUP-TFI regulates the balance of cortical patterning between frontal/motor and sensory areas. Nat Neurosci, 10(10), 1277–1286. doi:nn1958 [pii] 10.1038/nn1958 [doi] [DOI] [PubMed] [Google Scholar]
- Assimacopoulos S, Grove EA, & Ragsdale CW (2003). Identification of a Pax6-dependent epidermal growth factor family signaling source at the lateral edge of the embryonic cerebral cortex. J Neurosci, 23(16), 6399–6403. [DOI] [PMC free article] [PubMed] [Google Scholar]
- Assimacopoulos S, Kao T, Issa NP, & Grove EA (2012). Fibroblast growth factor 8 organizes the neocortical area map and regulates sensory map topography. J Neurosci, 32(21), 7191–7201. doi:32/21/7191 [pii] 10.1523/JNEUROSCI.0071-12.2012 [doi] [DOI] [PMC free article] [PubMed] [Google Scholar]
- Bellefroid EJ, Leclere L, Saulnier A, Keruzore M, Sirakov M, Vervoort M, & De Clercq S (2013). Expanding roles for the evolutionarily conserved Dmrt sex transcriptional regulators during embryogenesis. Cell Mol Life Sci. doi: 10.1007/s00018-013-1288-2 [doi] [DOI] [PMC free article] [PubMed] [Google Scholar]
- Borello U, Cobos I, Long JE, McWhirter JR, Murre C, & Rubenstein JL (2008). FGF15 promotes neurogenesis and opposes FGF8 function during neocortical development. Neural Develop, 3, 17. doi:1749-8104-3-17 [pii] 10.1186/1749-8104-3-17 [doi] [DOI] [PMC free article] [PubMed] [Google Scholar]
- Borrell V, Kaspar BK, Gage FH, & Callaway EM (2006). In vivo evidence for radial migration of neurons by long-distance somal translocation in the developing ferret visual cortex. Cereb Cortex, 16(11), 1571–1583. doi: 10.1093/cercor/bhj094 [DOI] [PubMed] [Google Scholar]
- Caronia G, Wilcoxon J, Feldman P, & Grove EA (2010). Bone morphogenetic protein signaling in the developing telencephalon controls formation of the hippocampal dentate gyrus and modifies fear-related behavior. J Neurosci, 30(18), 6291–6301. doi:30/18/6291 [pii] 10.1523/JNEUROSCI.0550-10.2010 [doi] [DOI] [PMC free article] [PubMed] [Google Scholar]
- Caronia-Brown G, Yoshida M, Gulden F, Assimacopoulos S, & Grove EA (2014). The cortical hem regulates the size and patterning of neocortex. Development, 141(14), 2855–2865. doi:dev.106914 [pii] 10.1242/dev.106914 [doi] [DOI] [PMC free article] [PubMed] [Google Scholar]
- Cheung D, Miles C, Kreitman M, & Ma J (2014). Adaptation of the length scale and amplitude of the Bicoid gradient profile to achieve robust patterning in abnormally large Drosophila melanogaster embryos. Development, 141(1), 124–135. doi: 10.1242/dev.098640 [DOI] [PMC free article] [PubMed] [Google Scholar]
- Cholfin JA, & Rubenstein JL (2007). Patterning of frontal cortex subdivisions by Fgf17. Proc Natl Acad Sci U S A, 104(18), 7652–7657. doi:0702225104 [pii] 10.1073/pnas.0702225104 [doi] [DOI] [PMC free article] [PubMed] [Google Scholar]
- Cholfin JA, & Rubenstein JL (2008). Frontal cortex subdivision patterning is coordinately regulated by Fgf8, Fgf17, and Emx2. J Comp Neurol, 509(2), 144–155. doi: 10.1002/cne.21709 [doi] [DOI] [PMC free article] [PubMed] [Google Scholar]
- Chou SJ, Babot Z, Leingartner A, Studer M, Nakagawa Y, & O’Leary DD (2013). Geniculocortical input drives genetic distinctions between primary and higher-order visual areas. Science, 340(6137), 1239–1242. doi:340/6137/1239 [pii] 10.1126/science.1232806 [doi] [DOI] [PMC free article] [PubMed] [Google Scholar]
- Cook MJ (1965). The anatomy of the laboratory mouse. London, New York,: Academic Press. [Google Scholar]
- Cooper JM, Gadian DG, Jentschke S, Goldman A, Munoz M, Pitts G, … Vargha-Khadem F (2015). Neonatal hypoxia, hippocampal atrophy, and memory impairment: evidence of a causal sequence. Cereb Cortex, 25(6), 1469–1476. doi: 10.1093/cercor/bht332 [DOI] [PMC free article] [PubMed] [Google Scholar]
- Crossley PH, Martinez S, Ohkubo Y, & Rubenstein JL (2001). Coordinate expression of Fgf8, Otx2, Bmp4, and Shh in the rostral prosencephalon during development of the telencephalic and optic vesicles. Neuroscience, 108(2), 183–206. [DOI] [PubMed] [Google Scholar]
- De Clercq S, Keruzore M, Desmaris E, Pollart C, Assimacopoulos S, Preillon J, … Bellefroid EJ (2016). DMRT5 Together with DMRT3 Directly Controls Hippocampus Development and Neocortical Area Map Formation. Cereb Cortex. doi: 10.1093/cercor/bhw384 [DOI] [PMC free article] [PubMed] [Google Scholar]
- Desai AR, & McConnell SK (2000). Progressive restriction in fate potential by neural progenitors during cerebral cortical development. Development, 127(13), 2863–2872. [DOI] [PubMed] [Google Scholar]
- Dubourg C, Carre W, Hamdi-Roze H, Mouden C, Roume J, Abdelmajid B, … David V (2016). Mutational Spectrum in Holoprosencephaly Shows That FGF is a New Major Signaling Pathway. Hum Mutat, 37(12), 1329–1339. doi: 10.1002/humu.23038 [DOI] [PubMed] [Google Scholar]
- Farin HF, Jordens I, Mosa MH, Basak O, Korving J, Tauriello DV, … Clevers H (2016). Visualization of a short-range Wnt gradient in the intestinal stem-cell niche. Nature, 530(7590), 340–343. doi: 10.1038/nature16937 [DOI] [PubMed] [Google Scholar]
- Fernandez V, Llinares-Benadero C, & Borrell V (2016). Cerebral cortex expansion and folding: what have we learned? EMBO J, 35(10), 1021–1044. doi: 10.15252/embj.201593701 [DOI] [PMC free article] [PubMed] [Google Scholar]
- Fotaki V, Larralde O, Zeng S, McLaughlin D, Nichols J, Price DJ, … Mason JO (2010). Loss of Wnt8b has no overt effect on hippocampus development but leads to altered Wnt gene expression levels in dorsomedial telencephalon. Dev Dyn, 239(1), 284–296. doi: 10.1002/dvdy.22137 [DOI] [PMC free article] [PubMed] [Google Scholar]
- Frank DU, Fotheringham LK, Brewer JA, Muglia LJ, Tristani-Firouzi M, Capecchi MR, & Moon AM (2002). An Fgf8 mouse mutant phenocopies human 22q11 deletion syndrome. Development, 129(19), 4591–4603. [DOI] [PMC free article] [PubMed] [Google Scholar]
- Fukuchi-Shimogori T, & Grove EA (2001). Neocortex patterning by the secreted signaling molecule FGF8. Science, 294(5544), 1071–1074. [DOI] [PubMed] [Google Scholar]
- Fukuchi-Shimogori T, & Grove EA (2003). Emx2 patterns the neocortex by regulating FGF positional signaling. Nature Neurosci, 6, 825–831. [DOI] [PubMed] [Google Scholar]
- Garel S, Huffman KJ, & Rubenstein JLR (2003). Molecular regionalization of the neocortex is disrupted in Fgf8 hypomorphic mutants. Development, 130(9), 1903–1914. [DOI] [PubMed] [Google Scholar]
- Grove EA, Tole S, Limon J, Yip L, & Ragsdale CW (1998). The hem of the embryonic cerebral cortex is defined by the expression of multiple Wnt genes and is compromised in Gli3-deficient mice. Development, 125, 2315–2325. [DOI] [PubMed] [Google Scholar]
- Gulamhusein AP, & Beck F (1981). External features of the developing ferret embryo. Bibl Anat(19), 236–246. [PubMed] [Google Scholar]
- Hamasaki T, Leingartner A, Ringstedt T, & O’Leary DD (2004). EMX2 regulates sizes and positioning of the primary sensory and motor areas in neocortex by direct specification of cortical progenitors. Neuron, 43(3), 359–372. [DOI] [PubMed] [Google Scholar]
- He S, Li Z, Ge S, Yu YC, & Shi SH (2015). Inside-Out Radial Migration Facilitates Lineage-Dependent Neocortical Microcircuit Assembly. Neuron, 86(5), 1159–1166. doi: 10.1016/j.neuron.2015.05.002 [DOI] [PMC free article] [PubMed] [Google Scholar]
- Hedrich HJ, & Bullock GR (2004). The laboratory mouse. Amsterdam ; Boston: Elsevier Academic Press. [Google Scholar]
- Hevner RF (2005). The cerebral cortex malformation in thanatophoric dysplasia: neuropathology and pathogenesis. Acta Neuropathol (Berl), 110(3), 208–221. [DOI] [PubMed] [Google Scholar]
- Hill MA, Shiota K, Yamada S, & Lo CW (2016). Kyoto Embryo Collection [Google Scholar]
- Hoch RV, Clarke JA, & Rubenstein JL (2015). Fgf signaling controls the telencephalic distribution of Fgf-expressing progenitors generated in the rostral patterning center. Neural Dev, 10, 8. doi: 10.1186/s13064-015-0037-7 [DOI] [PMC free article] [PubMed] [Google Scholar]
- Huffman KJ, Garel S, & Rubenstein JL (2004). Fgf8 regulates the development of intra-neocortical projections. J Neurosci, 24(41), 8917–8923. [DOI] [PMC free article] [PubMed] [Google Scholar]
- Imaizumi K, Fujimori K, Ishii S, Otomo A, Hosoi Y, Miyajima H, … Okano H (2018). Rostrocaudal Areal Patterning of Human PSC-Derived Cortical Neurons by FGF8 Signaling. eNeuro, 5(2). doi: 10.1523/eneuro.0368-17.2018 [DOI] [PMC free article] [PubMed] [Google Scholar]
- Johnson MB, Sun X, Kodani A, Borges-Monroy R, Girskis KM, Ryu SC, … Bae BI (2018). Aspm knockout ferret reveals an evolutionary mechanism governing cerebral cortical size. Nature, 556(7701), 370–375. doi: 10.1038/s41586-018-0035-0 [DOI] [PMC free article] [PubMed] [Google Scholar]
- Kawasaki H, Iwai L, & Tanno K (2012). Rapid and efficient genetic manipulation of gyrencephalic carnivores using in utero electroporation. Mol Brain, 5, 24. doi: 10.1186/1756-6606-5-24 [DOI] [PMC free article] [PubMed] [Google Scholar]
- Krubitzer L, & Stolzenberg DS (2014). The evolutionary masquerade: genetic and epigenetic contributions to the neocortex. Curr Opin Neurobiol, 24(1), 157–165. doi: 10.1016/j.conb.2013.11.010 [DOI] [PubMed] [Google Scholar]
- LaMonica BE, Lui JH, Wang X, & Kriegstein AR (2012). OSVZ progenitors in the human cortex: an updated perspective on neurodevelopmental disease. Curr Opin Neurobiol, 22(5), 747–753. doi: 10.1016/j.conb.2012.03.006 [DOI] [PMC free article] [PubMed] [Google Scholar]
- Lander AD, Nie Q, & Wan FY (2002). Do morphogen gradients arise by diffusion? Dev Cell, 2(6), 785–796. doi:S153458070200179X [pii] [DOI] [PubMed] [Google Scholar]
- Lee SM, Tole S, Grove E, & McMahon AP (2000). A local Wnt-3a signal is required for development of the mammalian hippocampus. Development, 127(3), 457–467. [DOI] [PubMed] [Google Scholar]
- Leingartner A, Thuret S, Kroll TT, Chou SJ, Leasure JL, Gage FH, & O’Leary DD (2007). Cortical area size dictates performance at modality-specific behaviors. Proc Natl Acad Sci U S A, 104(10), 4153–4158. doi:0611723104 [pii] 10.1073/pnas.0611723104 [doi] [DOI] [PMC free article] [PubMed] [Google Scholar]
- Li Y, Lu H, Cheng PL, Ge S, Xu H, Shi SH, & Dan Y (2012). Clonally related visual cortical neurons show similar stimulus feature selectivity. Nature, 486(7401), 118–121. doi: 10.1038/nature11110 [DOI] [PMC free article] [PubMed] [Google Scholar]
- Lui JH, Hansen DV, & Kriegstein AR (2011). Development and evolution of the human neocortex. Cell, 146(1), 18–36. doi:S0092-8674(11)00705-7 [pii] 10.1016/j.cell.2011.06.030 [doi] [DOI] [PMC free article] [PubMed] [Google Scholar]
- Ma J, Shen Z, Yu YC, & Shi SH (2018). Neural lineage tracing in the mammalian brain. Curr Opin Neurobiol, 50, 7–16. doi: 10.1016/j.conb.2017.10.013 [DOI] [PMC free article] [PubMed] [Google Scholar]
- Mangale VS, Hirokawa KE, Satyaki PR, Gokulchandran N, Chikbire S, Subramanian L, … Monuki ES (2008). Lhx2 selector activity specifies cortical identity and suppresses hippocampal organizer fate. Science, 519(5861), 304–309. [DOI] [PMC free article] [PubMed] [Google Scholar]
- Matsumoto N, Shinmyo Y, Ichikawa Y, & Kawasaki H (2017). Gyrification of the cerebral cortex requires FGF signaling in the mammalian brain. Elife, 6. doi: 10.7554/eLife.29285 [DOI] [PMC free article] [PubMed] [Google Scholar]
- McConnell SK, & Kaznowski CE (1991). Cell cycle dependence of laminar determination in developing neocortex. Science, 254(5029), 282–285. [DOI] [PubMed] [Google Scholar]
- Molyneaux BJ, Arlotta P, Menezes JR, & Macklis JD (2007). Neuronal subtype specification in the cerebral cortex. Nat Rev Neurosci, 8(6), 427–437. doi:nrn2151 [pii] 10.1038/nrn2151 [doi] [DOI] [PubMed] [Google Scholar]
- Moser MB, & Moser EI (1998). Functional differentiation in the hippocampus. Hippocampus, 8(6), 608–619. doi: [DOI] [PubMed] [Google Scholar]
- Murphy WJ, Eizirik E, Johnson WE, Zhang YP, Ryder OA, & O’Brien SJ (2001). Molecular phylogenetics and the origins of placental mammals. Nature, 409(6820), 614–618. doi: 10.1038/35054550 [doi] [DOI] [PubMed] [Google Scholar]
- Muzio L, Soria JM, Pannese M, Piccolo S, & Mallamaci A (2005). A Mutually Stimulating Loop Involving Emx2 and Canonical Wnt Signalling Specifically Promotes Expansion of Occipital Cortex and Hippocampus. Cereb Cortex. [DOI] [PubMed] [Google Scholar]
- Nauta W. J. H. v., & Feirtag M (1986). Fundamental Neuroanatomy. New York: W.H.Freeman and Company. [Google Scholar]
- Noctor SC, Scholnicoff NJ, & Juliano SL (1997). Histogenesis of ferret somatosensory cortex. J Comp Neurol, 387(2), 179–193. [PubMed] [Google Scholar]
- Nowakowski TJ, Pollen AA, Sandoval-Espinosa C, & Kriegstein AR (2016). Transformation of the Radial Glia Scaffold Demarcates Two Stages of Human Cerebral Cortex Development. Neuron, 91(6), 1219–1227. doi: 10.1016/j.neuron.2016.09.005 [DOI] [PMC free article] [PubMed] [Google Scholar]
- O’Leary DD, Chou SJ, & Sahara S (2007). Area patterning of the mammalian cortex. Neuron, 56(2), 252–269. [DOI] [PubMed] [Google Scholar]
- O’Leary DD, & Sahara S (2008). Genetic regulation of arealization of the neocortex. Curr Opin Neurobiol, 18(1), 90–100. doi:S0959-4388(08)00039-1 [pii] 10.1016/j.conb.2008.05.011 [doi] [DOI] [PMC free article] [PubMed] [Google Scholar]
- O’Rahilly R, & Müller F (2001). Human embryology & teratology (3rd ed.). New York: Wiley-Liss. [Google Scholar]
- Ohkubo Y, Chiang C, & Rubenstein JL (2002). Coordinate regulation and synergistic actions of BMP4, SHH and FGF8 in the rostral prosencephalon regulate morphogenesis of the telencephalic and optic vesicles. Neuroscience, 111(1), 1–17. [DOI] [PubMed] [Google Scholar]
- Parchure A, Vyas N, & Mayor S (2018). Wnt and Hedgehog: Secretion of Lipid-Modified Morphogens. Trends Cell Biol, 28(2), 157–170. doi: 10.1016/j.tcb.2017.10.003 [DOI] [PMC free article] [PubMed] [Google Scholar]
- Pattabiraman K, Golonzhka O, Lindtner S, Nord AS, Taher L, Hoch R, … Rubenstein JL (2014). Transcriptional regulation of enhancers active in protodomains of the developing cerebral cortex. Neuron, 82(5), 989–1003. doi: 10.1016/j.neuron.2014.04.014 [DOI] [PMC free article] [PubMed] [Google Scholar]
- Rakic P (1988). Specification of cerebral cortical areas. Science, 241, 170–176. [DOI] [PubMed] [Google Scholar]
- Rakic P (1991). Experimental manipulation of cerebral cortical areas in primates. Philos Trans R Soc Lond B Biol Sci, 331(1261), 291–294. [DOI] [PubMed] [Google Scholar]
- Rakic P, Suner I, & Williams RW (1991). A novel cytoarchitectonic area induced experimentally within the primate visual cortex. Proc Natl Acad Sci U S A, 88(6), 2083–2087. [DOI] [PMC free article] [PubMed] [Google Scholar]
- Reillo I, & Borrell V (2012). Germinal zones in the developing cerebral cortex of ferret: ontogeny, cell cycle kinetics, and diversity of progenitors. Cereb Cortex, 22(9), 2039–2054. doi: 10.1093/cercor/bhr284 [DOI] [PubMed] [Google Scholar]
- Rubenstein JL (2010). Three hypotheses for developmental defects that may underlie some forms of autism spectrum disorder. Curr Opin Neurol, 23(2), 118–123. doi: 10.1097/WCO.0b013e328336eb13 [doi] [DOI] [PubMed] [Google Scholar]
- Sato T, Kikkawa T, Saito T, Itoi K, & Osumi N (2017). Organizing activity of Fgf8 on the anterior telencephalon. Dev Growth Differ. doi: 10.1111/dgd.12411 [DOI] [PubMed] [Google Scholar]
- Saulnier A, Keruzore M, De Clercq S, Bar I, Moers V, Magnani D, … Bellefroid EJ (2012). The Doublesex Homolog Dmrt5 is Required for the Development of the Caudomedial Cerebral Cortex in Mammals. Cereb Cortex. doi:bhs234 [pii] 10.1093/cercor/bhs234 [doi] [DOI] [PMC free article] [PubMed] [Google Scholar]
- Scearce-Levie K, Roberson ED, Gerstein H, Cholfin JA, Mandiyan VS, Shah NM, … Mucke L (2007). Abnormal social behaviors in mice lacking Fgf17. Genes Brain Behav. [DOI] [PubMed] [Google Scholar]
- Scholpp S, & Brand M (2004). Endocytosis controls spreading and effective signaling range of Fgf8 protein. Curr Biol, 14(20), 1834–1841. [DOI] [PubMed] [Google Scholar]
- Shanmugalingam S, Houart C, Picker A, Reifers F, Macdonald R, Barth A, … Wilson SW (2000). Ace/Fgf8 is required for forebrain commissure formation and patterning of the telencephalon. Development, 127(12), 2549–2561. [DOI] [PubMed] [Google Scholar]
- Sharma J, Angelucci A, & Sur M (2000). Induction of visual orientation modules in auditory cortex. Nature, 404(6780), 841–847. [DOI] [PubMed] [Google Scholar]
- Shimamura K, & Rubenstein JLR (1997). Inductive interactions direct early regionalization of the mouse forebrain. Development, 124, 2709–2718. [DOI] [PubMed] [Google Scholar]
- Simi A, & Studer M (2018). Developmental genetic programs and activity-dependent mechanisms instruct neocortical area mapping. Curr Opin Neurobiol, 53, 96–102. doi: 10.1016/j.conb.2018.06.007 [DOI] [PubMed] [Google Scholar]
- Squire LR (1987). Memory and Brain. New York: Oxford University Press. [Google Scholar]
- Storm EE, Garel S, Borello U, Hebert JM, Martinez S, McConnell SK, … Rubenstein JL (2006). Dose-dependent functions of Fgf8 in regulating telencephalic patterning centers. Development, 133(9), 1831–1844. [DOI] [PubMed] [Google Scholar]
- Storm EE, Rubenstein JL, & Martin GR (2003). Dosage of Fgf8 determines whether cell survival is positively or negatively regulated in the developing forebrain. Proc Natl Acad Sci U S A, 100(4), 1757–1762. [DOI] [PMC free article] [PubMed] [Google Scholar]
- Sur M, Garraghty PE, & Roe AW (1988). Experimentally induced visual projections into auditory thalamus and cortex. Science, 242(4884), 1437–1441. [DOI] [PubMed] [Google Scholar]
- Theiler K (1989). The house mouse : atlas of embryonic development. New York: Springer-Verlag. [Google Scholar]
- Torii M, Hashimoto-Torii K, Levitt P, & Rakic P (2009). Integration of neuronal clones in the radial cortical columns by EphA and ephrin-A signalling. Nature, 461(7263), 524–528. doi: 10.1038/nature08362 [DOI] [PMC free article] [PubMed] [Google Scholar]
- Toyoda R, Assimacopoulos S, Wilcoxon J, Taylor A, Feldman P, Suzuki-Hirano A, … Grove EA (2010). FGF8 acts as a classic diffusible morphogen to pattern the neocortex. Development, 137(20), 3439–3448. doi:dev.055392 [pii] 10.1242/dev.055392 [doi] [DOI] [PMC free article] [PubMed] [Google Scholar]
- Umulis DM, & Othmer HG (2013). Mechanisms of scaling in pattern formation. Development, 140(24), 4830–4843. doi: 10.1242/dev.100511 [DOI] [PMC free article] [PubMed] [Google Scholar]
- Uygur A, Young J, Huycke TR, Koska M, Briscoe J, & Tabin CJ (2016). Scaling Pattern to Variations in Size during Development of the Vertebrate Neural Tube. Dev Cell, 37(2), 127–135. doi: 10.1016/j.devcel.2016.03.024 [DOI] [PMC free article] [PubMed] [Google Scholar]
- Wallenstein GV, Eichenbaum H, & Hasselmo ME (1998). The hippocampus as an associator of discontiguous events. Trends Neurosci, 21(8), 317–323. [DOI] [PubMed] [Google Scholar]
- Wolpert L (1996). One hundred years of positional information. Trends Genet, 12(9), 359–364. [DOI] [PubMed] [Google Scholar]
- Yoshida M, Assimacopoulos S, Jones KR, & Grove EA (2006). Massive loss of Cajal-Retzius cells does not disrupt neocortical layer order. Development, 133(3), 537–545. [DOI] [PubMed] [Google Scholar]
- Zembrzycki A, Griesel G, Stoykova A, & Mansouri A (2007). Genetic interplay between the transcription factors Sp8 and Emx2 in the patterning of the forebrain. Neural Dev, 2, 8. doi:1749-8104-2-8 [pii] 10.1186/1749-8104-2-8 [doi] [DOI] [PMC free article] [PubMed] [Google Scholar]
- Zola-Morgan S, Squire LR, & Amaral DG (1986). Human amnesia and the medial temporal region: enduring memory impairment following a bilateral lesion limited to field CA1 of the hippocampus. Journal of Neuroscience, 6(10), 2950–2967. [DOI] [PMC free article] [PubMed] [Google Scholar]


