

Abstract
Objective
To describe growth evolution and its correlates in the first five years of antiretroviral therapy (ART) initiation among HIV-infected children followed-up in West Africa.
Methods
All HIV-infected children younger than 10 years followed in the IeDEA pWADA cohort while initiating ART, with at least one anthropometric measurement within the first five years of treatment were included in the study. Growth was described according to the WHO child growth standards, using Weight-for-age Z-score (WAZ), Height-for-age Z-score (HAZ) and Weight-for-Height/BMI-for-age Z-score (WHZ/BAZ). Growth evolution and its correlates, measured at ART initiation, were modelled in individual linear mixed models for each anthropometric indicator, with a spline term added at the 12-month, 24-month and 9-month time point for WAZ, HAZ and WHZ/BAZ respectively.
Results
Among the 4156 children selected (45% girls, median age at ART initiation 3.9 years [IQR interquartile range 1.9-6.6], and overall 68% malnourished at ART initiation), important gains were observed in the first 12, 24 and 9 months on ART for WAZ, HAZ and WHZ/BAZ respectively. Correlates at ART initiation of a better growth evolution overtime were early age (<2 years of age), severe immunodeficiency for age, and severity of malnutrition.
Conclusions
Growth evolution is particularly strong within the first two years on ART but slows down after this period. Weight and height gains help to recover from pre-ART growth deficiency but are insufficient for the most severely malnourished. The first year on ART could be the best period for nutritional interventions to optimize growth among HIV-infected children in the long-term.
Keywords: Child, Malnutrition, Growth, HIV, antiretroviral therapy
Introduction
In 2017, 1.8 million children <15 years were living with HIV worldwide, with 180,000 new infections and 110,000 AIDS-related deaths (1). West and Central Africa, despite their lower HIV prevalence than other regions in Sub-Saharan Africa, face shortcomings in prevention for mother-to-child transmission (PMTCT), antiretroviral treatment (ART) coverage and HIV care (2). In 2017 in West Africa alone, approximately 370,000 children <15 years were living with HIV, with 50,000 new infections and 35,000 AIDS-related deaths occurring each year. ART coverage was estimated to reach 24% for this population (3).
Malnutrition is considered an underlying cause of 45% of deaths among children <5 years worldwide (4). In the Sahel region, this affects more than half of all children <5 years (5). In 2016, in West Africa, among children <5 years, 8.5% were wasted, 31.4% were stunted, and 19.1% were underweight (6). Child malnutrition has multiple adverse impacts in the long term on physical and cognitive development (4,7,8). Moreover, HIV-infected children are especially affected by malnutrition, which contributes to impair their immune system and increases the risk of opportunistic infections (9,10). Severe acute malnutrition among HIV-infected children starting antiretroviral treatment (ART) is associated with a higher mortality risk (11–13) , a higher risk of hospitalization (14), and an impaired response to ART (13).
Weight and height improve after ART initiation (15), with rapid weight gains in the first months of treatment (16–19) and linear height gains in the first two years of treatment (16–21). However, few studies have been conducted in West Africa (22–24), and few beyond two years on ART (16,19,24,25).
Our objective was to describe growth evolution and associated factors in the first 5 years on ART among HIV-infected children enrolled in the International epidemiologic Databases to Evaluate Aids (IeDEA) West Africa Pediatric Cohort.
Methods
Study population
IeDEA is an international research consortium established in 2005 to collect data on HIV and AIDS worldwide. The West African Database on Antiretroviral therapy (WADA) collaboration is one of the seven international regional data centers of IeDEA. The pediatric WADA (pWADA) cohort is an observational, prospective cohort, with ten clinical centers in seven countries contributing data (Benin, Côte d’Ivoire, Ghana, Mali, Senegal and Togo). Most of the clinical centers are University Hospitals based in capital cities. HIV-infected children are eligible to enroll in the pWADA cohort if they have a confirmed HIV diagnosis (positive serology for children> 18 months of age, or positive PCR at all ages), are enrolled into care before 16 years of age, regardless of their ART status, and with a documented birth date.
Data are collected prospectively in every clinical center since 1998, with formal approval and local Institutional Review Board and U.S. National Institutes of Health approvals.
For this study, we included all HIV-infected children < 10 years from the pWADA cohort, enrolled until 2016, who were ART-naïve (except for PMTCT) and who initiated ART while followed-up in pWADA, with at least one available anthropometric data (weight and height) within the first five years on ART, with no need to have anthropometric data measurement at the time of ART initiation.
Variables and data management
We studied growth using four anthropometric indicators, defined by the WHO child growth standards (26,27), and expressed in Z-scores: Weight-for-age (WAZ, available for children aged 10 years or less); Height-for-age (HAZ, available for all children); Weight-for-Height (WHZ, for children aged five years or less) and BMI-for-age (BAZ, for children aged 5-19). The last two anthropometric indicators were combined. Malnutrition status was defined by a Z-score lower than −2 Standard Deviations (SD). Lower WAZ defined underweight, lower HAZ stunting, and lower WHZ or BAZ wasting. Z-scores lower than −8 or greater than +8 were viewed as outliers, as well as a difference of more than 4 SD between two consecutive visits, and were excluded.
All children on ART were followed up on a quarterly basis. Anthropometric, socio-demographic, immunological and clinical data were collected, as well as ART regimen and cotrimoxazole prophylaxis. Immunodeficiency for age as defined according to the 2006 WHO guidelines (28) (severe immunodeficiency for age if CD4% <15% or CD4 count <350 cells/μL, and moderate immunodeficiency for age if CD4% between 15% and 25% or CD4 count between 350 and 499 cells/μL). Lost-to-Follow-up (LTFU) was defined as no clinical contact six months after the last visit.
Statistical Analysis
Prevalence of malnutrition at ART initiation (baseline) was assessed for each indicator as well as combined (at least one on three anthropometric indicator <-2SD), and baseline and follow-up characteristics were described.
Growth evolution within the first five years on ART was studied using individual linear mixed models for each anthropometric indicator (WAZ, HAZ and WHZ/BAZ), with an unstructured variance-covariance matrix, and a random effect on the intercept and slope. Interaction with time was added for each variable. Due to the bimodal trajectory observed for each anthropometric indicator, a spline term was added for each model, at the 12-month, 24-month and 9-month time point for WAZ, HAZ and WHZ/BAZ respectively. The goodness of fit of each model was assessed studying residuals and prediction of the trajectories. We present full models, including all variables tested in the univariate analyses. Covariates were measured at ART initiation and included: sex, country, age group (0-2, 2-5, 5-10 years), calendar period (2003-2008, 2009-2016), immunodeficiency by age, first line ART regimen and severity of malnutrition. All analyses were conducted using SAS software, version 9.3 (SAS Institute Inc., Cary, NC).
Results
Cohort profile, baseline and follow-up characteristics
Overall, 6,298 HIV-infected children in the IeDEA pWADA cohort were on ART in 2016. Among them, 5,800 (92%) were ART-naïve at ART enrolment in IeDEA, of whom 96% had at least one follow-up visit. Among them, 4,636 (84%) were aged ≤ 10 years at the time of enrolment and during follow-up, for whom 4,156 (90%) had available Z-scores (WAZ, HAZ, WHZ/BAZ) during the first five years on ART.
Characteristics at ART initiation are detailed in Table 1. Overall, 45% were girls and 38% were from Côte d’Ivoire. Median age at ART initiation was 3.9 years (IQR [interquartile range] 1.9-6.6). More than half of the children initiated ART after 2009. At ART initiation, 34% were severely immunodeficient for age, and 37% did not have documented CD4. The main first-line ART regimen was NNRTI (Non-Nucleoside Reverse Transcriptase Inhibitor)-based (79%). At baseline, 75% had available WAZ and 66% available HAZ and WHZ/BAZ. Among them, 57% were underweight, 50% were stunted, and 42% were wasted. Overall, 51% of children were diagnosed as malnourished (at least one anthropometric indicator<−2 SD) at ART initiation. Among those with available anthropometric data, 68.7% were malnourished (Table 1).
Table 1:
Descriptive characteristics of the study population at ART initiation and in the first five years on ART (N=4156). IeDEA pWADA.
| Variables | N | % |
|---|---|---|
|
General characteristics |
||
| Sex | ||
| Male | 2273 | 54.7 |
| Female | 1883 | 45.3 |
| Country | ||
| Benin | 269 | 6.5 |
| Côte d’Ivoire | 1579 | 38.0 |
| Ghana | 588 | 14.1 |
| Mali | 1144 | 27.5 |
| Senegal | 305 | 7.3 |
| Togo | 274 | 6.6 |
| Characteristics at ART initiation | ||
| Age groups (years) | ||
| 0-2 | 1133 | 27.3 |
| 2-5 | 1395 | 33.6 |
| 5-10 | 1628 | 39.2 |
| Calendar period of ART initiation | ||
| 2003-2008 | 1844 | 44.4 |
| 2009-2016 | 2312 | 55.6 |
| Immunodeficiency for age* | ||
| No | 539 | 13.0 |
| Moderate | 627 | 15.1 |
| Severe | 1432 | 34.5 |
| Missing | 1558 | 37.5 |
| Viral load (copies/mL) | ||
| <1000 | 127 | 3.1 |
| ≥1000 | 727 | 17.5 |
| Missing | 3302 | 79.5 |
| First-line ART regimen | ||
| NNRTI-based | 3283 | 79.0 |
| PI-based | 873 | 21.0 |
| Underweight at ART initiation (WAZ) † | ||
| Not underweight | 1346 | 32.4 |
| Moderately | 680 | 16.4 |
| Severely | 1088 | 26.2 |
| Missing | 1042 | 25.1 |
| Stunted at ART initiation (HAZ) † | ||
| Not stunted | 1383 | 33.3 |
| Moderately | 644 | 15.5 |
| Severely | 730 | 17.6 |
| Missing | 1399 | 33.7 |
| Wasted at ART initiation (WHZ/BAZ) † | ||
| Not wasted | 1602 | 38.5 |
| Moderately | 456 | 11.0 |
| Severely | 699 | 16.8 |
| Missing | 1399 | 33.7 |
| Malnourished at ART initiation (at least one indicator <−2SD) | ||
| No malnourished | 828 | 19.9 |
| Malnourished | 2119 | 51.0 |
| Missing | 1209 | 29.1 |
| Follow-up characteristics, first 5 years on ART | ||
| Median follow-up time on ART (months), IQR | 26.0 | [7.4-53.4] |
| LTFU‡, n % | 675 | 16.2 |
| Median follow-up time on ART (months), IQR | 11.7 | [2.0-26.9] |
| Median age at last visit (years), IQR | 5.1 | [2.5-7.9] |
| Death, n % | 398 | 9.6 |
| Median follow-up time on ART (months), IQR | 4.8 | [1.0-15.2] |
| Median age at last visit (years), IQR | 4.1 | [1.9-7.9] |
WAZ=Weight-for-age Z-score; HAZ=Height-for-age Z-score; WHZ/BAZ=Weight-for-Height/Body-Mass-Index-for-Age Z-scores; LTFU=Lost-To-Follow-Up; NNRTI=Non-Nucleoside Reverse Transcriptase Inhibitor; PI=Protease Inhibitor; IQR=Interquartile Range.
2006 WHO guidelines: severe= CD4% <15% or CD4 count <350 cells/μL; moderate= CD4% 15-25% or CD4 count 350-499 cells/μL.
WHO child growth standards: severe <−3 SD; moderate=[−3;−2[ SD; no ≥−2 SD.
Defined as no clinical contact six months after the last visit
The overall median follow-up time on ART was 26.0 months (IQR 7.4-53.4). Within the first five years on ART, 16% of children were LTFU after a median follow-up time of 11.7 months (IQR 2.0-26.9) and 10% died after a median follow-up time of 4.8 months (IQR 1.0-15.2). The median number of weight and height measurements was 7 per patient (IQR 3-14).
Children who were not included in this study because of missing anthropometric data were more often boys (55% vs 49%, p=0.032), were significantly younger at ART initiation (ART initiation 0-2 years of age, 40% vs 27%, p<0.001), had more often missing CD4 data at ART initiation (45% vs 37%, p=0.006) and were more often LTFU after two years on ART (31% vs 12%, p<0.001). They had also a higher rate of death in the first five years on ART (28% vs 10%, p<0.001) (data not shown).
Growth evolution within the first five years on ART
Overall, the prevalence of malnutrition decreased in the first 24 months on ART, with a prevalence of 37.6% at 24 months. At 60 months, 30.1% remained malnourished.
Weight-for-age evolution
Important weight gains occurred in the first year on ART. At baseline, mean WAZ was −2.36 (standard deviation [sd] 1.68) and 55.7% were underweight. By 12 months, mean WAZ increased to −1.33 (sd 1.21) and 26.8% were underweight. Between 12 and 60 months, mean WAZ remained relatively stable, and was −1.15 (sd 1.07) at 60 months, 19.6% were underweight (Figure 1). The model-estimated slope was +0.07 SD monthly (p<0.001) in the first 12 months, then −0.001 SD monthly (p=0.014) between 12 and 60 months.
Figure 1:
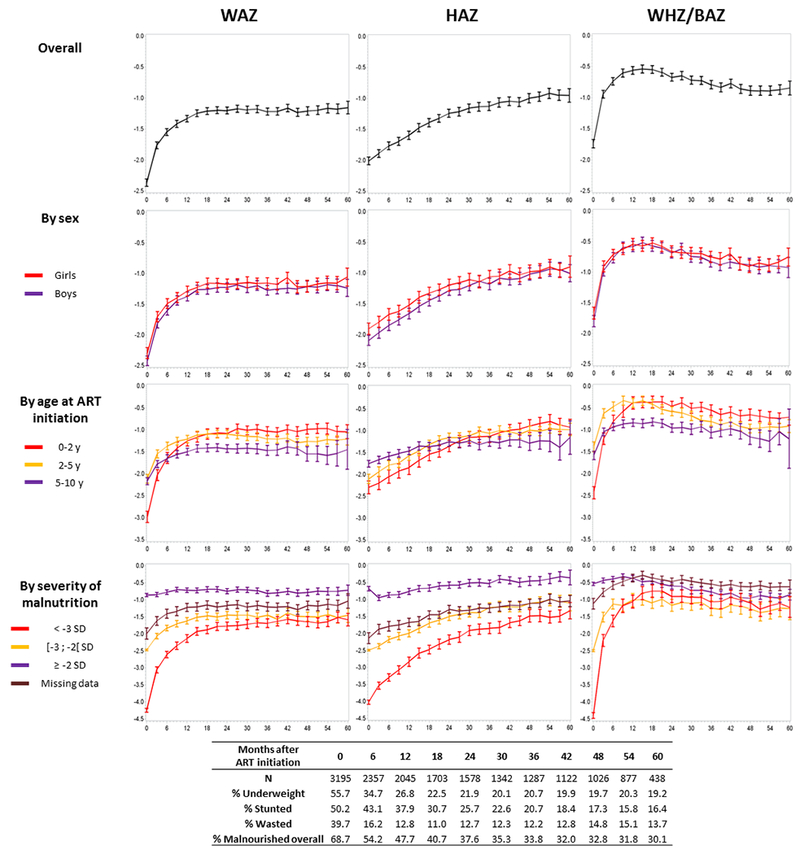
Observed growth evolution on the first five years on antiretroviral therapy, for each anthropometric indicator, according to sex, age at ART initiation and severity of malnutrition at baseline. Prevalence of malnutrition every 6 months (for each indicator and overall, when at least one indicator <−2 SD). IeDEA pWADA
WAZ=Weight-for-age Z-score; HAZ=Height-for-age Z-score; WHZ/BAZ=Weight-for-Height/Body-Mass-Index-for-Age Z-scores.
Adjusted for characteristics at ART initiation, children initiating ART <2 years were significantly more underweight at baseline, but had the best WAZ increase, both during the first 12 months on ART (5-10y vs 0-2y: −0.06 SD per month, p<0.001) and between 12 and 60 months (5-10 vs 0-2: −0.005 SD per month, p<0.001) (Table 2). The severity of underweight at baseline was highly correlated with WAZ evolution, with better weight gains for the most severely underweight in the overall period (0-12 months period: +0.13 SD per month, p<0.001; 12-60 months period: + 0.003 SD per month) (Table 2). Also, the most severely immunodeficient for age at baseline who started as the most underweight had a stronger WAZ increase in the first 12 monthsthan those who were non immunodeficient (Severe vs No: +0.02 SD per month, p<0.001) (Table 2). However, this was no longer the case after 12 months (Severe vs No: −0.004 SD per month, p<0.001) (Table 2). Children initiating Protease Inhibitor (PI)-based ART were more underweight at baseline than those on NNRTI-based ART and had better WAZ improvements in the long term (12-60 months period: +0.003 SD per month, p=0.015). Sex was not associated with WAZ evolution in this analysis (Table 2).
Table 2.
a: Differences in adjusted estimates of mean Z-score at ART initiation and differences in adjusted estimates of mean slopes in Z-score unit by month for two different time periods on ART, 0-12 months and 12-60 months. WAZ multivariate analysis, linear mixed model (N=4156). IeDEA pWADA.
b: Differences in adjusted estimates of mean Z-score at ART initiation and differences in adjusted estimates of mean slopes in Z-score unit by month for two different time periods on ART, 0-24 months and 24-60 months. HAZ multivariate analysis, linear mixed model (N=4156). IeDEA pWADA.
c: Differences in adjusted estimates of mean Z-score at ART initiation and differences in adjusted estimates of mean slopes in Z-score unit by month for two different time periods on ART, 0-9 months and 9-60 months. WHZ/BAZ multivariate analysis, linear mixed model (N=4156). IeDEA pWADA.
| Baseline variables at ART initation | WAZ |
|||||
|---|---|---|---|---|---|---|
| At ART initiation | In the first 12 months | Between 12 and 60 months | ||||
| Mean diff (sd) | p-value | Mean diff by month (sd) | p-value | Mean diff by month (sd) | p-value | |
| Sex (Girls vs Boys) | 0.03 (0.03) | 0.392 | 0.00 (0.00) | 0.811 | −0.001 (0.001) | 0.532 |
| Age groups (years) | <0.001 | <0.001 | <0.001 | |||
| 2-5 vs 0-2 | 0.26 (0.04) | <0.001 | −0.04 (0.00) | <0.001 | −0.005 (0.001) | 0.001 |
| 5-10 vs 0-2 | 0.15 (0.04) | 0.001 | −0.06 (0.00) | <0.001 | −0.005 (0.001) | <0.001 |
| Initiation period (2009-2016 vs 2003-2008) | 0.07 (0.04) | 0.051 | 0.00 (0.00) | 0.514 | −0.002 (0.001) | 0.034 |
| Immunodeficiency for age* | 0.004 | <0.001 | 0.003 | |||
| Moderate vs No | −0.10 (0.05) | 0.065 | 0.02 (0.00) | <0.001 | −0.002 (0.001) | 0.200 |
| Severe vs No | −0.16 (0.05) | <0.001 | 0.02 (0.00) | <0.001 | −0.004 (0.001) | <0.001 |
| Missing vs No | −0.06 (0.05) | 0.207 | 0.01 (0.00) | 0.005 | −0.002 (0.001) | 0.053 |
| First line ART regimen (PI vs NNRTI based) | −0.09 (0.00) | 0.041 | −0.01 (0.00) | 0.069 | 0.003 (0.001) | 0.015 |
| Severity of underweight at ART initiation† | <0.001 | <0.001 | 0.053 | |||
| Moderately vs No | −1.44 (0.05) | <0.001 | 0.04 (0.00) | <0.001 | 0.001 (0.002) | 0.628 |
| Severely vs No | −2.99 (0.04) | <0.001 | 0.13 (0.00) | <0.001 | 0.003 (0.001) | 0.017 |
| Missing vs No | −1.03 (0.06) | <0.001 | 0.04 (0.01) | <0.001 | −0.001 (0.002) | 0.562 |
| HAZ |
||||||
| Baseline variables at ART initation | At ART initiation | In the first 24 months | Between 24 and 60 months | |||
| Mean diff (sd) | p-value | Mean diff by month (sd) | p-value | Mean diff by month (sd) | p-value | |
| Sex (Girls vs Boys) | 0.07 (0.04) | 0.009 | 0.00 (0.00) | 0.401 | −0.002 (0.001) | 0.088 |
| Age groups (years) | <0.001 | <0.001 | <0.001 | |||
| 2-5 vs 0-2 | 0.13 (0.05) | 0.015 | 0.00 (0.00) | 0.815 | −0.010 (0.002) | <0.001 |
| 5-10 vs 0-2 | 0.27 (0.05) | <0.001 | −0.02 (0.00) | <0.001 | −0.016 (0.002) | <0.001 |
| Initiation period (2009-2016 vs 2003-2008) | 0.09 (0.04) | 0.036 | 0.00 (0.00) | 0.346 | 0.004 (0.002) | 0.009 |
| Immunodeficiency for age* | 0.016 | 0.136 | 0.447 | |||
| Moderate vs No | −0.12 (0.06) | 0.035 | 0.01 (0.00) | 0.050 | 0.001 (0.002) | 0.748 |
| Severe vs No | −0.16 (0.05) | 0.002 | 0.00 (0.00) | 0.040 | −0.002 (0.002) | 0.172 |
| Missing vs No | −0.10 (0.05) | 0.063 | 0.00 (0.00) | 0.280 | −0.001 (0.002) | 0.490 |
| First line ART regimen (PI vs NNRTI based) | −0.11 (0.05) | 0.041 | −0.01 (0.00) | 0.002 | 0.008 (0.002) | <0.001 |
| Severity of stunting at ART initiation† | <0.001 | <0.001 | <0.001 | |||
| Moderately vs No | −1.59 (0.06) | <0.001 | 0.02 (0.00) | <0.001 | 0.007 (0.002) | 0.003 |
| Severely vs No | −2.95 (0.06) | <0.001 | 0.05 (0.00) | <0.001 | 0.009 (0.002) | <0.001 |
| Missing vs No | −1.24 (0.06) | <0.001 | 0.03 (0.00) | <0.001 | 0.004 (0.002) | <0.001 |
| WHZ/BAZ |
||||||
| Baseline variables at ART initation | At ART initiation | In the first 9 months | Between 9 and 60 months | |||
| Mean diff (sd) | p-value | Mean diff by month (sd) | p-value | Mean diff by month (sd) | p-value | |
| Sex (Girls vs Boys) | 0.04 (0.04) | 0.341 | 0.00 (0.01) | 0.576 | 0.001 (0.001) | 0.551 |
| Age groups (years) | <0.001 | <0.001 | <0.001 | |||
| 2-5 vs 0-2 | 0.41 (0.05) | <0.001 | −0.05 (0.01) | <0.001 | −0.007 (0.002) | <0.001 |
| 5-10 vs 0-2 | 0.14 (0.05) | 0.010 | −0.08 (0.01) | <0.001 | 0.000 (0.002) | 0.982 |
| Initiation period (2009-2016 vs 2003-2008) | −0.04 (0.04) | 0.330 | 0.01 (0.01) | 0.058 | −0.004 (0.001) | 0.002 |
| Immunodeficiency for age* | 0.004 | <0.001 | <0.001 | |||
| Moderate vs No | −0.05 (0.07) | 0.465 | 0.03 (0.01) | <0.001 | −0.005 (0.002) | 0.006 |
| Severe vs No | −0.19 (0.06) | 0.002 | 0.05 (0.01) | <0.001 | −0.007 (0.002) | <0.001 |
| Missing vs No | −0.07 (0.06) | 0.284 | 0.03 (0.01) | <0.001 | −0.006 (0.002) | <0.001 |
| First line ART regimen (PI vs NNRTI based) | 0.00 (0.05) | 0.992 | 0.00 (0.01) | 0.545 | 0.002 (0.002) | 0.235 |
| Severity of wasting at ART initiation† | <0.001 | <0.001 | 0.398 | |||
| Moderately vs No | −1.57 (0.06) | <0.001 | 0.11 (0.01) | <0.001 | 0.002 (0.002) | 0.417 |
| Severely vs No | −3.24 (0.05) | <0.001 | 0.29 (0.01) | <0.001 | 0.003 (0.002) | 0.163 |
| Missing vs No | −0.63 (0.06) | <0.001 | 0.05 (0.01) | <0.001 | 0.002 (0.002) | 0.205 |
WAZ=Weight-for-age Z-score; NNRTI=Non-Nucleoside Reverse Transcriptase Inhibitor; PI=Protease Inhibitor
2006 WHO guidelines: severe= CD4% <15% or CD4 count <350 cells/μL; moderate= CD4% 15-25% or CD4 count 350-499 cells/μL.
WHO child growth standards: severe <−3 SD; moderate=[−3;−2[ SD; no ≥−2 SD.
HAZ=Height-for-age Z-score; NNRTI=Non-Nucleoside Reverse Transcriptase Inhibitor; PI=Protease Inhibitor
2006 WHO guidelines: severe= CD4% <15% or CD4 count <350 cells/μL; moderate= CD4% 15-25% or CD4 count 350-499 cells/μL.
WHO child growth standards: severe <−3 SD; moderate=[−3;−2[ SD; no ≥−2 SD.
WHZ/BAZ=Weight-for-Height/BMI-for-Age Z-scores; NNRTI=Non-Nucleoside Reverse Transcriptase Inhibitor; PI=Protease Inhibitor
2006 WHO guidelines: severe= CD4% <15% or CD4 count <350 cells/μL; moderate= CD4% 15-25% or CD4 count 350-499 cells/μL.
WHO child growth standards: severe <−3 SD; moderate=[−3;−2[ SD; no ≥−2 SD.
Height-for-age evolution
HAZ evolved positively throughout the 5-year period, with mean HAZ at baseline, 24 months and 60 months respectively −2.01 (sd 1.7), −1.24 (sd 1.28) and −0.95 (sd 1.14), and a prevalence of stunting decreasing from 50.2% at baseline to 16.4% at 60 months (Figure 1). The model estimated slope was +0.03 SD monthly (p<0.001) in the first 24 months, and +0.008 monthly (p<0.001) between 24 and 60 months on ART.
Adjusted for characteristics at ART initiation, children initiating ART <2 years were the most stunted at baseline and experienced greater HAZ increase in the first 24 months (5-10y vs 0-2y: −0.02 SD per month, p<0.001) and after (5-10y: −0.016 SD per month, p<0.001) (Table 2). As previously, the severity of stunting was significantly associated with HAZ evolution, with the greatest increase for the most severely stunted (Severely vs No, 0-2 years period: +0.05 SD per month, p<0.001 ; 2-5 years period: +0.009 SD per month, p<0.001) (Table 2). The most immunodeficient children at baseline were the most stunted but did not have significantly better HAZ improvements than those non-immunodeficient in the long-term (Severe vs No, 2-5 years period: −0.002 SD per month, p=0.172 ). Children initiating Protease Inhibitor (PI)-based ART were more stunted at baseline compared to those on NNRTI-based ART, and had a better HAZ increase in the long-term (2-5 years period: +0.008 SD per month, p<0.001) (Table 2). There were no differences of HAZ evolution by sex.
Weight-for-Height / Body-Mass-Index-for-age evolution
As a result of the two first indicators with great weight gains in the first year on ART before to stabilize, and constant height gains in the same period, WHZ/BAZ evolution was seen with a great increase in the first nine months, followed by a decrease until five years on ART. Mean WHZ/BAZ at baseline, 9 months and 60 months were respectively −1.74 (sd 1.88), −0.60 (sd 1.41) and −0.84 (sd 1.18), with a prevalence of wasting of 39.7% at baseline, 16.2% at 12 months, and 13,7% at 60 months (Figure 1). The model-estimated slope in the first nine months was +0.11 SD monthly (p<0.001), while it was −0.01 SD (p<0.001) monthly for the 9-60 months period.
In the adjusted model, children initiating ART < two years experienced the greatest WHZ/BAZ increase overall (5-10 vs 0-2, 0-9 months period: −0.08 SD per month, p<0.001; 2-5 vs 0-2, 9-60 months period: −0.007 SD per month, p<0.001) (Table 2). The most severely wasted children at baseline had the better WHZ/BAZ improvements (Severe vs No, 0-9 months period: +0.29 SD per month, p<0.001). In the 9-60 months period, WHZ/BAZ evolution did not differ significantly according to the severity of wasting at baseline (p=0.398) (Table 2). The most immunodeficient children at baseline were the most wasted, with greater WHZ/BAZ improvements in the first 9 months (Severe vs No: +0.05 SD per month, p<0.001), but also with greater WHZ/BAZ decrease in the 9-60 months period (Severe vs No: −0.007 SD per month, p<0.001) (Table 2).
Discussion
This study is one of the first to describe 5-year growth evolution since ART initiation in children <10 years in West Africa. Overall, we found that the prevalence of malnutrition among HIV-infected children at ART initiation was high, with more than half malnourished at ART initiation. We observed significant weight and height gains following ART initiation, with much more pronounced weight gains in the first 12 months on ART and constant height increase over the five years. However, a substantial part of the population remains malnourished after five years on ART, with 19% being underweight, 16% stunted and 14% wasted.
Growth evolution patterns observed within the first two years on ART are in line with those described elsewhere. In a literature review by McGrath and al., authors report few West African studies however (15). In Tanzania (16) and South Africa (25) reporting growth evolution over six and five years respectively, similar trends were observed with a strong weight increase in the first 6 months on ART, followed by stabilization overtime, and a steady height increase, but insufficient to fully compensate height deficiency (16).
A substantial part of HIV-infected children remains malnourished in the long-term in our study, as seen elsewhere (18,19,29,30). The most severely malnourished children at ART initiation were those with the better gains overtime, but these gains were often insufficient to reach similar values as non-malnourished children. The reasons why this population cannot completely recover from malnutrition could be cumulated malnutrition episodes during the pre-ART period resulting in irreversible damages to the organism (31,32). Stunting developed in the first years of life is known to be difficult, even impossible to resolve if it is not treated in time (33). Children initiating ART too late are at a high risk for stunting at ART initiation and will likely remain small for their age throughout adolescence (34). Another explanation for this phenomenon could be that these children are living in poorer socio-economic conditions, where food insecurity is high. Despite ART, their nutritional intakes could remain inadequate to recover properly from malnutrition (35,36).
The main factor associated with growth evolution was age at ART initiation, with better nutritional status overtime among those initiated early on ART. These results are in line with previous studies on this subject (15,17,18,29) and reinforce the importance of early ART initiation among children.
Children initiating PI-based ART had lower weight and height at ART initiation than those initiating NNRTI-based ART. Due to the poor availability of PI-based regimens in our study settings, this treatment could be allocated to the sickest children at ART initiation, especially infants enrolled before the age of 2. This indication bias could explain why these children had lower weight and height gains in the first months on ART. The extent of their disease progression may initially slow down growth recovery. Conversely, the higher gains observed in long-term ART for these children could be explained by better HIV outcomes (CD4 response, virological success) that were not investigated here. Studies comparing growth patterns by ART regimen still show conflicting results (15).
Our study had several limitations. Data on nutritional intakes and food insecurity were not recorded but could have been useful to investigate the effect of the socio-economical context on growth evolution in HIV-infected children initiating ART. These types of data are difficult to collect in routine follow-up. Also, other variables such as virological data or co-morbidities were not sufficiently available in our datasets to be included in the analyses. Retention dropped during the study period, with less than one quarter of the initial sample size still followed-up at five years on ART. Children LTFU before five years on ART could have faced more nutritional problems than those who remained in care (37,38), leading to a potential overestimation of the growth patterns in the long-term. Furthermore, children not included in our study because of missing anthropometric data were more often LTFU or died during the study period; they were possibly sicker than the included population and could be more exposed to malnutrition problems, leading also to an underestimation of the prevalence of malnutrition at baseline. We also had a selection bias in that children lately initiated on ART, after the age of two, could be seen as long-term survivors, less vulnerable than their counterparts who died before receiving ART. Finally, even if WHO growth references provide data on non-HIV infected children, they do not represent a real control population. Comparison with HIV-negative children living in West Africa in similar socio-economical context would have been necessary to assess the actual growth potential of these HIV-infected children. Despite these limitations, this study is the first, to our knowledge, to provide data on growth evolution beyond 24 months of ART in the West African context. The HIV epidemic response is still insufficient in these settings, where we observe a mixed epidemic with low PMTCT uptake resulting in high MTCT rates and an increasing population of HIV-infected children who need specific attention (1).
Within five years of ART, a high proportion of children were malnourished, even moderately. However, those moderately malnourished stay at risk to relapse to severe malnutrition, and experience adverse events. These children should be closely monitored nutritionally during their HIV follow-up to avoid other co-morbidities. In our study, 34% of children did not have recorded weight or height at their ART initiation visit. Even if these children did not seem to have impaired growth compared to those diagnosed as malnourished at ART initiation, this rate is too high and needs to be reduced for a better integration of nutritional monitoring and care into HIV care and for further research on growth at the time of ART initiation. Indeed, ART initiation and the first year on ART seem to be a crucial period for optimizing growth recovery. It could be the best window of opportunity to implement nutritional interventions and improve the nutritional status of these children on the long-term, even for those lately initiated on ART. Further studies focusing on this period need to be conducted.
While malnutrition has declined worldwide in the past 20 years, some regions such as West Africa still face constant malnutrition problems (6,39). In our study conducted over 15 years, no significant differences on growth at ART initiation and its evolution were seen according to the calendar year of initiation, showing that very few developments have emerged in nutritional care of HIV-infected children in more than a decade. Further investigations on what could be done for growth among HIV-infected children are urgently needed, with a better documentation of nutritional and metabolic outcomes. As young children grow up to be adolescents and adults, we urgently need initiatives focusing on nutrition in West African HIV-infected children who need a developed and appropriate nutritional care integrated to their HIV care to improve both their growth evolution and ART response.
Acknowledgments
The authors thank all the participating children and their families, as well as all the members of the hospital teams of the sites involved in the IeDEA West Africa paediatric cohort. Research reported in this publication was supported by the US National Institutes of Health (NIAID, NICHD, NCI and NIMH) under Award Number U01AI069919 (PI: Dabis). The content is solely the responsibility of the authors and does not necessarily represent the official views of the National Institutes of Health. JJ and SD were funded by Sidaction.
References
- 1.UNAIDS. UNAIDS DATA 2018. Geneva, Switzerland: UNAIDS; 2018 [Google Scholar]
- 2.Médecins Sans Frontières (MSF) International. Out of Focus: How millions of people in West and Central Africa are being left out of the global HIV response. Geneva, Switzerland: Médecins Sans Frontières (MSF) International; 2016. [Accessed 16 avr 2018]. Available at: https://www.msf.org/sites/msf.org/files/2016_04_hiv_report_eng.pdf [Google Scholar]
- 3.UNAIDS. HIV estimates with uncertainty bounds 1990-2017. Geneva, Switzerland; 20177[Accessed 18 mar 2019]. Available at: http://www.unaids.org/sites/default/files/media_asset/HIV_estimates_from_1990-to-present.xlsx [Google Scholar]
- 4.Black RE, Victora CG, Walker SP, Bhutta ZA, Christian P, de Onis M, et al. Maternal and child undernutrition and overweight in low-income and middle-income countries. Lancet Lond Engl. 2013;382(9890):427–51. [DOI] [PubMed] [Google Scholar]
- 5.OCHA. Sahel: A call for humanitarian aid - Responding to the needs of people affected by crises in the Sahel . New York, USA: OCHA; 2015. [Accessed 16 avr 2018]. Available at: https://reliefweb.int/report/nigeria/sahel-call-humanitarian-aid-responding-needs-people-affected-crises-sahel-enar [Google Scholar]
- 6.UNICEF-WHO-World Bank. Joint child malnutrition estimates-Levels and Trends in Child Malnutrition. Key findings of the 2017 edition. New York, USA: UNICEF; Geneva, Switzerland: WHO; and Washington DC, USA: World Bank; 2017 [Google Scholar]
- 7.Walker SP, Chang SM, Powell CA, Simonoff E, Grantham-McGregor SM. Early childhood stunting is associated with poor psychological functioning in late adolescence and effects are reduced by psychosocial stimulation. J Nutr. 2007;137(11):2464–9. [DOI] [PubMed] [Google Scholar]
- 8.Sudfeld CR, McCoy DC, Danaei G, Fink G, Ezzati M, Andrews KG, et al. Linear growth and child development in low- and middle-income countries: a meta-analysis. Pediatrics. 2015;135(5):e1266–1275. [DOI] [PubMed] [Google Scholar]
- 9.Jones KD, Thitiri J, Ngari M, Berkley JA. Childhood malnutrition: toward an understanding of infections, inflammation, and antimicrobials. Food Nutr Bull. 2014;35(2 Suppl):S64–70. [DOI] [PMC free article] [PubMed] [Google Scholar]
- 10.Cunningham-Rundles S, McNeeley DF, Moon A. Mechanisms of nutrient modulation of the immune response. J Allergy Clin Immunol. 2005;115(6):1119–28; quiz 1129. [DOI] [PubMed] [Google Scholar]
- 11.Fergusson P, Tomkins A. HIV prevalence and mortality among children undergoing treatment for severe acute malnutrition in sub-Saharan Africa: a systematic review and meta-analysis. Trans R Soc Trop Med Hyg. 2009;103(6):541–8. [DOI] [PubMed] [Google Scholar]
- 12.Mwiru RS, Spiegelman D, Duggan C, Seage GR, Semu H, Chalamilla G, et al. Nutritional Status and Other Baseline Predictors of Mortality among HIV-Infected Children Initiating Antiretroviral Therapy in Tanzania. J Int Assoc Provid AIDS Care. 2015;14(2):172–9. [DOI] [PMC free article] [PubMed] [Google Scholar]
- 13.Muenchhoff M, Healy M, Singh R, Roider J, Groll A, Kindra C, et al. Malnutrition in HIV-Infected Children Is an Indicator of Severe Disease with an Impaired Response to Antiretroviral Therapy. AIDS Res Hum Retroviruses. 2018;34(1):46–55. [DOI] [PMC free article] [PubMed] [Google Scholar]
- 14.Prendergast A, Bwakura-Dangarembizi MF, Cook AD, Bakeera-Kitaka S, Natukunda E, Nahirya Ntege P, et al. Hospitalization for severe malnutrition among HIV-infected children starting antiretroviral therapy. AIDS Lond Engl. 2011;25(7):951–6. [DOI] [PubMed] [Google Scholar]
- 15.McGrath CJ, Diener L, Richardson BA, Peacock-Chambers E, John-Stewart GC. Growth reconstitution following antiretroviral therapy and nutritional supplementation: systematic review and meta-analysis. AIDS Lond Engl. 2015;29(15):2009–23. [DOI] [PMC free article] [PubMed] [Google Scholar]
- 16.Mwiru RS, Spiegelman D, Duggan C, Seage GR, Semu H, Chalamilla G, et al. Growth among HIV-infected children receiving antiretroviral therapy in Dar es Salaam, Tanzania. J Trop Pediatr. 2014;60(3):179–88. [DOI] [PMC free article] [PubMed] [Google Scholar]
- 17.Sutcliffe CG, van Dijk JH, Munsanje B, Hamangaba F, Sinywimaanzi P, Thuma PE, et al. Weight and height z-scores improve after initiating ART among HIV-infected children in rural Zambia: a cohort study. BMC Infect Dis. 2011;11:54. [DOI] [PMC free article] [PubMed] [Google Scholar]
- 18.Gsponer T, Weigel R, Davies M-A, Bolton C, Moultrie H, Vaz P, et al. Variability of growth in children starting antiretroviral treatment in southern Africa. Pediatrics. 2012;130(4):e966–977. [DOI] [PMC free article] [PubMed] [Google Scholar]
- 19.Shiau S, Arpadi S, Strehlau R, Martens L, Patel F, Coovadia A, et al. Initiation of antiretroviral therapy before 6 months of age is associated with faster growth recovery in South African children perinatally infected with human immunodeficiency virus. J Pediatr. 2013;162(6):1138–45, 1145.e1–2. [DOI] [PMC free article] [PubMed] [Google Scholar]
- 20.Chhagan MK, Kauchali S, Van den Broeck J. Clinical and contextual determinants of anthropometric failure at baseline and longitudinal improvements after starting antiretroviral treatment among South African children. Trop Med Int Health TM IH. 2012;17(9):1092–9. [DOI] [PubMed] [Google Scholar]
- 21.Marazzi MC, De Luca S, Palombi L, Scarcella P, Ciccacci F, Ceffa S, et al. Predictors of adverse outcomes in HIV-1-infected children receiving combination antiretroviral treatment: results from a DREAM cohort in sub-Saharan Africa. Pediatr Infect Dis J. 2014;33(3):295–300. [DOI] [PubMed] [Google Scholar]
- 22.De Beaudrap P, Rouet F, Fassinou P, Kouakoussui A, Mercier S, Ecochard R, et al. CD4 cell response before and after HAART initiation according to viral load and growth indicators in HIV-1-infected children in Abidjan, Côte d’Ivoire. J Acquir Immune Defic Syndr 1999. 2008;49(1):70–6. [DOI] [PubMed] [Google Scholar]
- 23.Fassinou P, Elenga N, Rouet F, Laguide R, Kouakoussui KA, Timite M, et al. Highly active antiretroviral therapies among HIV-1-infected children in Abidjan, Côte d’Ivoire. AIDS Lond Engl. 2004;18(14):1905–13. [DOI] [PubMed] [Google Scholar]
- 24.Cames C, Pascal L, Diack A, Mbodj H, Ouattara B, Diagne NR, et al. Risk Factors for Growth Retardation in HIV-infected Senegalese Children on Antiretroviral Treatment: The ANRS 12279 MAGGSEN Pediatric Cohort Study. Pediatr Infect Dis J. 2017;36(4):e87–92. [DOI] [PubMed] [Google Scholar]
- 25.Feucht Ute D, Van Bruwaene Lore, Becker Piet J., Kruger Mariana. Growth in HIV‐infected children on long‐term antiretroviral therapy. Trop Med Int Health. 2016;21(5):619–29. [DOI] [PubMed] [Google Scholar]
- 26.WHO Multicentre Growth Reference Study Group. WHO child growth standards: length/height-for-age, weight-for-age, weight-for-length, weight-for-height and body mass index-for-age ; methods and development. Geneva, Switzerland: World Health Organisation; 2006. 312 p. [Google Scholar]
- 27.de Onis M, Onyango AW, Borghi E, Siyam A, Nishida C, Siekmann J. Development of a WHO growth reference for school-aged children and adolescents. Bull World Health Organ. 2007;85(9):660–7. [DOI] [PMC free article] [PubMed] [Google Scholar]
- 28.WHO. WHO Case Definitions of HIV for Surveillance and Revised Clinical Staging and Immunological Classification of HIV-related Disease in Adults and Children. Geneva, Switzerland: WHO; 2006 [Google Scholar]
- 29.Jesson J, Koumakpaï S, Diagne NR, Amorissani-Folquet M, Kouéta F, Aka A, et al. Effect of Age at Antiretroviral Therapy Initiation on Catch-up Growth Within the First 24 Months Among HIV-infected Children in the IeDEA West African Pediatric Cohort. Pediatr Infect Dis J. 2015;34(7):e159–168. [DOI] [PMC free article] [PubMed] [Google Scholar]
- 30.Jesson J, Dahourou DL, Folquet MA, Malateste K, Yonaba C, N’Gbeche M-S, et al. Malnutrition, Growth Response and Metabolic Changes Within the First 24 Months After ART Initiation in HIV-Infected Children Treated Before the Age of Two Years in West Africa. Pediatr Infect Dis J. 2018; doi: 10.1097/INF.0000000000001932. [Epub ahead of print] [DOI] [PubMed] [Google Scholar]
- 31.Guerrant RL, Oriá RB, Moore SR, Oriá MOB, Lima AAM. Malnutrition as an enteric infectious disease with long-term effects on child development. Nutr Rev. 2008;66(9):487–505. [DOI] [PMC free article] [PubMed] [Google Scholar]
- 32.Lelijveld N, Seal A, Wells JC, Kirkby J, Opondo C, Chimwezi E, et al. Chronic disease outcomes after severe acute malnutrition in Malawian children (ChroSAM): a cohort study. Lancet Glob Health. 2016;4(9):e654–662. [DOI] [PMC free article] [PubMed] [Google Scholar]
- 33.Dewey KG, Begum K. Long-term consequences of stunting in early life. Matern Child Nutr. 2011;7 Suppl 3:5–18. [DOI] [PMC free article] [PubMed] [Google Scholar]
- 34.Williams PL, Jesson J. Growth and pubertal development in HIV-infected adolescents. Curr Opin HIV AIDS. 2018;13(3):179–86. [DOI] [PMC free article] [PubMed] [Google Scholar]
- 35.Chege PM, Ndungu ZW, Gitonga BM. Food security and nutritional status of children under-five in households affected by HIV and AIDS in Kiandutu informal settlement, Kiambu County, Kenya. J Health Popul Nutr. 2016;35(1):21. [DOI] [PMC free article] [PubMed] [Google Scholar]
- 36.Sunguya BF, Poudel KC, Mlunde LB, Urassa DP, Yasuoka J, Jimba M. Poor nutrition status and associated feeding practices among HIV-positive children in a food secure region in Tanzania: a call for tailored nutrition training. PloS One. 2014;9(5):e98308. [DOI] [PMC free article] [PubMed] [Google Scholar]
- 37.Ardura-Garcia C, Feldacker C, Tweya H, Chaweza T, Kalulu M, Phiri S, et al. Implementation and Operational Research: Early Tracing of Children Lost to Follow-Up From Antiretroviral Treatment: True Outcomes and Future Risks. J Acquir Immune Defic Syndr 1999. 2015;70(5):e160–167. [DOI] [PMC free article] [PubMed] [Google Scholar]
- 38.Sengayi M, Dwane N, Marinda E, Sipambo N, Fairlie L, Moultrie H. Predictors of loss to follow-up among children in the first and second years of antiretroviral treatment in Johannesburg, South Africa. Glob Health Action. 2013;6:19248. [DOI] [PMC free article] [PubMed] [Google Scholar]
- 39.NCD Risk Factor Collaboration (NCD-RisC). Worldwide trends in body-mass index, underweight, overweight, and obesity from 1975 to 2016: a pooled analysis of 2416 population-based measurement studies in 128·9 million children, adolescents, and adults. Lancet Lond Engl. 2017;390(10113):2627–42. [DOI] [PMC free article] [PubMed] [Google Scholar]