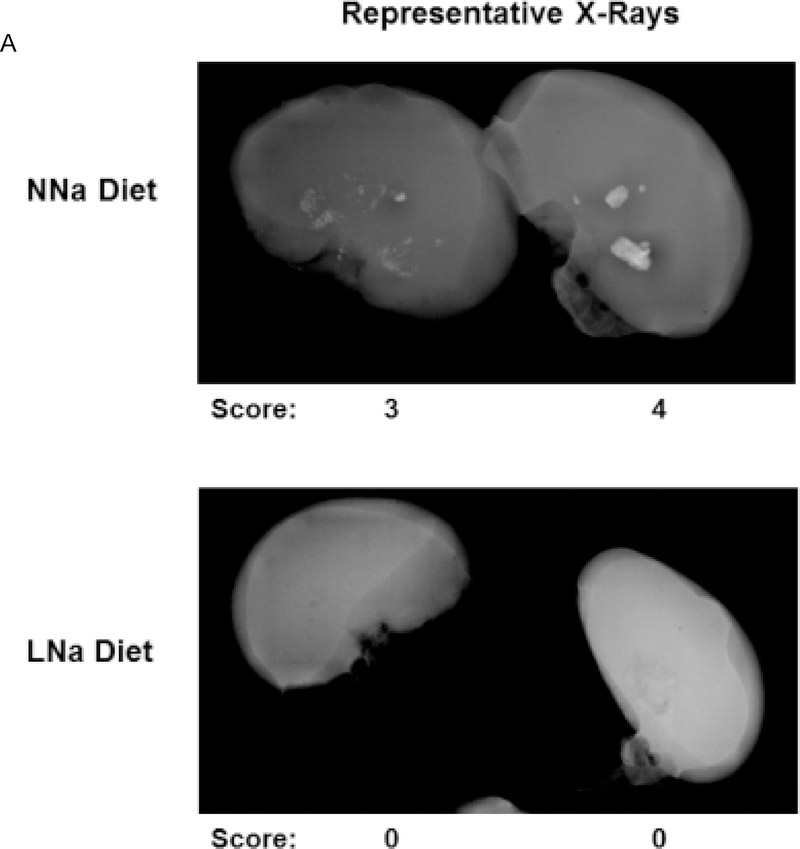
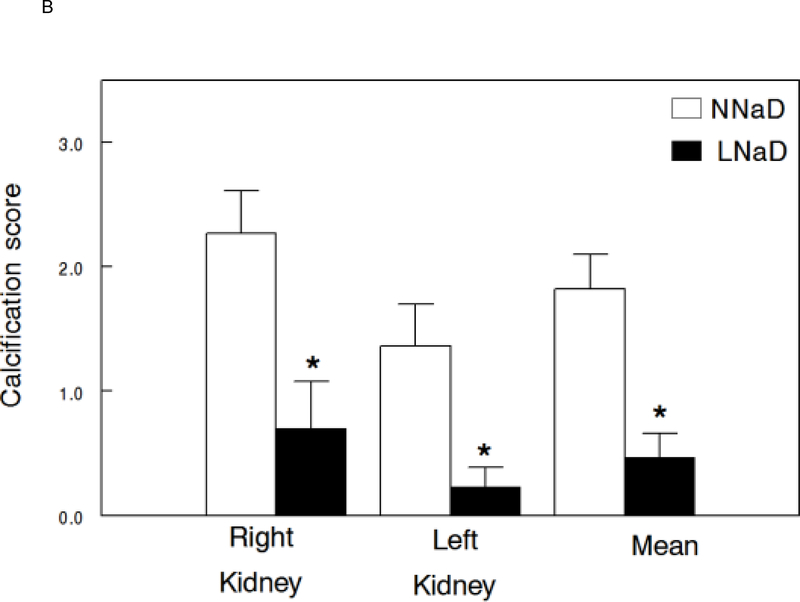
Figure 4.
Kidney stone formation at the conclusion of the 18 week study. At the end of the 18 week study, the extent of kidney stone formation was determined by blinded three observers as described in the Concise Methods. A) Representative radiographs of kidneys on a normal Na diet (NNaD) or a low Na diet (LNaD). Calcification scores are provided as a reference. B) Quantitation of stone formation and calcification in all GHS rats fed a NNaD or a LNaD. Values are mean ± SEM (n=11). *p<0.05 for LNaD compared to NNaD.


