Abstract
Epigenetic mechanisms play an important role in the early stages of carcinogenesis. Moringa isothiocyanate (MIC-1) is a major bioactive component derived from Moringa oleifera that has considerable antioxidant and anti-inflammatory effects. However, how MIC-1 influences epigenomic alterations in TPA-mediated JB6 cell carcinogenic transformation has not been evaluated. In this study, DNA and RNA isolated from TPA-induced JB6 cells in the presence or absence of MIC-1 were subjected to DNA Methyl-seq and RNA-seq to identify differentially methylated regions (DMRs) and differentially expressed genes (DEGs), respectively. When JB6 cells were challenged with TPA alone, there was a significant alteration of DEGs and DMRs; importantly, MIC-1 treatment reversed the patterns of some of the DEGs and DMRs. Transcriptome and CpG methylome profiling was performed in Ingenuity® Pathway Analysis (IPA) software to analyze the altered signaling pathways. Several anti-inflammatory responses, antioxidative stress-related pathways, and anticancer-related pathways were identified to be affected by MIC-1. These pathways included NF-kB, IL-1, LPS/IL-1-mediated inhibition of RXR function, Nrf2-mediated oxidative stress response, p53, and PTEN signaling pathways. Examination of correlations between transcriptomic and CpG methylome profiles yielded a small subset of genes, including the cancer-related genes Tmpt, Tubb3, and Muc2; the GTPases Gchfr and Igtp; and the cell cycle-related gene Cdc7. Taken together, our results show the potential contributions of epigenomic changes in DNA CpG methylation to gene expression to molecular pathways active in TPA-induced JB6 cells and demonstrate that MIC-1 can reverse these changes, supporting the potential preventive/treatment effects of MIC-1 against skin carcinogenesis.
Keywords: TPA, JB6 cell, transcriptome, DNA methylome, moringa isothiocyanate
Introduction
The skin is constantly exposed to ultraviolet (UV) radiation, chemical carcinogens (environmental pollutants), and tumor promoters. Because exposure to these agents is increasing, skin cancer incidence is rising steadily worldwide [1, 2]. Increasing evidence from epidemiologic and clinical studies indicates that oxidative stress coupled with chronic inflammatory disorders increases the risk of many diseases, including cancers [3–9]. Aberrant epigenetic alterations have also been observed in the development and progression of skin cancer [10–13]. Some dietary phytochemicals possess chemopreventive properties and can prevent cancer through inhibition of oxidative stress/inflammation coupled with modification of epigenetic processes [14–16]. We previously demonstrated the anticancer effect of the isothiocyanate (ITC) sulforaphane (SFN), which possesses strong antioxidant/anti-inflammatory properties, against 12-O-tetradecanoylphorbol-13-acetate (TPA)-induced neoplastic/tumorigenic transformation of mouse epidermal JB6 P+ cells; this effect occurred through epigenetic reprogramming of anticancer genes such as Nrf2 and subsequent induction of downstream target genes involved in cellular protection [17]. Our recent global epigenome analysis of UVB-irradiated SKH-1 mice and 7,12-dimethylbenz[a]anthracene (DMBA)/TPA-induced CD-1 mice identified extensive gene methylation changes during skin carcinogenesis [18].
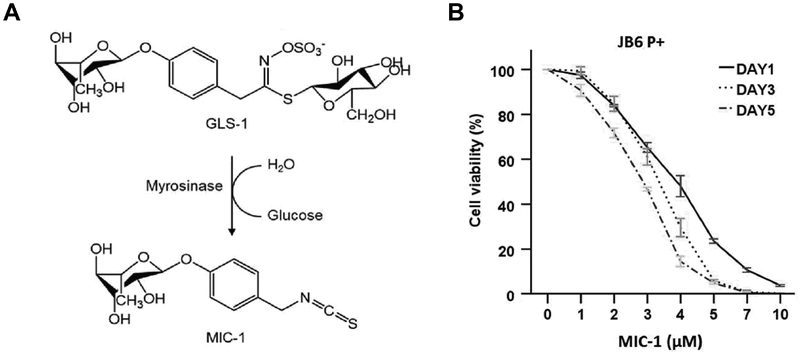
Moringa isothiocyanate (MIC-1) (Figure 1A), which is structurally unique and chemically stable, is a major bioactive component derived from Moringa oleifera, a tropical plant known for its use as an anti-inflammatory, antioxidant, and antidiabetic agent [19–21]. Our choice of MIC-1 for this study stems from its enhanced antioxidant and anti-inflammatory effects compared to SFN as well as its potential to regulate the Nrf2-antioxidant response element (ARE) signaling pathway and epigenetic events, including demethylation of CpGs in the Nrf2 promoter and inhibition of DNA methyltransferases (DNMTs) and histone deacetylases (HDACs) (our unpublished data). Our most recent study showed changes in the DNA CpG methylome and transcriptome at different stages of tumor progression using next-generation sequencing (NGS; DNA Methyl-seq and RNA-seq) analyses. Most importantly, the natural product (NP) curcumin effectively alters the DNA methylome and transcriptome and prevents azoxymethane (AOM)-dextran sodium sulfate (DSS)-induced colitis-accelerated colon carcinogenesis [22]. In addition, DNA Methyl-seq and RNA-seq analyses of in vitro diabetic nephropathy models treated with MIC-1 show differential DNA methylation and gene expression profiles (our unpublished data). Despite this evidence, significant gaps remain regarding the exact roles of DNA CpG methylation and gene expression in skin carcinogenesis as well as the impact of dietary MIC-1 on the DNA methylome and transcriptome in the prevention/treatment of skin carcinogenesis. Thus, these topics were the focus of this study.
Figure 1.
Cell viability of JB6 P+ cells after treatment with MIC-1. (A) Chemical structure of MIC-1. The glycosidic glucosinolate-1 (GLS-1) is converted into bioactive 4-[(α-L-rhamnosyloxy)-benzyl] isothiocyanate (MIC-1) [21]. (B) JB6 P+ cells were treated with various concentrations of MIC-1 for 1, 3, or 5 days as described in the Materials and Methods. Cell viability was determined by MTS assay. The data are presented as the mean ± SD.
The mouse epidermal JB6 cell lines isolated from Balb/C mice are commonly used to study carcinogenesis and molecular targets for cancer chemoprevention [23–26]. Clonal genetic variants of JB6 cells can exhibit different neoplastic/tumorigenic transformation responses to tumor promoters, such as TPA [23, 25]. For instance, one of the variants, the JB6 P+ cell line, is sensitive to promoter-induced transformation, but the P- cell line is not [27–29]. In this study, we used a TPA-induced JB6 P+ cell model to examine the transcriptomic and epigenomic changes and chemopreventive effects associated with MIC-1 treatment. The results of this study identify potential transcriptomic and epigenomic biomarkers related to skin carcinogenesis and chemoprevention with dietary phytochemicals that can provide novel prevention or treatment strategies.
Materials and methods
Materials
Minimum essential medium (MEM), fetal bovine serum (FBS), penicillin-streptomycin (10,000 U/ml), puromycin, versene, and trypsin-EDTA were supplied by Gibco (Grand Island, NY, USA). MIC-1 (98 % purity) was kindly provided by Ilya Raskin (Rutgers University, New Brunswick, NJ, USA). Dimethyl sulfoxide (DMSO) was purchased from Sigma-Aldrich (St. Louis, MO, USA). TPA was obtained from Alexis Biochemicals (San Diego, CA, USA).
Cell culture and treatment
The mouse epidermal JB6 P+ cell line was obtained from the American Type Culture Collection (ATCC; Manassas, VA, USA) and cultured in MEM with 5 % FBS at 37 °C in a humidified 5 % CO2 atmosphere. Cells were grown to approximately 80 % confluence and treated with medium containing MIC-1 (2.5 μM) and/or TPA (10 ng/mL) for 5 days. DMSO (0.1 %) was used as the vehicle control.
Cell viability test: MTS assay
JB6 P+ cells were seeded in a 96-well plate at a density of 1 × 10³ cells/well for 24 h and were treated with 0.1 % DMSO or MIC-1 at various concentrations for 1, 3, or 5 days. The cell culture medium was changed every other day. To determine cell viability, a CellTiter® 96 AQueous Non-Radioactive Cell Proliferation Assay (Promega, Madison, WI, USA) was used as previously described [30].
Isolation of nucleic acids and NGS
Total RNA and DNA were extracted from cells using an AllPrep DNA/RNA Mini Kit (Qiagen, Valencia, CA, USA). The quality and concentration of extracted RNA and DNA were determined using an Agilent 2100 Bioanalyzer and a NanoDrop spectrophotometer, respectively. RNA and DNA samples were subjected to RNA-seq and SureSelect Methyl-seq, respectively. Library preparation and sequencing were performed by RUCDR Infinite Biologics. The RNA-seq and DNA Methyl-seq procedures were the same as those described previously [31]. Briefly, the RNA library was constructed using an Illumina TruSeq RNA preparation kit (Illumina, San Diego, CA, USA) according to the manufacturer’s manual. The RNA samples were sequenced on an Illumina NextSeq 500 instrument with 75 bp single-end reads, generating 30–40 million reads per sample. The DNA samples were further processed using an Agilent Mouse SureSelect Methyl-seq Target Enrichment System (Agilent Technologies Inc., Santa Clara, CA, USA). Bisulfite conversion was performed using an EZ DNA Methylation-Gold Kit (Zymo Research, USA) as described in the manufacturer’s protocol. Like RNA sequencing, DNA sequencing was performed on an Illumina NextSeq 500 instrument with 76-bp single-end reads, generating 30–40 million reads per sample.
Bioinformatics analyses
RNA-seq
Cutadapt [32] was used to remove the Illumina Universal Adapter sequence. The reads were aligned to the mouse genome (mm10) with HISAT2 [33], and PCR duplicates were removed. Genomic features with overlapping reads were counted by featureCounts (version 1.5.1) [34] and were analyzed for differential expression with DEGSeq (version 1.36.0) in R (version 3.4.0) [35].
DNA SureSelect Methyl-seq
The DNA reads were aligned to the in silico bisulfite-converted mouse genome (mm10) with the Bismark (version 0.15.0) alignment algorithm [36]. After alignment, DMRfinder (version 0.1) was used to extract methylation counts and to cluster CpG sites into differentially methylated regions (DMRs) [37]. Each DMR contained at least three CpG sites. Methylation differences greater than 0.10 with P-values less than 0.05 were considered significant. Genomic annotation was performed with ChIPseeker (version 1.10.3) in R (version 3.4.0) [38].
Ingenuity Pathway Analysis (IPA)
Isoforms with false discovery rates (q) < 0.05 and log2 fold changes >1.0 or <−1.0 were subjected to IPA (IPA 4.0, Ingenuity Systems, www.Ingenuity.com). The input isoforms were mapped to the IPA knowledge base, and the biological functions, networks, and pathways related to MIC-1 treatment were identified.
Statistical analysis
Statistical significance was tested with one-way ANOVA followed by Dunnett’s post hoc test for differences among multiple experimental groups and with Student’s t-test for differences between two experimental groups. The values are presented as the mean ± standard deviation (SD). P-values less than 0.05 were considered statistically significant.
Results
Cytotoxicity of MIC-1 in JB6 P+ cells
The cell viability of JB6 P+ cells was measured by MTS assay, as shown in Figure 1B. The JB6 P+ cells were treated with various concentrations of MIC-1 for 1, 3, or 5 days to examine cytotoxicity. Treatment with MIC-1 had time- and dose-dependent effects on cell viability. The cell viability of JB6 P+ cells following MIC-1 (< 3 μM) treatment was greater than 50 % after 1, 3, or 5 days. Thus, 2.5 μM MIC-1 and 5-day treatments were used in subsequent studies.
Gene expression changes during TPA-induced neoplastic/tumorigenic transformation in JB6 cells treated with MIC-1
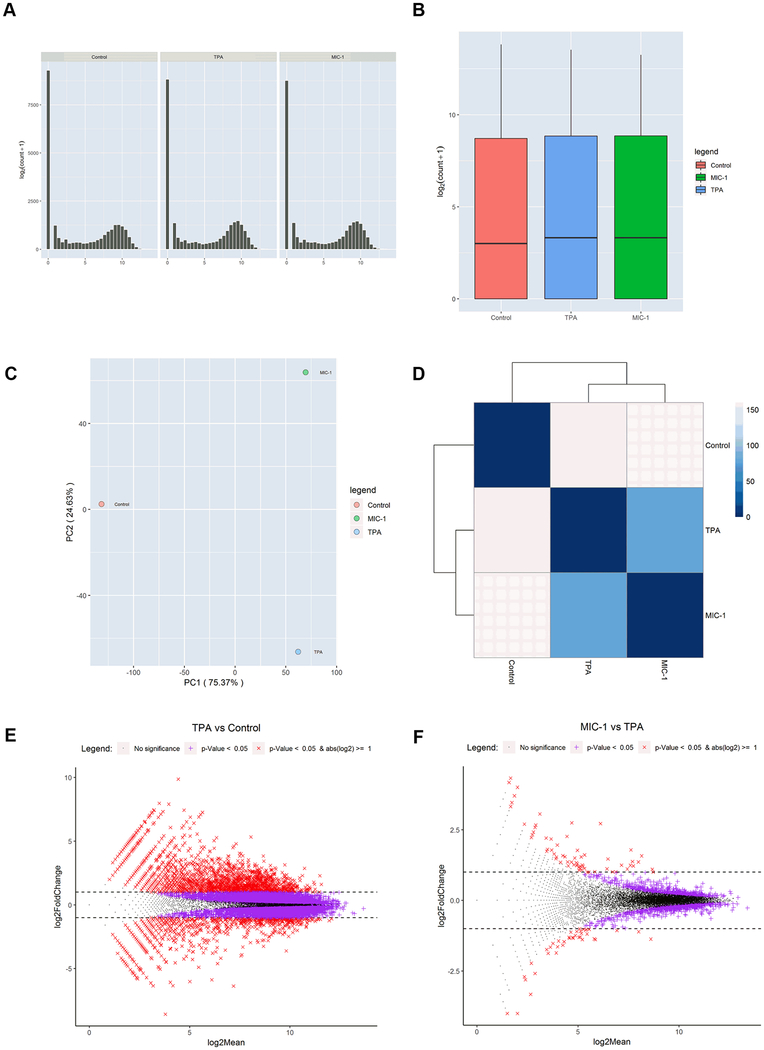
To identify gene expression changes during TPA-induced neoplastic/tumorigenic transformation in JB6 cells treated with MIC-1, we performed RNA-seq with RNA samples from control, TPA, and TPA with MIC-1 groups. The samples were subjected to library preparation with an Illumina TruSeq RNA preparation kit and then sequenced on an Illumina NextSeq 500 platform. Sequencing reads were aligned to the mouse genome (mm10) and deduplicated. Figure 2A–B shows that the counts and the raw gene expression across the three groups were similar. Principal component analysis (PCA) showed the control group to be clearly separated from the other two groups (Figure 2C). To further identify the gene expression changes caused by TPA and MIC-1 treatment, Euclidean distance clustering was performed. As shown in Figure 2D, the control group clustered separately from the other two groups. TPA treatment had a stronger impact on gene expression changes than MIC-1 treatment, which is consistent with the PCA results. Next, gene expression profiles were compared between the TPA group and the control group and between the TPA with MIC-1 group and the TPA group using a cutoff q-value of less than or equal to 0.05 combined with a log2 fold change threshold of >1.0 or <−1.0; the comparisons are represented in MA plots depicting both the upregulated and downregulated genes (Figure 2E–F). There were more significant DEGs between the TPA group and the control group than between the TPA with MIC-1 group and the TPA group. These results suggest that both TPA and MIC-1 can alter gene expression profiles in mouse epidermal cells but that the effects of TPA are much stronger than those of MIC-1.
Figure 2.
RNA-seq analysis of gene expression changes caused by TPA and MIC-1 in JB6 cells. (A) Distribution of DEGs by number of genes. (B) Normalized annotated data for the control, TPA, and TPA with MIC-1 groups. (C) Dendrogram of the gene expression profiles of the 3 groups clustered by Euclidean distance. The dendrogram shows that the samples are first clustered by TPA treatment. (D) PCA of RNA expression in the 3 groups. The RNA expression profiles of the control group are separate from those of the TPA and TPA with MIC-1 groups, suggesting that TPA has strong effects on gene expression in mouse epidermal cells. (E, F) MA plots showing DEGs in response to TPA treatment and MIC-1 treatment with cutoffs of q < 0.05 and log2(fold change) > 1 or < −1.
Canonical signaling pathways affected by TPA and MIC-1 treatment
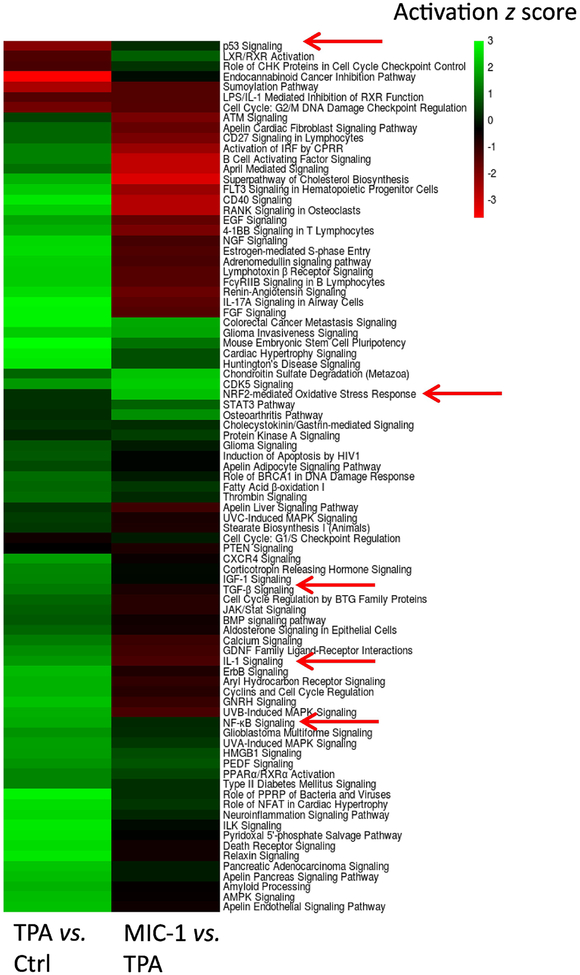
Canonical pathway analysis was performed in IPA to understand the possible biological functions associated with the DEGs [39]. For this analysis, we used a broader list of differentially regulated genes defined by a false discovery rate (q) < 0.05 and a log2 fold change threshold of >1.0 or <−1.0 to analyze 2,043 genes from the TPA group versus control group comparison and used criteria of p < 0.05 and log2 fold change >0.1 or <−0.1 to analyze 2,234 genes from the TPA with MIC-1 group versus TPA group comparison. Then, we obtained two lists of regulated pathways from the two comparisons. Based on the −log (P-value) of the pathways generated by IPA, the top 85 common pathways (all of which had a −log (P-value) > 1) were selected, and their ‘activation z scores’ are shown in a heatmap (Figure 3). Among these pathways, 76 were activated by TPA and inhibited by MIC-1, while the other 9 pathways were inhibited by TPA and activated by MIC-1. Interestingly, most of them were inflammatory response-, cancer-, and oxidative stress-related pathways, such as those involved in NF-kB signaling, IL-1 signaling, LPS/IL-1-mediated inhibition of RXR function, PTEN signaling, p53 signaling, and the Nrf2-mediated oxidative stress response. Not unexpectedly, these findings suggest that TPA causes inflammation, oxidative stress, and tumorigenesis, while MIC-1 can alleviate these effects.
Figure 3.
Heatmap showing the top 85 regulated pathways shared in both comparisons (TPA vs. control and TPA+MIC-1 vs. TPA). Anti-inflammatory and anti-oxidative stress pathways affected by MIC-1 were extracted.
Overview of DEGs regulated by TPA and MIC-1 treatment
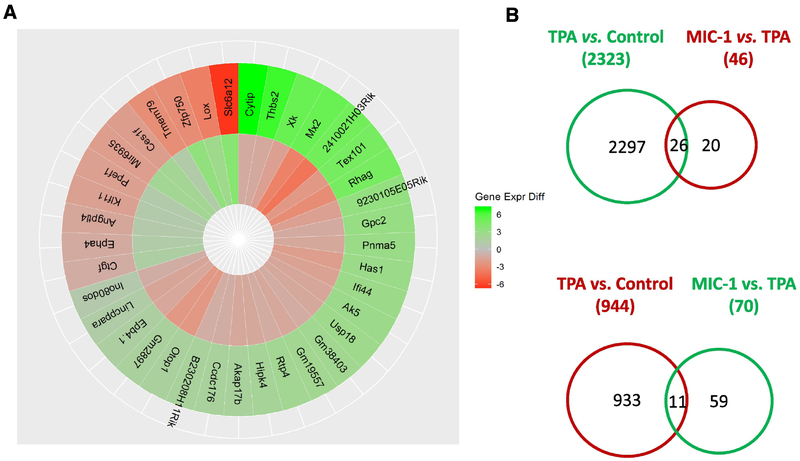
To further examine the impacts of TPA and MIC-1 on JB6 cells, we compared the gene expression profiles in the TPA group versus control group comparison and the TPA with MIC-1 group versus TPA group comparison. Criteria of a false discovery rate (q) < 0.05 and a log2 fold change >1.0 or <−1.0 were used to identify the DEGs. We identified 3,267 DEGs between the TPA group and the control group (2,323 genes were upregulated by TPA, while 944 genes were downregulated by TPA). We also observed 116 DEGs between the TPA with MIC-1 group and the TPA group (46 genes were downregulated by MIC-1, while 70 genes were upregulated by MIC-1) (Figure 4B). Among the genes regulated by TPA treatment and by MIC-1 treatment, a total of 37 genes were found to affect gene expression in opposite directions (Figure 4A). Specifically, 26 genes that were significantly upregulated by TPA (26/2,323) were downregulated by MIC-1 treatment (26/46). Eleven significantly downregulated genes in the TPA group versus the control group (11/944) were increased in the TPA with MIC-1 group versus the TPA group (11/70). These 37 genes might represent a set of molecular targets for chemoprevention and explain the differences between TPA and MIC-1 treatment, indicating that MIC-1 may play an important protective role during TPA-induced neoplastic/tumorigenic transformation in JB6 cells.
Figure 4.
Overview of the genes regulated by TPA treatment and MIC-1 treatment. (A) Circos plot of 37 DEGs that appeared in both the TPA group versus control group and the TPA with MIC-1 group vs. TPA group comparisons. (B) Venn diagrams comparing the upregulated and downregulated genes in these two comparisons. Genes with q < 0.05 and log2(fold change) > 1 or < −1 were counted.
DNA methylation changes during TPA-induced neoplastic/tumorigenic transformation in JB6 cells treated with MIC-1
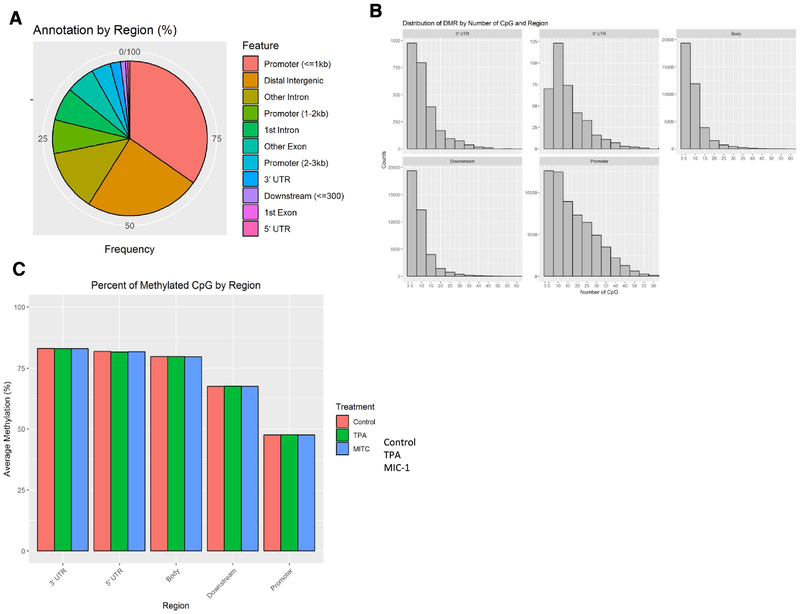
To identify DNA methylation changes during TPA-induced neoplastic/tumorigenic transformation in JB6 cells treated with MIC-1, we performed single base-pair resolution Methyl-seq with DNA samples from all three groups. The samples were subjected to Agilent SureSelect Mouse Methyl-seq library preparation and then sequenced on an Illumina NextSeq 500 platform. Sequencing reads were aligned to an in silico C-T converted mouse genome (mm10) and deduplicated. Individual CpG sites were clustered into DMRs, and the average methylation ratio for each DMR was calculated. We then collected DNA methylation data for a total of 140,641 DMRs. These DMRs were further annotated with gene features using ChIPseeker (v1.14.2). As shown in Figure 5A, most of the DMRs were located in the promoters and the distal intergenic regions (> 3 kb upstream of the transcription start site (TSS) or downstream of the 3’ untranslated region (UTR)). Likewise, analysis of the distribution of DMRs based on number of CpGs and region showed that the number of CpG sites in the promoter region was much greater than that in other regions (Figure 5B). We next compared the DNA methylation levels of samples from the control group, the TPA group, and the TPA with MIC-1 group. As shown in Figure 5C, no significant differences in methylation were observed among the sample groups. However, CpG methylation in the promoters was much lower than that in other regions for these groups.
Figure 5.
Methyl-seq analysis of methylation alterations caused by TPA and MIC-1 in JB6 cells. (A) Distribution of annotated DMRs by gene feature. Each DMR has at least three CpG sites. (B) Distribution of DMRs by number of CpGs and region. (C) Average methylation levels of DMRs based on gene regions for samples in the control, TPA, and TPA with MIC-1 groups.
Overview of DMRs regulated by TPA and MIC-1 treatment
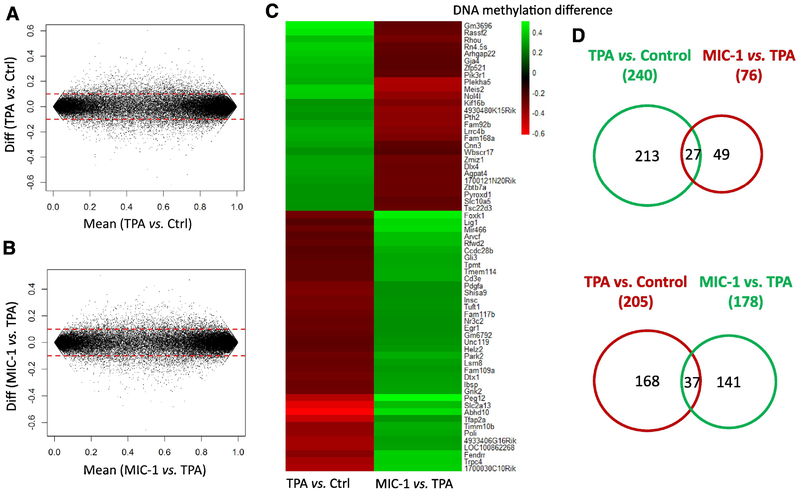
To examine the impacts of TPA and MIC-1 treatment on JB6 cells, we compared the methylation profiles between the TPA group and the control groups as well as between the TPA with MIC-1 group and the TPA group. A cutoff of a methylation difference greater than 0.1 was used to identify the DMRs. As shown in Figure 6A–B, the numbers of DMRs with hypermethylation or hypomethylation in the two comparisons were similar. However, there were higher levels of hypermethylation in the TPA group versus control group comparison than in the TPA with MIC-1 group versus TPA group comparison. We then further investigated the differences in methylation between the three groups in the two comparisons. As shown in Figure 6C–D, 445 DMRs were identified between the TPA group and the control group (240 DMRs were hypermethylated and 205 genes were hypomethylated in response to TPA). We also detected 254 DMRs between the TPA with MIC-1 group and the TPA group (178 DMRs were hypermethylated and 76 DMRs were hypomethylated in response to MIC-1 treatment). Of the DMRs regulated by TPA and MIC-1, a total of 64 DMRs were found to affect methylation in opposite directions. Specifically, 27 DMRs that were hypermethylated by TPA (27/240) were hypomethylated by MIC-1 treatment (27/76). Thirty-seven DMRs that were hypomethylated in the TPA group versus the control group (37/205) were hypermethylated by MIC-1 treatment (37/178). These results suggest that methylation changes in these genes (hyper- or hypomethylation) that occur in response to TPA can be reversed by MIC-1 treatment.
Figure 6.
Overview of DNA methylation regulation by TPA treatment and MIC-1 treatment. (A, B) MA plots showing DMRs associated with TPA treatment and MIC-1 treatment. (C) Heatmap showing promoter methylation changes in the top 20 regulated genes shared by both comparisons.
Correlation between transcriptome gene expression and the DNA methylome
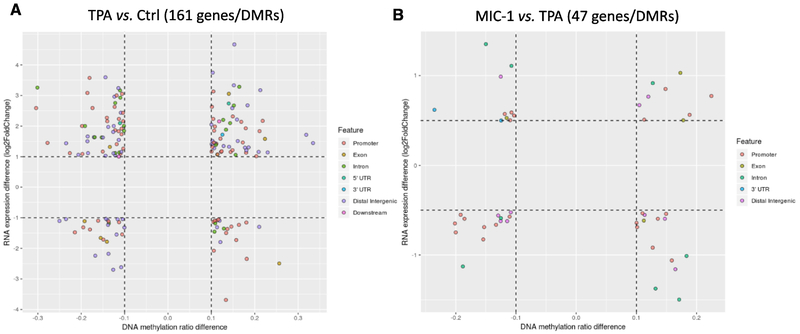
DMRs very often play an important role in the transcription of some crucial genes. It is generally accepted that promoter methylation of DMRs is associated with decreased transcription of downstream genes. Given the impressive changes we observed in gene expression and DNA methylation, we next integrated the profiles to determine whether there were any connections between methylation and gene expression. With a cutoff of 0.1 for DNA methylation changes combined with a cutoff of two-fold changes for gene expression, 161 DEGs/DMRs were identified in the TPA group versus control group comparison (Figure 7A). Likewise, with a cutoff of 0.1 for DNA methylation changes combined with a cutoff of one-fold changes for gene expression, 47 DEGs/DMRs were identified in the TPA with MIC-1 group versus TPA group comparison (Figure 7B). In the figure, each dot represents a DMR/DEG, and the corresponding features are indicated by different colors. Not surprisingly, many more genes were revealed in the TPA group versus control group comparison than in the TPA with MIC-1 group versus TPA group comparison. Notably, Tmpt, Cdc7, Adam8, Gchfr, Tubb3, and Igtp (all hypomethylated and with upregulated gene expression) were extracted from the TPA group versus control group comparison, while Muc2 (hypermethylated and with downregulated gene expression) stood out in the TPA with MIC-1 group versus TPA group comparison (Supplementary Table 1). Collectively, these results suggest that an important subset of genes associated with skin tumorigenesis was identified through investigation of correlations between gene expression and DNA methylation.
Figure 7.
Investigation of correlations between gene expression and DNA methylation. (A) Scatter plot showing 161 DMRs/genes in the TPA group versus control group based on a cutoff of 0.1 for DNA methylation and a 2-fold change threshold for RNA expression. (B) Scatter plot showing 47 DMRs/genes in the TPA with MIC-1 group versus TPA group comparison based on a cutoff of 0.1 for DNA methylation and a 1-fold change threshold for RNA expression. The DMR locations (gene features) are indicated by the colors.
Discussion
Carcinogenesis is caused by a cumulative and multistage process that primarily consists of initiation, promotion, and progression stages [17]. Oxidative stress coupled with chronic inflammation has been found to drive carcinogenesis. Some tumor promoters induce conversion of initiated cells into tumorigenic cells, potentially by promoting oxidative/inflammatory responses [40, 41]. TPA, the most active known tumor promoter, exerts numerous biological and biochemical effects, including causing neoplastic/tumorigenic transformation in preneoplastic JB6 P+ cells [42, 43]. In the current study, we investigated the preventive potential of dietary phytochemical MIC-1 against TPA-induced neoplastic transformation in JB6 P+ cells and examined changes in DNA methylation and gene expression with or without MIC-1 treatment. Interestingly, we found that TPA dramatically affected the methylome and transcriptome profiles of JB6 P+ cells and that MIC-1 could reverse some of the alterations, including those related to inflammatory responses, oxidative stress, and carcinogenesis-related targets and signaling pathways.
Canonical signaling pathway analysis was performed for the RNA-seq profile in IPA. The top 85 shared significantly affected pathways (all of which had a −log (P-value) > 1) were determined (Figure 3). Inflammatory response-related NF-kB signaling, IL-1 signaling, and LPS/IL-1-mediated inhibition of RXR function were activated by TPA but inhibited by MIC-1 treatment. However, the Nrf2-mediated oxidative stress response was inhibited by TPA but activated by MIC-1 treatment. Previous studies have shown that the transcription factor NF-kB can be suppressed but that Nrf2 and its downstream genes heme oxygenase-1 (HO-1) and glutathione S-transferase A1 (GSTA1) can be induced by red ginseng oil and chlorogenic acid in TPA-challenged JB6 P+ cells [44, 45]. Our results further reveal the anti-inflammatory/anti-oxidative stress effects of MIC-1 in JB6 P+ cells. Moreover, cancer-related p53 signaling and PTEN signaling were inhibited by TPA but activated by MIC-1 treatment. A recent study showed that salidroside could increase the expression of p53 in DMBA/TPA-induced mice [46]. Our results provide the first evidence that MIC-1 can prevent skin carcinogenesis induced by TPA in a mouse epidermal JB6 P+ cell model by suppressing inflammation and activating tumor suppressors.
In addition, an important subset of genes associated with the preventive effects of MIC-1 in TPA-induced JB6 P+ cells was determined through investigation of the correlations between gene expression and DNA methylation. These findings offer new insights to facilitate the discovery of important therapeutic targets in the relevant mechanisms and suggest some potential biomarkers for the prevention/treatment of skin carcinogenesis. Of note, according to the RNA-seq and DNA Methyl-seq results, the mucin Muc2 was downregulated with hypermethylation in the promoter region in the TPA with MIC-1 group compared to the TPA group (Figure 7). However, the role of Muc2 in the protective effects of MIC-1 against TPA-induced neoplastic/tumorigenic transformation in mouse epidermal JB6 P+ cells has been poorly investigated. Bacterial debris and inflammatory cytokines have been reported to increase Muc2 gene expression in airway epithelial cells. In addition, mucus cell hyperplasia can be induced by IL-1β and TNF-α in mouse models, resulting in high Muc2 levels mediated by the NF-κB pathway [47, 48]. Moreover, grape seed proanthocyanidin has been shown to significantly decrease respiratory syncytial virus-induced Muc2 synthesis at the mRNA and protein levels [49]. These results indicate that the molecular mechanism of Muc2 in TPA-challenged JB6 P+ cells may be worth exploring. For most of the genes identified in our analyses, aberrant DNA methylation has not been previously reported with regards to skin carcinogenesis. For example, overexpression of the class III β-tubulin Tubb3 in clinical samples has been implicated in poor patient survival, tumor aggressiveness, and resistance to chemotherapeutic drugs [50, 51]. In our current study, TPA-upregulated gene expression was coupled with hypomethylation in Tubb3 promoter regions in JB6 P+ cells. Interestingly, it has been reported that 6-methoxy podophyllotoxin can reduce Tubb3 gene expression and subsequently induce cell death through apoptosis in the human bladder carcinoma cell line 5637 and the myelogenous leukemia cell line K562 [52]. Many other interesting genes were also identified in our investigation of correlations in this TPA-induced JB6 P+ cell model. Although further validation and comprehensive mechanistic studies are needed to draw the conclusion that these genes are involved in skin carcinogenesis and chemoprevention, our current study offers a novel list of targets obtained using unbiased genome-wide approaches.
In summary, this study demonstrates the chemopreventive effect of MIC-1 against TPA-induced neoplastic/tumorigenic transformation in mouse epidermal JB6 P+ cells. Using DNA SureSelect Methylseq and RNA-seq, we have provided a quantitative global profile of the methylome and transcriptome with and without MIC-1 treatment. Importantly, we have revealed that inflammatory pathways are upregulated but that Nrf2-mediated antioxidative and tumor suppressor pathways are downregulated by TPA, and we have also shown that MIC-1 effectively restores these pathways. A set of potential transcriptomic and epigenomic biomarkers has been observed in this process. These findings provide novel insights into how epigenetic modifications affect the progression of skin carcinogenesis and into the preventive effects of MIC-1.
Supplementary Material
Highlights.
TPA induced a significant alteration of differentially expressed genes and differentially methylated regions which can be partly reversed by MIC-1
Several anti-inflammatory responses, antioxidative stress-related pathways, and anticancer-related pathways were identified to be affected by MIC-1
Examination of correlations between transcriptomic and CpG methylome profiles yielded a small subset of genes
Our results show the potential contributions of epigenomic changes in DNA CpG methylation to gene expression to molecular pathways active in TPA-induced JB6 cells and demonstrate that MIC-1 can reverse these changes
Acknowledgments
This work is supported in part by R01 CA200129, from the National Cancer Institute to Dr. Ah-Ng Tony Kong. The authors thank all the members in Dr. Kong’s lab for their helpful discussion of this work.
Footnotes
Publisher's Disclaimer: This is a PDF file of an unedited manuscript that has been accepted for publication. As a service to our customers we are providing this early version of the manuscript. The manuscript will undergo copyediting, typesetting, and review of the resulting proof before it is published in its final citable form. Please note that during the production process errors may be discovered which could affect the content, and all legal disclaimers that apply to the journal pertain.
Conflict of interest statement
The authors declare no conflict of interest.
References
- [1].Alam M, Ratner D. Cutaneous squamous-cell carcinoma. N Engl J Med. 2001;344:975–83. [DOI] [PubMed] [Google Scholar]
- [2].Madan V, Lear JT, Szeimies RM. Non-melanoma skin cancer. Lancet. 2010;375:673–85. [DOI] [PubMed] [Google Scholar]
- [3].Balkwill F, Mantovani A. Inflammation and cancer: back to Virchow? Lancet. 2001;357:539–45. [DOI] [PubMed] [Google Scholar]
- [4].Coussens LM, Werb Z. Inflammation and cancer. Nature. 2002;420:860–7. [DOI] [PMC free article] [PubMed] [Google Scholar]
- [5].Fullana A, Garcia-Frias E, Martinez-Frias ML, Razquin S, Quero J. Caudal deficiency and asplenia anomalies in sibs. Am J Med Genet Suppl. 1986;2:23–9. [DOI] [PubMed] [Google Scholar]
- [6].Singh S, Vrishni S, Singh BK, Rahman I, Kakkar P. Nrf2-ARE stress response mechanism: a control point in oxidative stress-mediated dysfunctions and chronic inflammatory diseases. Free Radic Res. 2010;44:1267–88. [DOI] [PubMed] [Google Scholar]
- [7].Hu R, Saw CL, Yu R, Kong AN. Regulation of NF-E2-related factor 2 signaling for cancer chemoprevention: antioxidant coupled with antiinflammatory. Antioxid Redox Signal. 2010;13:1679–98. [DOI] [PMC free article] [PubMed] [Google Scholar]
- [8].Perl A, Hanczko R, Telarico T, Oaks Z, Landas S. Oxidative stress, inflammation and carcinogenesis are controlled through the pentose phosphate pathway by transaldolase. Trends Mol Med. 2011;17:395–403. [DOI] [PMC free article] [PubMed] [Google Scholar]
- [9].Nowsheen S, Aziz K, Kryston TB, Ferguson NF, Georgakilas A. The interplay between inflammation and oxidative stress in carcinogenesis. Curr Mol Med. 2012;12:672–80. [DOI] [PubMed] [Google Scholar]
- [10].van Doorn R, Gruis NA, Willemze R, van der Velden PA, Tensen CP. Aberrant DNA methylation in cutaneous malignancies. Semin Oncol. 2005;32:479–87. [DOI] [PubMed] [Google Scholar]
- [11].Bachman AN, Curtin GM, Doolittle DJ, Goodman JI. Altered methylation in gene-specific and GC-rich regions of DNA is progressive and nonrandom during promotion of skin tumorigenesis. Toxicol Sci. 2006;91:406–18. [DOI] [PubMed] [Google Scholar]
- [12].Millington GW. Epigenetics and dermatological disease. Pharmacogenomics. 2008;9:1835–50. [DOI] [PubMed] [Google Scholar]
- [13].Schinke C, Mo Y, Yu Y, Amiri K, Sosman J, Greally J, et al. Aberrant DNA methylation in malignant melanoma. Melanoma Res. 2010;20:253–65. [DOI] [PMC free article] [PubMed] [Google Scholar]
- [14].Davis CD, Uthus EO. DNA methylation, cancer susceptibility, and nutrient interactions. Exp Biol Med (Maywood). 2004;229:988–95. [DOI] [PubMed] [Google Scholar]
- [15].Fang M, Chen D, Yang CS. Dietary polyphenols may affect DNA methylation. J Nutr. 2007;137:223S–8S. [DOI] [PubMed] [Google Scholar]
- [16].Yang CS, Fang M, Lambert JD, Yan P, Huang TH. Reversal of hypermethylation and reactivation of genes by dietary polyphenolic compounds. Nutr Rev. 2008;66 Suppl 1:S18–20. [DOI] [PMC free article] [PubMed] [Google Scholar]
- [17].Su ZY, Zhang C, Lee JH, Shu L, Wu TY, Khor TO, et al. Requirement and epigenetics reprogramming of Nrf2 in suppression of tumor promoter TPA-induced mouse skin cell transformation by sulforaphane. Cancer Prev Res (Phila). 2014;7:319–29. [DOI] [PubMed] [Google Scholar]
- [18].Yang AY, Lee JH, Shu L, Zhang C, Su ZY, Lu Y, et al. Genome-wide analysis of DNA methylation in UVB- and DMBA/TPA-induced mouse skin cancer models. Life Sci. 2014;113:45–54. [DOI] [PMC free article] [PubMed] [Google Scholar]
- [19].Waterman C, Rojas-Silva P, Tumer TB, Kuhn P, Richard AJ, Wicks S, et al. Isothiocyanate-rich Moringa oleifera extract reduces weight gain, insulin resistance, and hepatic gluconeogenesis in mice. Molecular nutrition & food research. 2015;59:1013–24. [DOI] [PMC free article] [PubMed] [Google Scholar]
- [20].Zhou Y, Yang W, Li Z, Luo D, Li W, Zhang Y, et al. Moringa oleifera stem extract protect skin keratinocytes against oxidative stress injury by enhancement of antioxidant defense systems and activation of PPARalpha. Biomed Pharmacother. 2018;107:44–53. [DOI] [PubMed] [Google Scholar]
- [21].Jaja-Chimedza A, Graf BL, Simmler C, Kim Y, Kuhn P, Pauli GF, et al. Biochemical characterization and anti-inflammatory properties of an isothiocyanate-enriched moringa (Moringa oleifera) seed extract. PLoS One. 2017;12:e0182658. [DOI] [PMC free article] [PubMed] [Google Scholar]
- [22].Guo Y, Wu R, Gaspar JM, Sargsyan D, Su ZY, Zhang C, et al. DNA Methylome and Transcriptome Alterations and Cancer Prevention by Curcumin in Colitis-accelerated Colon Cancer in Mice. Carcinogenesis. 2018. [DOI] [PMC free article] [PubMed] [Google Scholar]
- [23].Colburn NH, Smith BM. Genes that cooperate with tumor promoters in transformation. J Cell Biochem. 1987;34:129–42. [DOI] [PubMed] [Google Scholar]
- [24].Colburn NH, Bruegge WF, Bates JR, Gray RH, Rossen JD, Kelsey WH, et al. Correlation of anchorage-independent growth with tumorigenicity of chemically transformed mouse epidermal cells. Cancer Res. 1978;38:624–34. [PubMed] [Google Scholar]
- [25].Bernstein LR, Colburn NH. AP1/jun function is differentially induced in promotion-sensitive and resistant JB6 cells. Science. 1989;244:566–9. [DOI] [PubMed] [Google Scholar]
- [26].Satyakala G, Jamil K. Chromium-induced biochemical changes in Eichhornia crassipes (Mart) solms and Pistia stratiotes L. Bull Environ Contam Toxicol. 1992;48:921–8. [DOI] [PubMed] [Google Scholar]
- [27].Hsu TC, Nair R, Tulsian P, Camalier CE, Hegamyer GA, Young MR, et al. Transformation nonresponsive cells owe their resistance to lack of p65/nuclear factor-kappaB activation. Cancer Res. 2001;61:4160–8. [PubMed] [Google Scholar]
- [28].Colburn NH, Wendel E, Srinivas L. Responses of preneoplastic epidermal cells to tumor promoters and growth factors: use of promoter-resistant variants for mechanism studies. J Cell Biochem. 1982;18:261–70. [DOI] [PubMed] [Google Scholar]
- [29].Colburn NH, Gindhart TD, Hegamyer GA, Blumberg PM, Delclos KB, Magun BE, et al. Phorbol diester and epidermal growth factor receptors in 12-O-tetradecanoylphorbol-13-acetate-resistant and -sensitive mouse epidermal cells. Cancer Res. 1982;42:3093–7. [PubMed] [Google Scholar]
- [30].Yang Y, Yang I, Cao M, Su ZY, Wu R, Guo Y, et al. Fucoxanthin Elicits Epigenetic Modifications, Nrf2 Activation and Blocking Transformation in Mouse Skin JB6 P+ Cells. The AAPS journal. 2018;20:32. [DOI] [PMC free article] [PubMed] [Google Scholar]
- [31].Guo Y, Wu R, Gaspar JM, Sargsyan D, Su ZY, Zhang C, et al. DNA methylome and transcriptome alterations and cancer prevention by curcumin in colitis-accelerated colon cancer in mice. Carcinogenesis. 2018;39:669–80. [DOI] [PMC free article] [PubMed] [Google Scholar]
- [32].Martin M (2011) Cutadapt removes adapter sequences from highthroughput sequencing reads. EMBnet, 17, 10–12. [Google Scholar]
- [33].Kim D, Langmead B, Salzberg SL. HISAT: a fast spliced aligner with low memory requirements. Nat Methods. 2015;12:357–60. [DOI] [PMC free article] [PubMed] [Google Scholar]
- [34].Liao Y, Smyth GK, Shi W. featureCounts: an efficient general purpose program for assigning sequence reads to genomic features. Bioinformatics. 2014;30:923–30. [DOI] [PubMed] [Google Scholar]
- [35].Wang L, Feng Z, Wang X, Wang X, Zhang X. DEGseq: an R package for identifying differentially expressed genes from RNA-seq data. Bioinformatics. 2010;26:136–8. [DOI] [PubMed] [Google Scholar]
- [36].Krueger F, Andrews SR. Bismark: a flexible aligner and methylation caller for Bisulfite-Seq applications. Bioinformatics. 2011;27:1571–2. [DOI] [PMC free article] [PubMed] [Google Scholar]
- [37].Gaspar JM, Hart RP. DMRfinder: efficiently identifying differentially methylated regions from MethylC-seq data. BMC Bioinformatics. 2017;18:528. [DOI] [PMC free article] [PubMed] [Google Scholar]
- [38].Yu G, Wang LG, He QY. ChIPseeker: an R/Bioconductor package for ChIP peak annotation, comparison and visualization. Bioinformatics. 2015;31:2382–3. [DOI] [PubMed] [Google Scholar]
- [39].Wang C, Sargsyan D, Zhang C, Wu R, Yang Y, Kong AN. Transcriptomic Analysis of Histone Methyltransferase Setd7 Knockdown and Phenethyl Isothiocyanate in Human Prostate Cancer Cells. Anticancer Res. 2018;38:6069–83. [DOI] [PubMed] [Google Scholar]
- [40].Ito N, Hirose M. Antioxidants--carcinogenic and chemopreventive properties. Adv Cancer Res. 1989;53:247–302. [DOI] [PubMed] [Google Scholar]
- [41].Pillai CK, Pillai KS. Antioxidants in health. Indian J Physiol Pharmacol. 2002;46:1–5. [PubMed] [Google Scholar]
- [42].Takahashi K, Heine UI, Junker JL, Colburn NH, Rice JM. Role of cytoskeleton changes and expression of the H-ras oncogene during promotion of neoplastic transformation in mouse epidermal JB6 cells. Cancer Res. 1986;46:5923–32. [PubMed] [Google Scholar]
- [43].Dhar A, Young MR, Colburn NH. The role of AP-1, NF-kappaB and ROS/NOS in skin carcinogenesis: the JB6 model is predictive. Mol Cell Biochem. 2002;234–235:185–93. [PubMed] [Google Scholar]
- [44].Truong VL, Kong AN, Jeong WS. Red Ginseng Oil Inhibits TPA-Induced Transformation of Skin Epidermal JB6 Cells. J Med Food. 2018;21:380–9. [DOI] [PubMed] [Google Scholar]
- [45].Feng R, Lu Y, Bowman LL, Qian Y, Castranova V, Ding M. Inhibition of activator protein-1, NF-kappaB, and MAPKs and induction of phase 2 detoxifying enzyme activity by chlorogenic acid. J Biol Chem. 2005;280:27888–95. [DOI] [PubMed] [Google Scholar]
- [46].Kong YH, Xu SP. Salidroside prevents skin carcinogenesis induced by DMBA/TPA in a mouse model through suppression of inflammation and promotion of apoptosis. Oncol Rep. 2018;39:2513–26. [DOI] [PMC free article] [PubMed] [Google Scholar]
- [47].Lora JM, Zhang DM, Liao SM, Burwell T, King AM, Barker PA, et al. Tumor necrosis factor-alpha triggers mucus production in airway epithelium through an IkappaB kinase beta-dependent mechanism. J Biol Chem. 2005;280:36510–7. [DOI] [PubMed] [Google Scholar]
- [48].Kao CY, Huang F, Chen Y, Thai P, Wachi S, Kim C, et al. Up-regulation of CC chemokine ligand 20 expression in human airway epithelium by IL-17 through a JAK-independent but MEK/NF-kappaB-dependent signaling pathway. J Immunol. 2005;175:6676–85. [DOI] [PubMed] [Google Scholar]
- [49].Lee JW, Kim YI, Im CN, Kim SW, Kim SJ, Min S, et al. Grape Seed Proanthocyanidin Inhibits Mucin Synthesis and Viral Replication by Suppression of AP-1 and NF-kappaB via p38 MAPKs/JNK Signaling Pathways in Respiratory Syncytial Virus-Infected A549 Cells. J Agric Food Chem. 2017;65:4472–83. [DOI] [PubMed] [Google Scholar]
- [50].Karki R, Mariani M, Andreoli M, He S, Scambia G, Shahabi S, et al. betaIII-Tubulin: biomarker of taxane resistance or drug target? Expert Opin Ther Targets. 2013;17:461–72. [DOI] [PubMed] [Google Scholar]
- [51].Ferrandina G, Zannoni GF, Martinelli E, Paglia A, Gallotta V, Mozzetti S, et al. Class III beta-tubulin overexpression is a marker of poor clinical outcome in advanced ovarian cancer patients. Clin Cancer Res. 2006;12:2774–9. [DOI] [PubMed] [Google Scholar]
- [52].Sadeghi I, Behmanesh M, Ahmadian Chashmi N, Sharifi M, Soltani BM. 6-Methoxy Podophyllotoxin Induces Apoptosis via Inhibition of TUBB3 and TOPIIA Gene Expressions in 5637 and K562 Cancer Cell Lines. Cell J. 2015;17:502–9. [DOI] [PMC free article] [PubMed] [Google Scholar]
Associated Data
This section collects any data citations, data availability statements, or supplementary materials included in this article.


