Abstract
Genotyping arrays characterize genome-wide SNPs for a study cohort and were the primary technology behind genome wide association studies over the last decade. The Cancer Genome Atlas (TCGA) is one of the largest cancer consortium studies, and it collected genotyping data for all of its participants. Using TCGA SNP data genotyped using the Affymetrix 6.0 SNP array from 12,064 samples, we conducted a comprehensive comparisons across DNA sources (tumor tissue, normal tissue, and blood) and sample storage protocols (formalin-fixed paraffin-embedded (FFPE) vs. freshly frozen (FF)), examining genotypes, transition/transversion ratios, and mutation catalogues. During the analysis, we made important observations in relevance to the data quality issues. SNP concordance was excellent between blood and normal tissues, and slightly lower between blood and tumor tissue due to potential somatic mutations in the tumors. The observed poor SNP concordance between FFPE and FF samples suggested a batch effect. The transition/transversion ratio, a metric commonly used for quality control purpose in exome sequencing projects, appeared less applicable for genotyping array data due to the whole-genome coverage built into the array design. Moreover, there were substantially more loss of heterozygosity events than gain of heterozygosity when comparing tumors relative to normal tissues and blood. This might be a consequence of extensive copy number deletions in tumors. In summary, our thorough evaluation calls for more adequate quality control practices and provides guidelines for improved application of TCGA genotyping data.
1. Introduction
Over the last two decades, researchers have started to interrogate the human genome in order to identify the relationship of particular single nucleotide polymorphism (SNP) with disease risk. High throughput genotyping arrays have been the most popular method for screening for genome-wide SNPs. Even after the introduction of high throughput sequencing, genotyping arrays remain a viable option for SNP detection [1]. Genotyping arrays have been utilized mostly in large-scale genome-wide association studies (GWAS). According to the GWAS catalog (December 2017 version), 2724 unique GWAS studies have been completed and published. The majority of the GWAS studies have been conducted with blood-derived DNA to assess disease risks brought through inherited germline SNPs. Few GWAS studies have been conducted using DNA derived from non-blood specimens, specifically, normal and tumor tissue samples. Both blood and normal tissues are considered germline and theoretically, they share an identical set of germline SNPs. This premise was challenged by Gottlieb et al. who found three SNPs in a tissue but not in blood [2], although some criticisms questioned the accuracy of the analysis [3]. The analysis we conducted also tried to answer if there are any reliable germline SNP differences between blood and normal tissue.
The Affymetrix Human Genotyping Array 6.0 (Affymetrix 6.0) was one of the most popular genome-wide genotyping arrays, containing > 906,600 SNPs. It was selected as the genotyping platform in the national cancer consortium: The Cancer Genome Atlas (TCGA). TCGA’s SNP data is unique, because genotyping was conducted for DNA samples originating from diverse sources, including tumor tissue, adjacent normal tissue, and blood. Based on the large amount of geno-typing data in TCGA, we designed a study to evaluate the genome-wide SNP concordance among tumor tissue, normal tissue, and blood. Such cross-tissue comparison studies have been performed for sequencing-based SNP data [4], and the observed SNP discordance between blood and normal tissue has been typically ascribed to sequencing errors. To our knowledge, a large-scale comparison of SNP data between blood and tissues has not yet been accomplished, where the artifacts of sequencing methods will not be present.
2. Methods
We downloaded level-2 Affymetrix 6.0 SNP data of 12,064 samples from 5840 patients in TCGA. The patients were of 12 major cancer types (BRCA, COAD, HNSC, LIHC, LUAD, LUSC, OV, PAAD, PRAD, READ, SKCM, STAD). All 5840 subjects possessed tumor genotyping data, whereas 4852 and 1193 subjects had blood data and normal tissue data, respectively. The exact sample distribution is illustrated in Fig. S1. Out of the 12,064 samples, 6019 were tumor tissues, 1193 were normal tissues and 4852 were blood. Out of the 6019 tumor tissue samples, the majority (93%) were from primary tumor sites, 380 were from metastatic sites, and 34 were from recurrent tumors. For simplicity, we treated all tumor tissue as equal. The vast majority (97%) of the tissue samples were fresh frozen (FF). To our surprise, out of the 227 formalin-fixed paraffin-embedded (FFPE) samples, 46 were labeled as blood-derived. Such annotations are perplexing and probably mistaken, because there is no established protocol to generate FFPE samples from blood. We suspect that these “blood FPPE” samples were normal tissues wrongly annotated as blood. This raises the question of whether the FF samples had similar annotation errors. Unfortunately, we did not have additional method to verify the annotation of the samples.
The level 2 SNP data were processed with Birdsuite [5] to generate PLINK [6] files for each sample. Each subject may encompass multiple samples: blood, normal control, and tumor. Thus, we computed the pairwise SNP inconsistency rates among the three DNA sources. Inconsistency rate is computed as the number of SNPs that have inconsistent SNPs divided by the total number of SNPs genotyped. All analyses were conducted on FF data only, except the analysis of FFPE vs. FF and FFPE vs FFPE comparisons. If a subject has multiple tumor samples (primary, recurrent and metastatic), data from primary was used. Throughout the analyses, we used 10% inconsistency rate to delimit outliers.
The transition vs. transversion ratio (Ti/Tv) was computed for each sample, or per subject between a pair of samples. Technically, the Ti/Tv ratio was calculated as the number of transition SNPs divided by the number of transversion SNPs. The applicability of Ti/Tv ratio as a quality control metric in array genotyping data was evaluated.
3. Results
We first assessed the SNP concordance across samples of distinct sources (tumor, normal, and blood) using FF samples (Tables S1, S2). By computing pairwise inconsistency rates, we immediately noticed peculiar highly inconsistent samples from same individuals, which may be indicative of a data quality issue. For example, subject TCGA-44–3918 in LUAD (Fig. 1) had an implausible genotype inconsistency rate of 34.4% between blood and tumor tissue, which implies that ~1/3 of the SNPs detected were different in blood vs. in tumor tissue for this subject. This result is highly dubious as SNP inconsistency is generally below 5% for different samples from a same individual. This suggests that the SNP data released by TCGA may benefit from extra quality control. Also for the same subject, the SNP inconsistency rate between tumor tissue and normal tissue was 36.2%, and the SNP inconsistency rate between blood and normal tissue was 1.31%. Based on the three way concordance discrepancies, we can safely deduce that there is a quality issue with the tumor SNP data for this individual. Furthermore, we also examined whether somatic mutation and copy number contributed to the poor quality of tumor SNP data. At rank number 30, with 1172 somatic mutations and at rank 86 with 233 copy number variants, subject TCGA-44–3918 is a candidate for hypermutation (Fig. S2. The hypermutation status could have contributed low SNP consistency. However, both hypermutation and low SNP consistency could have resulted from poor DNA quality.
Fig. 1.
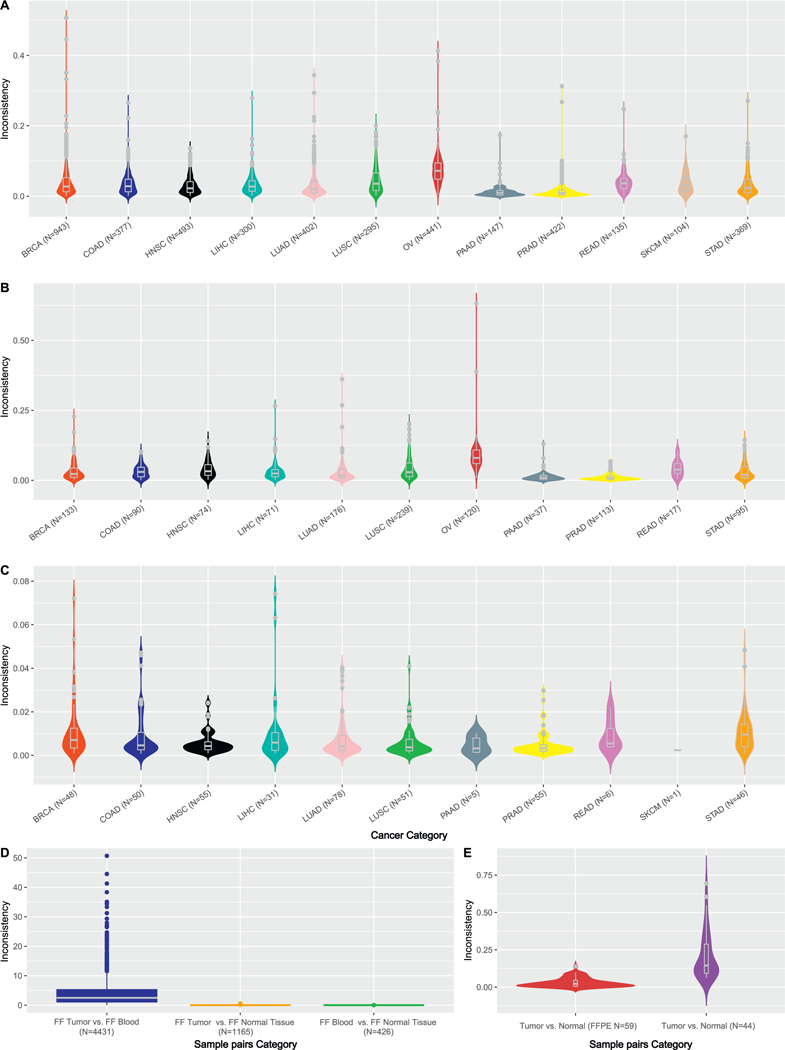
SNP inconsistencies are presented in this fig. A. SNP inconsistency rates between blood and tumor tissues by cancer type. Outliers (> 0.1) can be observed within each cancer type. B. SNP inconsistency rates between normal tissues and tumor tissues. SKCM does not contain any normal tissue, thus was not shown. C. SNP inconsistency rates between blood and normal tissue. The lowest inconsistencies were observed in this comparison, which can be explained by the germline characteristics of both blood and normal tissue. D. SNP inconsistency rates in three comparison scenarios (freshly frozen samples were used). E. SNP inconsistency rates for FFPE samples were entailed. When both samples in the pair were FFPE, lower inconsistency rates were observed. When one of the samples in the pair was FFPE, higher inconsistency rates were observed. This suggests potential batch effect during FFPE processing might have caused systematic errors.
For FF samples, the average inconsistency rate across all blood-tumor tissue pairs (N = 4428) was 3.72%. After removing 264 samples using 10% inconsistency as a cutoff threshold for outliers, the inconsistency rate decreased slightly to 3.10%. The average inconsistency rate across all normal-tumor tissue pairs (N = 1165) was 3.85%. After removing outliers, the inconsistency rate decreased to 2.98%. The average inconsistency rate across all blood-normal tissue pairs (N = 426) was 0.83%, and no outliers were detected in this comparison. The detailed distribution of SNP inconsistency rates for all comparisons using FF pairs by cancer type is presented in Fig. 1A–C. The inconsistency rates for blood-normal tissue pairs were significantly smaller than blood-tumor tissue pairs (t-test p = 7.8 × 10–90) and normal-tumor tissue pairs (t-test p = 1.1 × 10–44) (Fig. 1D). These results are intuitive as the SNP inconsistencies were lower for normal pairs (blood – normal tissue). Once tumor samples were included in the comparisons, the inconsistency rates inflated significantly.
Next, we turned our attention to FFPE samples (Fig. 1E). Two pairwise SNP inconsistency rates were computed: FFPE tumor tissue vs. FFPE normal tissue pairs, tumor vs. normal tissue pairs with one of samples in the pair being FFPE and the other being FF. Because the sample size for FFPE were severely limited, we merged FFPE samples across all cancer types for this analysis. The average inconsistency rate for FFPE tumor – FFPE normal tissue pairs (N = 59) was 3.10%. One pair was flagged as outlier with an inconsistency rate of 13.9%. The average inconsistency rate for FFPE tumor vs. FF normal tissue pairs (N = 44) was 20.8%, remarkably higher than the FFPE tumor tissue vs. FFPE normal tissue pairs (t-test p = 1.98 × 10⁻¹³). This result is intriguing because a lower SNP inconsistency was observed for FFPE vs. FFPE pairs than FFPE vs. FF pairs, challenging the common assumption that FFPE vs. FFPE pairs should bear higher disparity due to involvement of two FFPE samples. This phenomenon may imply that a protocol-relevant batch effect dominated TCGA genotyping data. In addition, the errors occurred in FFPE samples might be more homogenous, causing an overall lower inconsistency rate across FFPE vs. FFPE pairs.
By profiling tumor-derived DNA samples, genotyping arrays could have captured somatic mutations in addition to germline SNPs. However, due to array design limitation, detected somatic mutations were constrained to only two predefined alleles per SNP, which cannot guarantee to enclose the actual allele acquired in tumors. In such scenarios, the SNP will most likely be inferred as homozygous of the wild type allele, or no-call if the mutation rate is sufficiently high. A no-call is used to describe a SNP locus where the exact genotype cannot be determined using the genotyping array. Based on above reasoning, we speculated that there are more no-calls in tumor than in normal samples. Indeed, tumors had more no-calls than normal samples on average, 184 vs. 149, precisely. For almost all cancer types, the average number of no-calls was higher for tumor than normal (paired t-test p =.006) (Fig. 2). To test this, we computed overlap between no-calls and somatic mutations and found that there was virtually no overlap between them, thus disproving our original hypothesis.
Fig. 2.
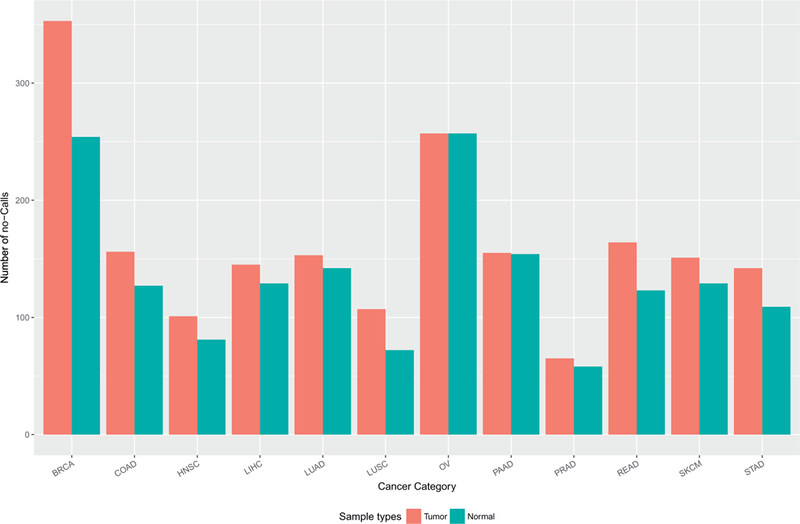
We observed higher number of no-calls for tumor than for normal samples (normal tissue and blood).
Next, we examined the effectiveness of the transition/transversion (Ti/Tv) ratio as a quality control measurement for the SNP arrays (Fig. 3A). The Ti/Tv ratio is computed per sample as the number of transition SNPs divided by the number of transversion SNPs. The Ti/Tv ratio has been frequently used as a signal for SNP data quality in sequencing projects. The normal range of Ti/Tv ratios for exome sequencing data is 2.0–3.0, and deviation from this range signals quality concerns [7, 8]. The Ti/Tv ratio has not been widely applied in geno-typing arrays. Thus, we took the opportunity to examine the validity of the Ti/Tv ratio as a quality control measurement for the genotyping arrays. For all samples across all 12 cancer types, the average Ti/Tv ratio was 2.20 (range: 2.09–2.37) (Fig. 3B). All 12 cancer types displayed similar Ti/Tv ratio distributions. We grouped samples into five categories by their tissue type and storage method (blood, FF tumor, FF normal tissue, FFPE tumor tissue, and FFPE normal tissue), and found no substantial difference among their median Ti/Tv ratios (Fig. 3C). In addition to computing the Ti/Tv ratio per sample, we also computed the Ti/Tv ratio for every pair of samples for which we computed an inconsistency rate (Fig. 4). In this scenario, the Ti/Tv ratio was computed as the number of transition changes divided by the number of transversion changes between the paired samples among three sources (blood, normal, and tumor). We evaluated whether there was any association between the Ti/Tv ratio and SNP inconsistencies using Spearman’s correlation. Weak correlation coefficients, specifically 0.43 (tumor vs. blood), 0.39 (tumor vs. normal), and 0.26 (blood vs. normal), were observed between Ti/Tv ratios and tumor vs. blood inconsistencies, tumor vs. normal tissue inconsistency and blood vs. normal tissue respectively (Fig. 4D, E, F).
Fig. 3.
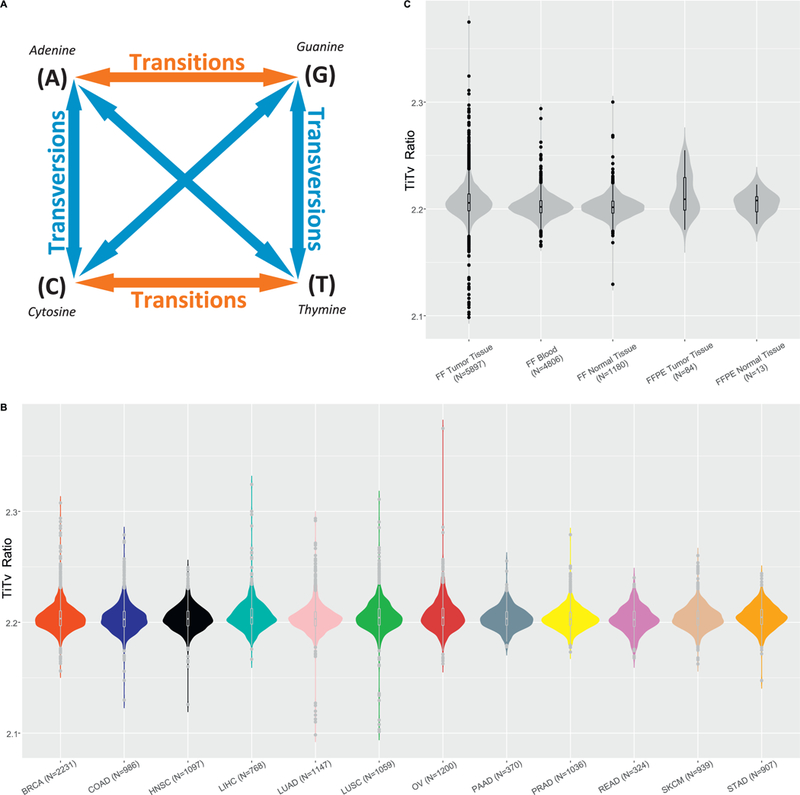
A. A diagram describing transition and transversion. The nucleotide substitutions alone the red arrows denote transition, the nucleotide substitution alone the blue arrows denotes transversion. If all substitutions are random, there should be twice the number of transversions than transitions. However, in reality, the number of transition is ~2–3 times more than transversion in the exome regions. B. Ti/Tv ratio per sample by cancer type. C. Ti/Tv ratio per sample by sample categories.
Fig. 4.
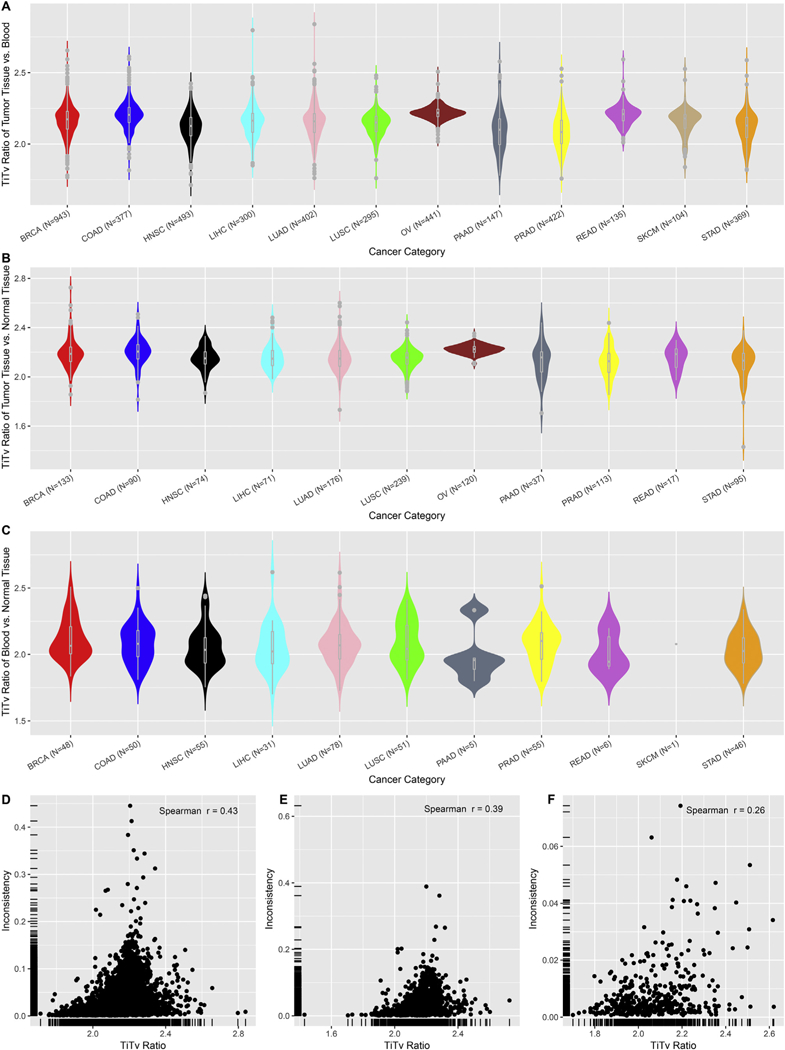
A. Ti/Tv ratio of nucleotide changes between tumor tissues vs. blood. B. Ti/Tv ratio of nucleotide changes between tumor tissues vs. normal tissues. C. Ti/Tv ratio of nucleotide changes between blood vs. normal tissue. D. Scatter plot of Ti/Tv ratio vs. inconsistency rate for tumor tissue vs. blood. E. Scatter plot of Ti/Tv ratio vs. inconsistency rate for tumor tissue vs. normal tissue. F. D. Scatter plot of Ti/Tv ratio vs. inconsistency rate for blood vs normal tissue.
The genotype changes between blood and tumor tissues can be classified as loss and gain of heterozygosity (LOH and GOH). There are 12 possible directional changes among the four nucleotides (A → T, A → C, A → G, T → A, T → C, T → G, C → A, C → T, C → G, G → A, G → T, and G → C). Alleles can be either gained or lost in tumorigenesis. Taking this opportunity, we studied LOH and GOH for the 12 types of cancers (Table S3). After quantifying LOH and GOH by cancer type and substitution type, we immediately noticed several phenomena. First, there were substantially more transitions than transversions (Fig. 5A, B), which is a reflection of the nature of the Ti/Tv ratio (Fig. 3) in another form. On average, each sample had 9618 GOH events and 24,740 LOH events (t-test p = 2.97 × 10⁻¹²) (Fig. 5C). The LOH and GOH rates per sample were the fractions of LOH/GOH events within all genotyped SNPs. On average, the LOH rate and GOH rate were 2.73% and 1.06% for tumor vs. blood comparisons. Similarly, for tumor vs. normal tissue, the average LOH rate and GOH rate were 2.78% and 1.08%, respectively. On the other hand, the LOH and GOH rates were comparable (0.42% vs. 0.40%) for blood vs. normal comparisons, which is in agreement with the overall good SNP consistency (Fig. 1C) within these germline samples.
Fig. 5.
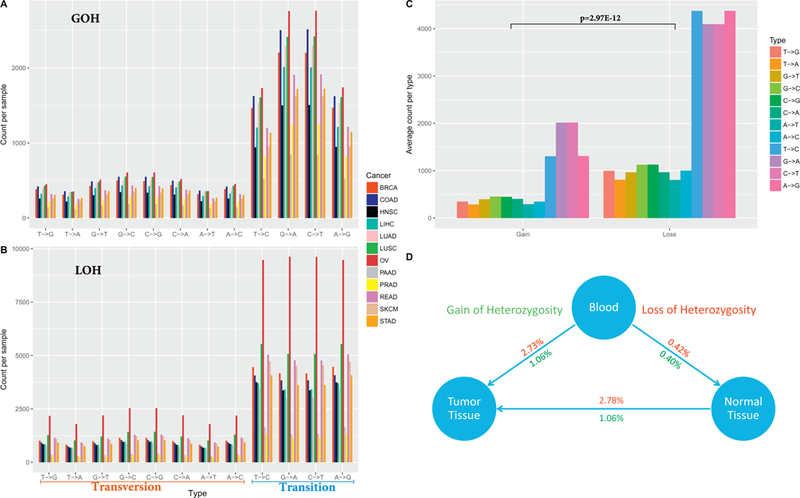
A. Count of GOH events by nucleotide change type. B. Count of LOH events by nucleotide change type. C. Average count of per GOH, LOH events per sample. D. Overall relation of LOH and GOH among the tissue types.
The intuitive expectation is that there would be more GOH changes from blood to tumor due to somatic mutations. The excessive LOH observed could be partially explained by the fact that genotyping array are not capable of capturing a large portion of the somatic mutations due to the predefined alleles of the array. Furthermore, we hypothesized that the excessive LOH events might be caused by more abundance of copy number deletions than amplifications in the tumors. To test this, we downloaded copy number data for all tumors of BRCA, and found that on average there were more amplifications than deletions (Fig. S3), which did not explain the excessive LOH events in the SNP data. Furthermore, we counted the number of LOH and GOH events from exome sequencing data of 10 BRCA blood-tumor pairs and found that on average there were more LOH events than GOH events, but at a lower magnitude (3273 GOH vs 3897 LOH) (Fig. S4). We suspect that there might be undiscovered mechanism that caused such disproportional LOH and GOH events in the SNP data.
4. Discussion
Hybridization-based genotyping arrays remain one of the primary methods to characterize SNPs genome-wide due to its affordability. The most popular genotyping arrays are designed and sold by two major companies: Affymetrix and Illumina. In this study, we examined the Affymetrix 6.0 array genotyping data generated from 12,064 samples. The samples can be divided into three groups by specimen origin: blood, normal tissue and tumor tissue.
The Affymetrix 6.0 array was designed for GWAS studies, which is commonly performed on blood-derived DNA samples. TCGA made a unique decision to genotype tumor samples in addition to the conventional blood samples. Tumor genotyping was frequently practiced as part of precision medicine to guide personalized treatment [9]. However, the common method for such practice is high throughput sequencing, which can detect all four possible nucleotides. The peculiar decision by TCGA to use a genotyping array with tumor DNA might serve the original purpose of evaluating tumor CNV. Nevertheless, the tumor genotyping data provided an excellent opportunity for thorough genome-wide comparison.
The foremost motivation of this study was to explore whether there are any SNP differences between blood and normal tissue. It has been demonstrated that the common inconsistency between duplicated genotyping samples is ~1–2% [10]. Our results revealed that the average SNP inconsistency was < 1% between blood and normal tissues in TCGA, below the presumed error rate. This implies the genotype between blood and normal tissue were very consistent. The slight inconsistency likely resulted from random genotyping errors or tumor contamination into the adjacent normal tissues.
FFPE is the most economical approach for longitudinal tissue specimen storage [11]. Upon isolation, DNA is more stable than RNA. However, DNA extracted from FFPE samples can suffer considerable damage introduced by formalin-fixation. Our evaluation of FFPE SNP consistencies uncovered an interesting phenomenon that the SNP inconsistencies for FFPE vs. FFPE pairs were good (~3.10%) but was unacceptably poor (~20.8%) for FFPE vs. FF pairs. This is somewhat in conflict with previous studies [12–16] that have found high SNP concordance between FFPE and FF samples. This finding suggests a systematic batch effects that was associated with a particular sample storage protocol and it may have dominant the errors on the arrays. In addition, it highlights the quality control issue we have observed in TCGA genotyping data. The lesson here is that we should always conduct thorough quality control no matter which protocol generates the data.
The quality issues and annotation errors observed in the TCGA genotyping data clearly demonstrated the importance of quality control on publically available data. Most of these errors cannot be fixed without original raw data and time-consuming reprocessing. However, stringent filter and meticulous quality control can ensure the integrity of downstream analyses such as allele-specific expression and quantitative trait loci.
Furthermore, we found that Ti/Tv is a less relevant quality control measurement for genotyping arrays compared to its use in exome sequencing. The Ti/Tv ratio varies by genomic region (e.g. exome vs intergenic) [8]. Many genotyping arrays are not constrained to exome regions, thus the Ti/Tv ratios were computed from SNPs in variant types of genomic locations, making the relationship between the Ti/Tv ratio and the overall SNP quality harder to assess. For example, in the Affymetrix 6.0 Array, only ~1% of the genotyped SNPs are exonic, ~37% are intronic, and ~57% are intergenic. Using the array manifest file, we found that the Ti/Tv ratio computed among the SNP compendium is 2.20, which is roughly the background of Ti/Tv ratio of all SNPs in the human genome. This explains the ineffectiveness of Ti/Tv ratio as a quality control measurement for genotyping arrays. Finally, we compared the LOH and GOH events across tumor and control tissues. We found that LOH was almost three times as common compared to GOH. We suspected this result could be influenced by the copy number deletion in tumors.
From a pure technical perspective, sequencing is applauded as the superior platform to microarrays for detecting SNPs. However, the cost of genotyping arrays and storage of genotyping data is about one order magnitude cheaper than for exome sequencing. Genotyping arrays allow a more accessible approach for conducting large-scale population genetic studies with a small degree of customization of the array content. Our evaluation of TCGA array genotyping data confirmed high consistency between normal and blood samples, found moderate concordance among FFPE samples, and called for improved quality control practices. Genotyping arrays will remain relevant in large-scale genome-wide association studies with no foreseeable end.
Supplementary Material
Acknowledgements
This research was supported by NCI Cancer Center grant 5P30CA118100.
Footnotes
Supplementary data to this article can be found online at https://doi.org/10.1016/j.ygeno.2018.06.001.
References
- [1].Zhao S, Jing W, Samuels DC, Sheng Q, Shyr Y, Guo Y, Strategies for processing and quality control of Illumina genotyping arrays, Brief. Bioinform. (2017). [DOI] [PMC free article] [PubMed] [Google Scholar]
- [2].Gottlieb B, Chalifour LE, Mitmaker B, Sheiner N, Obrand D, Abraham C, Meilleur M, Sugahara T, Bkaily G, Schweitzer M, BAK1 gene variation and abdominal aortic aneurysms, Hum. Mutat. 30 (7) (2009) 1043–1047. [DOI] [PubMed] [Google Scholar]
- [3].Kury S, Airaud F, Piloquet P, Bezieau S, BAK1 gene variation and abdominal aortic aneurysms—results may have been prematurely overrated, Hum. Mutat. 31 (10) (2010) 1174–1176 (author reply 1177–1178). [DOI] [PMC free article] [PubMed] [Google Scholar]
- [4].Guo Y, Zhao SL, Sheng QH, Samuels DC, Shyr Y, The discrepancy among single nucleotide variants detected by DNA and RNA high throughput sequencing data, BMC Genomics 18 (2017). [DOI] [PMC free article] [PubMed] [Google Scholar]
- [5].Korn JM, Kuruvilla FG, McCarroll SA, Wysoker A, Nemesh J, Cawley S, Hubbell E, Veitch J, Collins PJ, Darvishi K, et al. , Integrated genotype calling and association analysis of SNPs, common copy number polymorphisms and rare CNVs, Nat. Genet. 40 (10) (2008) 1253–1260. [DOI] [PMC free article] [PubMed] [Google Scholar]
- [6].Purcell S, Neale B, Todd-Brown K, Thomas L, Ferreira MAR, Bender D, Maller J, Sklar P, de Bakker PIW, Daly MJ, et al. , PLINK: a tool set for whole-genome association and population-based linkage analyses, Am. J. Hum. Genet. 81 (3) (2007) 559–575. [DOI] [PMC free article] [PubMed] [Google Scholar]
- [7].Guo Y, Long JR, He J, Li CI, Cai QY, Shu XO, Zheng W, Li C, Exome sequencing generates high quality data in non-target regions, BMC Genomics 13 (2012). [DOI] [PMC free article] [PubMed] [Google Scholar]
- [8].Wang J, Raskin L, Samuels DC, Shyr Y, Guo Y, Genome measures used for quality control are dependent on gene function and ancestry, Bioinformatics 31 (3) (2015) 318–323. [DOI] [PMC free article] [PubMed] [Google Scholar]
- [9].Vanderlaan PA, Yamaguchi N, Folch E, Boucher DH, Kent MS, Gangadharan SP, Majid A, Goldstein MA, Huberman MS, Kocher ON, et al. , Success and failure rates of tumor genotyping techniques in routine pathological samples with non-small-cell lung cancer, Lung Cancer 84 (1) (2014) 39–44. [DOI] [PMC free article] [PubMed] [Google Scholar]
- [10].Guo Y, He J, Zhao S, Wu H, Zhong X, Sheng Q, Samuels DC, Shyr Y, Long J, Illumina human exome genotyping array clustering and quality control, Nat. Protoc. 9 (11) (2014) 2643–2662. [DOI] [PMC free article] [PubMed] [Google Scholar]
- [11].Zhang P, Lehmann BD, Shyr Y, Guo Y, The utilization of formalin fixed-paraffin-embedded specimens in high throughput genomic studies, Int. J. Genom. 2017 (2017) 9. [DOI] [PMC free article] [PubMed] [Google Scholar]
- [12].Jacobs S, Thompson ER, Nannya Y, Yamamoto G, Pillai R, Ogawa S, Bailey DK, Campbell IG, Genome-wide, high-resolution detection of copy number, loss of heterozygosity, and genotypes from formalin-fixed, paraffin-embedded tumor tissue using microarrays, Cancer Res. 67 (6) (2007) 2544–2551. [DOI] [PubMed] [Google Scholar]
- [13].Lips EH, Dierssen JWF, van Eijk R, Oosting J, Eilers PH, Tollenaar RA, de Graaf EJ, van’t Slot R, Wijmenga C, Morreau H, Reliable high-throughput genotyping and loss-of-heterozygosity detection in formalin-fixed, paraffin-embedded tumors using single nucleotide polymorphism arrays, Cancer Res. 65 (22) (2005) 10188–10191. [DOI] [PubMed] [Google Scholar]
- [14].Thompson ER, Herbert SC, Forrest SM, Campbell IG, Whole genome SNP arrays using DNA derived from formalin-fixed, paraffin-embedded ovarian tumor tissue, Hum. Mutat. 26 (4) (2005) 384–389. [DOI] [PubMed] [Google Scholar]
- [15].Vos HI, van der Straaten T, Coenen MJ, Flucke U, te Loo DMW, Guchelaar HJ, High-quality genotyping data from formalin-fixed, paraffin-embedded tissue on the drug metabolizing enzymes and transporters plus array, J. Mol. Diag. 17 (1) (2015) 4–9. [DOI] [PubMed] [Google Scholar]
- [16].Wang Y, Carlton VE, Karlin-Neumann G, Sapolsky R, Zhang L, Moorhead M, Wang ZC, Richardson AL, Warren R, Walther A, High quality copy number and genotype data from FFPE samples using Molecular Inversion Probe (MIP) micro-arrays, BMC Med. Genet. 2 (1) (2009) 1. [DOI] [PMC free article] [PubMed] [Google Scholar]
Associated Data
This section collects any data citations, data availability statements, or supplementary materials included in this article.


