Abstract
Islet β‐cell membrane excitability is a well‐established regulator of mammalian insulin secretion, and defects in β‐cell excitability are linked to multiple forms of diabetes. Evolutionary conservation of islet excitability in lower organisms is largely unexplored. Here we show that adult zebrafish islet calcium levels rise in response to elevated extracellular [glucose], with similar concentration–response relationship to mammalian β‐cells. However, zebrafish islet calcium transients are nor well coupled, with a shallower glucose‐dependence of cytoplasmic calcium concentration. We have also generated transgenic zebrafish that conditionally express gain‐of‐function mutations in ATP‐sensitive K+ channels (KATP‐GOF) in β‐cells. Following induction, these fish become profoundly diabetic, paralleling features of mammalian diabetes resulting from equivalent mutations. KATP‐GOF fish become severely hyperglycemic, with slowed growth, and their islets lose glucose‐induced calcium responses. These results indicate that, although lacking tight cell‐cell coupling of intracellular Ca2+, adult zebrafish islets recapitulate similar excitability‐driven β‐cell glucose responsiveness to those in mammals, and exhibit profound susceptibility to diabetes as a result of inexcitability. While illustrating evolutionary conservation of islet excitability in lower vertebrates, these results also provide important validation of zebrafish as a suitable animal model in which to identify modulators of islet excitability and diabetes.
Keywords: Calcium channels, insulin secretion, KATP, metabolism, pancreas, zebrafish
Introduction
Electrical activity is the essential trigger of insulin secretion in mammalian β‐cells (Koster et al. 2006). At low plasma [glucose], ATP‐sensitive potassium (KATP) channels are open, hyperpolarizing the cell membrane and keeping voltage‐dependent calcium channels (VDCCs) closed, thereby inhibiting secretion. A rise in plasma glucose results in enhanced β‐cell glycolysis and oxidative phosphorylation, and increases the [ATP]/[ADP] ratio. This in turn results in closure of KATP channels and, because of electrical coupling via gap junctions (Benninger et al. 2008), uniform depolarization of the β‐cell syncytium and calcium influx through VDCCs, which triggers pulsatile insulin release. The essential role of this coupling is illustrated by the fact that gain‐of function mutations in KATP channels cause diabetes, whereas loss of channel function reciprocally causes hyperinsulinism and hypoglycemia (Remedi and Koster 2010).
KATP channel genes are not present outside the vertebrates, and the evolutionary extent and origins of excitability‐dependent insulin secretion, although well‐elucidated in mammals, has not been well‐studied even in lower vertebrates. This is important, both from an evolutionary perspective, and to provide novel insights to the process. We have recently shown that KATP channels are expressed in β‐cells within the zebrafish (Danio rerio) islet, that they are functionally similar to their mammalian orthologs, and that activation of these channels by the drug diazoxide can similarly alter glucose tolerance (Emfinger et al. 2017). Previous studies have suggested a role for KATP channels in early islet responses to overnutrition: activation of KATP, either pharmacologically or with inducible transgenes, increases β‐cell growth in response to excess nutrients (Li et al. 2014). However, direct assessment of zebrafish islet function is lacking, and whether alterations in excitability can drive persistent changes in glucose control in zebrafish, remains unknown. We recently showed that intracellular [Ca2+] is glucose‐sensitive in embryonic zebrafish islets (Lorincz et al. 2018). Here we characterize the glucose‐sensitivity of intracellular [Ca2+] in adult zebrafish islets, and show that it is similar to mammals, although unlike in mammalian islets (Bavamian et al. 2007), β‐cells appear to function as independent units, such that Ca2+ transients are not well‐coupled between β‐cells. We further show that transgenic expression of KATP‐GOF mutations blocks glucose‐dependent [Ca2+] elevations, resulting in severe hyperglycemia, paralleling the consequences of β‐cell inexcitability in mammals.
Methods
Ethical approval
All animal procedures were approved by the Washington University in St. Louis Instiutional Animal Care and Use Committee.
Generation of transgenic fish
Cytosolic gCAMP6s expression in zebrafish islet β‐cells was achieved using constructs optimized for tol2‐transposase insertion (Kwan et al. 2007). The construct was generated using gateway recombination of plasmids containing the promoter, gCAMP6s cDNA, and poly‐A stop sequence (sequence for the Tg(‐1.0ins:gCAMP6s)stl441 transgenic fish (cgCAMP6s fish). Constructs for generating fish which conditionally express gain‐of‐function KATP channels only in islets (Tg(‐1.0ins:LoxP_mCherry_polyA_LoxP,Kir6.2(K185Q,ΔN30)‐GFP)stl443, Fig. 5A) were created as per the insulin‐gCAMP6s vector. The mutant Kir6.2 subunit gene was cloned from an existing vector containing a gain‐of‐function mutation in the subunit (Kir6.2(K185Q,ΔN30)‐GFP) (Koster et al. 2000).
For each of the constructs above, transgenic fish were created as follows: 2 nL of injection solution containing 25 ng/μL of construct and 25 ng/μL of Tol2 transposase RNA were injected into AB zebrafish embryos at the single‐cell stage. The pDestTol2CG2 vector contains eGFP expressed under the cardiac myosin light‐chain promoter as a transgenesis marker, permitting detection of subsequent founders by visible green fluorescence in the heart. For heat shock induction in larvae, larvae were placed in 20 mL glass scintillation vials at 40–70 larvae/vial and heated at 37°C from day 1–5 pf in a water bath for 3 h/day. For adult induction, fish were transferred to glass beakers (7 fish/500 mL) with air stones and placed in a 37°C water bath for 3 hr/day for 2–10 days.
Animal lines and maintenance
In addition to the transgenic lines above, we used AB wild‐type fish as well as previously described β‐cell‐specific eGFP‐expressing fish (Tg(−1.0ins:eGFP)sc1) (Moss et al. 2009), membrane‐tethered insulin promoter‐driven gCAMP6s fish (Tg(ins:lynGCaMP6s,ins:H2B:RFP) (Kimmel and Meyer 2016), and ubiquitin‐gCAMP6s fish (Chen et al. 2017). All fish lines were housed in the Washington University Zebrafish Facility under standard conditions, the details of which can be found at: http://zebrafishfacility.wustl.edu/documents.html.
Gene expression analyses
RNA and cDNA were prepared using Qiagen RNeasy mini kit and ThermoFisher High‐Capacity cDNA reverse transcription kit respectively. Previously described protocols were used to isolate islet (Emfinger et al. 2017) and brain (Lopez‐Ramirez et al. 2016) tissues. Heart tissue was collected with forceps. PCR was performed with previously published primers for connexin 35b (Carlisle and Ribera 2014).
Western blot protein detection
Zebrafish islets and brain were homogenized in cell lysis buffer (CST, MA) containing complete protease inhibitors (Roche Applied Science, Mannheim, Germany). 25 μg of total protein lysate was loaded per lane. Blots were incubated overnight with the following antibodies: GAPDH (1:1000, CST, MA), Connexin 35 (1:250, #MAB3045, EMD Millipore, MO). Blots were washed and probed with RDye infrared fluorescent dye‐labeled secondary antibody conjugates (1:10,000; LI‐COR biotechnology). Fluorescence intensity was quantified by image studio Lite (LI‐COR biotechnology).
Electrophysiological analyses
Islets were harvested and dispersed into individual β‐cells as described (Emfinger et al. 2017). Ca2+ currents were recorded in whole‐cell patch‐clamp mode. The extracellular solution contained (in mmol/L): NaCl 137, CsCl 5.4, CaCl2 1.8, MgCl2 0.5, Glucose 10, HEPES 5, NaHCO3 3, NaH2PO4 0.16 (pH 7.4). The patch pipette was filled with a solution containing (in mmol/L) CsCl 130, TEA‐Cl 20, MgCl2 1, CaCl2 0.5, K2ATP 3, EGTA 5, HEPES 10 (pH 7.4). The resistance of the pipettes was 2–3 MΩ. KATP currents were also recorded in whole‐cell patch‐clamp mode. The extracellular solution contained (in mmol/L): NaCl 137, CsCl 5.4, CaCl2 1.8, MgCl2 0.5, Glucose 10, HEPES 5, NaHCO3 3, NaH2PO4 0.16 (pH 7.4). The patch pipette was filled with a solution containing (in mmol/L) CsCl 130, TEA‐Cl 20, MgCl2 1, CaCl2 0.5, K2ATP 3, EGTA 5, HEPES 10 (pH 7.4). Whole‐cell voltage clamp recordings of K currents and excised inside‐out patch‐clamp recording of KATP currents was also carried out as previously described (Emfinger et al. 2017). In all experiments, pipette resistance was typically 2–3 MΩ, data were filtered at 1 kHz and recorded at 3 kHz. Current records were analysed using pClamp.
Ex‐vivo microscopy of adult zebrafish islet calcium
Islets were isolated as described (Emfinger et al. 2017). Glass‐bottomed 35 mmol/L dishes (MatTeK) were coated with 1% agarose, and glass pipette tips were used to remove a section of agarose at the plate center, creating a well. Individual islets were transferred to wells and immersed in pH 7.4 Krebs Ringer's solution buffered with HEPES (KRBH) containing 2 mmol/L glucose. The KRBH base solution consisted of (in mmol/L): NaCl 114, KCl 4.7, MgSO4 1.16, KH2PO4 1.2, CaCl2 2.5, NaHCO3 5, and HEPES 20, with 0.1% BSA. Solutions of varying glucose concentrations were flowed into the plate chamber through lines running into and out of the chamber (Fig. 2A). Bulk islet data were captured using a Zeiss Axiovert 200M microscope equipped with a Lambda DG‐4 illumination system and EM‐CCD camera and a Till photonics microscope with PolyChrome V monochromator and cooled CCD camera in the CIMED Live Cell Imaging Core (https://research.wustl.edu/core-facilities/cmed-live-cell-imaging-core/). Time lapse images used 100 msec exposure at an interval of 500 msec. For single‐cell comparisons, high resolution images were captured using a Nikon Spinning Disk confocal microscope (a motorized Nikon Ti‐E scope equipped with PerfectFocus, a Yokagawa CSU‐X1 variable speed Nipkow spinning disk scan head, and Andor Zyla 4.2 Megapixel sCMOS camera) at the Washington University Center for Cellular Imaging (http://wucci.wustl.edu/). Images of ubiquitin‐gCAMP6s fish islets were collected on a Zeiss LSM 880 Airyscan confocal microscope equipped with two non‐descanned detectors for two‐photon imaging, also at the Washington University Center for Cellular Imaging. Time‐lapse images used 100 msec exposure at 1 sec intervals. All images were analyzed in Fiji (Schindelin et al. 2012). To correct for movement in x‐ and y‐planes, images were stack registered (using StackReg, rigid body) in Fiji before analysis. All calcium image data are presented as change in fluorescence intensity relative to baseline fluorescence intensity. Because the maximum excitability of an islet or β‐cell can vary, and the intensity of islet fluorescence can vary, glucose responses are shown normalized to the change in fluorescence in response to KCl (showing maximum excitability due to islet depolarization). For determining trace cross‐correlation and synchronicity, ROI measurements were analyzed using PeakCaller in MATLAB (Artimovich et al. 2017). The KCl response was excluded from segments in which cross‐correlation analysis was performed, to capture the responses to glucose only.
Chemicals
All salts, amino acids, and other compounds were purchased from Sigma, except where indicated above.
Statistics
Statistical analyses were made in GraphPad prism. Except as noted, each data set was tested for deviation from normal distribution (D'Agostino‐Pearson). For multiple group column data comparisons, data were analyzed by ANOVA, followed by Tukey's post‐tests where normality assumptions were met. In comparisons of two groups, Student's T test with Welch's correction was used. In cases of non‐normal distributions, the Kruskal–Wallis (more than two groups) or Mann–Whitney (two groups) tests were used. All values are indicated as mean ± SEM, except where noted. For dose–response curves, data were fitted using nonlinear regression.
Results
Zebrafish islets express l‐type calcium channels
The fish genome contains orthologs of the calcium channels found in mammalian islets, and RNA encoding these channels is present in islets (Sidi et al. 2004; Zhou et al. 2008; Sanhueza et al. 2009; Tarifeño‐Saldivia et al. 2017), but functional demonstration of Ca2+ channels in fish islet cells is lacking. Whole‐cell voltage‐clamp recordings from isolated zebrafish β‐cells reveal nifedipine‐sensitive l‐type calcium currents (Kuryshev et al. 2014; Striessnig et al. 2015) (Fig. 1A), with current/voltage profiles (Fig. 1B) very similar to those of mammalian l‐type calcium currents (Lipscombe 2002; Mangoni et al. 2006), the observed major VDCCs in mammalian islets. The zebrafish pancreas develops from the endodermal germ layer comprising endocrine and exocrine tissue and is conserved from mammals to fish. An early ‘primary’ islet forms within the first day of development (Argenton et al. 1999; Biemar et al. 2001), and additional smaller duct‐related “secondary” islets form as development progresses (Chen et al. 2007; Parsons et al. 2009). Similar currents were identified in both primary islet and secondary islet cells (Fig. 1B).
Figure 1.
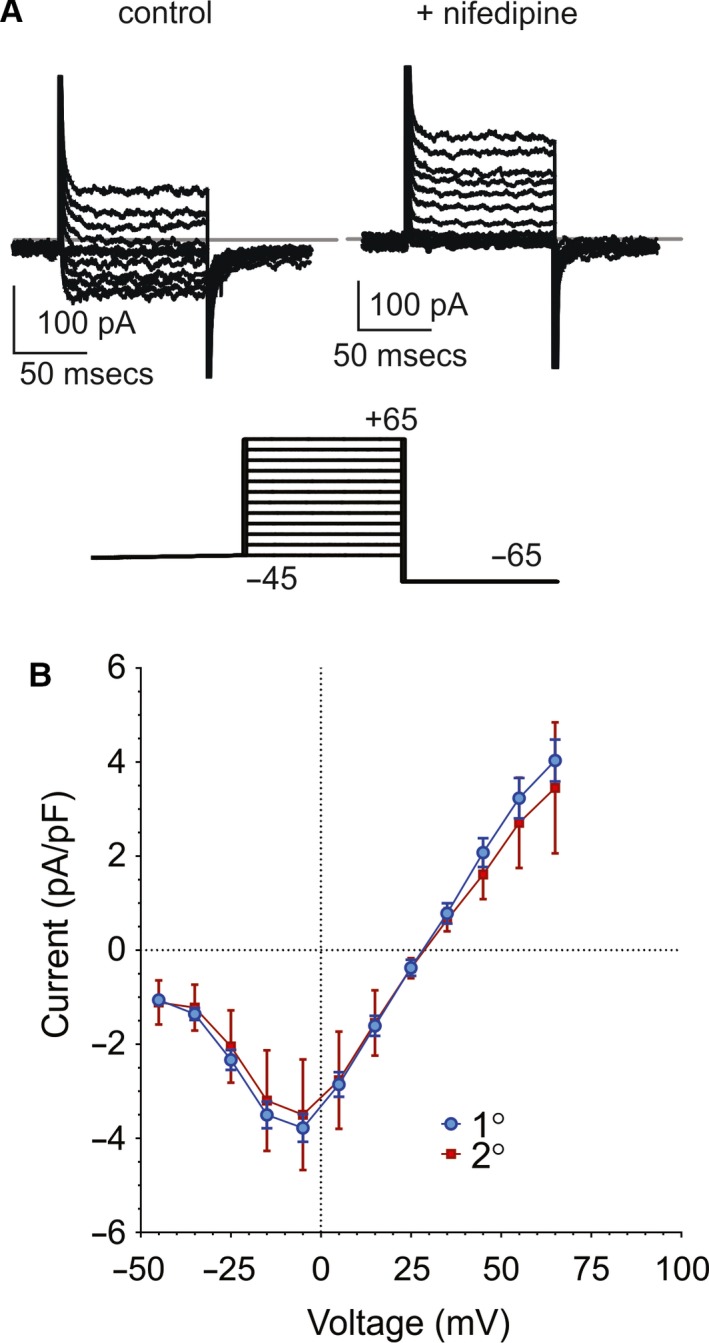
l‐type Ca currents in zebrafish β‐cells. (A) Representative recordings of whole‐cell Ca2+ currents (top) in response to voltage steps (bottom) from −45 mV holding potential to −45 to + 65mV are inhibited by (10 μmol/L) nifedipine (right). Gray line in upper panels indicates 0 pA. (B) Summary of current–voltage relationship for calcium currents in isolated zebrafish β‐cells (14 total primary (1°) and 2 secondary (2°) islet cells).
Adult Zebrafish islet calcium is glucose responsive
To probe intracellular calcium levels and potential responsivity to glucose in zebrafish β‐cells, we generated Tg (‐1.0ins:gCAMP6s)stl441 fish expressing cytosolic gCAMP6s driven by the zebrafish insulin promoter. Ex vivo isolated islets from these cGCAMP6s fish show co‐localization of cGCAMP6s fluorescence and insulin staining (Fig. 2A). Figure 2B shows representative snapshot images and timecourses of cGCAMP6s fluorescence in the presence of low glucose and after switch to high (20 mmol/L) glucose, and then after addition of KCl. The response is specific to metabolizable d‐glucose, since there was no response to 20 mmol/L l‐glucose (Fig. 2C and D), and is sensitive to diazoxide (Fig. 2C and D), indicating that it involves closure of KATP channels (see below). The sigmoidal [glucose]‐dependence (Fig. 3A), obtained from similar experiments with switches to intermediate [glucose], is similar to that seen in mammalian islets, with EC50 of ~10 mmol/L glucose, slightly higher than the typically reported 5–9 mmol/L for mouse and rat (Antunes et al. 2000), or human (Henquin et al. 2006) islets. Consistent with the nifedipine sensitivity of calcium currents, the glucose‐induced calcium responses are abolished by the addition of 10 μmol/L nifedipine (Fig. 3B and C). In contrast to mammalian islets (Henquin et al. 2006; Liu et al. 2008) and embryonic zebrafish islets (Lorincz et al. 2018), the amino acids glutamine, alanine, and leucine caused no activation in the presence of threshold (8 mmol/L) glucose (Fig. 3D). Finally, islets did not show any response to sucrose (Fig. 3E, representative trace), which further indicates a specific response to metabolizable glucose and not to osmotic shock or other stress from the added sugars.
Figure 2.
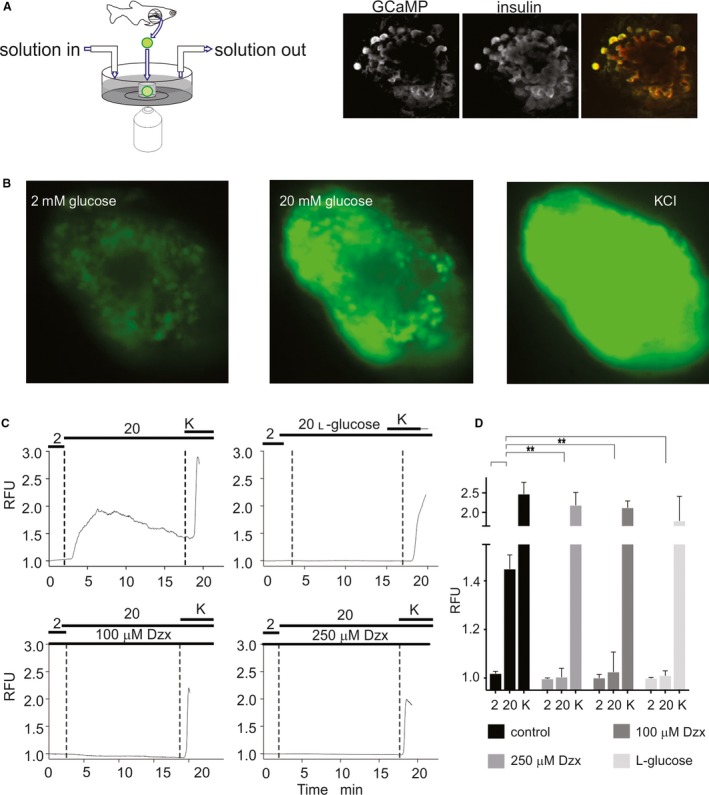
Intracellular [Ca2+] in adult islets is glucose‐sensitive. (A, left) Islets were imaged in microchambers (~4 μL) cored out of agar, on the bottom of a petri dish. Flow of bulk solution into and out of the dish (~1 mL) was controlled as indicated. (right) GCaMP fluorescence and anti‐insulin staining in representative islet, together with overlay (GCamp fluorescence green, anti‐insulin red). (B) Individual frames of islets at low (2 mmol/L) and high (20 mmol/L) glucose (middle), and in 20 mmol/L glucose plus 30 mmol/L KCl (right). (C) Representative fluorescence traces from individual islets, normalized to initial fluorescence (relative fluorescence units, RFU), during transitions from low glucose to 20 mmol/L d‐ or l‐glucose, and 20 mmol/L glucose plus 30 mmol/L KCl, in absence or presence of diazoxide, as indicated. (D) Summary of calcium responses to high 2 or 20 mmol/L d‐ or l‐glucose, or 20 glucose plus 30 mmol/L KCl, in absence or presence of diazoxide, as indicated from experiments as in C (N = 6–10 in each case). (**) P < 0.05.
Figure 3.
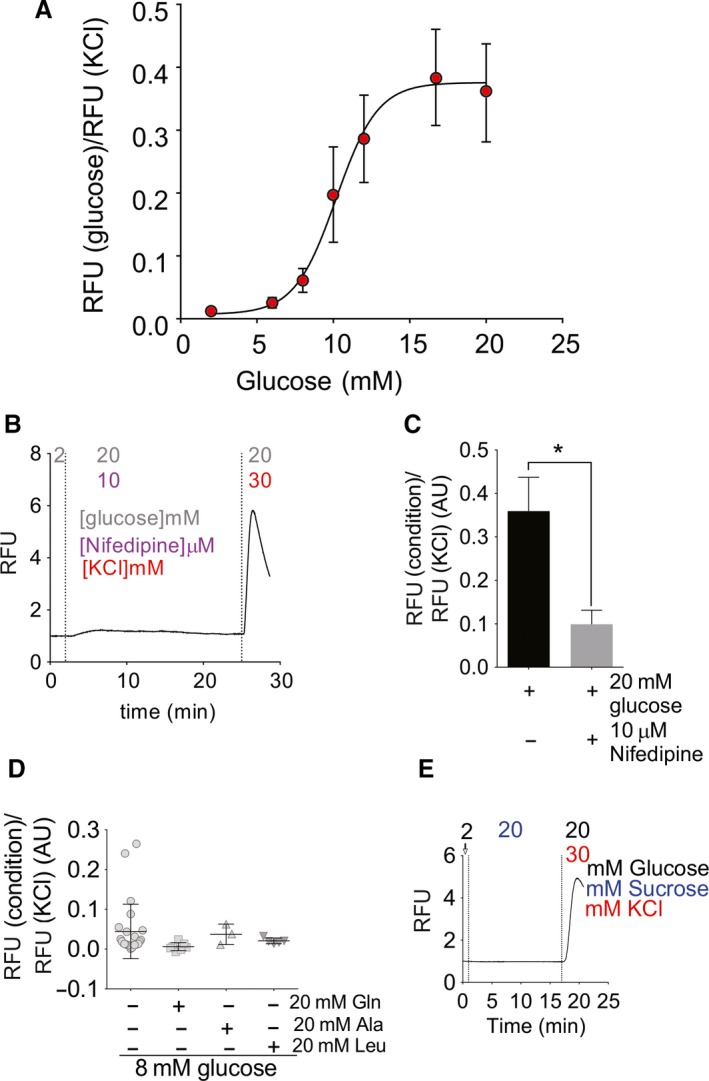
Glucose‐ and amino acid‐sensitivity of intracellular [Ca2+]. (A) Summary of [glucose]‐GCamp fluorescence response relationship from experiments as in Figure 1, with peak fluorescence at the indicated glucose concentrations normalized to the maximum fluorescence elicited by KCl depolarization (N = 8–17 islets/concentration). (B) Representative trace showing islet treated with 20 mmol/L glucose in presence of 10 μmol/L nifedipine. (C) Summary of calcium responses to high (20 mmol/L) glucose in absence (N = 8) or presence of nifedipine (N = 10). (*) P < 0.05. (D) Calcium responses to 8 mmol/L glucose in absence or presence of additional amino acids (normalized to maximum fluorescence in KCl. (E) Representative trace for islet calcium responses to sucrose (20 mmol/L).
Ca2+ transients are not well‐coupled between β‐cells in adult Zebrafish islets
In mammals, individual β‐cells vary in their expression of metabolite transporters, metabolic enzymes, and ion channels involved in the insulin secretion response, and thus exhibit variable sensitivities to glucose (Benninger et al. 2014; Silva et al. 2014). However, in intact islets, gap‐junction coupling between β‐cells ensures synchronous electrical and calcium signals, and hence secretory responses, across the islet (Farnsworth and Benninger 2014). In contrast to mammals, uncorrelated gCAMP6s fluorescence oscillations were observed in individual β‐cells within the zebrafish islet. In high‐resolution confocal images (Fig. 4A), individual cells clearly become active at very different glucose levels. Even cells that are physically close together lack synchronicity in their calcium spikes and glucose sensitivity (Fig. 4B), evidenced by very weak correlation coefficients between signals from individual cells (Fig. 4C). This is in stark contrast to the strong cell‐cell correlation in isolated mouse islets under comparable conditions (Kenty and Melton 2015; Johnston Natalie et al. 2016).
Figure 4.
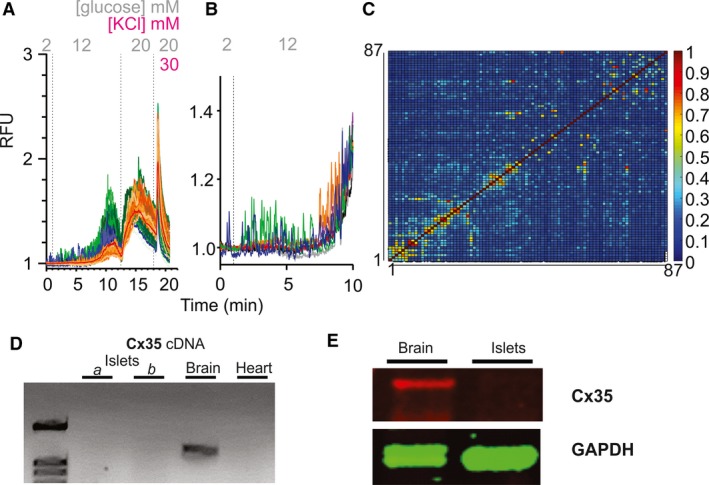
Ca2+ transients are not well‐coupled between β‐cells in Zebrafish islets. (A) Fluorescence response to switch from 2, to 12, to 20 mmol/L glucose and then KCl. Individual ROI traces are shown for 87 tracked cells from a representative islet, plus averaged trace from the whole islet (red). Some cells (blue) were active at basal (2 mmol/L) glucose. Others activated at 12 mmol/L glucose (green) or only at 20 mmol/L glucose (orange). (B) Representative individual traces from the early 12 mmol/L transition from islet in (A). (C) Cross‐correlation matrix (determined by PeakCaller) of all 87 tracked cells in (A). (D) Representative PCR of Cx35b cDNAs from islets, brains, and hearts of zebrafish. Sets a and b are different pools of islets (biological replicates). (E) Western blot analysis of zebrafish Cx35 protein. Cx35 is detected in zebrafish brain but not in zebrafish islets.
Connexin 36 is the primary gap junction protein in mammalian islets (Farnsworth and Benninger 2014). Connexin 35b is the major ortholog of mouse connexin 36 in fish (Jabeen and Thirumalai 2013; Carlisle and Ribera 2014; Watanabe 2017). It has been well‐characterized in zebrafish brain (Jabeen and Thirumalai 2013; Carlisle and Ribera 2014), and both cDNA (Fig. 4D) and protein (Fig. 4E) were readily detected in brain, but not in zebrafish islets or heart.
Islets expressing KATP‐GOF are inexcitable, resulting in profound diabetes
In mammals, excitability is dramatically suppressed by gain‐of‐function mutations in KATP channels, resulting in profound neonatal diabetes (Koster et al. 2000; Gloyn et al. 2004). To examine susceptibility of zebrafish glycemia to β‐cell membrane excitability, we generated additional transgenic fish (Tg(‐1.0ins:LoxP_mCherry_polyA_LoxP,Kir6.2(K185Q,∆N30)‐GFP)stl443, KATP‐fish) which conditionally express the same GFP‐tagged gain‐of‐function Kir6.2 subunit that has been extensively used to demonstrate and study neonatal diabetes in mice (Koster et al. 2000) and previously shown to increase glucose levels in zebrafish larvae (Li et al. 2014). We crossed these KATP‐fish to zebrafish expressing HSP‐16 inducible Cre‐recombinase, to generate KATP‐GOF animals which express the KATP‐GOF transgene only in β‐cells, following heat shock induction (schematic in Fig. 5A). Robust transgene expression is evident in double transgenic β‐cells after 5‐days heat‐shock (by visualizing tagged GFP, Fig. 5B).
Figure 5.
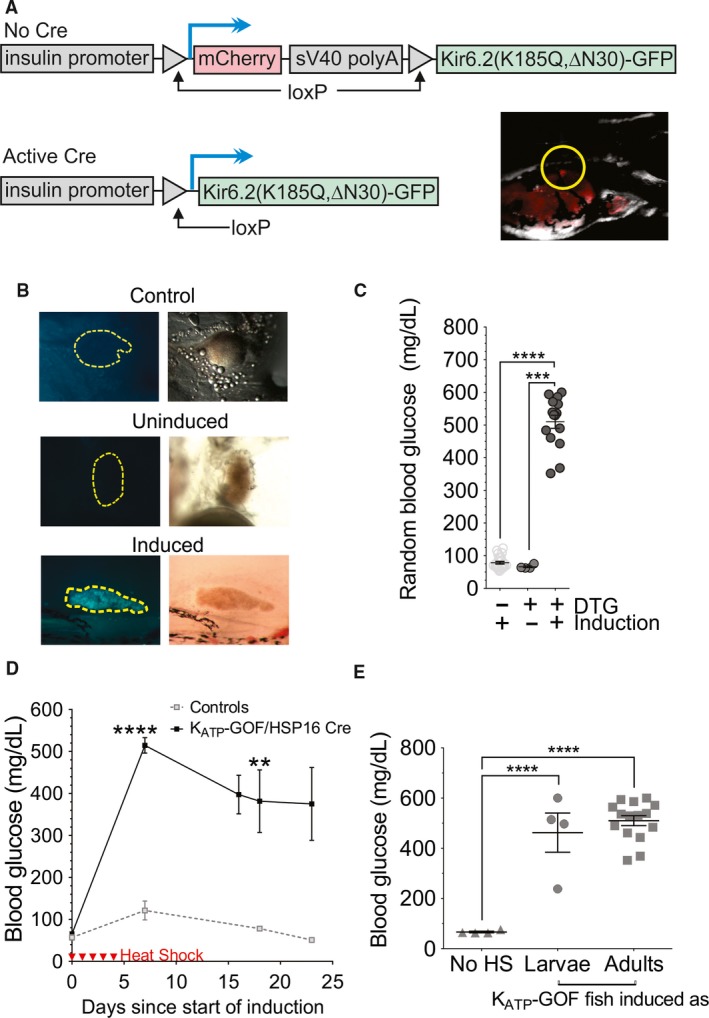
Islet KATP‐GOF results in profound diabetes. (A) Transgenic strategy for conditional KATP‐GOF expression in zebrafish islet. mCherry, expressed under insulin promoter control (upper panel), is excised and KATP‐GOF construct is expressed, after (lower left panel) Cre recombination. A F2 larva is shown in the right lower panel, with the islet highlighted in the yellow circle. (B) GFP (left column) and bright‐field (right column) images of dissected islets from adult control, uninduced KATP‐GOF and induced KATP‐GOF fish (images taken at 12 × ). (C) Random blood glucose levels in controls (N = 25), uninduced (N = 15), and induced (5 days heat‐shock, N = 24) KATP‐GOF zebrafish. In control and induced fish, blood glucose were measured 2 days after the last heat shock. (D) Time course of change in blood glucose following KATP‐GOF induction. (E) Glucose levels in adult (10 week old) KATP‐GOF fish are similarly elevated, whether induced as larvae (N = 4), or as adults (N = 15).
Following 5 days of heat shock induction, blood glucose was unaltered in non‐GOF control or single transgenic fish/islets (Fig. 5C), but KATP‐GOF fish rapidly developed severe hyperglycemia (>600 mg/dL), and this was then maintained >400 mg/dL for weeks (Fig. 5D). When the transgene was activated at the larval stage, glucose levels in adult fish were similar to those resulting from adult induction (Fig. 5E)
Excised inside‐out patch‐clamp experiments (Fig. 6A) confirm that, in fluorescent cells, the KATP‐GOF transgene was incorporated into β‐cell KATP channels, resulting in the expected loss of ATP‐sensitivity (Fig. 6B). Even though overall channel density was if anything reduced (excised patch current in zero ATP was 51.8 ± 7.4 pA in control, n = 4, c.f. 9.6 ± 2.4 pA in KATP‐GOF, n = 4), whole‐cell voltage‐clamp currents (Fig. 6C) show that, under basal conditions following break‐in, voltage‐gated K currents were unaffected in KATP‐GOF islets, but KATP currents were already basally activated (Fig. 6C and D). To examine the consequences for glucose‐dependent Ca‐handling, we crossed KATP‐GOF fish to cGCAMP6s fish. Isolated islets from heat‐shock induced KATP‐GOF fish show essentially no glucose‐induced calcium responses, even at high (20 mmol/L) glucose levels, although they still respond appropriately to direct depolarization by 30 mmol/L KCl (Fig. 7A and B). These results are consistent with KATP‐GOF inhibiting electrical activity at high [glucose] by hyperpolarizing cells, an effect that is overcome by direct KCl‐induced depolarization.
Figure 6.
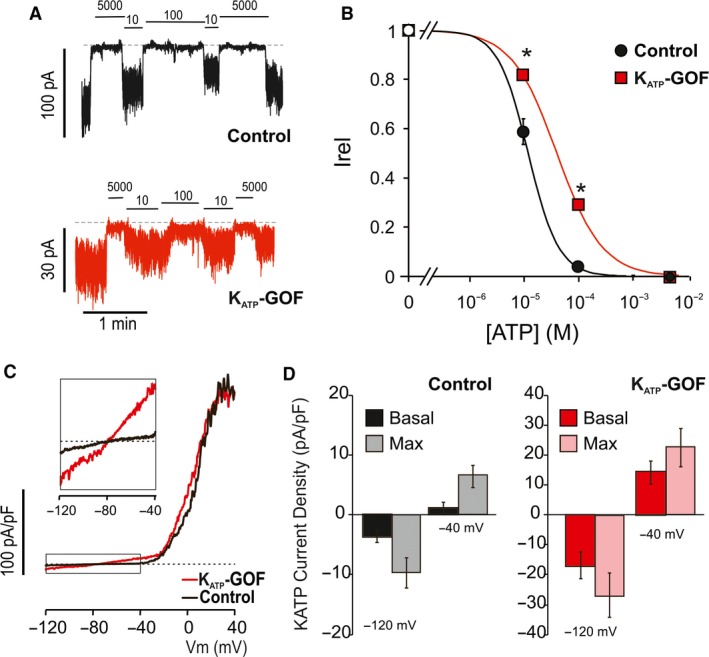
Islet KATP‐GOF expression results in basal KATP and ATP‐insensitive channels. (A) Representative excised inside‐out patch‐clamp recordings (at −50 mV) from β‐cells isolated from control (black) or KATP‐GOF (red) islets, in the presence of ATP at concentrations (in micromolar) as indicated. (B) Steady‐state dependence of membrane current on [ATP] (relative to current in zero ATP (Irel)) for control and KATP‐GOF channels. Data points represent the mean ± SEM. (n = 4 patches in each case). The fitted lines correspond to least squares fits of a Hill equation (see Methods). (*) P < 0.01 compared to wild‐type KATP (controls) by unpaired Student's t test. (C) In whole‐cell mode basal conditions, voltage‐clamp ramps from −120 to −40 mV (over 1 sec) activates similar Kv currents above −20 mV in both KATP‐GOF and control cell. However, basal KATP channel activation is evident in KATP‐GOF cells as additional ~linear current reversing at −80 mV (boxed current is amplified in insert). (D) Averaged basal currents at −120 and −40 mV from experiments as in C (n = 5 control cells, n = 7 KATP‐GOF cells).
Figure 7.
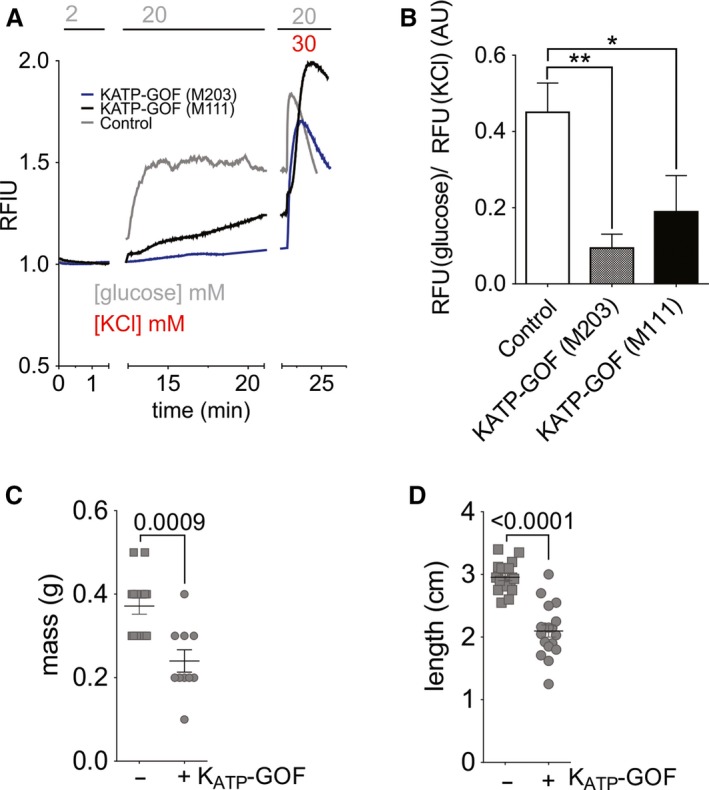
KATP‐GOF inhibits glucose‐dependent Ca and causes secondary diabetic complications. (A) Representative recording of intracellular calcium response to switch from 2 to 20 mmol/L glucose in control (gCAMP6s only) and KATP‐GOF/gCAMP6s islets from two different founder lineages (M203, M111). (B) Average calcium response to 20 mmol/L glucose from control (n = 8) and two different founder lineages (M203, n = 8 and M111, n = 7) of KATP‐GOF/gCAMP6s fish, normalized to absolute calcium response to depolarization in KCl. (C) Body mass (N = 10–14) and (D) body length (N = 18) in KATP‐GOF (+) and control (−) fish that were induced as larvae. B, C, and D are analyzed by 1‐way ANOVA followed by Tukey's post‐tests. (*) P < 0.05, (**) P < 0.01.
KATP‐GOF mice with untreated diabetes develop significant secondary consequences, including growth limitation (Girard et al. 2009; Remedi et al. 2009). Larvae‐induced KATP‐GOF fish also showed dramatically reduced body length and weight at 10 weeks of age, when compared to Cre‐negative littermate controls from the same clutches (Fig. 7C and D). These data indicate that not only does β‐cell KATP‐GOF induce similar inexcitability‐dependent hyperglycemia in zebrafish as in mammals, but also similar secondary diabetic consequences.
Discussion
Conservation of islet function between mammals and fish
In mammals, excitability‐dependence of intracellular [Ca2+] is well‐established and is shown to be critical for regulation of insulin secretion. By contrast, islet excitability in lower vertebrates remains essentially unaddressed. We previously reported the expression and function of KATP channels in zebrafish islet β‐cells and showed that pharmacological KATP channel activators worsened glucose tolerance in adult fish (Emfinger et al. 2017). Larval activation of KATP‐GOF transgene under tetracycline and tebufenozide‐driven promoter control in β‐cells, or treatment of normal larvae with diazoxide, raises glucose levels and inhibits overnutrition‐induced β‐cell expansion (Li et al. 2014), and intracellular [Ca2+] is glucose‐dependent in larval zebrafish islets (Lorincz et al. 2018). In the present study we have now characterized glucose‐dependence of intracellular calcium in adult zebrafish islets, and show that the glucose dependence of calcium oscillations is similar, although not identical, to mammalian islets. We further show that islet calcium response to glucose can be blocked by β‐cell specific induction of GOF mutations in KATP, resulting in profound diabetes. This indicates that key components of excitability‐dependent insulin secretion are well conserved between mammals and fish, although unfortunately, we do not have a suitable assay for secreted insulin or C‐peptide in zebrafish.
However, we observe several potentially important differences. First, amplification of glucose signals by amino acids, which is observed in mammalian islets (Henquin et al. 2006; Liu et al. 2008) and embryonic zebrafish islets (Lorincz et al. 2018), was not seen in adult fish islets (Fig. 3D). Given that zebrafish may be more dependent on protein than carbohydrate in the diet, this is teleologically surprising, but may reflect a difference in cellular expression of essential carriers or enzymes. Second, isolated zebrafish islets are not well‐coupled electrically (Fig. 4). Tight coupling of β‐cells to one another, evidenced by tight cell‐cell coupling of Ca2+ transients, is critical for normal mammalian glucose tolerance (Klee et al. 2008; Farnsworth and Benninger 2014): in mice lacking connexin 36, which forms the primary gap junctions in islet β‐cells, basal insulin is elevated, and glucose responses of the overall islet are slowed, worsening glucose tolerance in otherwise healthy animals (Head et al. 2012). Because of the lack of cell‐cell coupling in the adult fish islets, glucose‐sensitivity of Ca2+ is quite variable between cells within the intact islet (Fig. 4). Variable glucose‐sensitivities of β‐cells ex vivo have also been observed in larval and early juvenile zebrafish (Singh et al. 2017; Lorincz et al. 2018); ex vivo recordings of these younger zebrafish islets clearly show cells activating independently, at thresholds between 5 and 20 mmol/L glucose. Absence of cell‐cell electrical coupling in zebrafish β‐cells may explain, in part, the relatively lower glucose tolerance of zebrafish compared to mammals (Eames et al. 2010; Emfinger et al. 2017), with higher peak blood glucose and slower return to baseline glucose after a glucose injection.
KATP‐GOF zebrafish recapitulate major features of mammalian neonatal diabetes
Transgenic mice expressing KATP‐GOF at birth, as well as human KATP‐dependent human neonatal diabetic patients, exhibit reduced growth rates (Koster et al. 2000; Polak and Cave 2007; Girard et al. 2009; Remedi et al. 2009). Mammalian and Danio KATP genes are very similar (>90% identity at the amino acid level) (Emfinger et al. 2017). KATP‐GOF zebrafish, expressing the identical transgene that we originally used in mice (Koster et al. 2000), results in basal activity of KATP channels in β‐cells and in the fish becoming profoundly hyperglycemic, and also showing growth limitation when induced as larvae. Other secondary consequences of hyperglycemia can occur directly in the islet, with loss of β‐cell identity and insulin content (Brereton et al. 2014; Wang et al. 2014). Whether this occurs in zebrafish islets exposed to high glucose for long periods is currently unknown but future lineage tracing studies using models such as ours may now be used to clarify these questions.
Zebrafish are transparent as larvae, reproduce frequently and in large clutches, have a fully sequenced genome, and can be efficiently genetically mutated, making them well‐suited to large‐scale drug or genetic screens. We have shown that zebrafish β‐cells exhibit many similarities to mammals in glucose responsivity, including the profound hyperglycemia that results from electrical glucose‐unresponsivity. We thus provide a zebrafish model of β‐cell inexcitability‐dependent diabetes that may be useful for drug and genetic modifier screens.
Ethics Statement
All procedures were approved by the Washington University Institutional Animal Care and Use Committee.
Conflict of Interest
None.
Acknowledgments
We acknowledge the assistance of the Washington University in St Louis Zebrafish Facility (http://zebrafishfacility.wustl.edu/). We also thank Kelly Monk, Lila Solnica‐Krezel, and Margot Williams, for providing both reagents and technical advice regarding design of the tol2 constructs used to make the transgenic zebrafish.
Emfinger C. H., Lőrincz R., Wang Y., York N. W., Singareddy S. S., Ikle J. M., Tryon R. C., McClenaghan C., Shyr Z. A., Huang Y., Reissaus C. A., Meyer D., Piston D. W., Hyrc K., Remedi M. S., Nichols C. G.. Beta‐cell excitability and excitability‐driven diabetes in adult Zebrafish islets. Physiol Rep, 7 (11), 2019, e14101, 10.14814/phy2.14101
Funding InformationThis work was supported by grants from the National Institutes of Health to CGN (R01 DK109407), MSR (R01 DK 098584). CE was supported by NIH T32DK108742–01. RL was supported by the Austrian Marshall Plan Foundation (17295014172016) and the University of Innsbruck. This work was additionally supported by the Washington University in St Louis Diabetes Research Center (DK 020579) and the Washington University Center for Cellular Imaging (ZRSC 305636608M to MSR).
References
- Antunes, C. M. , Salgado A. P., Rosário L. M., and Santos R. M.. 2000. Differential patterns of glucose‐induced electrical activity and intracellular calcium responses in single mouse and rat pancreatic islets. Diabetes 49:2028–2038. [DOI] [PubMed] [Google Scholar]
- Argenton, F. , Zecchin E., and Bortolussi M.. 1999. Early appearance of pancreatic hormone‐expressing cells in the zebrafish embryo. Mech. Dev. 87:217–221. [DOI] [PubMed] [Google Scholar]
- Artimovich, E. , Jackson R. K., Kilander M. B. C., Lin Y.‐C., and Nestor M. W.. 2017. PeakCaller: an automated graphical interface for the quantification of intracellular calcium obtained by high‐content screening. BMC Neurosci. 18:72. [DOI] [PMC free article] [PubMed] [Google Scholar]
- Bavamian, S. , Klee P., Britan A., Populaire C., Caille D., Cancela J., et al. 2007. Islet‐cell‐to‐cell communication as basis for normal insulin secretion. Diabetes Obes. Metab. 9(Suppl 2):118–132. [DOI] [PubMed] [Google Scholar]
- Benninger, R. K. , Zhang M., Head W. S., Satin L. S., and Piston D. W.. 2008. Gap junction coupling and calcium waves in the pancreatic islet. Biophys. J . 95:5048–5061. [DOI] [PMC free article] [PubMed] [Google Scholar]
- Benninger, R. K. P. , Hutchens T., Head W. S., McCaughey M. S., Zhang M., Le Marchand S. J., et al. 2014. Intrinsic islet heterogeneity and gap junction coupling determine spatiotemporal Ca(2 + ) wave dynamics. Biophys. J . 107:2723–2733. [DOI] [PMC free article] [PubMed] [Google Scholar]
- Biemar, F. , Argenton F., Schmidtke R., Epperlein S., Peers B., and Driever W.. 2001. Pancreas development in zebrafish: early dispersed appearance of endocrine hormone expressing cells and their convergence to form the definitive islet. Dev. Biol. 230:189–203. [DOI] [PubMed] [Google Scholar]
- Brereton, M. F. , Iberl M., Shimomura K., Zhang Q., Adriaenssens A. E., Proks P., et al. 2014. Reversible changes in pancreatic islet structure and function produced by elevated blood glucose.. Nat. Commun. 5:4639. [DOI] [PMC free article] [PubMed] [Google Scholar]
- Carlisle, T. C. , and Ribera A. B.. 2014. Connexin 35b expression in Danio rerio embryos and larvae spinal cord. J. Comp. Neurol. 522:861–875. [DOI] [PMC free article] [PubMed] [Google Scholar]
- Chen, S. , Li C., Yuan G., and Xie F.. 2007. Anatomical and histological observation on the pancreas in adult zebrafish. Pancreas 34:120–125. [DOI] [PubMed] [Google Scholar]
- Chen, J. , Xia L., Bruchas M. R., and Solnica‐Krezel L.. 2017. Imaging early embryonic calcium activity with GCaMP6s transgenic zebrafish. Dev. Biol. 430:385–396. [DOI] [PMC free article] [PubMed] [Google Scholar]
- Eames, S. C. , Philipson L. H., Prince V. E., and Kinkel M. D.. 2010. Blood sugar measurement in zebrafish reveals dynamics of glucose homeostasis. Zebrafish 7:205–213. [DOI] [PMC free article] [PubMed] [Google Scholar]
- Emfinger, C. H. , Welscher A., Yan Z., Wang Y., Conway H., Moss J. B., et al. 2017. Expression and function of ATP‐dependent potassium channels in zebrafish islet β‐cells. Roy. Soc. Open Sci. 4:160808. [DOI] [PMC free article] [PubMed] [Google Scholar]
- Farnsworth, N. L. , and Benninger R. K. P.. 2014. New insights into the role of connexins in pancreatic islet function and diabetes. FEBS Lett. 588:1278–1287. [DOI] [PMC free article] [PubMed] [Google Scholar]
- Girard, C. A. , Wunderlich F. T., Shimomura K., Collins S., Kaizik S., Proks P., et al. 2009. Expression of an activating mutation in the gene encoding the KATP channel subunit Kir6.2 in mouse pancreatic beta cells recapitulates neonatal diabetes. J. Clin. Invest. 119:80–90. [DOI] [PMC free article] [PubMed] [Google Scholar]
- Gloyn, A. L. , Pearson E. R., Antcliff J. F., Proks P., Bruining G. J., Slingerland A. S., et al. 2004. Activating mutations in the gene encoding the ATP‐sensitive potassium‐channel subunit Kir6.2 and permanent neonatal diabetes. N. Engl. J. Med. 350:1838–1849. [DOI] [PubMed] [Google Scholar]
- Head, W. S. , Orseth M. L., Nunemaker C. S., Satin L. S., Piston D. W., and Benninger R. K.. 2012. Connexin‐36 gap junctions regulate in vivo first‐ and second‐phase insulin secretion dynamics and glucose tolerance in the conscious mouse. Diabetes 61:1700–1707. [DOI] [PMC free article] [PubMed] [Google Scholar]
- Henquin, J.‐C. , Dufrane D., and Nenquin M.. 2006. Nutrient control of insulin secretion in isolated normal human islets. Diabetes 55:3470–3477. [DOI] [PubMed] [Google Scholar]
- Jabeen, S. , and Thirumalai V.. 2013. Distribution of the gap junction protein connexin 35 in the central nervous system of developing zebrafish larvae. Front. Neural. Circuits. 7:91. [DOI] [PMC free article] [PubMed] [Google Scholar]
- Johnston Natalie, R. , Mitchell Ryan K., Haythorne E., Pessoa Maria P., Semplici F., Ferrer J., et al. 2016. Beta cell hubs dictate pancreatic islet responses to glucose. Cell Metab. 24:389–401. [DOI] [PMC free article] [PubMed] [Google Scholar]
- Kenty, J. H. R. , and Melton D. A.. 2015. Testing pancreatic islet function at the single cell level by calcium influx with associated marker expression. PLoS ONE 10:e0122044. [DOI] [PMC free article] [PubMed] [Google Scholar]
- Kimmel, R. A. , and Meyer D.. 2016. Zebrafish pancreas as a model for development and disease. Methods Cell Biol. 134:431–461. [DOI] [PubMed] [Google Scholar]
- Klee, P. , Bavamian S., Charollais A., Caille D., Cancela J., Peyrou M., et al. 2008. Gap junctions and insulin secretion Pp. 111–132 in Seino S. and Bell G. I., eds. Pancreatic beta cell in health and disease. Tokyo, Springer Japan. [Google Scholar]
- Koster, J. C. , Marshall B. A., Ensor N., Corbett J. A., and Nichols C. G.. 2000. Targeted overactivity of [Beta] cell KATP channels induces profound neonatal diabetes. Cell 100:645–654. [DOI] [PubMed] [Google Scholar]
- Koster, J. C. , Permutt M. A., and Nichols C. G.. 2006. Diabetes and insulin secretion: the ATP‐sensitive K+ channel (KATP) connection. Diabetes 54:3065–3072. [DOI] [PubMed] [Google Scholar]
- Kuryshev, Y. A. , Brown A. M., Duzic E., and Kirsch G. E.. 2014. Evaluating state dependence and subtype selectivity of calcium channel modulators in automated electrophysiology assays. Assay Drug Dev. Technol. 12:110–119. [DOI] [PMC free article] [PubMed] [Google Scholar]
- Kwan, K. M. , Fujimoto E., Grabher C., Mangum B. D., Hardy M. E., Campbell D. S., et al. 2007. The Tol2kit: a multisite gateway‐based construction kit for Tol2 transposon transgenesis constructs. Dev. Dyn. 236:3088–3099. [DOI] [PubMed] [Google Scholar]
- Li, M. , Maddison L. A., Page‐McCaw P., and Chen W.. 2014. Overnutrition induces [Beta]‐cell differentiation through prolonged activation of [Beta]‐cells in zebrafish larvae. Am. J. Physiol. Endocrinol. Metab. 306:E799–E807. [DOI] [PMC free article] [PubMed] [Google Scholar]
- Lipscombe, D. 2002. L‐type calcium channels. Circ. Res. 90:933. [DOI] [PubMed] [Google Scholar]
- Liu, Z. , Jeppesen P. B., Gregersen S., Chen X., and Hermansen K.. 2008. Dose‐ and glucose‐dependent effects of amino acids on insulin secretion from isolated mouse islets and clonal INS‐1E beta‐cells. Rev. Diabet. Stud. 5:232–244. [DOI] [PMC free article] [PubMed] [Google Scholar]
- Lopez‐Ramirez, M. A. , Calvo C.‐F., Ristori E., Thomas J.‐L., and Nicoli S.. 2016. Isolation and culture of adult zebrafish brain‐derived neurospheres. J. Vis. Exp. 108:53617. [DOI] [PMC free article] [PubMed] [Google Scholar]
- Lorincz, R. , Emfinger C. H., Walcher A., Giolai M., Krautgasser C., Remedi M. S., et al. 2018. In vivo monitoring of intracellular Ca(2 + ) dynamics in the pancreatic beta‐cells of zebrafish embryos. Islets 10:221–238. [DOI] [PMC free article] [PubMed] [Google Scholar]
- Mangoni, M. E. , Couette B., Marger L., Bourinet E., Striessnig J., and Nargeot J.. 2006. Voltage‐dependent calcium channels and cardiac pacemaker activity: from ionic currents to genes. Prog. Biophys. Mol. Biol. 90:38–63. [DOI] [PubMed] [Google Scholar]
- Moss, J. B. , Koustubhan P., Greenman M., Parsons M. J., Walter I., and Moss L. G.. 2009. Regeneration of the pancreas in adult zebrafish. Diabetes 58:1844–1851. [DOI] [PMC free article] [PubMed] [Google Scholar]
- Parsons, M. J. , Pisharath H., Yusuff S., Moore J. C., Siekmann A. F., Lawson N., et al. 2009. Notch‐responsive cells initiate the secondary transition in larval zebrafish pancreas. Mech. Dev. 126:898–912. [DOI] [PMC free article] [PubMed] [Google Scholar]
- Polak, M. , and Cave H.. 2007. Neonatal diabetes mellitus: a disease linked to multiple mechanisms. Orphanet J. Rare Dis. 2:12. [DOI] [PMC free article] [PubMed] [Google Scholar]
- Remedi, M. S. , and Koster J. C.. 2010. K(ATP) channelopathies in the pancreas. Pflugers Arch. 460:307–320. [DOI] [PubMed] [Google Scholar]
- Remedi, M. S. , Kurata H. T., Scott A., Wunderlich F. T., Rother E., Kleinridders A., et al. 2009. Secondary consequences of [Beta] cell inexcitability: identification and prevention in a murine model of KATP‐induced neonatal diabetes mellitus. Cell Metab. 9:140–151. [DOI] [PMC free article] [PubMed] [Google Scholar]
- Sanhueza, D. , Montoya A., Sierralta J., and Kukuljan M.. 2009. Expression of voltage‐activated calcium channels in the early zebrafish embryo. Zygote 17:131–135. [DOI] [PubMed] [Google Scholar]
- Schindelin, J. , Arganda‐Carreras I., Frise E., Kaynig V., Longair M., Pietzsch T., et al. 2012. Fiji: an open‐source platform for biological‐image analysis. Nat. Methods 9:676–682. [DOI] [PMC free article] [PubMed] [Google Scholar]
- Sidi, S. , Busch‐Nentwich E., Friedrich R., Schoenberger U., and Nicolson T.. 2004. Gemini encodes a zebrafish L‐type calcium channel that localizes at sensory hair cell ribbon synapses. J. Neurosci. 24:4213–4223. [DOI] [PMC free article] [PubMed] [Google Scholar]
- Silva, J. R. , Cooper P., and Nichols C. G.. 2014. Modeling K, ATP‐dependent excitability in pancreatic islets. Biophys. J . 107:2016–2026. [DOI] [PMC free article] [PubMed] [Google Scholar]
- Singh, S. P. , Janjuha S., Hartmann T., Kayisoglu Ö., Konantz J., Birke S., et al. 2017. Different developmental histories of beta‐cells generate functional and proliferative heterogeneity during islet growth. Nat. Commun. 8:664. [DOI] [PMC free article] [PubMed] [Google Scholar]
- Striessnig, J. , Ortner N. J., and Pinggera A.. 2015. Pharmacology of L‐type calcium channels: novel drugs for old targets? Curr. Mol. Pharmacol. 8:110–122. [DOI] [PMC free article] [PubMed] [Google Scholar]
- Tarifeño‐Saldivia, E. , Lavergne A., Bernard A., Padamata K., Bergemann D., Voz M. L., et al. 2017. Transcriptome analysis of pancreatic cells across distant species highlights novel important regulator genes. BMC Biol. 15:21. [DOI] [PMC free article] [PubMed] [Google Scholar]
- Wang, Z. , York N. W., Nichols C. G., and Remedi M. S.. 2014. Pancreatic [beta]‐cell dedifferentiation in diabetes and redifferentiation following insulin therapy. Cell Metab. 19:1–11. [DOI] [PMC free article] [PubMed] [Google Scholar]
- Watanabe, M. 2017. Gap junction in the teleost fish lineage: duplicated connexins may contribute to skin pattern formation and body shape determination. Front. Cell Dev. Biol. 5:13. [DOI] [PMC free article] [PubMed] [Google Scholar]
- Zhou, W. , Horstick E. J., Hirata H., and Kuwada J. Y.. 2008. Identification and expression of voltage‐gated calcium channel β subunits in Zebrafish. Dev. Dyn. 237:3842–3852. [DOI] [PubMed] [Google Scholar]


