

Abstract
BACKGROUND
Nipah virus is a highly virulent zoonotic pathogen that can be transmitted between humans. Understanding the dynamics of person-to-person transmission is key to designing effective interventions.
METHODS
We used data from all Nipah virus cases identified during outbreak investigations in Bangladesh from April 2001 through April 2014 to investigate case-patient characteristics associated with onward transmission and factors associated with the risk of infection among patient contacts.
RESULTS
Of 248 Nipah virus cases identified, 82 were caused by person-to-person transmission, corresponding to a reproduction number (i.e., the average number of secondary cases per case patient) of 0.33 (95% confidence interval [CI], 0.19 to 0.59). The predicted reproduction number increased with the case patient’s age and was highest among patients 45 years of age or older who had difficulty breathing (1.1; 95% CI, 0.4 to 3.2). Case patients who did not have difficulty breathing infected 0.05 times as many contacts (95% CI, 0.01 to 0.3) as other case patients did. Serologic testing of 1863 asymptomatic contacts revealed no infections. Spouses of case patients were more often infected (8 of 56 [14%]) than other close family members (7 of 547 [1.3%]) or other contacts (18 of 1996 [0.9%]). The risk of infection increased with increased duration of exposure of the contacts (adjusted odds ratio for exposure of >48 hours vs. ≤1 hour, 13; 95% CI, 2.6 to 62) and with exposure to body fluids (adjusted odds ratio, 4.3; 95% CI, 1.6 to 11).
CONCLUSIONS
Increasing age and respiratory symptoms were indicators of infectivity of Nipah virus. Interventions to control person-to-person transmission should aim to reduce exposure to body fluids. (Funded by the National Institutes of Health and others.)
Nipah virus is a batborne paramyxo-virus that is found throughout South Asia and Southeast Asia. Bangladesh is currently the only country regularly reporting human cases, including person-to-person transmission.1 With a case fatality rate greater than 70% and no available treatment or vaccines, Nipah virus was identified by the World Health Organization as an emerging infectious disease posing a high risk of causing an important epidemic.1–3 Although previous Nipah virus outbreaks have been small,1 larger, self-sustaining epidemics may occur if the virus becomes more transmissible. Effective control measures against Nipah virus require an understanding of person-to-person transmission.
Our current understanding of Nipah virus person-to-person transmission comes from studies that described transmission events in single outbreaks4–7 — for example, the father of a patient becoming ill after providing care for his son.5 Additional insight was gained from biologic data, such as Nipah virus isolates from patients’ throat and oral swabs8–11 and detection of Nipah virus RNA on hospital surfaces.5,10 Such reports were useful for generating hypotheses about Nipah virus transmission, but they lacked the power to test and validate these hypotheses and evaluate their relative importance.
Luby et al.1 analyzed 23 Nipah virus spillovers (i.e., introductions from the bat reservoir into the human population) reported in Bangladesh from 2001 through 2007 and concluded that case patients with respiratory symptoms and those who died were more likely than others to transmit Nipah virus. However, the study had a small sample size and lacked systematic surveillance and data about contacts and asymptomatic infections. More than 10 years later, the surveillance of Nipah virus in Bangladesh has improved substantially (systematic investigation of Nipah virus cases and their contacts has been implemented since 2007) and the number of investigated Nipah virus spillover events has more than tripled, providing the opportunity to reassess what we know about Nipah virus transmission.
We present an assessment of Nipah virus transmission that is based on 14 years of case data and 8 years of extensive contact investigations from Bangladesh. All 248 cases of Nipah virus represented in our analysis have been reported previously,1,2,4–7,10–19 but we have now analyzed these cases together with information on case contacts to gain new insights into drivers of Nipah virus transmission. These cases represent 40% of all Nipah virus cases (248 of 628 cases) reported globally.20–23
METHODS
IDENTIFICATION OF CASE PATIENTS
We analyzed data on all laboratory-confirmed and probable Nipah virus cases identified in Bangladesh from April 2001 through April 2014 by hospital-based surveillance (implemented since 2007) and outbreak investigations. A patient with confirmed Nipah virus infection was defined as a person with detectable IgM antibodies against Nipah virus24 (or IgG24 for retrospectively identified outbreaks), and a patient with probable Nipah virus infection was defined as a person with an epidemiologic link to a confirmed case patient who died before specimens for testing could be collected. Case detection and data collection procedures, which were stable over time, have been described previously5,14,16,17 and are summarized in the Supplementary Appendix, available with the full text of this article at NEJM.org. A person with Nipah virus was classified as a secondary case patient if symptom onset occurred 5 to 15 days (the assumed incubation period window) after contact with a confirmed or probable case patient (the infector).
TRACING CASE CONTACTS
Between 2007 and 2014, we investigated contacts of confirmed and probable case patients; a contact was defined as a person who had physical contact or in-person verbal communication with a patient 0 to 15 days (the assumed maximum infectious period) after illness onset. Contacts were asked about demographic characteristics and their relationship and exposure to the case patient. Proxy respondents were identified for contacts who were unable to answer for themselves (e.g., children or severely ill or deceased contacts). To assess the occurrence of asymptomatic infections, during the period from January 2009 through April 2014 contacts without signs of illness were tested for Nipah virus IgG more than 6 weeks after they were exposed to case patients.24
PATIENT CONSENT
We obtained informed consent from all Nipah virus case patients and contacts represented in our analysis or from their proxy respondents. We obtained assent from children, as well as consent from guardians for those younger than 11 years of age. All contacts or their proxy respondents provided written consent. Patient enrollment often included written consent but consent was sometimes oral, particularly during early investigations. All outbreak investigation protocols were approved by the government of Bangladesh, and the contact study protocol was approved by the icddr,b human subjects review committee.
STATISTICAL ANALYSIS
We calculated the serial interval (i.e., the interval between disease onset in a case patient and disease onset in a person infected by that patient) for Nipah virus using the symptom-onset dates of epidemiologically linked transmission pairs. We estimated the incubation period for secondary cases with known exposure windows and symptom-onset dates.
We estimated the reproduction number (i.e., the average number of secondary cases per case patient) on the basis of identified transmission trees and a negative binomial distribution.25 We report 95% confidence intervals for all estimates to account for unobserved cases and to provide predictive intervals for future outbreaks. We used a negative binomial regression model to show associations of the reproduction number with the demographic and clinical characteristics of case patients. We categorized age, hospitalization delays, and illness outcomes. We estimated unadjusted relative infectivity as the ratio between reproduction numbers in a univariable analysis. We developed a parsimonious multivariable model that included variables associated in the univariable analysis (P≤0.05) and iteratively removed variables until only those with P values of 0.05 or less were retained. We assessed whether the number of secondary cases was associated with the number of contacts per case patient. Secondary case patients who had multiple potential infectors were excluded from the risk-factor analysis. We tested the sensitivity of estimates to their inclusion, as well as to the exclusion of any individual case, changes in surveillance, or implementation of interventions.
We investigated factors associated with infection among contacts using a multilevel logistic-regression model. We defined relationship to a case patient as a spouse, close family member (parent, child, or sibling), or other contact and categorized the duration of exposure. To test the transmission hypotheses, we aggregated 32 of 38 investigated exposure types into the following five partially overlapping groups: physical contact with a case patient,5,6 touching a case patient’s face, contact with a case patient’s respiratory secretions,1,8,26 contact with an item that had been touched by a case patient,5 and drying out the case patient’s mouth and nose after death.4,7 All exposures linked to respiratory secretions were grouped into a category that comprised all body-fluid exposures, which could include other body fluids, such as urine or vomitus. We estimated unadjusted odds ratios in univariable analysis and developed a multivariable model as described previously. We included a case-patient random intercept in univariable and multivariable models and assessed differences between infecting strains by including a random intercept for each spillover event in the multivariable model and testing statistical significance by the likelihood ratio test. We excluded contacts’ relationship to the case patient from multivariable analysis because of the strong correlation with exposure variables. We excluded from the analysis case–contact pairs in which contacts had potential alternative infection sources and investigated sensitivity to their inclusion. Additional details about the statistical analysis are provided in the Supplementary Appendix.
RESULTS
CHARACTERISTICS OF THE CASE PATIENTS
During the period from April 2001 through April 2014, a total of 248 Nipah virus cases (141 confirmed and 107 probable) were detected in Bangladesh (Table S2 in the Supplementary Appendix); 3 case patients (1.2%) were health care workers. The median age of the patients was 24 years (interquartile range, 10 to 35); 64% (158 patients) were male (Table 1). Most case patients had respiratory symptoms, such as difficulty breathing (152 of 243 patients with available data [63%]) and cough (124 of 242 patients [51%]); 193 of the 248 case patients (78%) died (Table 1).
Table 1.
Nipah Virus Cases and Risk Factors Associated with Reproduction Number.*
| Characteristic | Case Patients† | Secondary Cases | Reproduction No. (95% CI)‡ | Relative Infectivity (95% CI)§ | P Value | Adjusted Relative Infectivity (95% CI)§ |
|---|---|---|---|---|---|---|
| no./total no. (%) | no. of secondary cases/case patients | |||||
| Sex | ||||||
| Female | 90/248 (36) | 5/90 | 0.06 (0.02–0.2) | Reference | ||
| Male | 158/248 (64) | 74/158 | 0.5 (0.2–0.9) | 8.4 (2.0–35) | 0.006 | NA |
| Age | ||||||
| ≤14 yr | 91/248 (37) | 1/91 | 0.01 (0.00–0.09) | 0.01 (0.00–0.1) | 0.02 (0.00–0.2) | |
| 15 to 29 yr | 55/248 (22) | 10/55 | 0.2 (0.06–0.6) | 0.2 (0.04–1.0) | <0.001 | 0.3 (0.05–1.3) |
| 30 to 44 yr | 62/248 (25) | 31/62 | 0.5 (0.2–1.3) | 0.5 (0.1–2.4) | 0.8 (0.2–3.4) | |
| ≥45 yr | 40/248 (16) | 37/40 | 0.9 (0.3–2.9) | Reference | Reference | |
| Source of infection | ||||||
| Spillover or unidentified source¶ | 166/248 (67) | 50/166 | 0.3 (0.1–0.7) | Reference | ||
| Person-to-person | 82/248 (33) | 29/82 | 0.4 (0.1–1.1) | 1.2 (0.3–4.5) | 0.81 | NA |
| Hospitalization after symptom onset | ||||||
| ≤2 days | 36/248 (15) | 2/36 | 0.06 (0.01–0.4) | Reference | ||
| 3 to 5 days | 128/248 (52) | 36/128 | 0.3 (0.1–0.6) | 5.1 (0.6–44) | 0.18 | NA |
| ≥6 days | 58/248 (23) | 15/58 | 0.3 (0.08–0.9) | 4.7 (0.4–49) | NA | |
| Not hospitalized | 26/248 (10) | 26/26 | 1.0 (0.2–5.6) | 18 (1.3–252) | NA | |
| Illness outcome‖ | ||||||
| Survived ≤7 days | 140/244 (57) | 74/140 | 0.5 (0.1–2.1) | Reference | ||
| Survived >7 days | 104/244 (43) | 5/104 | 0.05 (0.01–0.2) | 0.09 (0.02–0.4) | 0.001 | NA |
| Difficulty breathing | ||||||
| No | 91/243 (37) | 2/91 | 0.02 (0.00–0.1) | Reference | Reference | |
| Yes | 152/243 (63) | 77/152 | 0.5 (0.3–1.0) | 23 (4.1–130) | <0.001 | 19 (3.2–114) |
| Cough | ||||||
| No | 118/242 (49) | 25/118 | 0.2 (0.0–0.5) | Reference | ||
| Yes | 124/242 (51) | 54/124 | 0.4 (0.2–1.0) | 2.1 (0.6–7.2) | 0.27 | NA |
| Vomiting | ||||||
| No | 110/244 (45) | 21/110 | 0.2 (0.07–0.5) | Reference | ||
| Yes | 134/244 (55) | 58/134 | 0.4 (0.2–1.0) | 2.3 (0.6–8.0) | 0.22 | NA |
Included are laboratory-confirmed and probable Nipah virus cases identified in Bangladesh from April 2001 through April 2014.
Total number is the number of cases with available information.
The reproduction number is the average number of secondary cases per case patient.
Relative infectivity (defined as the ratio between reproduction numbers) and 95% confidence intervals were estimated on the basis of a negative binomial regression analysis. Adjusted relative infectivity was estimated with adjustment for age and difficulty breathing. Three secondary cases with multiple potential infectors were excluded from the analysis (Fig. S4 in the Supplementary Appendix). The adjusted relative infectivity was not applicable (NA) for variables that were excluded from the multivariable model.
Spillover refers to introduction of Nipah virus from the bat reservoir into the human population.
A total of 78% of cases (193 of 248) were fatal; dates of death were unknown in 4 fatal cases.
CONTACT CHARACTERISTICS
Contacts were traced for 140 of the 146 case patients (96%) who were identified after protocols were implemented. Those 140 case patients had 2606 contacts, representing 2494 persons; 73 of the individual contacts, including 3 who were infected with Nipah virus, had contact with multiple case patients. A total of 35 of the 2494 persons who came in contact with a case patient (1.4%) probably acquired Nipah virus through person-to-person transmission. No asymptomatic infections were detected among 1863 persons who underwent serologic testing and had no signs of illness. Case patients had a median of 17 contacts (interquartile range, 12 to 22); 51% of contacts (1317 of 2606) were male, and the median age was 32 years (interquartile range, 22 to 44) (Table 2). Spouses represented 2.1% of contacts (56 of 2605), and 21% of contacts (548 of 2605) were close family members. Spouses spent more time with case patients than did other contacts (median, 81 hours vs. 5 hours; P<0.001 by the Wilcoxon rank-sum test) and reported types of investigated exposure more often than did other contacts (Table S6 in the Supplementary Appendix).
Table 2.
Nipah Virus Case Contacts and Risk Factors Associated with Nipah Virus Infection.*
| Characteristic | Contacts† | Contacts Infected | Odds Ratio§ (95% CI) | P Value | Adjusted Odds Ratio§ (95% CI) | Adjusted P Value | |
|---|---|---|---|---|---|---|---|
| no./total no. (%) | no./total no. | % Infected (95% CI)‡ | |||||
| Sex | |||||||
| Female | 1289/2606 (49) | 22/1288 | 1.7 (1.1–2.6) | Reference | |||
| Male | 1317/2606 (51) | 11/1312 | 0.8 (0.4–1.5) | 0.4 (0.2–0.9) | 0.02 | NA | |
| Age | |||||||
| ≤14 yr | 299/2606 (11) | 4/297 | 1.3 (0.4–3.4) | 1.2 (0.3–4.6) | 0.90 | NA | |
| 15 to 29 yr | 827/2606 (32) | 10/827 | 1.2 (0.6–2.2) | 0.7 (0.3–2.1) | NA | ||
| 30 to 44 yr | 833/2606 (32) | 11/831 | 1.3 (0.7–2.4) | 0.9 (0.3–2.6) | NA | ||
| ≥45 yr | 647/2606 (25) | 8/645 | 1.2 (0.5–2.4) | Reference | NA | ||
| Relationship¶ | |||||||
| Spouse | 56/2605 (2) | 8/56 | 14.3 (6.4–26) | 47 (11–212) | |||
| Close family member | 548/2605 (21) | 7/547 | 1.3 (0.5–2.6) | 2.0 (0.7–5.6) | <0.001 | NA | |
| Other contact | 2001/2605 (77) | 18/1996 | 0.9 (0.5–1.4) | Reference | NA | ||
| Duration of exposure | |||||||
| ≤1 hr | 652/2604 (25) | 3/652 | 0.5 (0.1–1.3) | Reference | Reference | ||
| >1 to 6 hr | 761/2604 (29) | 7/756 | 0.9 (0.4–1.9) | 2.3 (0.5–10) | <0.001 | 2.2 (0.5–10) | 0.005 |
| >6 to 12 hr | 279/2604 (11) | 2/279 | 0.7 (0.1–2.6) | 1.9 (0.3–13) | 1.8 (0.3–13) | ||
| >12 to 24 hr | 161/2604 (6) | 5/161 | 3.1 (1.0–7.1) | 19 (3.1–117) | 13 (2.0–86) | ||
| >24 to 48 h r | 221/2604 (8) | 4/221 | 1.8 (0.5–4.6) | 15 (2.4–90) | 9.3 (1.4–62) | ||
| >48 hr | 530/2604 (20) | 12/530 | 2.3 (1.2–3.9) | 22 (4.9–103) | 13 (2.6–62) | ||
| Touched case patient’s face | |||||||
| No | 433/2522 (17) | 4/432 | 0.9 (0.3–2.4) | Reference | |||
| Yes | 2089/2522 (83) | 28/2084 | 1.3 (0.9–1.9) | 1.2 (0.4—4.2) | 0.74 | NA | |
| Contact with items touched by case patient | |||||||
| No | 1885/2602 (72) | 23/1879 | 1.2 (0.8–1.8) | Reference | |||
| Yes | 717/2602 (28) | 9/717 | 1.3 (0.6–2.4) | 2.2 (0.9–5.8) | 0.10 | NA | |
| Contact with case patient’s body fluids | |||||||
| No | 1656/2602 (64) | 13/1652 | 0.8 (0.4–1.3) | Reference | Reference | ||
| Yes | 946/2602 (36) | 20/944 | 2.1 (1.3–3.3) | 7.6 (3.1–19) | <0.001 | 4.3 (1.6–11) | 0.003 |
| Cleaned mouth and nose of case patient after death | |||||||
| No | 2156/2605 (83) | 26/2150 | 1.2 (0.8–1.8) | Reference | |||
| Yes | 449/2605 (17) | 6/449 | 1.3 (0.5–2.9) | 1.9 (0.7–5.3) | 0.26 | NA | |
Included are 2606 contacts of 140 case patients, representing 2494 persons, identified in Bangladesh from January 2001 through April 2014. Characteristics are presented for all 2606 case–contact pairs; the risk-factor analysis was based on 2600 case–contact pairs (Fig. S4 in the Supplementary Appendix).
The total number is the number of contacts with available information. Percentages may not total 100 because of rounding.
The percent infected is shown with an exact binomial confidence interval.
Odds ratios with 95% confidence intervals were estimated on the basis of a logistic-regression analysis that included a random intercept for each case. The odds ratio was adjusted for case infectivity (model included a random intercept for each case). The adjusted odds ratio was estimated with adjustments for exposure duration and contact to case patient’s body fluids.
Relationship to the case was excluded from multivariable model selection because it was strongly correlated with duration and type of exposure (Table S6 in the Supplementary Appendix).
PERSON-TO-PERSON TRANSMISSION
Nipah virus infection in 82 of the 248 case patients was suspected to be the result of person-to-person transmission, which corresponded to a reproduction number of 0.33 (95% confidence interval [CI], 0.19 to 0.59). We identified 17 transmission trees; the largest extended over five generations and included 32 cases5 (Fig. 1A and 1B). A single infector could be identified for each patient in 79 of the 82 secondary cases (96%). The number of secondary cases per case patient was highly overdispersed: 5% of case patients (12 of 248) were responsible for 86% of transmission events (68 of 79) (Fig. 1C). A total of 9% of case patients (22 of 248) transmitted Nipah virus.
Figure 1. Person-to-Person Transmission during Nipah Virus Outbreaks in Bangladesh.
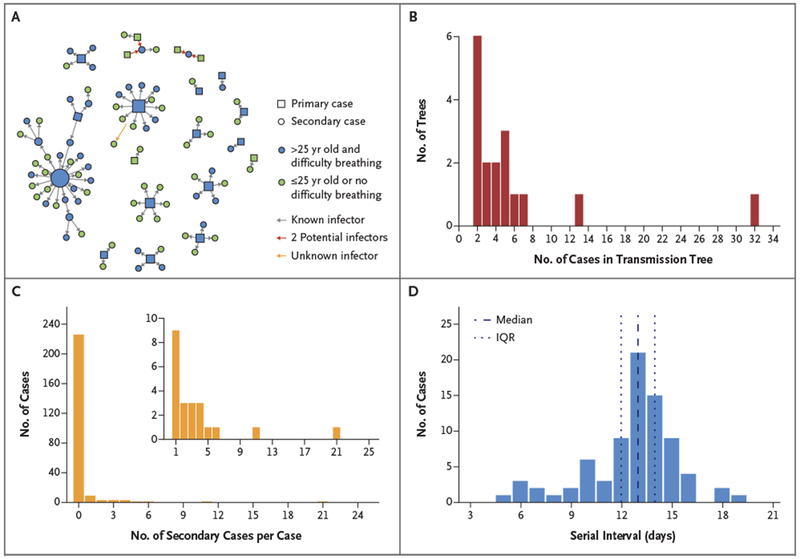
Data are from Nipah virus cases identified in Bangladesh from April 2001 through April 2014. Panel A shows 17 Nipah virus person-to-person transmission trees (i.e., infection events originating from a single introduction and connected through person-to-person transmission). Squares indicate primary case patients and circles patients infected by person-to-person transmission. Blue squares and circles represent patients 25 years of age and older with difficulty breathing, a combination of characteristics that can help to identify patients who are likely to transmit Nipah virus (Fig. S11 in the Supplementary Appendix). Alternative transmission scenarios for patients with two potential infectors are presented by red arrows. One patient (indicated by the yellow arrow) was probably infected by 1 of the 11 patients with secondary cases in the cluster, although exposure to other cases than the index case (who was excluded as infector) was not reported; 148 cases were not linked to any person-to-person transmission tree and are not represented here. Panel B shows the distribution of Nipah virus transmission trees according to the size of the tree, and Panel C shows the distribution of the number of secondary cases per Nipah virus case. Three secondary cases with multiple potential infectors were excluded. The inset shows a portion of the same data, beginning with the number of secondary cases among case patients who infected at least one other person, on an expanded y axis. Panel D shows the distribution of the serial interval (the time between symptom onset in an infector to symptom onset in a patient with an epidemiologically-linked secondary case). Three secondary cases with multiple potential infectors were excluded.
KEY TIME PERIODS
The median serial interval was 13 days (interquartile range, 12 to 14; mean, 13) (Fig. 1D). Symptoms developed within 13 days after infection in an estimated 95% of secondary cases (Fig. S2 in the Supplementary Appendix).
The median time from symptom onset to death was 6 days (interquartile range, 4 to 8). A total of 222 of the 248 case patients (90%) were hospitalized; admissions occurred within a median of 4 days (interquartile range, 3 to 6) after symptom onset. Among patients who died, death occurred within a median of 2 days (interquartile range, 1 to 3) after hospitalization.
RISK FACTORS ASSOCIATED WITH THE REPRODUCTION NUMBER
In a univariable analysis, the reproduction number increased with age (Table 1). The reproduction number, excluding three secondary case patients who had multiple potential infectors, was highest among case patients 45 years of age or older (0.9; 95% CI, 0.3 to 2.9) and lowest among those 14 years of age or younger (0.01; 95% CI, 0.00 to 0.09). Male case patients infected, on average, 8.4 times as many persons (95% CI, 2.0 to 35) as female case patients, and case patients with difficulty breathing infected more contacts than those who did not have difficulty breathing (relative infectivity, 23; 95% CI, 4.1 to 130). No survivors transmitted Nipah virus; case patients who survived more than 7 days caused fewer secondary cases than those who died earlier, with a relative infectivity of 0.09 (95% CI, 0.02 to 0.4). In a multivariable analysis, the reproduction number was highest among case patients 45 years of age or older who had difficulty breathing (1.1; 95% CI, 0.4 to 3.2) (Table 1 and Fig. 2A). After adjustment for age, case patients who did not have difficulty breathing infected, on average, 0.05 times as many persons (95% CI, 0.01 to 0.3) as those who had difficulty breathing (Fig. 2B). The multivariable model reasonably predicted observed reproduction numbers by age (Fig. 2C). The number of contacts was not associated with the number of secondary cases (Fig. S6 in the Supplementary Appendix).
Figure 2. Risk Factors Associated with the Reproduction Number.
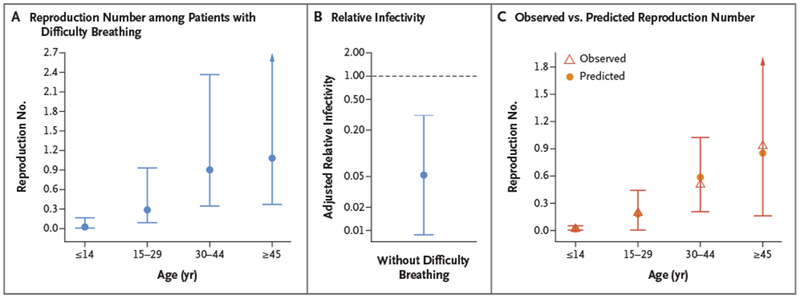
Panel A shows the predicted reproduction number according to age intervals for Nipah virus case patients with difficulty breathing. Reproduction numbers with 95% confidence intervals (indicated by the I bars) were estimated with the use of a multivariable negative binomial regression model that included age and difficulty breathing. Panel B shows the age-adjusted relative infectivity (i.e., the ratio between reproduction numbers) of case patients without difficulty breathing as compared with case patients with difficulty breathing. Panel C shows the observed reproduction number (empirical mean) according to age intervals and predictions based on the negative binomial regression model that included age and difficulty breathing. Prediction 95% confidence intervals were obtained with the use of the bootstrap method (2000 iterations).
RISK FACTORS FOR INFECTION AMONG CONTACTS
We found, after excluding 6 case–contact pairs in which contacts had potential alternative infection sources, that spouses of case patients were more often infected (8 of 56 [14%]) than close family members (7 of 547 [1.3%]) or other contacts (18 of 1996 [0.9%]) (P<0.001). No male spouses became infected, and male contacts became infected less often than female contacts (11 of 1312 [0.8%] vs. 22 of 1288 [1.7%]; odds ratio, 0.4; 95% CI, 0.2 to 0.9) (Table 2).
Infected contacts spent more time with case patients than noninfected contacts did (median, 24 hours vs. 5 hours; P = 0.003 by the Wilcoxon rank-sum test) (Fig. 3A), and the risk was highest among contacts who were exposed for more than 12 hours to 48 hours (5 of 161 contacts [3.1%] infected) (Fig. 3B). With inclusion of a random intercept for each case, the odds of infection peaked among contacts who had more than 48 hours of exposure (odds ratio for >48 hours vs. ≥1 hour, 22; 95% CI, 4.9 to 103).
Figure 3. Risk Factors Associated with Infection among Contacts of Nipah Virus Case Patients.
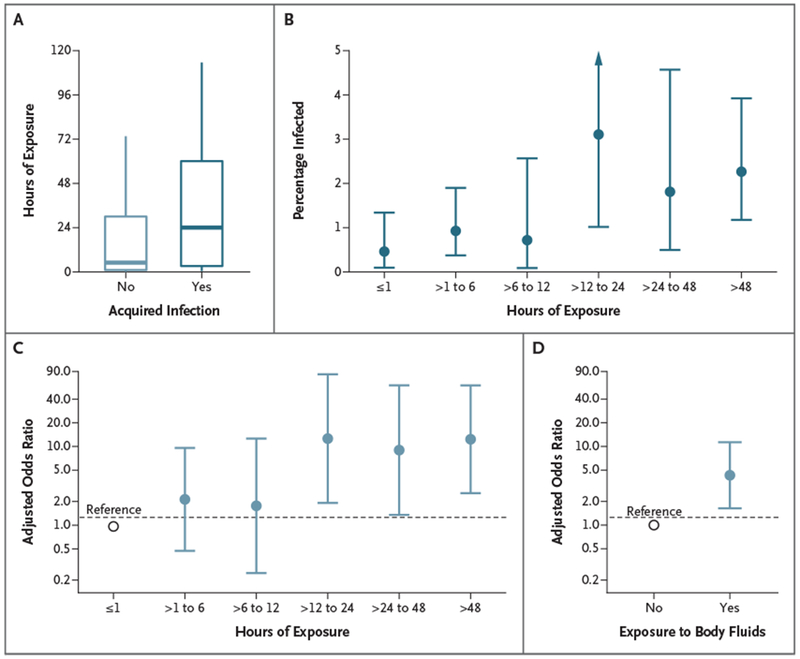
Data include contacts identified from January 2007 through April 2014. Panel A shows the duration of exposure among contacts who became infected and those who did not. In Panel A, the horizontal line represents the median, the top and bottom of the boxes represent the quartiles, and the I bars represent the range excluding outliers. Panel B shows observed percentage of contacts who became infected, according to the duration of exposure. The 95% confidence intervals of percentages were estimated by the Clopper–Pearson exact method. The I bars in Panels B, C, and D represent the 95% confidence intervals. Panel C shows the adjusted odds ratio of Nipah virus infection among contacts with various exposure durations as compared with contacts exposed for 1 hour or less (reference). Estimates were obtained on the basis of a multivariable logistic regression model that included the duration of exposure and exposure to body fluids as covariates and a random intercept per case. Panel D shows the adjusted odds ratio of Nipah virus infection among contacts exposed to case patients’ body fluids as compared with contacts not exposed to body fluids.
More than 99% of contacts (2589 of 2593) reported physical contact with a case patient. The risk of infection was higher among contacts who were exposed to cases patients’ body fluids than among those who were not exposed (20 of 944 [2.1%] vs. 13 of 1652 [0.8%]; odds ratio, 7.6; 95% CI, 3.1 to 19) (Table 2).
In multivariable analysis, the duration of exposure and exposure to body fluids remained significantly associated with infection (adjusted odds ratio for exposure duration >48 hours vs. ≤1 hour, 13; 95% CI, 2.6 to 62; and adjusted odds ratio for exposure to body fluids, 4.3; 95% CI, 1.6 to 11) (Table 2 and Fig. 3C and 3D). The odds of infection depended on the case patient to whom the contact was exposed (P<0.001) and not on the spillover event (P = 1.00).
SENSITIVITY ANALYSIS
The reproduction number among primary cases was 0.30 (95% CI, 0.15 to 0.61), a finding that suggests that Nipah virus has lower transmission potential than required for self-sustaining transmission of pathogens; among cases identified since hospital-based surveillance was implemented, the reproduction number was 0.23 (95% CI, 0.11 to 0.46) (Table S4 in the Supplementary Appendix). Analyses with inclusion of case patients or contacts with multiple potential infectors or with exclusion of individual cases showed results consistent with the main analysis.
DISCUSSION
Using data from 14 years of outbreak investigations and 8 years of contact studies, we showed that Nipah virus infections among case contacts resulted in overt disease, with no evidence of asymptomatic infection, and that the risk of infection was higher among persons who had longer contact with case patients and who were exposed to body fluids. We also found that the number of secondary infections was associated with the age of the patients infected with Nipah virus but not with the total number of contacts. In addition, our study is consistent with previous findings linking Nipah virus transmission to increased respiratory symptoms.1
The risk of infection was highest among spouses and persons who had intense and longer exposure to infected persons and were probably the principal caregivers.27 Health care workers rarely acquired infection from a patient, probably owing to limited intensity of exposure.27–29 As the health care system in Bangladesh develops, increasing involvement of health care workers in direct patient care may increase the risk of infection.30
Observations from our study are consistent with a previously suggested role of respiratory secretions as a risk factor for transmission.1,9,10 Persons infected with Nipah virus who had difficulty breathing were associated with a larger number of secondary cases, and contacts exposed to body fluids were more likely to become infected than those who were not exposed to body fluids, data that are consistent with detection of Nipah virus RNA in respiratory and oral secretions.9,11 Limited evidence of person-to-person transmission during a Nipah virus outbreak in Malaysia in which fewer respiratory symptoms were reported is consistent with respiratory secretions playing a role in transmission.8,31,32 Despite the observed link with transmission, only 61% of patients with secondary cases reported exposure to body fluids, a finding that potentially reflects misclassification of recalled exposures or alternative transmission routes. In a univariable analysis, the reproduction number was higher among male patients than among female patients.
Reproduction numbers and case fatalities were both highest among patients in late adulthood (Fig. S10 in the Supplementary Appendix). In Bangladeshi hospitals with insufficient resources for infection control, targeting older patients may be a useful strategy to reduce the risk of transmission (Fig. S11 in the Supplementary Appendix). Unmeasured covariates, such as viral load, could be associated with viral shedding and disease severity and could change as a function of age, as observed with Ebola virus.33,34 Quantifying viral loads among patients infected with Nipah virus may help to better characterize the transmission risk, although current data on viral loads are limited (Fig. S12 in the Supplementary Appendix).
Our study provides evidence that asymptomatic and mild Nipah virus infections are rare. Thus, estimates of the reproduction number and risk factors of infection and transmission probably can focus on symptomatic cases.
This study had a number of limitations. First, exposure to body fluids included respiratory secretions but potentially also included other fluid types. Future investigations should collect specific information on exposure to respiratory secretions. Second, health care workers were not included in contact tracing until 2012; however, only a few Nipah virus transmissions were identified in this population. Third, although unusual events outside the assumed windows of incubation and infectivity periods may have occurred, these appear to be rare (Fig. S3 in the Supplementary Appendix) and are unlikely to have influenced our findings. Fourth, in the cases of deceased or severely ill persons, interviews were conducted with close relatives, which may have led to misclassifications of the types of exposure. Fifth, isolated cases or small case clusters may have gone undetected, particularly before the implementation of hospital-based surveillance, which may have resulted in overestimation of the reproduction number. This, however, would not affect the conclusion that the transmission potential is currently lower than required for self-sustaining transmission and is unlikely to influence risk-factor estimates. Sixth, diversity in virus strains may have contributed to variations in infectivity; however, investigating these effects is currently not possible, since only few Nipah virus strains were sequenced9,11 (see the Supplementary Appendix), and represents a key future research area. Finally, we characterized Nipah virus transmission only in Bangladesh and therefore cannot assess transmission dynamics elsewhere. Bangladesh is the only country reporting Nipah virus outbreaks regularly, with 79 reported spillover events from April 2001 through April 2014, and our study includes all but three known outbreaks of Nipah virus with person-to-person transmission.23,30,35
This study highlights patient characteristics and contact behaviors that may be related to Nipah virus person-to-person transmission. Interventions should aim to reduce exposure to body fluids, particularly oral secretions, and target prevention strategies for persons who have sustained contact with infected patients.
Supplementary Material
Acknowledgments
Supported by a grant (2R01-TW005869) from the National Institutes of Health; by the CDC; by support from the Laboratory of Excellence Integrative Biology of Emerging Infectious Diseases (to Drs. Nikolay and Cauchemez); by support from the National Institute of General Medical Sciences Models of Infectious Disease Agent Study Initiative (to Drs. Nikolay and Cauchemez); by support from the INCEPTION project (PIA/ANR-16-CONV-0005) (to Drs. Nikolay, Salje, and Cauchemez); by support from the AXA Research Fund (to Drs. Nikolay and Cauchemez); and by core or unrestricted support from the governments of Bangladesh, Canada, Sweden, and the United Kingdom.
Footnotes
The findings and conclusions in this report are those of the authors and do not necessarily represent the official position of the Centers for Disease Control and Prevention (CDC).
Disclosure forms provided by the authors are available with the full text of this article at NEJM.org.
references
- 1.Luby SP, Hossain MJ, Gurley ES, et al. Recurrent zoonotic transmission of Nipah virus into humans, Bangladesh, 2001-2007. Emerg Infect Dis 2009;15:1229–35. [DOI] [PMC free article] [PubMed] [Google Scholar]
- 2.Hossain MJ, Gurley ES, Montgomery JM, et al. Clinical presentation of Nipah virus infection in Bangladesh. Clin Infect Dis 2008;46:977–84. [DOI] [PubMed] [Google Scholar]
- 3.2017 Annual review of diseases prioritized under the research and development blueprint. Geneva: World Health Organization, 2017. [Google Scholar]
- 4.Chakraborty A, Sazzad HM, Hossain MJ, et al. Evolving epidemiology of Nipah virus infection in Bangladesh: evidence from outbreaks during 2010-2011. Epidemiol Infect 2016;144:371–80. [DOI] [PMC free article] [PubMed] [Google Scholar]
- 5.Gurley ES, Montgomery JM, Hossain MJ, et al. Person-to-person transmission of Nipah virus in a Bangladeshi community. Emerg Infect Dis 2007;13: 1031–7. [DOI] [PMC free article] [PubMed] [Google Scholar]
- 6.Homaira N, Rahman M, Hossain MJ, et al. Nipah virus outbreak with person-to-person transmission in a district of Bangladesh, 2007. Epidemiol Infect 2010; 138:1630–6. [DOI] [PMC free article] [PubMed] [Google Scholar]
- 7.Sazzad HM, Hossain MJ, Gurley ES, et al. Nipah virus infection outbreak with nosocomial and corpse-to-human trans-mission, Bangladesh. Emerg Infect Dis 2013;19:210–7. [DOI] [PMC free article] [PubMed] [Google Scholar]
- 8.Chua KB, Lam SK, Goh KJ, et al. The presence of Nipah virus in respiratory secretions and urine of patients during an outbreak of Nipah virus encephalitis in Malaysia. J Infect 2001;42:40–3. [DOI] [PubMed] [Google Scholar]
- 9.Harcourt BH, Lowe L, Tamin A, et al. Genetic characterization of Nipah virus, Bangladesh, 2004. Emerg Infect Dis 2005; 11:1594–7. [DOI] [PMC free article] [PubMed] [Google Scholar]
- 10.Hassan MZ, Sazzad HMS, Luby SP, et al. Nipah virus contamination of hospital surfaces during outbreaks, Bangladesh, 2013-2014. Emerg Infect Dis 2018;24:15–21. [DOI] [PMC free article] [PubMed] [Google Scholar]
- 11.Lo MK, Lowe L, Hummel KB, et al. Characterization of Nipah virus from out-breaks in Bangladesh, 2008-2010. Emerg Infect Dis 2012;18:248–55. [DOI] [PMC free article] [PubMed] [Google Scholar]
- 12.Hegde ST, Sazzad HM, Hossain MJ, et al. Investigating rare risk factors for Nipah virus in Bangladesh: 2001-2012. Ecohealth 2016;13:720–8. [DOI] [PMC free article] [PubMed] [Google Scholar]
- 13.Homaira N, Rahman M, Hossain MJ, et al. Cluster of Nipah virus infection, Kushtia District, Bangladesh, 2007. PLoS One 2010;5(10):e13570. [DOI] [PMC free article] [PubMed] [Google Scholar]
- 14.Hsu VP, Hossain MJ, Parashar UD, et al. Nipah virus encephalitis reemergence, Bangladesh. Emerg Infect Dis 2004;10: 2082–7. [DOI] [PMC free article] [PubMed] [Google Scholar]
- 15.Islam MS, Sazzad HM, Satter SM, et al. Nipah virus transmission from bats to humans associated with drinking traditional liquor made from date palm sap, Bangladesh, 2011-2014. Emerg Infect Dis 2016;22:664–70. [DOI] [PMC free article] [PubMed] [Google Scholar]
- 16.Montgomery JM, Hossain MJ, Gurley E, et al. Risk factors for Nipah virus en-cephalitis in Bangladesh. Emerg Infect Dis 2008;14:1526–32. [DOI] [PMC free article] [PubMed] [Google Scholar]
- 17.Naser AM, Hossain MJ, Sazzad HM, et al. Integrated cluster- and case-based surveillance for detecting stage III zoo-notic pathogens: an example of Nipah virus surveillance in Bangladesh. Epidemiol Infect 2015;143:1922–30. [DOI] [PMC free article] [PubMed] [Google Scholar]
- 18.Rahman MA, Hossain MJ, Sultana S, et al. Date palm sap linked to Nipah virus outbreak in Bangladesh, 2008. Vector Borne Zoonotic Dis 2012;12:65–72. [DOI] [PubMed] [Google Scholar]
- 19.Sazzad HM, Luby SP, Stroher U, et al. Exposure-based screening for Nipah virus encephalitis, Bangladesh. Emerg Infect Dis 2015;21:349–51. [DOI] [PMC free article] [PubMed] [Google Scholar]
- 20.Ching PK, de los Reyes VC, Sucaldito MN, et al. Outbreak of henipavirus infection, Philippines, 2014. Emerg Infect Dis 2015;21:328–31. [DOI] [PMC free article] [PubMed] [Google Scholar]
- 21.Nipah virus outbreaks in the WHO South-East Asia Region. Geneva: World Health Organization; (http://www.searo.who.int/entity/emerging_diseases/links/nipah_virus_outbreaks_sear/en/). [Google Scholar]
- 22.Nipah virus infection. Geneva: World health Organization, 2017. (http://www.searo.who.int/entity/emerging_diseases/links/CDS_Nipah_Virus.pdf). [Google Scholar]
- 23.Paul L Nipah virus in Kerala: a deadly Zoonosis. Clin Microbiol Infect 2018;24: 1113–4. [DOI] [PubMed] [Google Scholar]
- 24.Daniels P, Ksiazek T, Eaton BT. Laboratory diagnosis of Nipah and Hendra virus infections. Microbes Infect 2001;3: 289–95. [DOI] [PubMed] [Google Scholar]
- 25.Lloyd-Smith JO, Schreiber SJ, Kopp PE, Getz WM. Superspreading and the effect of individual variation on disease emergence. Nature 2005;438:355–9. [DOI] [PMC free article] [PubMed] [Google Scholar]
- 26.Luby SP. The pandemic potential of Nipah virus. Antiviral Res 2013;100:38–43. [DOI] [PubMed] [Google Scholar]
- 27.Zaman S Poverty and violence, frustration and inventiveness: hospital ward life in Bangladesh. Soc Sci Med 2004;59: 2025–36. [DOI] [PubMed] [Google Scholar]
- 28.Hadley MB, Blum LS, Mujaddid S, et al. Why Bangladeshi nurses avoid ‘nursing’: social and structural factors on hospital wards in Bangladesh. Soc Sci Med 2007; 64:1166–77. [DOI] [PubMed] [Google Scholar]
- 29.Islam MS, Luby SP, Sultana R, et al. Family caregivers in public tertiary care hospitals in Bangladesh: risks and oppor-tunities for infection control. Am J Infect Control 2014;42:305–10. [DOI] [PMC free article] [PubMed] [Google Scholar]
- 30.Chadha MS, Comer JA, Lowe L, et al. Nipah virus-associated encephalitis out-break, Siliguri, India. Emerg Infect Dis 2006;12:235–40. [DOI] [PMC free article] [PubMed] [Google Scholar]
- 31.Goh KJ, Tan CT, Chew NK, et al. Clinical features of Nipah virus encephalitis among pig farmers in Malaysia. N Engl J Med 2000;342:1229–35. [DOI] [PubMed] [Google Scholar]
- 32.Luby SP, Gurley ES. Epidemiology of henipaviruses In: Shapshak P, Sinnot JT, Somboonwit C, Kuhn JH, eds. Global virology I: identifying and investigating viral diseases. New York: Springer Science+ Business Media, 2015. [Google Scholar]
- 33.Faye O, Andronico A, Faye O, et al. Use of viremia to evaluate the baseline case fatality ratio of Ebola virus disease and inform treatment studies: a retro-spective cohort study. PLoS Med 2015; 12(12):e1001908. [DOI] [PMC free article] [PubMed] [Google Scholar]
- 34.Faye O, Boelle PY, Heleze E, et al. Chains of transmission and control of Ebola virus disease in Conakry, Guinea, in 2014: an observational study. Lancet Infect Dis 2015;15:320–6. [DOI] [PMC free article] [PubMed] [Google Scholar]
- 35.Arankalle VA, Bandyopadhyay BT, Ramdasi AY, et al. Genomic characterization of Nipah virus, West Bengal, India. Emerg Infect Dis 2011;17:907–9. [DOI] [PMC free article] [PubMed] [Google Scholar]
Associated Data
This section collects any data citations, data availability statements, or supplementary materials included in this article.