


Abstract
Histone H4 acetylation at Lysine 16 (H4K16ac) is a key epigenetic mark involved in gene regulation, DNA repair and chromatin remodeling, and though it is known to be essential for embryonic development, its role during adult life is still poorly understood. Here we show that this lysine is massively hyperacetylated in peripheral neutrophils. Genome-wide mapping of H4K16ac in terminally differentiated blood cells, along with functional experiments, supported a role for this histone post-translational modification in the regulation of cell differentiation and apoptosis in the hematopoietic system. Furthermore, in neutrophils, H4K16ac was enriched at specific DNA repeats. These DNA regions presented an accessible chromatin conformation and were associated with the cleavage sites that generate the 50 kb DNA fragments during the first stages of programmed cell death. Our results thus suggest that H4K16ac plays a dual role in myeloid cells as it not only regulates differentiation and apoptosis, but it also exhibits a non-canonical structural role in poising chromatin for cleavage at an early stage of neutrophil cell death.
INTRODUCTION
Histone post-translational modifications (PTMs) play an important role in the regulation of chromatin structure and have been associated with the regulation of gene expression (1–3). Consequently, histone PTMs are one of the central epigenetic modifications involved in embryonic development and cell differentiation, as well as in pathological conditions including cancer.
Hematopoiesis is a very dynamic spatial-temporal-regulated process controlling the homeostasis of the hematopoietic system throughout the entire lifespan of an individual. It is maintained by the activity of rare self-renewing, long-lived hematopoietic stem cells (HSCs) which are capable of giving rise to all blood cell lineages whereby multipotent progenitors transit multiple decision points while becoming increasingly lineage-restricted. Loss of such homeostasis underlies hematopoietic defects affecting erythro-myeloid and lymphoid lineages, resulting in life-threating malignancies, infections, anemia and bleeding. The activation and repression of specific gene programs during hematopoiesis is highly regulated by epigenetic mechanisms (2), PTMs playing a central role (4). One of these histone PTMs, histone H4 acetylation at Lysine 16 (H4K16ac), can regulate the expression of HOX9 (5,6), a gene involved in the hematopoietic commitment of embryonic stem cells (7). In line with this, it has been proposed that the major H4K16 histone acetyltransferase KAT8 (also known as males absent on the first (MOF), or MYST1) (8) is central to the maintenance of hematopoietic stem cell (HSC) target genes (9). The H4K16ac-specific NADH-dependent histone deacetylase Sirt1 also plays an important role in hematopoiesis (6,10), and, in addition, HDAC1 and HDAC2, which can deacetylate H4K16ac, are highly regulated during hematopoietic differentiation (11) and may be essential for HSC homeostasis (12).
Mice carrying null mutations of Kat8 revealed that H4K16ac is necessary for normal development and the maintenance of normal distribution of euchromatin in mammals (13), although accompanying molecular events were not studied due to the very early death of the preimplantation embryos. At a physicochemical level, acetylation of H4K16 was shown to regulate both higher order chromatin structure and functional interactions between non-histone proteins and the chromatin fiber (14), which could explain the biological role of this histone PTM in transcriptional activation (14–16).
In addition to the regulation of hematopoietic genes, H4K16ac has been associated with apoptosis and cell death, and, specifically, to have an important role in the repression of apoptotic genes in human cancer (17,18), which is in line with the capacity of HDAC inhibitors to induce apoptosis (19,20). Interestingly global levels of H4K16 acetylation are reduced in various types of tumor (21–24), and decreased levels of KAT8 (23,25–29) and increased levels of HDACs (19,30–33) are often found in cancer cells. In accordance with this, it has been demonstrated that H4K16 acetylation controls the sensitization of multidrug-resistant cancer cells to topoisomerase inhibitors (34,35), supporting the notion that this histone modification might play a general role in apoptosis, although the underlying molecular mechanisms involved remain elusive.
The role of H4K16ac in apoptosis might have implications in the regulation of the outcome of autophagy since high levels of this histone PTM have been shown to promote cell death responses upon autophagy induction (36). In the same vein both KAT8 and H4K16ac have been shown to be essential in the DNA damage response and for double-strand break repair (37), a role that may be mediated, at least in part, by the modulation of the recruitment of DNA damage repair proteins (38).
In this study, the initial discovery that human peripheral blood (PB) neutrophils are massively hyperacetylated at H4K16 as compared to other blood cell types, including CD34+ progenitors, CD19+ B cells, CD3+ T cells, CD15+ CD16− eosinophils and CD15+ CD16+ neutrophils, led us to investigate in more detail, both in vitro and in vivo, the role of this histone PTM in hematopoiesis. Our results indicate that H4K16ac plays a complex role in this process, which has implications in terms of gene regulation and, more importantly, for the regulation of neutrophil chromatin structure and apoptosis. Neutrophil homeostasis is tightly regulated by a process known as neutrophil constitutive apoptosis, a type of programmed cell death that shares many features of classical apoptosis (39,40). Although the underlying molecular mechanisms are still not fully understood, our results suggest that nuclear chromatin and, in particular H4K16ac, may play an important role in the process.
MATERIALS AND METHODS
Purification of peripheral white blood cells
Blood samples from 26 healthy donors and from two patients with eosinophilia resulting from asthma exacerbation were collected from the Hospital Universitario Central de Asturias (HUCA). The study was approved by the Clinical Research Ethics Committee of HUCA and all the individuals provided written informed consent. Mononuclear cells (MNC) and granulocytes were separated from whole blood by density gradient centrifugation using a standard Ficoll protocol (Histopaque-1077, Sigma-Aldrich, 10771). After lysing red cells (BioLegend, 420301), we performed the isolation from the MNC fraction of CD3+ T cells, and CD15+ CD16+ neutrophils or CD15+ CD16− eosinophils from the granulocyte fraction (eosinophils from patients), using the corresponding selection of the AutoMACS system (130-050-101 for CD3, 130-046-601 for CD15, 130-092-010 for CD16) (Miltenyi Biotec). Cells were collected for subsequent analyses. Blood samples from 18 Pelger-Hüet individuals were collected at Hospital Universitario La Fe (Valencia) with the corresponding informed consent. Histones were isolated from those samples for mass spectrometry analysis. Another set of MNCs was isolated by density gradient centrifugation using Ficoll-Hypaque from 20 umbilical cord samples collected, with Clinical Research Ethics Committee approval, by Banc de Sang i Teixits (Barcelona). After lysing red cells, the CD34+ cells were purified by magnetic bead separation using the human CD34 MicroBead kit (130-046-703, Miltenyi Biotec) and the AutoMACS Pro-separator (Miltenyi Biotec) as per the manufacter's instructions and the cells collected for subsequent analyses.
High-performance capillary electrophoresis (HPCE) quantification of global histone acetylation
Histone acid extraction (sulfuric acid + acetone precipitation) and global histone acetylation was performed as previously described (41,42) with slight modifications. In brief, individual fractions of histones H4, H3, H2A and H2B were purified by reversed-phase high-performance liquid chromatography (HPLC) on a Jupiter C18 column (Phenomenex, Inc.) and eluted with an acetonitrile gradient (20–60%) in 0.3% trifluoroacetic acid using an HPLC gradient system (Beckman Coulter). Acetylated histone derivatives were resolved by high-performance capillary electrophoresis (HPCE) using an uncoated fused-silica capillary tubing (Beckman-Coulter; 60.2 cm × 75 μm, effective length 50 cm) in a capillary electrophoresis system (P/ACE MDQ, Beckman-Coulter) with 100 mM phosphate buffer (pH 2.0) 0.02% (w/v) HPM-cellulose as running buffer and an operating voltage of 12 kV.
Western blotting
Histones were separated on a 17% sodium dodecyl sulfate-polyacrylamide gel electrophoresis (SDS-PAGE) and transferred to a 45-μm-pore polyvinylidene difluoride (PVDF) membrane (Immobilon PSQ, Millipore). The membrane was blocked in 5% BSA/TBS-T (Tris-buffered saline with 0.1% Tween-20) and immunoprobed with antibodies to acetylation at lysine 16 of histone H4 (H4K16ac) (Millipore, 07–329), and using histone H3 (Abcam, ab1791) as a loading control. The secondary antibody used was anti-rabbit IgG conjugated to horseradish peroxidase (Amersham Biosciences, NA934) at 1:3000 dilution in TBS-T. Primary antibodies were prepared for incubation in 5% BSA in TBS-T while secondary antibody was blocked with 5% milk in TBS-T. Signals were detected with ECL detection kit (Amersham Biosciences). Protein bands were quantified using ImageJ software (Rasband, W.S., ImageJ, U.S. National Institutes of Health, Bethesda, MD, USA, https://imagej.nih.gov/ij/, 1997–2018).
Mass spectrometry assays
Histone H4 preparation for mass spectrometry
Bands corresponding to histone H4 were excised from SDS-PAGE gels and processed as previously described (43) with minor modifications. Briefly, after destaining the gel pieces with 0.1 M ammonium bicarbonate in 30% HPLC-grade acetonitrile, samples were washed twice with 70% HPLC-grade methanol and acylated at RT with propanoic anhydride. To this end, 15 μl 0.71 M propanoic anhydride in 70% methanol was added to each sample and, after 2.0 min incubation at RT, 40 μl 1M ammonium bicarbonate was added to each crude. Reactions were kept at RT for a further 15 min, then the gel pieces were washed again with 70% methanol and the acylation was repeated once more. Next, the gel pieces were washed sequentially with 0.1 M ammonium bicarbonate, water, 50% acetonitrile, and then shrunk with 100% acetonitrile. Proteins were then digested over night at 37°C with 0.26 μg trypsin (Trypsin Gold, Promega) per sample, according the manufacturer's instructions.
Analysis of H4 acetylation by MALDI-TOF/TOF mass spectrometry
Three 1 μl and three 0.5 μl aliquots of each crude were spotted onto a stainless steel MALDI target plate, allowed to dry, overlaid with 0.5 μl freshly prepared, ice-cold 5 mg/ml alpha-cyano-4-hydroxy cinnamic acid (ultra-pure, for mass spectrometry, Fluka) in 50% acetonitrile/0.3% TFA, and then dried again. Spectra were recorded in a MALDI-TOF/TOF instrument (4800, Applied Biosystems) operated according to the manufacturer's instructions. MS1 spectra were acquired in the reflector modus, setting the m/z window between 700 and 2500 and the focus on 1500, with 20 sub-spectra (50 shots each) being collected per spot. Tandem spectra (MS2) of the unmodified and monoacetylated forms of the peptide 4–17 were recorded with 1 kV collision energy without the use of collision gas (CID off), with the isolation window width set to 2.0 Da, and 55 sub-spectra (50 shots of each) were collected per spot. For all MS and MS/MS spectra, the laser intensity was manually adjusted for a good S/N.
MS1 spectra were processed with mMass 5.5.0 (44,45). Each spectrum was recalibrated by using the signals of peptides 46–55 and 79–92 and deisotoped. Next, the relative proportion of a given form of the peptide 4–17 was calculated by dividing the absolute intensity of its monoisotopic peak by the sum of the intensities of the monoisotopic peaks corresponding to the unmodified, mono- and diacetylated peptide 4–17. Finally, the results for all the spectra acquired from each sample were averaged and minimum and maximum values were extracted.
Generation of a conditional Kat8-deficient mouse model
A targeting construct for the Kat8 locus was created through a previously described recombineering-specific methodology (46). Briefly, loxP sites were introduced between exons 1 and 2, and between exons 5 and 6. This resulted in a mouse strain in which bases 2373–8550 (incorporating exons 2–5) 3′ from the start point of translation, could be deleted leaving a single loxP site between exons 1 and 6 (13). These mice were crossed with a CreERT2 strain which allowed the removal of exons 2–5 in a tamoxifen-dependent manner (47). Mice were maintained on a C57BL/6 background, fed ad libitum, and housed under a 12-h light-dark cycle. PCR genotyping was performed using the oligonucleotides in Supplementary Table S1. The PCR products consisted of fragments of 422 bp (WT allele), 509 bp (floxed allele) and 277 bp (excised allele).
Animal experiments were conducted in accordance with the guidelines of the Committee for Animal Experimentation of the Universidad de Oviedo. To induce Kat8 deletion, tamoxifen (Sigma-Aldrich, T5648) was administrated by oral gavage at a dose of 6 mg tamoxifen/40 g body weight for a total of 7 days. For hematological determinations, blood was extracted from the mandibular sinus of mice anesthetized with isoflurane. Blood samples were analyzed using Abacus junior vet equipment (Diatron Labs).
Details of the in vitro murine neutrophil differentiation assays and the subsequent analyses are available in Supplementary Materials and Methods.
ChIP-seq
For high-throughput sequencing of H4K16ac-enriched genomic regions (ChIP-seq), CD3+ T cells and neutrophils isolated from human peripheral blood of 5 donors (Supplementary Table S2) were freshly processed using the SimpleChIP Enzymatic Chromatin IP Kit (Magnetic Beads) (Cell Signaling, 9003). The amount of Microccocal Nuclease required to digest DNA to the optimal length was determined as 2.5 μl per 2 × 10⁷ cells. Library preparation and sequencing were performed at Centre de Regulació Genòmica (CRG) in Barcelona on an Illumina HiSeq 2000 system in 50-single end mode.
A detailed description of the bioinformatic analysis of Chip-seq data is available in Supplementary Materials and Methods.
Cell culture and in vitro treatments of HL60 cell line
The human HL-60 cell line was grown in Gibco RPMI 1640 medium supplemented with 10% FBS (Sigma-Aldrich, F6178), 100 U/ml penicillin along with 100 μg/ml streptomycin (Gibco, 15070) and 2.5 μg/ml amphotericin B (Gibco, 15290) at 37°C in a humidified atmosphere with 5% CO2.
Differentiation was induced by treatment with 1 μM ATRA (Sigma-Aldrich, R2625) and/or 1.25% DMSO (Sigma-Aldrich, D5879) for 72 h. Etoposide (Sigma-Aldrich, E1383) treatment was carried out at a concentration of 5 and 10 μM and cells were collected after 1, 2, 3, 4 and 5 h for the lower or 1, 2 and 3 h for the higher concentration. Treatment with the HDAC inhibitor SAHA was carried out at 1 μM for 48 h. The KAT8 overexpression vector was generated as previously described (48). Opti-MEM (Gibco, 31985) and Lipofectamine 3000 transfection reagent (Invitrogen Corp., L3000015) were used for the transient transfection of plasmid DNA. shKAT8 lentiviral expression vectors were obtained from OriGene (Rockville, MD). The cells were collected 72 h after transfection.
Apoptosis related to Annexin V detection was determined using the FITC Annexin V Apoptosis Detection Kit with 7-AAD (BioLegend, 640922) or the antibody Dye 634 Annexin V (Immunostep, ANXVDY) depending on the experiment, using a Facs Aria IIu flow cytometer and FACSDiva v8.02 software (Becton Dickinson) Cell cycle phases and debris percentage were analyzed using propidium iodide (Sigma-Aldrich, P4170) as previously described (49,50). Data were acquired using a Cytomics FC500 Flow Cytometer (Beckman Coulter) and analyzed using CXP Software (Beckman Coulter 2006) and ModFit LT 3.0 (Verity Software House).
Quantitative real-time reverse transcriptase polymerase chain reaction (qRT-PCR)
Cells for RNA extraction were pelleted and immediately frozen in dry ice. Storage was performed at -80°C. Total RNA was isolated using TRIzol Reagent (Life Technologies, Ref. 15596) following manufacturer′s instructions. Chloroform (Ref. 1.02445.100) was purchased from Merck; and isopropanol (Ref. 1.09634.100) and ethanol (Ref. 100983) from Merck-Millipore. To remove any possible contamination by DNA, 10 ug of total RNA were treated with DNase I (Turbo DNA-free kit, Ambion-Life Technologies, Ref. AM1906) according to supplier's protocol.
RNA was quantified both before and after DNase treatment with Nanodrop (ThermoScientific) checking purity as A260/280 ratio. One microgram of total DNA-free RNA was reverse-transcribed in 20 ul of final reaction volume using Oligo(dT)12–18 Primer (Invitrogen, Ref. 18418) and dNTP Mix (Invitrogen, Ref. 18427) in combination with SuperScript™ III Reverse Transcriptase (Invitrogen, Ref. 18080) and RNaseOUT™ Recombinant RNase Inhibitor (Invitrogen, Ref. 10777). After cDNA synthesis, 1 μl (2 units) of E. coli RNase H (Invitrogen, Ref.18021) was added and each sample was incubated at 37°C for 20 min to finally remove RNA complementary to the cDNA. All the process was performed following the instructions detailed for SuperScript™ III RT (Invitrogen, Ref. 18080).
Real-time PCR was carried out for each sample of cDNA using 2× SYBR Green PCR Master Mix (Applied Biosystems, 4309155). All measurements were performed in triplicate, non-template controls were included, and a calibration curve was determined for each primer set. PCR reactions were run and analyzed using the StepOnePlus™ Real-Time PCR System (Applied Biosystems). Gene expression was normalized using GAPDH as endogenous control for human samples (51) and beta Actin for mouse samples and analyzed by the comparative threshold (ΔΔCt) method. All primers were acquired from Sigma-Aldrich. Oligonucleotide sequences are listed in Supplementary Table S1.
CB collection and CD34+ HSPC isolation for KAT8 down-regulation on human primary cells
Fresh umbilical cord blood (CB) units from healthy neonates were obtained from the Banc de Sang i Teixits, Barcelona, upon approval by the Ethics and Biohazard Board Committee. CB samples were pooled to reduce variability among individual CB units. Mononuclear cells were isolated using Ficoll-Hypaque and after lysing the red cells (Cytognos, Salamanca, Spain), CD34+ cells were purified by magnetic bead separation using the human CD34 MicroBead kit and the AutoMACS Pro separator (Miltenyi Biotec, Bergish Gladbach, Germany) as per manufacturer's instructions (52–54). Purity of the CD34+ fraction was assessed by flow cytometry using anti-CD34-PE (BD Bioscience, San Jose, CA, USA) and only CD34+ fractions showing purity >95% were used (52,53).
Details of the KAT8 down-regulation (shKAT8) assays in human CD34+ progenitors and the subsequent analyses following induction of neutrophil differentiation are available in Supplementary Materials and Methods.
Pulsed field gel electrophoresis
Temperature-dependent induction of synchronous neutrophil apoptosis
For the arrest of neutrophils and the subsequent induction of synchronous apoptosis, we followed the protocol described by Pryde et al. (55) with minor modifications. Briefly, neutrophils were cultured in T75 flasks (Corning) at 1 × 10⁶ cells/ml in Gibco RPMI 1640 growth medium supplemented with 100 U/ml penicillin and 100 μg/ml streptomycin (Gibco), 250 μg/ml amphotericin B (Gibco), 10% (v/v) autologous serum, 25 mM HEPES (Merck), 0.2% (w/v) albumin from bovine serum (BSA, Sigma-Aldrich), and 20 μg/ml cycloheximide (Sigma-Aldrich). After incubation at 15°C for 20 h, neutrophils underwent apoptosis synchronously when the temperature was raised to 37°C. The cells for the preparation of agarose plugs were collected 2 h after the temperature shift.
Preparation of agarose plugs and Pulsed Field Gel Electrophoresis (PFGE)
CD15+ CD16+ neutrophil DNA embedded in agarose plugs was prepared as follows: about 5 × 10⁶ cells for each 100 μl of agarose plug to be made were collected, washed once with 1× PBS (Oxoid), and resuspended in 35 μl of 50 mM EDTA (Merk), 10 mM Tris (pH 7.5) (Roche). The suspension was quickly warmed at 42°C and mixed with 65 μl of prewarmed 1% low melt agarose (NuSieve GTG Low Melting Temperature Agarose, Lonza) and 125 mM EDTA. The suspension was distributed into well plug molds placed on a cool surface. The plugs were extruded and incubated overnight at 53°C without agitation in 600 μl of 500 mM EDTA, 10 mM Tris (pH 8.0), 1% (w/v) N-Laurylsarcosine (Sigma-Aldrich), and 0.4 mg/ml Proteinase K (Roche). Plugs were soaked for 1 h three times in 1 ml of 50 mM EDTA, and 10 mM Tris (pH 7.5). As positive controls, 50kb random fragments from a pool of samples were prepared as follows: concentrations of genomic DNA from neutrophils were determined with a Qubit 2.0 fluorometer (Life Technologies). About 4 μg of DNA from each sample was sonicated using a Bioruptor UCD-200 sonication device (Diagenode) performing for 2–4 min bursts in low power mode in order to shear the DNA into 50 kb fragments. Sonicated samples were subjected to PFGE in liquid form under the same running conditions described above.
Pulsed field electrophoresis was carried out in a 0.9% agarose gel (D5 agarose, Conda) in 0.5× TBE at 14°C with a CHEF DR III from Bio-Rad with a switch time ramping from 5 to 30 s over a 22 h period, to resolve fragments from 20 to 400 kb. Lambda ladder was used as size marker for PFGE (New England Biolabs). For DNA extraction, the portion of the gel containing the 50 kb DNA fragments of interest was excised. The agarose was melted at 55°C and the DNA extracted using the QIAEX II Gel Extraction Kit (QIAGEN).
Bisulfite pyrosequencing
DNA methylation patterns of Alu repetitive sequences were analyzed by bisulfite pyrosequencing in neutrophils and CD3+ T cells. Bisulfite modification of DNA was performed with the EZ DNA methylation-gold kit (Zymo Research) following the manufacturer's instructions. The set of primers for PCR amplification and sequencing were designed using the specific software PyroMark assay design (version 2.0.01.15) (Supplementary Table S1). After PCR amplification, pyrosequencing was performed using PyroMark Q24 reagents and a vacuum prep workstation, equipment, and software (Qiagen).
Immunofluorescence
For immunofluorescence experiments 2 × 10⁵ cells were adhered to slides by Cytospin centrifugation (Thermo Scientific). Samples were fixed with 4% formaldehyde for 15 min at room temperature, and permeabilized with 1× PBS/0.1% Triton X-100 (X100 Sigma-Aldrich) for 20 min at room temperature. Blocking was performed with 1× PBS/10% BSA (A7906 Sigma-Aldrich) for one hour at room temperature, followed by incubation with the primary antibody rabbit anti-H4K16ac (07-329, Merck Millipore) at 1:500 dilution in antibody diluent (EnVision FLEX DM830 Dako), O/N at 4°C. Secondary antibody chicken anti-rabbit IgG Alexa Fluor 488 (A-21441 Invitrogen) at 1:500 dilution, was incubated for 1 h at room temperature and protected from light. Finally, slides were mounted using EverBrite mounting medium with 4′,6-diamidino-2-phenylindole (DAPI) (23002 Biotium).
Immunofluorescence images were obtained using a Zeiss microscope equipped with a 63×/1.4 NA immersion lens, and an AxioCam MRm camera (Carl Zeiss). DAPI and H4K16ac images were acquired sequentially for a total of 10 z-sections (Z step of 5 μm) with at the appropriate emission wavelengths. Fluorescence intensity measurements were performed using the ZEN lite software (ZEN lite 2.3 SP1, Carl Zeiss).
For immunofluorescence analysis of HL60 confluence experiment, cells were fixed in acetone at −20°C for 20 min, washed with PBS, and incubated with primary antibodies overnight at 4°C at 1:100 dilutions. Next, fluorescent-conjugate secondary antibodies (Alexa fluor 488–conjugated goat anti-rabbit IgG from Serotec and CyTM3-conjugated donkey anti-mouse antibody from Jackson-ImmunoResearch) at 1:100 dilution were added to the fixed cells, which were then incubated for 1 h at room temperature in a darkened humidity chamber. Finally, samples were counterstained and mounted with DAPI (10 ng/ml; Sigma-Aldrich) diluted 1:1000 in fluoromount G (SouthernBiotech). Confocal immunofluorescence micrographs were captured with a TCS-SP2-AOBS confocal microscope (Leica Microsystems).
Chromatin accessibility assay
For the analysis of chromatin accessibility in multiple repetitive elements, 1 × 10⁶ CD15+ CD16+ neutrophils and 1 × 10⁶ CD3+ lymphocytes from four donors were subjected to chromatin extraction and nuclease digestion according to manufacturer's instructions (EpiQuik Chromatin Accessibility Assay kit, P-1047 Epigentek). Purified DNA was analyzed via real time qPCR using primers for different repeats (see Supplementary Table S1). Fold enrichment (FE) was calculated as the ratio of amplification efficiency (Ct) of the digested DNA sample over that of the non-digested sample. Large Ct shifts between digested and undigested samples, rendering high FE%, indicated that the target region was in the open chromatin, while minimal Ct shifts, resulting in low FE%, indicated that the target region was in the closed chromatin.
Formaldehyde-Assisted isolation of regulatory elements (FAIRE) quantitative PCR (FAIRE-qPCR)
For the FAIRE analyses we followed the protocol for suspension cells described by Simon et al. (56,57), using 1 × 10⁷ CD15+ CD16+ neutrophils and 1 × 10⁷ CD3+ lymphocytes from four different healthy donors as starting material. The enriched fragments were detected by real time qPCR using primers for different repeats (see Supplementary Table S1).
Histological analysis
Mouse tissues were fixed in 4% buffered paraformaldehyde solution. Paraffin sections were stained with hematoxylin and eosin. The May-Grünwald-Giemsa staining procedure was followed to study human blood smears.
Chromatin immunoprecipitation assays and real-time PCR quantification (qChIP)
For the preparation of crosslinked chromatin, fresh samples were incubated in PBS with 1% formaldehyde for 10 min at RT. Crosslinking was stopped by the addition of glycine to 125 mM, and cells were washed in PBS. All subsequent procedures were performed on ice, with buffers containing the protease inhibitors (Complete EDTA-free) as previously described (58). Sonication yielded chromatin fragments of 150–500 bp in length. Immunoprecipitations were performed using antibodies against H4K16ac (Active Motif, 39167), total histone H3 (Abcam, ab1791) as positive control, or IgG antiserum (Abcam, ab46540) as negative control.
After testing the PCR amplification sensitivity of primers, quantitative real-time PCR analysis was performed for each specific region using SYBR® Green of the StepOnePlus™ Real-Time PCR System (Applied Biosystems). All measurements were performed in triplicate, non-template controls were included, and a calibration curve was determined for each primer set. Three independent experiments were tested for each sequence. Oligonucleotide sequences are listed in Supplementary Table S1.
Heat density scatterplots
Two-dimensional kernel density estimations were generated with the Bioconductor R-package MASS (7.3–47). H4K16ac and DAPI signals were normalized by the maximum intensities obtained for each of the experiments prior to the computation step. The resulting data comprised 9198 and 5925 pairwise data points (H4K16ac and DAPI normalized intensities) across longitudinal sections of the cell corresponding to observations from neutrophils (n = 72) or CD3+ cells (n = 62), respectively.
RESULTS
Global H4K16 hyperacetylation in PB neutrophils
To study the possible role of H4K16ac in the hematopoietic system we first used HPLC and HPCE to analyze the global levels of H4 acetylation in different human blood cell types. Intriguingly, we found a 1.7-fold relative increase in the monoacetylation of H4K16 in neutrophils (CD15+ CD16+) compared with CD3+ T cells, which, in absolute terms, implies an increase in H4K16ac in over 20% of the neutrophil genome (Figure 1A). Analysis of other acetylated forms of H4 (59), showed that the relative percentage of diacetylated isoforms (where Lysine 12 and 16 are acetylated) was slightly lower in neutrophils (Supplementary Figure S1A), and tri- and tetracetylated isoforms (where, respectively, Lysines 8, 12 and 16 or Lysines 5, 8, 12 and 16 are acetylated) were not detected in blood cells with this technology. Histone H3 and histone H2B did not show any substantial changes in global acetylation between CD15+ CD16+ and CD3+ T cells (Supplementary Figure S1B).
Figure 1.

Global H4K16ac level in different types of blood cell. (A) Global H4 monoacetylation analyzed by HPLC and HPCE in neutrophils (CD15+ CD16+) and CD3+ T cells. Error bars represent standard deviation ***P-value <0.001. On the right, western blot comparing H4K16ac in CD3+ T cells versus neutrophils. H3 was used as loading control. The intensity (relative units) of H4K16ac bands were normalized to H3 and quantified using ImageJ software (numbers below the bands). (B) Levels of monoacetylated histone H4 analyzed by MALDI-TOF in the hematopoietic cells. The error bars indicate the maximum and minimum values obtained from six spectra per sample (technical replicates). (C) Fragment spectra showing that acetylation of the peptide 4–17 primarily occurs on K16 in the samples indicated. The left panel is a zoom of the region encompassing the y4 fragment ion and its acetylated form, while the right panel plots the region corresponding to b9 and its acetylated form. In both panels, the upper spectrum corresponds to the unmodified peptide 4–17 (positive control for y4), the others are the fragment spectra of the monoacetylated peptide 4–17 of the samples indicated. The detection of acetylated y4 but not its unmodified form, as well as the detection of only unmodified b9 indicate that it is mostly K16 that is acetylated. *: impurity.
As it had been previously reported that the majority of histone H4 monoacetylation occurs at H4K16 (60,61), we hypothesized that the global H4 acetylation changes we observed primarily occur at this position. To test this, we used two different approaches. First, we used Western Blotting to analyze the levels of H4K16ac and H4K12ac in several blood cell types, including those previously analyzed by HPLC/HPCE, using antibodies against these histone PTMs. K12 is another lysine residue that has been reported to be acetylated in histone H4 (60,61). The results showed an enrichment of H4K16ac (Figure 1A, and Supplementary Figure S1C) but not of H4K12ac (Supplementary Figure S1d) in neutrophils (CD15+ CD16+), suggesting that, the observed global histone H4 acetylation changes primarily did occur at K16. To corroborate this further, we used mass spectrometry to analyze the levels of H4K16ac in five types of blood cells (CD34+ hematopoietic progenitors, CD19+, CD3+, CD15+ CD16− and CD15+ CD16+). The integration of the signals corresponding to the peptide 4–17 confirmed that the global levels of monoacetylated histone H4 were much higher in myeloid cells than in CD34+ hematopoietic progenitors and B and T cells (Figure 1B). In addition, tandem mass spectrometry revealed that, in all samples analyzed, the great majority of histone H4 monoacetylation occurred at lysine 16 (Figure 1C), thus confirming that H4K16ac is highly regulated in the hematopoietic system.
Genome-wide differential distribution of H4K16ac in terminally differentiated blood cells
To study the role of H4K16ac in blood cells in more detail, we determined the genome-wide distribution of this histone mark in human CD3+ T cells and neutrophils (CD15+ CD16+) combining chromatin immunoprecipitation, targeting this histone mark with high-throughput sequencing (ChIP-seq) (see Materials and Methods).
We generated over 200 million 50-base paired-end reads from H4K16ac enriched and input (control) libraries of CD3+ T cells and neutrophils (Methods, and Supplementary Table S2). Of these raw reads, 191 640 570 (77.33%) in CD3+ cells and 164 229 168 (73.46%) in neutrophils were aligned to one or the other strand of the reference genome (GRCh37/hg19) (Supplementary Table S2). In addition to the unique alignments, other reads aligned in multiple positions (multi-reads or ambiguous reads) (Supplementary Table S2). Similar counts were obtained in four additional independent biological replicates (Supplementary Table S2).
To identify H4K16ac enriched regions (peaks) we used the Model-based Analysis of ChIP-seq (MACS2) algorithm (62), and the corresponding inputs as control samples (see Materials and Methods). We identified a total of 229 474 peaks in CD3+ cells, and 266 860 peaks in neutrophils (Figure 2A; Supplementary Tables S3 and S4). The peak size differed significantly between the two cell types (Wilcoxon rank sum test, P < 2.2e–16): CD3+ showed a median peak size of 615 bp, while that of neutrophils was 2.29 kb (Figure 2A). Consequently, the total length of neutrophil peaks was 611 116 535 bp, covering 19.48 % of the genome, and for CD3+ T cells it was 150 618 607 bp, accounting for only 4.8 % of the genome (Figure 2A). This higher coverage by peaks in neutrophils than in T cells was evident in all chromosomes (Supplementary Figure S2A), confirming the genome-wide level of the global differences between specific blood cell types observed by HPLC/HPCE and mass spectrometry.
Figure 2.

Genomic distribution of H4K16 acetylation in neutrophils and CD3+ T cells. (A) Bar plot showing the number of H4K16ac-enriched peaks identified by ChIP-seq in neutrophils and CD3+ T cells. On the right, a violin plot shows the distribution of the peak size in both cell types, and a bar plot shows the total coverage of the genome in base pairs (bp). (B) Box plot showing the genomic distribution of CpG density for the H4K16ac-enriched peaks in both cell types. Dotted red line represents average CpG density in the genome. (C) Bar plots showing the overlap between H4K16ac-enriched peaks and different genomic regions in both neutrophils and T cells. Violin plots represent a permutation-based null distribution for the specific genomic region overlap ratio for each peak data set. (D) Representative ChIP-seq tracks for H4K16ac in neutrophils and CD3+ T cells. Peaks showing fold change above 1.5 are underlined below the profiles. The RefSeq genes track is shown below. (E) Euler diagrams showing the overlap between peaks of neutrophils and CD3+ T cells, for both the whole genome and the different genomic regions. (F) ChromHMM training of a 12-chromatin states model (left panel) in neutrophils. The central panel shows the enrichment of each of the 12 chromatin states in different genomic features. The right panels show the percentage of neutrophil-specific segments for two neutrophil Blueprint samples (C0010KH2 and C0011lH2).
To study the associations between H4K16ac ChIP-seq peaks and genomic features we determined their distribution throughout the genome. We found that peaks of neutrophils were located in regions with higher CpG densities than those corresponding to the peaks of CD3+ T cells (Wilcoxon rank sum test, P < 2.2e–16) (Figure 2B), irrespective of the chromosome analyzed (Supplementary Figure S2A). In line with these results, neutrophil peaks were located preferentially on CpG islands and GpG shores (Permutation tests, P < 0.01, FC CI = [1.32, 1.43] and P < 0.01, FC CI = [1.92, 2.06] respectively) (Supplementary Figure S2B). Interestingly, a detailed analysis of the relative genomic distribution of ChIP-seq peaks showed a significant overlap between neutrophil peaks and promoter and intragenic regions (Permutation tests, P < 0.01, FC CI = [1.50, 1.61], and P < 0.01, FC CI = [1.28, 1.35] respectively). However, the overlap at intergenic regions was lower than expected in both cell types, and this effect was more pronounced in CD3+ T cells (Permutation tests, P < 0.01, FC CI = [0.69, 0.72] and P < 0.01, FC CI = [0.75, 0.77] respectively) (Figure 2c). Similar results were obtained in four additional independet biological replicates (Supplementary Figure S3).
Further analysis of H4K16ac peaks identified high numbers of associated genes in both neutrophils and T cells (Figure 2D; Supplementary Figure S4; Supplementary Tables S3 and S4). Although the number of common peak-associated genes was high, the genic sequences (in bp) enriched in H4K16ac were cell-type specific, and only 4.2% of the total were common to both CD3+ T cells and neutrophils (Figure 2E).
To find the relationship between H4K16ac and other histone marks in neutrophils, we trained a 12 state model with ChromHMM (63). We identified histone mark combinations reflecting different functional chromatin states (Figure 2F). Interestingly, despite the fact that H4K16ac had a higher correlation with enhancers and actively transcribed states, we identified a specific chromatin state characterized by the presence of H4K16ac alone (state 10). This was one of the most extensive chromatin states (Supplementary Figure S5) and it was enriched in CpG hypermethylated regions (Figure 2F). After segmentation with ChromHMM, 7.71 % of the bins (segment of 200 bp containing H4K16ac) were unique to neutrophils, in concordance with results shown in Figure 2A, and the majority of which overlapped with states 9 and 10, characterized by the presence and absence of H4K16ac respectively (Figure 2F).
H4K16ac and KAT8 play a role in hematopoietic differentiation
To determine whether H4K16ac changes between different types of blood cells reflects a role of this histone PTM in hematopoietic cell differentiation, we first generated an inducible Kat8 knockout mouse model by crossing “floxed" Kat8 mice with tamoxifen-inducible ubiquitous Cre mice (Kat8fl/fl;ER-Cre mice), KAT8 being the principal H4K16 acetyltransferase in mammals (8). Tamoxifen administration (Figure 3A) induced the excission of LoxP-flanked region of Kat8 (Supplementary Figure S6A), and 1 week after the start of the treatment these mice began to lose weight (Figure 3B), and died after three weeks (Figure 3C). The precise cause of death was unclear. However, postmortem pathological examination of the Kat8−/−;ER-Cre mice identified an evident decrease in the size of the spleen, thymus, and liver (Figure 3D). At the microscopic level, all the samples analyzed showed major tissular alterations (Supplementary Figure S6B). To determine the effects of Kat8 deletion in the blood compartiment, we analyzed the levels of peripheral blood cell types using a hematology analyzer (Abacus). This showed that tamoxifen administration markedly reduced the number of white blood cells of Kat8−/−;ER-Cre mice (Figure 3E), affecting both myeloid and lymphoid lineages. Moreover, Kat8 deletion inverted the percentage of myeloid and lymphoid cells present in the blood compared to controls (Figure 3F), suggesting a possible role of Kat8 in blood cells survival.
Figure 3.

Role of H4K16ac in peripheral white blood cells. (A) Diagram showing the timeline for tamoxifen administration in Kat8fl/fl mice with and without the inducible ubiquitous Cre (Kat8fl/fl (n: 5) and Kat8fl/fl;ER-Cre (n: 8)). (B) Weight evolution of control and Kat8−/−;ER-Cre mice after tamoxifen treatment. (C) Kaplan–Meier survival curve showing that Kat8−/−; ER-Cre mice (red line) differs significantly from Kat8fl/fl mice (blue line) (P-value = 0.0011, Kaplan–Meier log-rank test). (D) Representative images of spleen, thymus, and liver from Kat8fl/fl and Kat8−/−;ER-Cre mice showing differences in the size of the organs. Line plots showing (E) differences in total number of white blood cells and (F) percentage of lymphoid and myeloid cells between Kat8fl/fl; ER-Cre and Kat8−/− mice after tamoxifen treatment. (G). Genotype analysis of Kat8 locus using PCR specific primers on genomic DNA from Kat8+/+;ER-Cre (pool, n: 3) as well as Kat8−/−;ER-Cre (pool, n: 3) mice cells after tamoxifen treatment. The double band indicating approximately 30% excision of Kat8 was only detected in mice containing the floxed alleles after treatment with tamoxifen. On the right, RT-qPCR showing downregulation of Kat8 in the cKit+ progenitors. Expression levels determined by real time-qPCR are an average of triplicated measurements (+SD), normalized to transcript levels of beta Actin, and represented as a fold-change relative to the Kat8+/+;ER-Cre control (a t-test showed significant differences; ***P < 0.001). (H) Representative immunofluorescence images showing lower levels of H4K16ac in Kat8−/−;ER-Cre. Average H4K16ac fluorescence intensity was quantified using ZEN lite software (a t-test showed significant differences; **P < 0.01). (I) May Grünwald Giemsa stain (40×) after in vitro differentiation to neutrophils (day 7). (J) Expression of two markers (Collagenase and Gelatinase) of neutrophilic differentiation (Pham, C., Nature Reviews Immunology, 2006) (day 7). Expression levels determined by real time-qPCR are an average of triplicated measurements (+SD), normalized to transcript levels of beta Actin, and represented as a fold-change relative to the Kat8+/+;ER-Cre control (a t-test showed significant differences; **P < 0.01, ***P < 0.001).
To study in more detail the possible role of KAT8 and H4K16ac in the regulation of myeloid differentiation we also compared in vitro differentiation to neutrophils of murine cKit+ progenitors sorted from bone marrow from Kat8fl/fl; ER-Cre and Kat8+/+;ER-Cre mice. Kat8 excision was induced in vitro by incubating with 4-OH-tamoxifen reducing Kat8 expression and H4K16ac (Figure 3G and H). Differentiation was confirmed by May Grünwald-Giemsa staining (Figure 3I), and the levels of the two neutrophil terminally differentiated markers were quantified and showed lower levels of expression in KO cells (Figure 3J).
To determine whether KAT8 and H4K16ac were also involved in hematopoietic differentiation in humans, we knocked down KAT8 (shKAT8) in CD34+ progenitors obtained from umbilical cord blood (Supplementary Figure S7A) and analyzed clonogenic potential as measured by the ability to form colony formation units (CFUs). KAT8 downregulation induced a global decrease of H4K16ac (Supplementary Figure S7B). We did not find any differences in proliferation potential between the scramble and shKAT8 cells (Supplementary Figure S7C). However shKAT8 cells showed a decresase in the potential of their hematopoietic progenitor to generate CFUs, as well as changes in CFU distribution (Supplementary Figure S7D). Specifically, we observed a decrease in the percentage of CFUs of erythrocytes, granulocytes and mixed cells, and an increase in CFUs of granulocyte–macrophage and macrophages (Supplementary Figure S7E).
To confirm the role of H4K16ac in the regulation of myeloid differentiation we analyzed the levels of this epigenetic mark in the human acute promyelocytic leukemia cell line HL60 incubated with all-trans retinoic acid (ATRA) and dimethylsulfoxide (DMSO), two drugs that can induce neutrophil differentiation in both hematopoietic progenitors (64) and myeloid cancer cells (65,66). In line with previously published data (21–24) the cancer cells showed a lower H4K16 acetylation level than their non-tumorigenic terminally differentiated perihperal blood cell counterparts (Supplementary Figure S8A). The analysis of the expression levels of neutrophil cytosol factor 1 (NCF1) indicated that combined treatment with ATRA and DMSO induced the greatest degree of neutrophilic differentiation in HL60 cells (Supplementary Figure S8B). Supporting this, immunoflurorescent staining revealed that most of the HL60 cells treated with ATRA and DMSO acquired the lobulated nuclear shape typical of neutrophils (Supplementary Figure S8C). However, the HPLC/HPCE analysis of global histone H4 monoacetylation showed no significant differences of cells after differentiation with ATRA and DMSO (Supplementary Figure S8D), and this was confirmed by mass spectrometry (Supplementary Figure S8E). In addition we performed a ChIP-seq analysis to determine the locus-specific changes in H4K16ac during HL60 neutrophilic differentiation induced by ATRA and DMSO (Supplementary Table S2), and confirmed that only minor global changes occurred (overlapping test; P < 0.005; see Methods) (Supplementary Figures S8F and G, and Supplementary Tables S5 and S6). We found that H4K16ac was enriched in many GO terms of biological processes related to development and differentiation in both HL60 and in vitro HL60 differentiated cells (FDR < 0.1) (Supplementary Table S7). Interestingly, the small differences (genes associated with H4K16ac specific peaks) between control and differentiated cells were related to, among others, ontology terms such us cell development or regulation of signaling (FDR < 0.1) (Supplementary Tables S8 and S9), which indicates that the absence of global H4K16ac changes measured by mass spectrometry is compatible with minor locus-specific H4K16ac changes, and also that locus-specific H4K16ac may play a role in the regulation of hematopoietic genes during in vitro differentiation of HL60 cells. Collectively, these results suggest that, in HL60 cells, neutrophilic differentiation can be achieved, at least in part, without the global hyperacetylation of H4K16, and that locus-specific changes in H4K16ac during hematopoietic differentiation do not contribute significantly to the global changes of this histone PTM that are observed by mass spectrometry in terminally differentiated neutrophils (Figure 1).
H4K16ac level is functionally associated with apoptosis in myeloid cells
As locus-specific H4K16ac changes in hematopoietic genes during HL60 cell differentiation did not seem to have a substantial impact on global H4K16ac level, the regulation of hematopoietic cell differentiation was considered an unlikely candidate to explain the massive H4K16 hyperacetylation observed in peripheral neutrophils. We therefore postulated the hypothesis that this epigenetic change might play a role in neutrophil apoptosis. Indeed, it has been previously shown that H4K16ac is involved in the regulation of apoptotic genes in leukemia cancer cells (18).
To study the role of H4K16ac in apoptosis in myeloid cells in more detail, we first analyzed H4K16ac changes during HL60 cell culture. These cells have previously been shown to undergo spontaneous apoptosis in a cell-density dependent fashion (67). HPLC/HPCE and tandem mass spectrometry experiments carried out here showed that global H4K16ac increased with cell density until the cells reached confluence (day 5), after which it stabilized at ∼35% (Figure 4A and B, Supplementary Figure S9a). Interestingly, the highest H4K16ac levels coincided with the induction of spontaneous apoptosis (day 5) (Figure 4A). H4K16ac has been shown to fluctuate during the cell cycle, peaking during the S phase, and reaching its lowest levels in the G2/M phase (68). To determine any possible effect of the cell cycle on changes in H4K16ac during the increase in cell confluence we analyzed the percentage of cells in each phase of the cycle in the assay previously described. The results showed a negative correlation between global H4K16ac and the percentage of cells in either the S or the G2/M phase during exponential cell growth (Pearson Correlation coefficient = –0.770, P-value = 0.025; Pearson Correlation coefficient = –0.714, P-value = 0.047, respectively), but no clear associations following the induction of apoptosis (Supplementary Figure S9B). Taken together our findings lead us to discard the notion that the cell cycle has any marked effect on the cell-density dependent increase in H4K16ac.
Figure 4.

Association between global levels of H4K16ac and apoptosis in myeloid cells. (A) Global H4 monoacetylation analyzed by HPLC and HPCE (blue bars in the upper panel), and percentage of Annexin+ cells (lower panel) during HL60 cell increasing confluence (black line). (B) Representative immunofluorescence images showing the changes in H4K16ac during the exponential growth of the cells at days 2 and 8. (C) Bar plots showing the effects of the treatment with SAHA in control and in vitro differentiated HL60 cells. Upper panel depicts the effects of the treatment on H4 monoacetylation levels, and lower panels, the effect on apoptosis measured by Annexin V-7AAD staining and percentage of debris from Propidium Iodide staining. A: ATRA, D: DMSO, S: SAHA. (D) RT-qPCR showing downregulation of KAT8 in transduced CD34+ progenitors. Expression levels determined by real time-qPCR are an average of triplicated measurements (+SD), normalized to transcript levels of GAPDH, and represented as a fold-change relative to the scramble. Below, a western blot comparing H4K16ac in shKAT8 cells versus the scramble. H3 was used as loading control. The intensity (relative units) of H4K16ac bands were normalized to H3 and quantified using ImageJ software (numbers below the bands). On the right, representative immunofluorescence images showing lower levels of H4K16ac in shKAT8 cells at day 11. Average H4K16ac fluorescence intensity was quantified using ZEN lite software (a t-test showed significant differences; **P < 0.001). (E) Bar plots showing the lower percentage of apoptosis of shKAT8 cells. Apoptosis levels were assessed by Annexin V-7AAD staining.
The association between H4K16ac and apoptosis led us to study the possible role of this epigenetic mark in programmed cell death in more detail. We first analyzed the levels of apoptosis in undifferentiated vs. differentiated HL60 cells which were either untreated or treated with suberoylanilide hydroxamic acid (SAHA) (Supplementary Figure S9C), an inhibitor of the H4K16 histone deacetylases HDAC1 and HDAC2 (69). Treatment with SAHA increased monoacetylated histone H4 from 33% to 56% in control HL60, and to 60% in HL60 cells differentiated with ATRA+DMSO (Figure 4C; Supplementary Figure S9D). Interestingly, incubation with SAHA also increased apoptosis in HL60 cells, with a more pronounced effect in differentiated cells (Figure 4C).
Histone deacetylase inhibitors can induce acetylation changes at positions other than H4K16 (69).
In order to establish the particular role of global H4K16ac in apoptosis, we ectopically regulated the levels of the H4K16-specific histone acetyltransferase KAT8 in both human primary cells and mouse cells. Firstly, we knocked down KAT8 (shKAT8) in human CD34+ progenitors from umbilical cord blood and then we induced neutrophil differentiation (Figure 4D). Six days after the induction of neutrophil differentiation, between 50 and 60% of scramble and shKAT8 cells were positive for CD33 and CD15 (data not shown). shKAT8 reduced H4K16 acetylation (Figure 4D), and Annexin V-7AAD staining at days 8–11 revealed a decrease in apoptosis in cells with lower KAT8/H4K16ac levels (Figure 4E).
Next, we used the in vitro model of neutrophil differentiation on murine cKit+ progenitors from the Kat8 conditional knockout mouse (Figure 3) to analyze neutrophil apoptosis with and without staurosporine treatment, which is known to be an apoptosis inductor. Analysis of the Annexin V-7AAD staining of differentiated neutrophils at day 7 revealed that apoptosis levels were similar in control and Kat8 knockout-derived cells, both with (85.98% and 87.76%, respectively) and without (26.81% and 25.96%, respectively) staurosporine treatment (Supplementary Figure S10). Within each treatment there were, however, differences between control and Kat8 knockout-derived cells in their distribution between the early and late phases of apoptosis. Without staurosporine, late apoptosis was detected in 4.61% of control cells but in only 2.26% of Kat8 knockout-derived cells. Similarly, after treatment with staurosporine we found 8.23% of control cells to be in the late apoptosis phase and only 5.56% of Kat8 knockout-derived cells (Supplementary Figure S10). Thus, these results indicate that Kat8 downregulation in murine cKit+ progenitor-derived neutrophils induces a slight retardation of entry into the late apoptosis phase, both in the presence and absence of staurosporine (Supplementary Figure S10).
To further study the relationship between global H4K16 acetylation and apoptosis, we treated the cancer cell line HL60 with the topoisomerase inhibitor etoposide (Supplementary Figure S11A), which has been shown to induce apoptosis in myeloid tumors (70). Additionally, H4K16 acetylation was modulated by treating HL60 cells with either SAHA or KAT8 interference or upregulation (Supplementary Figure S11B and C). Etoposide has been demonstrated to induce an apoptosis that cannot be measured by Annexin V staining in HL60 due to the compound's lipid anti-oxidant action, which inhibits phosphatidylserine externalization and, therefore, its staining (71). For this reason, although we measured both Annexin V+ cells and debris percentages (from Propidium Iodide staining), only debris values account for etoposide-induced apoptosis. We observed that, when incubation was with etoposide alone, there was induction of apoptosis which was independent of any increase in H4K16ac (Supplementary Figure S11A). Indeed, after 4 h of incubation with the topoisomerase inhibitor there was even a small decrease in acetylation, which is in line with previously published data (72). When cells were treated with SAHA, there were initial (i.e. prior to etoposide incubation) high levels of Annexin V+ apoptosis, but these decreased over time during etoposide treatment. As the accompanying increase in debris percentages could be explained by the fragmentation of Annexin V+ dying cells, it can be seen that etoposide-induced apoptosis does not seem to change with SAHA treatment (Supplementary Figure S11c). Taken together, these data suggest that H4K16ac is not essential for the induction of programmed cell death, and that basal H4K16 acetylation level is sufficient for programmed cell death to occur. In line with this, KAT8 over expression did not affect the apoptosis induced by etoposide. However, ectopic downregulation of KAT8 in HL60 cells was associated with reduced etoposide-induced cell death at 3h of treatment (Supplementary Figure S11C).
In order to explore the possible connection between the cell death detected in HL60 cells in our study and the generation of neutrophil extracellular traps (NETs) (73), we tested the NETosis of HL60 cells under different conditions: treated or not with SAHA, and after the induction of ectopic up- or downregulation of KAT8. In all the conditions analyzed, the levels of elastase activity, as a measurement of NETs formation, were similar to background signal (Supplementary Figure S12). It would thus seem that, under these conditions, NETosis is not induced.
Enrichment of H4K16ac at specific repeated DNA in neutrophils
As the H4K16ac changes in differentiation and apoptosis genes between lymphoid and myeloid cells were unlikely to explain the global differences observed by mass spectrometry (>20% of the genome), we reanalyzed our ChIP-seq data of CD3+ T cells and neutrophils to identify the DNA regions where these changes occur. To this end we focused our attention on repetitive DNA, a type of DNA sequence that is not usually given much attention in ChIP-seq experiments because they are difficult to map in the genome. Interestingly, the HOMER enrichment analyses showed that H4K16ac peaks, overlapped with specific repetitive sequences in the genome in both CD3+ T cells and neutrophils (Supplementary Tables S3 and S4). To further investigate these relationships we carried out a comparative statistical analysis of H4K16ac enrichment in three types of repetitive sequence identified in the ChIP-seq: Short Interspersed Nuclear Elements (SINEs), Long Interspersed Nuclear Elements (LINEs) and Satellites. These analyses showed that the H4K16ac peaks of neutrophils were significantly enriched in SINEs (Permutation test, P < 0.01, FC CI = [1.34, 1.42]), while being depleted in LINEs (Permutation test, P < 0.01, FC CI = [0.61, 0.63]) and satellites (permutation test, P < 0.01, FC CI = [0.26, 0.38]). Conversely, H4K16ac peaks of CD3+ T cells were significantly depleted in SINEs (Permutation test, P < 0.01, FC CI = [0.70, 0.72]) (Figure 5A, upper panels). The analyses of specific families of repetitive elements showed that H4K16ac peaks of neutrophils were significantly enriched in Alu elements (Homer Genome test, P < 0.001, logRE = 0.50), mammalian-wide interspersed repeat (MIR) sequences (Homer Genome test, P < 0.001, logRE = 0.45), and LINE-2 (Homer Genome test, P < 0.001, logRE = 0.28), but depleted in LINE-1 and satellites (Homer Genome test, P < 0.001, logRE = –0.85 and P < 0.001, logRE = –1.11, respectively). In contrast, H4K16ac peaks of CD3+ T cells were significantly depleted in Alu sequences (Homer Genome test, P < 0.001, logRE = –0.57) (Figure 5A, lower panels). Similar results were obtained in four additional independet biological replicates, although in the case of CD3+ T cells we observed some interindividual variability (Supplementary Figure S13). Enrichment analysis of different repeat families across the chromatin states (Figure 5B) confirmed that H4K16ac peaks (emission order 10) specific for neutrophils (Figure 2F) are enriched in Alu repeats, MIR and LINE 2.
Figure 5.

Distribution of H4K16 acetylation at specific repetitive DNA elements in neutrophils and CD3+ T cells. (A) Bar plots showing the overlap between H4K16-enriched peaks and different types of DNA repeats, obtained in the analyses of unique mapped reads. Violin plots represent a permutation-based null distribution for each type of repeated DNA overlap ratio for each peak data set. Lower panels show associations between different types of repetitive DNA elements with H4K16ac peaks in neutrophils and CD3+ T cells, ranked by Q-value, and enrichment score (relative risk). (B) Enrichment of the 12 chromatin states described in Figure 2F in different types of DNA repeats. (C) Plot showing the coverage of repetitive elements in the regions flanking the H4K16ac enriched peaks obtained in the analyses of unique mapped reads in both cell types. (D) Stacked bar charts describing the classification of ambiguous reads for neutrophil and CD3+ T cell signals relative to the corresponding input, and according to the enrichment in different types of DNA repeats. Lower panels show associations between different types of repetitive DNA elements with probable H4K16ac-enriched regions obtained from ambiguous mapping in neutrophils and CD3+ T cells, and ranked by Q-value, and enrichment score (relative risk).
Interestingly, although in the analyses of the ‘unique mapped reads’ we identified a significant overlap of H4K16ac peaks with several types of repetitive sequences (Figure 5A and Supplementary Figure S13A), we also identified that the regions flanking the peaks in both cell types were highly enriched in repetitive elements (Figure 5C), suggesting that H4K16ac could be even more enriched in repetitive elements than initially revealed, though this would be masked by the limitation of the computational method employed to deal with ambiguous reads and detect enrichment of peaks in those regions. We also found similar results in 4 additional independet biological replicates (Supplementary Figure S13B).
To investigate this further we carried out a new analysis of the ‘ambiguous reads’, that is, those that align in multiple parts of the genome and could in theory be associated with repetitive regions (Supplementary Table S2) (see Materials and Methods). In line with the results obtained with the unambiguosly mapped reads, this approach showed that neutrophil H4K16ac peaks were enriched in SINEs (particularly Alu sequences) (Homer Genome test, P < 0.001, logRE = 0.1) and LINE-2 (Homer Genome test, P < 0.001, logRE = 0.03), but depleted in LINE-1 (Homer Genome test, P < 0.001, logRE = –0.12) and in centromeric repeats (Homer Genome test, P < 0.001, logRE = –0.15) (Figure 5D). Similar results were obtained in 4 additional independent biological replicates, although in the case of CD3+ T cells we observed some interindividual variability (Supplementary Figure S14). Collectively these results indicate that, in neutrophils, H4K16ac is enriched at specific repeated DNA regions.
H4K16ac-rich DNA repeats mark genomic regions fragmented early on in neutrophil apoptosis
As H4K16ac has been proposed to play an important role in making chromatin accessible in DNA repair (37), we considered it reasonable to assume that it could also play a similar role in DNA cleavage during neutrophil apoptosis. In the first stages of the apoptotic process, genomic DNA is cleaved into 300 and 50 kb fragments (74). Therefore, to study the possible role of global H4K16 hyperacetylation in early DNA fragmentation during neutrophil apoptosis, we determined whether the genomic regions specifically enriched in H4K16ac in neutrophils were fragmented during the early stages of neutrophil apoptosis. Our ChIP-seq data suggested that the global H4K16 hyperacetylation observed in neutrophils by mass spectrometry is, at least in part, due to the increase of this histone modification at specific repeated DNA regions (Figure 5). We thus designed PCR oligonucleotides against 6 of these regions (Supplementary Table S1) and used them to amplify the 50 kb DNA fragments isolated by pulsed field gel electrophoresis (Figure 6A; Supplementary Figure S15A, B) from apoptotic neutrophils obtained from two independent series of healthy individuals (Figure 6B; Supplementary Figure S15C). Bisulfite pyrosequencing analysis of these genomic regions showed that they are highly hypermethylated in both neutrophils and CD3+ T cells (Supplementary Figure S16). As a negative control, we used oligonucleotides designed against DNA regions lacking H4K16ac in neutrophils (Supplementary Table S1). The oligonucleotides designed against H4K16ac-poor DNA regions amplified both the early apoptotic 50 kb DNA fragments isolated by pulsed field gel electrophoresis and unspecific 50 kb fragments generated by sonication (Figure 6B; Supplementary Figure S15C). In contrast, the oligonucleotides designed against the H4K16ac-rich DNA repeats amplified the unspecific 50 kb DNA fragments to a far greater extent than the early DNA apoptotic 50 kb DNA fragments isolated by pulsed field gel electrophoresis (Figure 6B; Supplementary Figure S15C), which indicates that H4K16ac is enriched in the DNA fragments generated during the early stages of neutrophil apoptosis.
Figure 6.
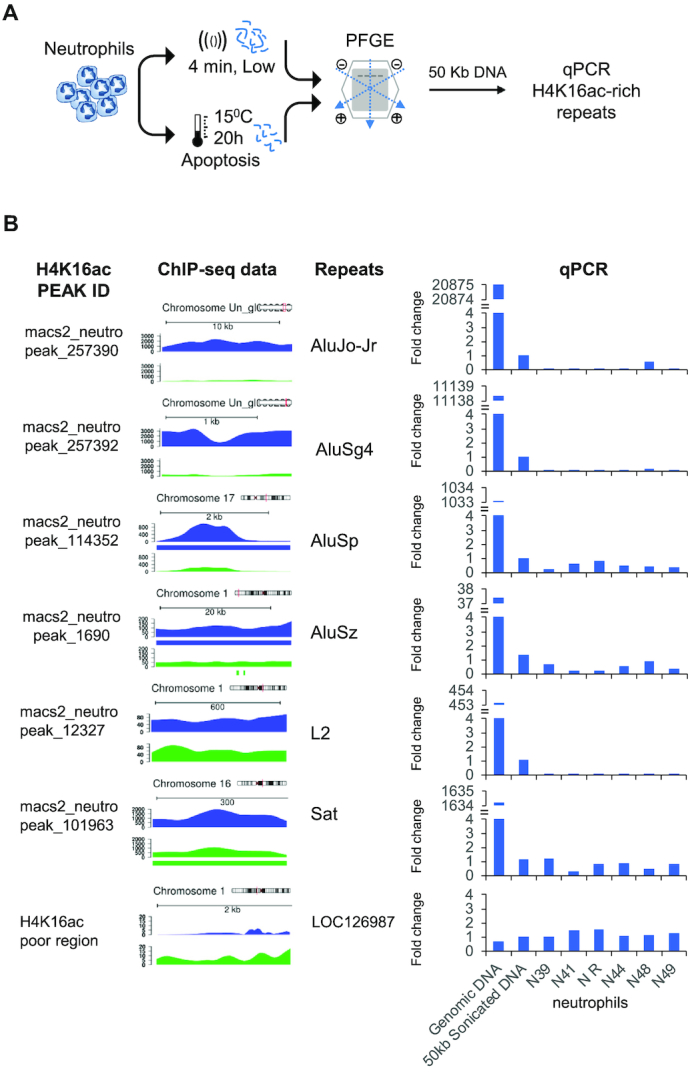
Associations between H4K16ac enriched regions and DNA breakage during neutrophil apoptosis. (A) Schematic representation of the pulsed-field gel electrophoresis (PFGE) experiment to analyze the 50 kb DNA fragments from apoptotic neutrophils. (B) qPCR amplification of specific H4K16ac-enriched repeats using the 50kb DNA fragments from the PFGE. Data are an average of triplicated measurements, normalized to a H4K16ac-poor region of the albumin gene, and represented as a fold-change relative to the 50kb sonicated DNA. Intact DNA and 50kb random fragments from a pool of samples were used as positive controls. H4K16ac peaks identified by MACS2, and genome diagrams showing the relative enrichment of H4K16ac in neutrophils (blue), and CD3+ T cells (green) are shown on the left. Significant H4K16ac peaks showing fold change above 1.5 are indicated by a colored bar below the profile.
Finally, to study the possible effect of H4K16 hyperacetylation at these DNA repeats on the chromatin conformation state we took two different approaches. First, we used an H4K16ac-specific antibody to determine by immunofluorescence the enrichment of this histone PTM in the nuclear regions of human neutrophils and CD3+ T cells (Figure 7A). As expected, DAPI staining was very different between lymphoid and myeloid cells. Neutrophils displayed large blocks of highly compacted heterochromatin in the nuclear periphery. These blocks were separated by regions of mildly compact chromatin and the least compacted chromatin was in the center of the nucleus (Figure 7A). In contrast, CD3+ cells showed a more uniform chromatin compaction pattern, with only a few small blocks of heterochromatin attached to the nuclear periphery. H4K16ac staining was almost completely absent from the large blocks of heterochromatin of the neutrophil nuclear envelop (Figure 7A, B) and, interestingly, although the low compacted chromatin areas of the center of the nucleus were stained, the highest H4K16ac signal was observed in the mildly compact chromatin regions interspersed between the large blocks of heterochromatin of the nuclear periphery (Figure 7A, B). In CD3+ cells, H4K16ac staining was similar to that reported in other cell types and was far more uniform than in neutrophils (Figure 7A, B). Generally, H4K16ac staining and DAPI were less correlated in neutrophils than in in CD3+ (Pearson correlation = 0.03 and 0.68, respectively) (Figure 7B; Supplementary Table S10). In the second approach, we used a chromatin accessibility assay, based on how accessible the DNA is to nucleases, to determine the level of chromatin compaction in six of the previously identified H4K16ac-rich repeats which are fragmented at early stages of neutrophil apoptosis (Alu_257398, Alu_257394, L2_12327, L2_100294, Sat_ 101966 and Sat_28530) in neutrophils and CD3+ cells obtained from four healthy individuals. We further validated these results by FAIRE quantitative PCR (FAIRE-qPCR) analysis (Supplementary Figure S17). In general, there was considerable interindividual variability for most of the sequences analyzed in both myeloid and CD3+ cells. However, chromatin was always more accessible in neutrophils than in CD3+ in all the repeated DNA regions analyzed (Figure 7C; Supplementary Figure S17).
Figure 7.

Effect of H4K16ac enrichment at the repeated DNA fragmented early in neutrophil apoptosis. (A) Representative immunofluorescence images of nuclear distribution of H4K16ac in neutrophils and CD3+ T cells. On the right, line plots comparing DAPI and H4K16ac staining signals in several nuclear longitudinal positions. The red lines in the merged images indicates the position and direction of measurements. (B) Heat density scatterplots depicting the different distribution of the H4K16ac signal with respect to DAPI intensity in neutrophils (n = 72 cells from five donors) (upper panel) and CD3+ T cells (n = 62 cells from one donor) (lower panel) performed with 9198 and 5925 pairwise datapoints respectively. Colors represent the relative density of the number of measurements (data points) obtained across the different axes (blue – low density areas, red – high density areas). H4K16ac and DAPI intensities were positively correlated in lymphocyte cells (pcorr = 0.68), whereas neutrophils displayed a more sparse, non-correlated distribution (pcorr = 0.03) of H4K16ac-DAPI signals across the nucleus. (C) Chromatin accessibility assay in four donors showing that H4K16ac-enriched repetitive sequences in neutrophils are more associated with open chromatin than in CD3+ T cells. %FE: fold enrichment percentage.
DISCUSSION
Neutrophils are defined by their multilobed nuclear architecture (75), and they display a characteristic pattern of histone PTMs (76). Our initial observation that human PB neutrophils are hyperacetylated at H4K16 as compared with other terminally differentiated types of blood cells led us to investigate the role of this histone PTM in myeloid cells in more detail. Genome-wide mapping of H4K16ac in peripheral neutrophils and CD3+ T cells confirmed its enrichment in the myeloid lineage. The results obtained in vitro and in vivo in this work suggest that this PTM plays an important role in blood cell survival and hematopoietic differentiation, and they are in line with other previous results showing the critical importance of KAT8 and H4K16ac in these processes (77,78).
Although our results supported a role for H4K16ac in gene regulation during cell differentiation, such changes in the small number of genes involved in cell differentiation are insufficient to explain the massive global differences between neutrophils and CD3+ T cells observed by mass spectrometry that affects >20% of the genome. It has been reported that mice lacking a processing protease of the nuclear envelope protein lamin A show a low level of H4K16ac (79,80). However, Pelger-Huët patients, who have lamin B mutations, and individuals with myelodysplastic syndrome, who present with an altered neutrophil nuclear morphology, have a normal distribution of H4K16ac (data not shown), suggesting that this histone PTM does not play a central role in these disease processes. Future research is needed to determine the biological consequences, if any, of the alterations of H4K16ac in Zmpste24 mutant mice, which are deficient in the proteolytic processing of prelamin A.
Previous findings have also suggested that H4K16ac also plays an important role in gene regulation during programmed cell death (17,18). Interestingly, we found a correlation and a functional association between H4K16ac and apoptosis in HL60 cells and in neutrophils obtained by in vitro myeloid differentiation of CD34+ mouse and human progenitors, providing further support for this histone modification having a role in the process. However, as previously stated with respect to the cell differentiation genes, differences in H4K16ac in a few apoptotic genes cannot explain the massive genome-wide H4K16 hyperacetylation observed in peripheral blood neutrophils. Indeed, in vitro differentiated neutrophils do not display the same global H4K16 hyperacetylation and staining pattern as that observed in peripheral blood neutrophils, something which should be taken into account in future studies using such in vitro models.
We next therefore considered the possibility that, in addition to gene regulation, H4K16ac plays another role in neutrophil apoptosis. The magnitude of the differences and the enrichment of H4K16ac in specific repeated DNA sequences in neutrophils pointed to a structural role for this histone modification in the process. In line with this, our results revealed an enrichment of this histone mark in regions associated with early DNA fragmentation during neutrophil apoptosis. We also showed that these DNA regions are more accessible in this cell type than in CD3+ T cells, intimating that H4K16ac plays a role in the establishment of a specific chromatin status that facilitates DNA fragmentation early during apoptosis. In support of this notion, in vitro experiments with nucleosomal arrays and computational modeling have shown that acetylation at lysine 16 of histone H4 plays a central role in the regulation of higher-order chromatin structure and the interactions between non-histone proteins and chromatin fiber (14,81,82). However, the relationship between chromatin structure and H4K16ac is far more complex, because, in vivo, this histone modification was also found to be associated with compacted chromatin and repression (83), and loss of H4K16ac does not alter higher-order chromatin compaction in mouse embryonic stem cells (84). In line with this, although we observed the clear exclusion of H4K16ac from the large blocks of heterochromatin of the nuclear periphery of peripheral blood neutrophils, we did not find any global correlation between this epigenetic modification and nuclear chromatin compaction in this type of cells. These data thus suggest that H4K16ac function in chromatin conformation may well be highly dependent on the type of chromatin region and, consequently, this should be explored further.
Although the genomic regions targeted during the apoptotic early DNA fragmentation are still poorly understood, it has been proposed that the cleavage might occur preferentially at repeated DNA (85) and in regions of accessible chromatin (86). Thus, it is possible that hyperacetylation of H4K16 at specific repeated DNA regions establishes a characteristic chromatin structure/state prone to DNA fragmentation during apoptosis in neutrophils specifically. Interestingly, H4K16ac-mediated chromatin relaxation might facilitate DNA repair of double-strand breaks (79). Taken together, these results could imply that chromatin relaxation by H4K16 acetylation plays a general role in DNA cleavage during programmed cell death, a possibility that should be studied in more detail in the future. Moreover, both the H4K16ac-rich repeats cleaved during the first stages of neutrophil apoptosis and the chromatin state specifically enriched in this histone PTM in neutrophils (state 10) are enriched in hypermethylated DNA. Thus, future research should also determine the role of this latter chromatin state in the DNA cleavage occurring early on during apoptosis.
In summary, our study is in line with previous literature showing a positive correlation between high levels of H4K16ac and apoptosis (17,18,34,35), which suggests that H4K16 hyperacetylation is directly involved in programmed cell death. However, our experiments which showed a lack of global H4K16 hyperacetylation in apoptosis cell death induced by etoposide in myeloid cells indicate either that the non-canonical structural role of this histone PTM that is described in this manuscript is not essential to induce programmed cell death, or that basal levels of H4K16ac might be sufficient. Making the story even more complex, our data shows that ectopic downregulation of KAT8 reduced etoposide-induced cell death in HL60 cells, which suggests that this histone modification could still play a role in the process. For example, downregulation of KAT8 might impair the H4K16ac-dependent upregulation of specific proapoptotic genes, which is compatible with the fact that the downregulation of KAT8 in this work only induced a relatively small decrease in H4K16ac. A possible canonical role for H4K16ac in the regulation of apoptotic genes in HL60 cells exposed to etoposide is also compatible with the lack of global changes of H4K16ac in HL60 exposed to etoposide because, as previously reasoned, changes in this histone modification at a small number of specific genes would not be expected to be detected at a global level. Finally, it could also be possible that the effect of KAT8 downregulation in HL60 cells treated with etoposide in fact impacts on the role of this histone acetyltransferase in the modulation of other regulators of apoptosis (87). Further research is thus still needed to determine the precise roles of KAT8 and H4K16ac in etoposide-induced cell death in HL60 cells.
Further research will also be needed to determine whether H4K16 hyperacetylation is required for apoptosis in other cell types. However, the fact that H4K16 hypoacetylation underpins resistance to the topoisomerase I inhibitor irinotecan in colon cancer cells lends support to the notion that this histone modification might play a general role in apoptosis (35). Interestingly, our results showed that tumoral HL60 cells have lower H4K16 acetylation levels than their non-tumorigenic terminally differentiated peripheral blood cell counterparts (Supplementary Figure S8A), which is in line with previously published data showing that H4K16ac is frequently down-regulated in cancer (21–24), although the underlying molecular mechanisms were largely unclear. Our results suggest that myeloid tumors display low H4K16ac levels, because they do not undergo the massive hyperacetylation that occurs during the last stages of myeloid differentiation. Moreover, the lack of H4K16 hyperacetylation could even favor the resistance of these tumor cells to apoptosis, one of the hallmarks of cancer (88). In line with this, our results might help to understand the mechanism of action of HDAC inhibitors, a family of small molecules with antitumor activity that can induce histone hyperacetylation and apoptosis in myeloid cells (88). Although it was proposed that their mechanism of action is mediated, at least in part through the reactivation of proapoptotic genes (18,89), these compounds have many pleiotropic effects and their mechanism of action is still poorly understood. Our data suggest that, in addition to gene regulation, HDAC inhibitors might also promote programmed cell death through the establishment of a higher-order chromatin structure prone to DNA fragmentation during the first stages of apoptosis. In support of this notion, we observed that the treatment of the HL60 cancer cell line with SAHA increased H4K16ac levels at specific DNA repetitive regions identified in our ChIP-seq (Supplementary Figure S18). As this possibility could have important clinical implications, future research is needed to confirm the role of H4K16 hyperacetylation of repeated DNA on the mechanism of HDAC inhibitor treatment of cancer.
DATA AVAILABILITY
Supplementary Tables generated during this study are included in the online version of this manuscript and, with the source code, are also available in the Zenodo public repository, DOI: 10.5281/zenodo.2425053. Raw data corresponding to ChIP-seq experiments is uploaded in SRA database BioProject: PRJNA480011 with the accession numbers SUB4245394 and SUB5124343.
Supplementary Material
ACKNOWLEDGEMENTS
We thank Ronnie Lendrum for editorial assistance. We also thank the Blood Bank of HUCA, and M. Rosario Rodicio and Vanesa García for their support.
Notes
Present address: Ana Villar-Garea, R&D, Sanofi-Aventis Deutschland GmbH, Industriepark Höchst Building G878, D-65926 Frankfurt am Main, Germany.
SUPPLEMENTARY DATA
Supplementary Data are available at NAR Online.
FUNDING
Plan Nacional de I+D+I co-funding FEDER [PI15/00892 and PI18/01527 to M.F.F. and A.F.F.; PI16/01318 and PI14/01244 to C.L.]; ISCIII-Subdirección General de Evaluacicción y Fomento de la Investigación, and Plan Nacional de I+D+I 2008–2011/FEDER [CP11/00131 to A.F.F.]; IUOPA (to G.F.B. and M.I.S.); Fundación Científica de la AECC (to R.G.U.); Ministry of Economy and Competitiveness Juan de la Cierva postdoctoral fellowships [FJCI-2015-26965 to J.R.T., IJCI-2015-23316 to V.L.]; Fundación Ramón Areces (to M.F.F); FICYT (to E.G.T., M.G.G., A.C.); Asturias Regional Government [GRUPIN14-052 to M.F.F.]; Gobierno del Principado de Asturias, PCTI-Plan de Ciencia, Tecnología e Innovación co-funding Fondos FEDER (grant number IDI/2018/146 to M.F.F. and IDI/2018/144 to C.L.); Deutsche Forschungsgemeinschaft (DFG) [SFB960 to A.V.G., R.D.]; European Research Council [CoG-2014-646903]; Spanish Ministry of Economy and Competitiveness [SAF-SAF2013-43065 to P.M.]; Asociación Española Contra el Cáncer [AECC-CI-2015]; FERO Foundation, and the ISCIII [PI14-01191 to C.B.]; P.M. acknowledges financial support from The Obra Social La Caixa-Fundaciò Josep Carreras and The Generalitat de Catalunya (SGR330). P.M. an investigator from the Spanish Cell Therapy cooperative network (TERCEL). The IUOPA is supported by the Obra Social Liberbank-Cajastur, Spain. Funding for open access charge: Plan Nacional de I+D+I co-funding FEDER [PI18/01527].
Conflict of interest statement. None declared.
REFERENCES
- 1. Bannister A.J., Kouzarides T.. Regulation of chromatin by histone modifications. Cell Res. 2011; 21:381–395. [DOI] [PMC free article] [PubMed] [Google Scholar]
- 2. Alvarez-Errico D., Vento-Tormo R., Sieweke M., Ballestar E.. Epigenetic control of myeloid cell differentiation, identity and function. Nat. Rev. Immunol. 2015; 15:7–17. [DOI] [PubMed] [Google Scholar]
- 3. Kouzarides T. Chromatin modifications and their function. Cell. 2007; 128:693–705. [DOI] [PubMed] [Google Scholar]
- 4. Rice K.L., Hormaeche I., Licht J.D.. Epigenetic regulation of normal and malignant hematopoiesis. Oncogene. 2007; 26:6697–6714. [DOI] [PubMed] [Google Scholar]
- 5. Dou Y., Milne T.A., Tackett A.J., Smith E.R., Fukuda A., Wysocka J., Allis C.D., Chait B.T., Hess J.L., Roeder R.G.. Physical association and coordinate function of the H3 K4 methyltransferase MLL1 and the H4 K16 acetyltransferase MOF. Cell. 2005; 121:873–885. [DOI] [PubMed] [Google Scholar]
- 6. Singh S.K., Williams C.A., Klarmann K., Burkett S.S., Keller J.R., Oberdoerffer P.. Sirt1 ablation promotes stress-induced loss of epigenetic and genomic hematopoietic stem and progenitor cell maintenance. J. Exp. Med. 2013; 210:987–1001. [DOI] [PMC free article] [PubMed] [Google Scholar]
- 7. Ramos-Mejia V., Navarro-Montero O., Ayllon V., Bueno C., Romero T., Real P.J., Menendez P.. HOXA9 promotes hematopoietic commitment of human embryonic stem cells. Blood. 2014; 124:3065–3075. [DOI] [PubMed] [Google Scholar]
- 8. Taipale M., Rea S., Richter K., Vilar A., Lichter P., Imhof A., Akhtar A.. hMOF histone acetyltransferase is required for histone H4 lysine 16 acetylation in mammalian cells. Mol. Cell Biol. 2005; 25:6798–6810. [DOI] [PMC free article] [PubMed] [Google Scholar]
- 9. Mishra B.P., Zaffuto K.M., Artinger E.L., Org T., Mikkola H.K., Cheng C., Djabali M., Ernst P.. The histone methyltransferase activity of MLL1 is dispensable for hematopoiesis and leukemogenesis. Cell Rep. 2014; 7:1239–1247. [DOI] [PMC free article] [PubMed] [Google Scholar]
- 10. Ou X., Chae H.D., Wang R.H., Shelley W.C., Cooper S., Taylor T., Kim Y.J., Deng C.X., Yoder M.C., Broxmeyer H.E.. SIRT1 deficiency compromises mouse embryonic stem cell hematopoietic differentiation, and embryonic and adult hematopoiesis in the mouse. Blood. 2011; 117:440–450. [DOI] [PMC free article] [PubMed] [Google Scholar]
- 11. Wada T., Kikuchi J., Nishimura N., Shimizu R., Kitamura T., Furukawa Y.. Expression levels of histone deacetylases determine the cell fate of hematopoietic progenitors. J. Biol. Chem. 2009; 284:30673–30683. [DOI] [PMC free article] [PubMed] [Google Scholar]
- 12. Heideman M.R., Lancini C., Proost N., Yanover E., Jacobs H., Dannenberg J.H.. Sin3a-associated Hdac1 and Hdac2 are essential for hematopoietic stem cell homeostasis and contribute differentially to hematopoiesis. Haematologica. 2014; 99:1292–1303. [DOI] [PMC free article] [PubMed] [Google Scholar]
- 13. Thomas T., Dixon M.P., Kueh A.J., Voss A.K.. Mof (MYST1 or KAT8) is essential for progression of embryonic development past the blastocyst stage and required for normal chromatin architecture. Mol. Cell Biol. 2008; 28:5093–5105. [DOI] [PMC free article] [PubMed] [Google Scholar]
- 14. Shogren-Knaak M., Ishii H., Sun J.M., Pazin M.J., Davie J.R., Peterson C.L.. Histone H4-K16 acetylation controls chromatin structure and protein interactions. Science. 2006; 311:844–847. [DOI] [PubMed] [Google Scholar]
- 15. Horikoshi N., Kumar P., Sharma G.G., Chen M., Hunt C.R., Westover K., Chowdhury S., Pandita T.K.. Genome-wide distribution of histone H4 Lysine 16 acetylation sites and their relationship to gene expression. Genome Integr. 2013; 4:3. [DOI] [PMC free article] [PubMed] [Google Scholar]
- 16. Katoh H., Qin Z.S., Liu R., Wang L., Li W., Li X., Wu L., Du Z., Lyons R., Liu C.G. et al.. FOXP3 orchestrates H4K16 acetylation and H3K4 trimethylation for activation of multiple genes by recruiting MOF and causing displacement of PLU-1. Mol. Cell. 2011; 44:770–784. [DOI] [PMC free article] [PubMed] [Google Scholar]
- 17. Kapoor-Vazirani P., Kagey J.D., Powell D.R., Vertino P.M.. Role of hMOF-dependent histone H4 lysine 16 acetylation in the maintenance of TMS1/ASC gene activity. Cancer Res. 2008; 68:6810–6821. [DOI] [PMC free article] [PubMed] [Google Scholar]
- 18. Lara E., Mai A., Calvanese V., Altucci L., Lopez-Nieva P., Martinez-Chantar M.L., Varela-Rey M., Rotili D., Nebbioso A., Ropero S. et al.. Salermide, a Sirtuin inhibitor with a strong cancer-specific proapoptotic effect. Oncogene. 2009; 28:781–791. [DOI] [PubMed] [Google Scholar]
- 19. Huang B.H., Laban M., Leung C.H., Lee L., Lee C.K., Salto-Tellez M., Raju G.C., Hooi S.C.. Inhibition of histone deacetylase 2 increases apoptosis and p21Cip1/WAF1 expression, independent of histone deacetylase 1. Cell Death Differ. 2005; 12:395–404. [DOI] [PubMed] [Google Scholar]
- 20. Zhang J., Zhong Q.. Histone deacetylase inhibitors and cell death. Cell Mol. Life Sci. 2014; 71:3885–3901. [DOI] [PMC free article] [PubMed] [Google Scholar]
- 21. Elsheikh S.E., Green A.R., Rakha E.A., Powe D.G., Ahmed R.A., Collins H.M., Soria D., Garibaldi J.M., Paish C.E., Ammar A.A. et al.. Global histone modifications in breast cancer correlate with tumor phenotypes, prognostic factors, and patient outcome. Cancer Res. 2009; 69:3802–3809. [DOI] [PubMed] [Google Scholar]
- 22. Fraga M.F., Ballestar E., Villar-Garea A., Boix-Chornet M., Espada J., Schotta G., Bonaldi T., Haydon C., Ropero S., Petrie K. et al.. Loss of acetylation at Lys16 and trimethylation at Lys20 of histone H4 is a common hallmark of human cancer. Nat. Genet. 2005; 37:391–400. [DOI] [PubMed] [Google Scholar]
- 23. Pfister S., Rea S., Taipale M., Mendrzyk F., Straub B., Ittrich C., Thuerigen O., Sinn H.P., Akhtar A., Lichter P.. The histone acetyltransferase hMOF is frequently downregulated in primary breast carcinoma and medulloblastoma and constitutes a biomarker for clinical outcome in medulloblastoma. Int. J. Cancer. 2008; 122:1207–1213. [DOI] [PubMed] [Google Scholar]
- 24. Van Den Broeck A., Brambilla E., Moro-Sibilot D., Lantuejoul S., Brambilla C., Eymin B., Khochbin S., Gazzeri S.. Loss of histone H4K20 trimethylation occurs in preneoplasia and influences prognosis of non-small cell lung cancer. Clin. Cancer Res. 2008; 14:7237–7245. [DOI] [PubMed] [Google Scholar]
- 25. Cai M., Hu Z., Liu J., Gao J., Tan M., Zhang D., Zhu L., Liu S., Hou R., Lin B.. Expression of hMOF in different ovarian tissues and its effects on ovarian cancer prognosis. Oncol Rep. 2015; 33:685–692. [DOI] [PubMed] [Google Scholar]
- 26. Cao L., Zhu L., Yang J., Su J., Ni J., Du Y., Liu D., Wang Y., Wang F., Jin J. et al.. Correlation of low expression of hMOF with clinicopathological features of colorectal carcinoma, gastric cancer and renal cell carcinoma. Int. J. Oncol. 2014; 44:1207–1214. [DOI] [PubMed] [Google Scholar]
- 27. Liu N., Zhang R., Zhao X., Su J., Bian X., Ni J., Yue Y., Cai Y., Jin J.. A potential diagnostic marker for ovarian cancer: involvement of the histone acetyltransferase, human males absent on the first. Oncol Lett. 2013; 6:393–400. [DOI] [PMC free article] [PubMed] [Google Scholar]
- 28. Wang Y., Zhang R., Wu D., Lu Z., Sun W., Cai Y., Wang C., Jin J.. Epigenetic change in kidney tumor: downregulation of histone acetyltransferase MYST1 in human renal cell carcinoma. J. Exp. Clin. Cancer Res. 2013; 32:8. [DOI] [PMC free article] [PubMed] [Google Scholar]
- 29. Zhu L., Yang J., Zhao L., Yu X., Wang L., Wang F., Cai Y., Jin J.. Expression of hMOF, but not HDAC4, is responsible for the global histone H4K16 acetylation in gastric carcinoma. Int. J. Oncol. 2015; 46:2535–2545. [DOI] [PubMed] [Google Scholar]
- 30. Choi J.H., Kwon H.J., Yoon B.I., Kim J.H., Han S.U., Joo H.J., Kim D.Y.. Expression profile of histone deacetylase 1 in gastric cancer tissues. Jpn J. Cancer Res. 2001; 92:1300–1304. [DOI] [PMC free article] [PubMed] [Google Scholar]
- 31. Halkidou K., Gaughan L., Cook S., Leung H.Y., Neal D.E., Robson C.N.. Upregulation and nuclear recruitment of HDAC1 in hormone refractory prostate cancer. Prostate. 2004; 59:177–189. [DOI] [PubMed] [Google Scholar]
- 32. Song J., Noh J.H., Lee J.H., Eun J.W., Ahn Y.M., Kim S.Y., Lee S.H., Park W.S., Yoo N.J., Lee J.Y. et al.. Increased expression of histone deacetylase 2 is found in human gastric cancer. APMIS. 2005; 113:264–268. [DOI] [PubMed] [Google Scholar]
- 33. Zhang Z., Yamashita H., Toyama T., Sugiura H., Ando Y., Mita K., Hamaguchi M., Hara Y., Kobayashi S., Iwase H.. Quantitation of HDAC1 mRNA expression in invasive carcinoma of the breast*. Breast Cancer Res. Treat. 2005; 94:11–16. [DOI] [PubMed] [Google Scholar]
- 34. Hajji N., Wallenborg K., Vlachos P., Fullgrabe J., Hermanson O., Joseph B.. Opposing effects of hMOF and SIRT1 on H4K16 acetylation and the sensitivity to the topoisomerase II inhibitor etoposide. Oncogene. 2010; 29:2192–2204. [DOI] [PubMed] [Google Scholar]
- 35. Meisenberg C., Ashour M.E., El-Shafie L., Liao C., Hodgson A., Pilborough A., Khurram S.A., Downs J.A., Ward S.E., El-Khamisy S.F.. Epigenetic changes in histone acetylation underpin resistance to the topoisomerase I inhibitor irinotecan. Nucleic Acids Res. 2016; 45:1159–1176. [DOI] [PMC free article] [PubMed] [Google Scholar]
- 36. Fullgrabe J., Lynch-Day M.A., Heldring N., Li W., Struijk R.B., Ma Q., Hermanson O., Rosenfeld M.G., Klionsky D.J., Joseph B.. The histone H4 lysine 16 acetyltransferase hMOF regulates the outcome of autophagy. Nature. 2013; 500:468–471. [DOI] [PMC free article] [PubMed] [Google Scholar]
- 37. Sharma G.G., So S., Gupta A., Kumar R., Cayrou C., Avvakumov N., Bhadra U., Pandita R.K., Porteus M.H., Chen D.J. et al.. MOF and histone H4 acetylation at lysine 16 are critical for DNA damage response and double-strand break repair. Mol. Cell Biol. 2010; 30:3582–3595. [DOI] [PMC free article] [PubMed] [Google Scholar]
- 38. Li X., Corsa C.A., Pan P.W., Wu L., Ferguson D., Yu X., Min J., Dou Y.. MOF and H4 K16 acetylation play important roles in DNA damage repair by modulating recruitment of DNA damage repair protein Mdc1. Mol. Cell Biol. 2010; 30:5335–5347. [DOI] [PMC free article] [PubMed] [Google Scholar]
- 39. Luo H.R., Loison F.. Constitutive neutrophil apoptosis: mechanisms and regulation. Am. J. Hematol. 2008; 83:288–295. [DOI] [PubMed] [Google Scholar]
- 40. Witko-Sarsat V., Pederzoli-Ribeil M., Hirsch E., Sozzani S., Cassatella M.A.. Regulating neutrophil apoptosis: new players enter the game. Trends Immunol. 2011; 32:117–124. [DOI] [PubMed] [Google Scholar]
- 41. Lindner H., Helliger W., Dirschlmayer A., Jaquemar M., Puschendorf B.. High-performance capillary electrophoresis of core histones and their acetylated modified derivatives. Biochem. J. 1992; 283:467–471. [DOI] [PMC free article] [PubMed] [Google Scholar]
- 42. Sarg B., Koutzamani E., Helliger W., Rundquist I., Lindner H.H.. Postsynthetic trimethylation of histone H4 at lysine 20 in mammalian tissues is associated with aging. J. Biol. Chem. 2002; 277:39195–39201. [DOI] [PubMed] [Google Scholar]
- 43. Villar-Garea A., Israel L., Imhof A.. Analysis of histone modifications by mass spectrometry. Curr. Protoc. Protein Sci. 2008; doi:10.1002/0471140864.ps1410s51. [DOI] [PubMed] [Google Scholar]
- 44. Strohalm M., Hassman M., Kosata B., Kodicek M.. mMass data miner: an open source alternative for mass spectrometric data analysis. Rapid Commun. Mass Spectrom. 2008; 22:905–908. [DOI] [PubMed] [Google Scholar]
- 45. Strohalm M., Kavan D., Novak P., Volny M., Havlicek V.. mMass 3: a cross-platform software environment for precise analysis of mass spectrometric data. Anal. Chem. 2010; 82:4648–4651. [DOI] [PubMed] [Google Scholar]
- 46. Liu P., Jenkins N.A., Copeland N.G.. A highly efficient recombineering-based method for generating conditional knockout mutations. Genome Res. 2003; 13:476–484. [DOI] [PMC free article] [PubMed] [Google Scholar]
- 47. Sheikh B.N., Bechtel-Walz W., Lucci J., Karpiuk O., Hild I., Hartleben B., Vornweg J., Helmstadter M., Sahyoun A.H., Bhardwaj V. et al.. MOF maintains transcriptional programs regulating cellular stress response. Oncogene. 2016; 35:2698–2710. [DOI] [PMC free article] [PubMed] [Google Scholar]
- 48. Peng L., Ling H., Yuan Z., Fang B., Bloom G., Fukasawa K., Koomen J., Chen J., Lane W.S., Seto E.. SIRT1 negatively regulates the activities, functions, and protein levels of hMOF and TIP60. Mol. Cell Biol. 2012; 32:2823–2836. [DOI] [PMC free article] [PubMed] [Google Scholar]
- 49. Crissman H.A., Steinkamp J.A.. Rapid, simultaneous measurement of DNA, protein, and cell volume in single cells from large mammalian cell populations. J. Cell Biol. 1973; 59:766–771. [DOI] [PMC free article] [PubMed] [Google Scholar]
- 50. Krishan A. Rapid flow cytofluorometric analysis of mammalian cell cycle by propidium iodide staining. J. Cell Biol. 1975; 66:188–193. [DOI] [PMC free article] [PubMed] [Google Scholar]
- 51. Stegmaier K., Ross K.N., Colavito S.A., O’Malley S., Stockwell B.R., Golub T.R.. Gene expression-based high-throughput screening(GE-HTS) and application to leukemia differentiation. Nat. Genet. 2004; 36:257–263. [DOI] [PubMed] [Google Scholar]
- 52. Bueno C., Catalina P., Melen G.J., Montes R., Sanchez L., Ligero G., Garcia-Perez J.L., Menendez P.. Etoposide induces MLL rearrangements and other chromosomal abnormalities in human embryonic stem cells. Carcinogenesis. 2009; 30:1628–1637. [DOI] [PubMed] [Google Scholar]
- 53. Bueno C., Montes R., Martin L., Prat I., Hernandez M.C., Orfao A., Menendez P.. NG2 antigen is expressed in CD34+ HPCs and plasmacytoid dendritic cell precursors: is NG2 expression in leukemia dependent on the target cell where leukemogenesis is triggered. Leukemia. 2008; 22:1475–1478. [DOI] [PubMed] [Google Scholar]
- 54. Prieto C., Lopez-Millan B., Roca-Ho H., Stam R.W., Romero-Moya D., Rodriguez-Baena F.J., Sanjuan-Pla A., Ayllon V., Ramirez M., Bardini M. et al.. NG2 antigen is involved in leukemia invasiveness and central nervous system infiltration in MLL-rearranged infant B-ALL. Leukemia. 2018; 32:633–644. [DOI] [PMC free article] [PubMed] [Google Scholar]
- 55. Pryde J.G., Walker A., Rossi A.G., Hannah S., Haslett C.. Temperature-dependent arrest of neutrophil apoptosis. Failure of Bax insertion into mitochondria at 15 degrees C prevents the release of cytochrome c. J. Biol. Chem. 2000; 275:33574–33584. [DOI] [PubMed] [Google Scholar]
- 56. Simon J.M., Giresi P.G., Davis I.J., Lieb J.D.. Using formaldehyde-assisted isolation of regulatory elements (FAIRE) to isolate active regulatory DNA. Nat. Protoc. 2012; 7:256–267. [DOI] [PMC free article] [PubMed] [Google Scholar]
- 57. Simon J.M., Giresi P.G., Davis I.J., Lieb J.D.. A detailed protocol for formaldehyde-assisted isolation of regulatory elements (FAIRE). Curr. Protoc. Mol. Biol. 2013; doi:10.1002/0471142727.mb2126s102. [DOI] [PubMed] [Google Scholar]
- 58. Urdinguio R.G., Lopez-Serra L., Lopez-Nieva P., Alaminos M., Diaz-Uriarte R., Fernandez A.F., Esteller M.. Mecp2-null mice provide new neuronal targets for Rett syndrome. PLoS One. 2008; 3:e3669. [DOI] [PMC free article] [PubMed] [Google Scholar]
- 59. Zhang K., Williams K.E., Huang L., Yau P., Siino J.S., Bradbury E.M., Jones P.R., Minch M.J., Burlingame A.L.. Histone acetylation and deacetylation: identification of acetylation and methylation sites of HeLa histone H4 by mass spectrometry. Mol. Cell Proteomics. 2002; 1:500–508. [DOI] [PubMed] [Google Scholar]
- 60. Galasinski S.C., Resing K.A., Ahn N.G.. Protein mass analysis of histones. Methods. 2003; 31:3–11. [DOI] [PubMed] [Google Scholar]
- 61. Turner B.M., O’Neill L.P., Allan I.M.. Histone H4 acetylation in human cells. Frequency of acetylation at different sites defined by immunolabeling with site-specific antibodies. FEBS Lett. 1989; 253:141–145. [DOI] [PubMed] [Google Scholar]
- 62. Feng J., Liu T., Zhang Y.. Using MACS to identify peaks from ChIP-Seq data. Curr. Protoc. Bioinformatics. 2011; doi:10.1002/0471250953.bi0214s34. [DOI] [PMC free article] [PubMed] [Google Scholar]
- 63. Ernst J., Kellis M.. ChromHMM: automating chromatin-state discovery and characterization. Nat. Methods. 2012; 9:215–216. [DOI] [PMC free article] [PubMed] [Google Scholar]
- 64. Purton L.E., Bernstein I.D., Collins S.J.. All-trans retinoic acid delays the differentiation of primitive hematopoietic precursors (lin-c-kit+Sca-1(+)) while enhancing the terminal maturation of committed granulocyte/monocyte progenitors. Blood. 1999; 94:483–495. [PubMed] [Google Scholar]
- 65. Breitman T.R., Selonick S.E., Collins S.J.. Induction of differentiation of the human promyelocytic leukemia cell line (HL-60) by retinoic acid. Proc. Natl. Acad. Sci. U.S.A. 1980; 77:2936–2940. [DOI] [PMC free article] [PubMed] [Google Scholar]
- 66. Nishizawa Y., Saeki K., Hirai H., Yazaki Y., Takaku F., Yuo A.. Potent inhibition of cell density-dependent apoptosis and enhancement of survival by dimethyl sulfoxide in human myeloblastic HL-60 cells. J. Cell Physiol. 1998; 174:135–143. [DOI] [PubMed] [Google Scholar]
- 67. Saeki K., Yuo A., Kato M., Miyazono K., Yazaki Y., Takaku F.. Cell density-dependent apoptosis in HL-60 cells, which is mediated by an unknown soluble factor, is inhibited by transforming growth factor beta1 and overexpression of Bcl-2. J. Biol. Chem. 1997; 272:20003–20010. [DOI] [PubMed] [Google Scholar]
- 68. Vaquero A., Scher M.B., Lee D.H., Sutton A., Cheng H.L., Alt F.W., Serrano L., Sternglanz R., Reinberg D.. SirT2 is a histone deacetylase with preference for histone H4 Lys 16 during mitosis. Genes Dev. 2006; 20:1256–1261. [DOI] [PMC free article] [PubMed] [Google Scholar]
- 69. Marks P.A., Breslow R.. Dimethyl sulfoxide to vorinostat: development of this histone deacetylase inhibitor as an anticancer drug. Nat. Biotechnol. 2007; 25:84–90. [DOI] [PubMed] [Google Scholar]
- 70. Dubrez L., Goldwasser F., Genne P., Pommier Y., Solary E.. The role of cell cycle regulation and apoptosis triggering in determining the sensitivity of leukemic cells to topoisomerase I and II inhibitors. Leukemia. 1995; 9:1013–1024. [PubMed] [Google Scholar]
- 71. Tyurina Y.Y., Serinkan F.B., Tyurin V.A., Kini V., Yalowich J.C., Schroit A.J., Fadeel B., Kagan V.E.. Lipid antioxidant, etoposide, inhibits phosphatidylserine externalization and macrophage clearance of apoptotic cells by preventing phosphatidylserine oxidation. J. Biol. Chem. 2004; 279:6056–6064. [DOI] [PubMed] [Google Scholar]
- 72. Boix-Chornet M., Fraga M.F., Villar-Garea A., Caballero R., Espada J., Nunez A., Casado J., Largo C., Casal J.I., Cigudosa J.C. et al.. Release of hypoacetylated and trimethylated histone H4 is an epigenetic marker of early apoptosis. J. Biol. Chem. 2006; 281:13540–13547. [DOI] [PubMed] [Google Scholar]
- 73. Brinkmann V., Reichard U., Goosmann C., Fauler B., Uhlemann Y., Weiss D.S., Weinrauch Y., Zychlinsky A.. Neutrophil extracellular traps kill bacteria. Science. 2004; 303:1532–1535. [DOI] [PubMed] [Google Scholar]
- 74. Oberhammer F., Wilson J.W., Dive C., Morris I.D., Hickman J.A., Wakeling A.E., Walker P.R., Sikorska M.. Apoptotic death in epithelial cells: cleavage of DNA to 300 and/or 50 kb fragments prior to or in the absence of internucleosomal fragmentation. EMBO J. 1993; 12:3679–3684. [DOI] [PMC free article] [PubMed] [Google Scholar]
- 75. Zhu Y., Gong K., Denholtz M., Chandra V., Kamps M.P., Alber F., Murre C.. Comprehensive characterization of neutrophil genome topology. Genes Dev. 2017; 31:141–153. [DOI] [PMC free article] [PubMed] [Google Scholar]
- 76. Olins D.E., Olins A.L.. Granulocyte heterochromatin: defining the epigenome. BMC Cell Biol. 2005; 6:39. [DOI] [PMC free article] [PubMed] [Google Scholar]
- 77. Gupta A., Hunt C.R., Pandita R.K., Pae J., Komal K., Singh M., Shay J.W., Kumar R., Ariizumi K., Horikoshi N. et al.. T-cell-specific deletion of Mof blocks their differentiation and results in genomic instability in mice. Mutagenesis. 2013; 28:263–270. [DOI] [PMC free article] [PubMed] [Google Scholar]
- 78. Valerio D.G., Xu H., Eisold M.E., Woolthuis C.M., Pandita T.K., Armstrong S.A.. Histone acetyltransferase activity of MOF is required for adult but not early fetal hematopoiesis in mice. Blood. 2016; 129:48–59. [DOI] [PMC free article] [PubMed] [Google Scholar]
- 79. Krishnan V., Chow M.Z., Wang Z., Zhang L., Liu B., Liu X., Zhou Z.. Histone H4 lysine 16 hypoacetylation is associated with defective DNA repair and premature senescence in Zmpste24-deficient mice. Proc. Natl. Acad. Sci. U.S.A. 2011; 108:12325–12330. [DOI] [PMC free article] [PubMed] [Google Scholar]
- 80. Osorio F.G., Varela I., Lara E., Puente X.S., Espada J., Santoro R., Freije J.M., Fraga M.F., Lopez-Otin C.. Nuclear envelope alterations generate an aging-like epigenetic pattern in mice deficient in Zmpste24 metalloprotease. Aging Cell. 2010; 9:947–957. [DOI] [PubMed] [Google Scholar]
- 81. Yang D., Arya G.. Structure and binding of the H4 histone tail and the effects of lysine 16 acetylation. Phys. Chem. Chem. Phys. 2011; 13:2911–2921. [DOI] [PubMed] [Google Scholar]
- 82. Zhang B., Wolynes P.G.. Genomic energy landscapes. Biophys. J. 2017; 112:427–433. [DOI] [PMC free article] [PubMed] [Google Scholar]
- 83. Zhou Y., Grummt I.. The PHD finger/bromodomain of NoRC interacts with acetylated histone H4K16 and is sufficient for rDNA silencing. Curr. Biol. 2005; 15:1434–1438. [DOI] [PubMed] [Google Scholar]
- 84. Taylor G.C., Eskeland R., Hekimoglu-Balkan B., Pradeepa M.M., Bickmore W.A.. H4K16 acetylation marks active genes and enhancers of embryonic stem cells, but does not alter chromatin compaction. Genome Res. 2013; 23:2053–2065. [DOI] [PMC free article] [PubMed] [Google Scholar]
- 85. Khodarev N.N., Bennett T., Shearing N., Sokolova I., Koudelik J., Walter S., Villalobos M., Vaughan A.T.. LINE L1 retrotransposable element is targeted during the initial stages of apoptotic DNA fragmentation. J. Cell Biochem. 2000; 79:486–495. [PubMed] [Google Scholar]
- 86. Di Filippo M., Bernardi G.. The early apoptotic DNA fragmentation targets a small number of specific open chromatin regions. PLoS One. 2009; 4:e5010. [DOI] [PMC free article] [PubMed] [Google Scholar]
- 87. Rea S., Xouri G., Akhtar A.. Males absent on the first (MOF): from flies to humans. Oncogene. 2007; 26:5385–5394. [DOI] [PubMed] [Google Scholar]
- 88. Cotter T.G. Apoptosis and cancer: the genesis of a research field. Nat. Rev. Cancer. 2009; 9:501–507. [DOI] [PubMed] [Google Scholar]
- 89. Conway K.E., McConnell B.B., Bowring C.E., Donald C.D., Warren S.T., Vertino P.M.. TMS1, a novel proapoptotic caspase recruitment domain protein, is a target of methylation-induced gene silencing in human breast cancers. Cancer Res. 2000; 60:6236–6242. [PubMed] [Google Scholar]
Associated Data
This section collects any data citations, data availability statements, or supplementary materials included in this article.
Supplementary Materials
Data Availability Statement
Supplementary Tables generated during this study are included in the online version of this manuscript and, with the source code, are also available in the Zenodo public repository, DOI: 10.5281/zenodo.2425053. Raw data corresponding to ChIP-seq experiments is uploaded in SRA database BioProject: PRJNA480011 with the accession numbers SUB4245394 and SUB5124343.