LEARNING POINTS
Sample size calculation is an essential methodological issue in clinical research. It is crucial to ensure that the study has sufficient participants in order to detect the expected effect estimate. Moreover, it has been advocated that the underpowered clinical trials lead to wastage of time, money, and resources, and are not ethical as they do not generate expected results and expose the patients to a higher risk. Considering the importance of this methodological point, we shall commence the research methodology section of the Advanced Journal of Emergency Medicine with a series of educational letters explaining the method to calculate the sample size for various clinical research study designs. For more illustration, each educational note will be accompanied by a real-life example from the published articles in emergency medicine research. This is the first article of our educational series where we have explained the sample size calculation based on a prevalence rate.
Before we explain the sample size calculation procedure for a prevalence study, It is important to understand the types of population in clinical research and their respective definitions (1).
Types of Population
There are three types of population in any research study, and they are defined as follows (Figure 1):
Figure 1.
The types of the study population in a clinical research study
1) The target population: this refers to all individuals with the disease or the condition of interest on whom the study findings will be generalized and applied.
2) The accessible population: this refers to all individuals with the disease or the condition of interest who are accessible for the study investigators.
3) The sample population: this refers to the individuals with the disease or the condition of interest who will be included in a study. Assume that we have a team of researchers who are concerned for the global mortality rates caused due to traumatic brain injury. The team includes researchers from Egypt, Turkey, Libya, and Iran, and they recruited 1000 cases from their countries with an aim of determining the predictors of mortality following traumatic brain injury. The target population in this study will be defined as all individuals with traumatic brain injury worldwide, the accessible population will be defined as all individuals with traumatic brain injury who are accessible for the study investigators (attending the clinics/hospitals of the study investigators), and the sample population will be defined as the 1000 cases that were included in the study.
Use of the sample size calculation procedure of the prevalence rate
The methods explained hereafter should be used if the primary outcome of a research study is expressed as a rate or a single proportion (i.e., prevalence rate). Although the rates and proportions are mainly obtained from the cross-sectional studies, other research designs might follow a similar scenario if the primary outcome is to detect a proportion or a rate, for example, 1) a prospective study of 500 cases of traumatic brain injury to determine the survival rate at their center; and 2) a single arm clinical trial to evaluate the safety of ABI-009, an mTOR inhibitor, for patients with pulmonary arterial hypertension; in this study, the frequency of adverse events in the study population was reported.
Requirements for sample size calculation based on the prevalence rate
1) Population size: this indicates an estimate of the number of individuals in the target population.
2) Expected prevalence: this is the expected proportion or rate.
3) Confidence level (usually 95%)
4) Accepted deviation from the expected prevalence (commonly 5%)
Example: a Case study of PTSD in ICU patients
Consider conducting a cross-sectional study to evaluate the prevalence of posttraumatic stress disorder (PTSD) among the ICU patients in Alexandria teaching hospitals. The literature revealed that the prevalence of PTSD among the ICU patients was 32.3% (2). The population size can be estimated from a previous study on the ICU patients in Alexandria teaching hospitals; the study reported an average of 1278 ICU patients attending the hospitals every year (3). The following steps will indicate the methodology to calculate the sample size in order to detect a rate of 32.3% in a population size of 1278 patients per year with a 95% confidence level and 5% absolute deviation from the population proportion.
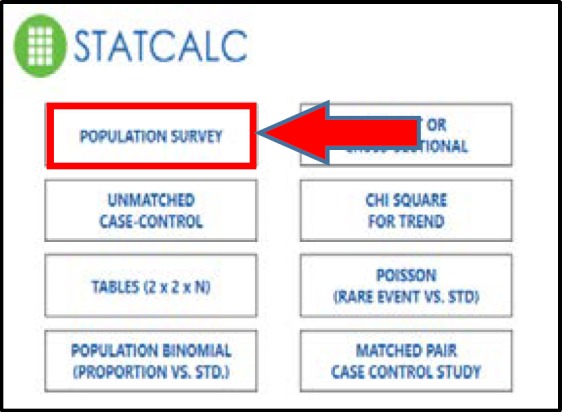
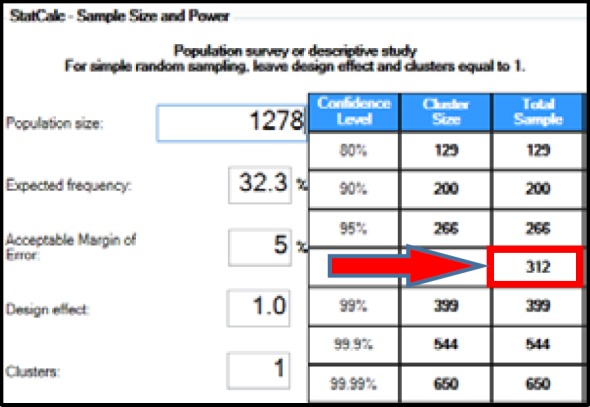
The data will be calculated by the Epi Info, a program developed by the Centers for Disease Control and Prevention, available via the link https://www.cdc.gov/epiinfo/index.html. Initially, open the software; then select “STATCALC” for sample size calculation options (Figure 2). Thereafter, select “population survey” (Figure 3). Eventually, submit the data and check the table for the calculation results. As depicted in figure 4, the results table reveals a sample size of 266 participants corresponding with a 95% confidence level. Therefore, the sample size required for this study will be 266 patients. In case of using a clustered sampling method, the number of clusters will be submitted instead of the “1” cluster.
Figure 2.

Epi Info main menu
Figure 3.

STATCALC menu
Figure 4.

Calculated result
References
- 1.Elfil M, Negida A. Sampling methods in Clinical Research; an Educational Review. Emergency. 2017;5(1):e52. [PMC free article] [PubMed] [Google Scholar]
- 2.Asimakopoulou E, Madianos M. The prevalence of major depression-PTSD comorbidity among ICU survivors in five general hospitals of athens: A cross-sectional study. Issues Ment Health Nurs. 2014;35(12):954–63. doi: 10.3109/01612840.2014.924609. [DOI] [PubMed] [Google Scholar]
- 3.Abd Elhafeez S, Tripepi G, Quinn R, Naga Y, Abdelmonem S, Abdelhady M, et al. Risk, predictors, and outcomes of acute kidney injury in patients admitted to intensive care Units in Egypt. Sci Rep. 2017;7(1):17163. doi: 10.1038/s41598-017-17264-7. [DOI] [PMC free article] [PubMed] [Google Scholar]


