Abstract
Background
There is a marked need for improved animal models of nonalcoholic steatohepatitis (NASH) to facilitate the development of more efficacious drug therapies for the disease.
Methods
Here, we investigated the development of fibrotic NASH in male Wistar rats fed a choline-deficient l-amino acid-defined (CDAA) diet with or without cholesterol supplementation for subsequent assessment of drug treatment efficacy in NASH biopsy-confirmed rats. The metabolic profile and liver histopathology were evaluated after 4, 8, and 12 weeks of dieting. Subsequently, rats with biopsy-confirmed NASH were selected for pharmacological intervention with vehicle, elafibranor (30 mg/kg/day) or obeticholic acid (OCA, 30 mg/kg/day) for 5 weeks.
Results
The CDAA diet led to marked hepatomegaly and fibrosis already after 4 weeks of feeding, with further progression of collagen deposition and fibrogenesis-associated gene expression during the 12-week feeding period. Cholesterol supplementation enhanced the stimulatory effect of CDAA on gene transcripts associated with fibrogenesis without significantly increasing collagen deposition. Pharmacological intervention with elafibranor, but not OCA, significantly reduced steatohepatitis scores, and fibrosis-associated gene expression, however, was unable to prevent progression in fibrosis scores.
Conclusion
CDAA-fed rats develop early-onset progressive NASH, which offers the opportunity to probe anti-NASH compounds with potential disease-modifying properties.
Keywords: NASH, CDAA, Cholesterol, Elafibranor, OCA, Fibrosis
Introduction
Nonalcoholic fatty liver disease (NAFLD) is the most common liver disease influencing approximately 25% of the general population of the Western countries [1, 2]. NAFLD ranges from benign, steatosis to its most aggressive manifestation, nonalcoholic steatohepatitis (NASH), which is characterized by steatosis, inflammation, and hepatocyte degeneration (ballooning) [3]. Patients with NASH are at increased risk of developing liver fibrosis which is the main prognostic factor for cirrhosis, primary liver cancer, and end-stage liver disease [4, 5]. With the increasing NASH burden, it is therefore projected that advanced fibrotic NASH will be the leading indication for liver transplantation in developing countries by 2020 [6]. Although considerable progress has been made in the understanding of the cellular and molecular mechanisms in NASH, no evidence-based drug treatments approved for NASH management exist. NASH is therefore classified as a medical condition with high unmet therapeutic need. Several drug treatment concepts are in various stages of clinical development for NASH [7, 8].
The primary driver of NASH is overnutrition and obesity. Several diet-induced obese (DIO) models of NASH have been developed in an attempt to mimic the etiology of the disease [9]. Animals fed a diet high in fat and carbohydrates develop adiposity, insulin resistance, dyslipidemia, and fatty liver. Depending on the macronutrient composition, the DIO models may also exhibit features of liver inflammation and, to some degree, hepatocyte ballooning [10–16]. A major challenge with the high-fat/carbohydrate dieting paradigms is that very long dieting periods (typically > 20 weeks) are required for the steatohepatitis condition to progress to hepatic fibrosis. Furthermore, the DIO models do not consistently exhibit histopathological features of advanced fibrotic (pre-cirrhotic) NASH making these animal models most applicable for probing drug effects on less severe stages of the disease [9, 17, 18]. The insufficient fibrotic response to hypercaloric diets has led to the development of nutrient-deficient dietary concepts that promote faster onset of NASH and severe fibrosis reminiscent of severe fibrotic NASH in humans [9]. Nutrient-deficient dietary models are either low or devoid of methionine and/or choline. Choline-deficient diets with low methionine levels can be made even less lipotrope by replacing nutrient proteins with l-amino acids, i.e., choline-deficient amino acid-defined (CDAA) diet, which further impedes hepatic lipid clearance that enhances hepatomegaly, steatosis, and lipotoxic hepatocyte damage. In rats and mice, CDAA diet regimens promote severe fibrosis with the development of frank cirrhosis after extended dieting periods [19–22]. In contrast to the pronounced weight loss attained by methionine–choline-deficient (MCD) dieting regimens, CDAA diets are weight neutral [20, 23], which makes the CDAA model attractive for also assessing effects on gross metabolic parameters of potential anti-NASH compounds. Although the CDAA model has been extensively characterized in the context of hepatopathology, relatively few pharmacological studies have so far been reported in rodent CDAA models of NASH [19, 22, 24–27], and there is a marked lack of knowledge on the responsiveness of the CDAA model to drugs that are in current clinical development for NASH [9].
Hepatic cholesterol homeostasis is dysregulated in NAFLD, and there is an increasing appreciation that the lipotoxic properties of elevated free cholesterol can contribute to the development and progression of NASH by stimulation of detrimental immune cell responses with resulting hepatocyte necroinflammation and enhanced fibrogenesis [28, 29]. We therefore investigated whether cholesterol supplementation could enhance the hepatotoxic properties of CDAA dieting in rats, as compared to CDAA dieting alone. In addition, we characterized the effects of obeticholic acid (OCA) and elafibranor in this novel cholesterol-supplemented CDAA rat model of NASH. Both compounds are in late-stage clinical development for NASH [30, 31]. OCA is a first-in-class semisynthetic bile acid exerting its effect by binding to the nuclear farnesoid X receptor (FXR), thereby activating several regulators in bile acid synthesis and transport, hepatic lipid, and carbohydrate metabolism as well as immune function [32–35]. OCA attenuates hepatic inflammation and reduces low-grade hepatocyte ballooning and has recently been reported to reduce liver pathology in obese mouse models of NASH [13, 36–38]. Elafibranor is a high-affinity agonist for the nuclear peroxisome proliferator-activated alpha/delta receptor (PPAR-α/δ) and ameliorates NASH mainly by increasing the disposal of hepatic fatty acid as well as inhibiting pathways involved in inflammation and fibrosis [13, 39, 40].
Materials and Methods
Animals
Male Wistar rats (RjHan:WI, 6 weeks of age, 200–250 g) were obtained from Janvier Labs (Le Genest-Saint-Isle, France) and housed pairwise in a controlled environment (21 °C ± 2 °C, humidity 50% ± 10%) with a 12-h light/dark cycle. After acclimatizing, animals were fed either a choline-supplemented l-amino acid-defined (CSAA; E15668-04, kcal %; protein 12%, fat 16%, carbohydrates 72%) control diet or a choline-deficient l-amino acid-defined (CDAA, kcal %; protein 11%, fat 31%, carbohydrates 58%) diet without cholesterol (E15667-94), or supplemented with 1% cholesterol (CDAA + 1%chol, E15666-94) or 2% cholesterol (CDAA + 2%chol, E15665-94) for 4, 8, or 12 weeks. CDAA diets were all low in methionine (0.17%) compared to the CSAA diet (0.4%). All diets were obtained from ssniff Spezialdiäten GmbH (Soest, Germany).
In a subsequent study, the effect of pharmacological intervention was evaluated in rats fed either CSAA or CDAA + 1%chol for 9 weeks followed by 5 weeks of compound treatment. Three weeks prior to treatment start, a liver biopsy was collected for treatment stratification and within-subject analysis of treatment responses (see below), whereupon animals were single-housed during the remainder of the study. All animals had ad libitum access to the respective diets and tap water throughout the study. The animal studies were conducted according to licenses 13-011-G (Boehringer-Ingelheim) and 2013-15-2934-00784 (Gubra) and conformed with national guidelines for animal welfare.
Liver Biopsy Prior to Drug Treatment
A liver biopsy was collected according to procedures previously reported for mice [10, 11] with few modifications. In brief, rats were anesthetized with 3–5% isoflurane (Vetflurane, Virbac, Kolding, Denmark) in atmospheric air. A midline abdominal incision was made to expose the left lateral lobe, and a cone-shaped biopsy of 50–100 mg was collected and fixed in 4% paraformaldehyde overnight at room temperature for subsequent histological assessment. The cut surfaces were electrocoagulated using an electrosurgical unit (VIO 100C, Erbe, Marietta, GA). The liver was returned to the abdominal cavity, and the abdominal wall and the skin were sutured. Post-operative pain and infection were controlled by administering carprofen (5 mg/kg, Norodyl, ScanVet, Fredensborg, Denmark) and enrofloxacin (5 mg/kg, Baytril, Bayer, Leverkusen, Germany) prior to the surgery and on post-operative days 1 and 2. Animals were allowed to recover for 3 weeks post-surgery before treatment start.
Compound Treatment
Animals were stratified to treatment (n = 12 per group) based on baseline mean liver collagen 1a1 (Col1a1) and lipid content (steatosis), see histological procedures below. OCA (Angene Chemical, London, UK) and elafibranor (Synnovator Inc., Durham, NC) were dissolved in 0.5% Natrosol with 0.01% Tween 80 and administered in a dosing volume of 5 mL/kg. While maintained on the respective diet, animals received per oral (PO) dosing of vehicle, OCA (30 mg/kg/day) or elafibranor (30 mg/kg/day) twice daily for 5 weeks. CSAA and CDAA control group conditions, and data have been described in detail previously [41].
Tissue Collection
Upon completion, animals were killed by cardiac puncture under pentobarbital (Narcoren, Merial GmbH, Germany) or isoflurane (Vetflurane, Virbac, Kolding, Denmark) anesthesia, whereupon blood and liver were sampled. The blood sample was centrifuged (2000 g, 10 min, 4 °C), and plasma was collected and stored at − 80 °C. The liver was snap frozen in liquid nitrogen and stored at − 80 °C until processing for biochemistry triglycerides (TG) and hydroxyproline (HP), see below), or fixated in 4% paraformaldehyde and paraffin-embedded for subsequent histology (see below).
Plasma and Liver Biochemistry
Plasma levels of alanine aminotranferase (ALT) were determined using a Cobas Integra 400 or Cobas C-111 (Roche Diagnostics, Germany), according to the manufacturer’s instructions. Liver samples were homogenized using FastPrep tubes in 1 mL isopropanol. Samples were centrifuged (18,000 g, 5 min, 4 °C), and total TG levels were determined on a Cobas Integra 400 or Cobas C-111 analyzer (Roche Diagnostics, Mannheim, Germany), according to the manufacturer’s instructions. Liver HP content was determined according to previously reported procedures [10] with slight modifications. In brief, samples were hydrolyzed in 6 M HCl at 95 °C overnight, whereupon the samples were brought to room temperature, mixed, and centrifuged at 18,000 g for 10 min at 4 °C. The supernatant was transferred to a microtube and mixed in a 96- or 384-well microplate with assay and detection buffer, incubated at 65 °C, and measured at A560 nm using a spectrophotometer. Liver HP concentrations were extrapolated from the standard curve.
Histology
A fresh piece of liver was sectioned and fixed in 4% paraformaldehyde, embedded in paraffin, cut into 3–4-µm sections. Sections were subsequently stained for analysis of steatosis, inflammation and ballooning (hematoxylin–eosin, HE), fibrosis [Masson’s trichrome, Picro-Sirius red, collagen 1a1 (Col1a1)], α-SMA, as described previously [13, 41]. Immunohistochemical detection of CD45-positive leukocytes was performed on a Leica Bond-III autostainer (Leica Biosystems, Melbourne, Australia) using a polyclonal rabbit anti-human CD45 antibody (1:400; ab10558, Abcam) after heat-induced epitope retrieval with Bond™ Epitope Retrieval Solution 1 (ER1, Leica Biosystems, Newcastle, UK) for 30 min. Bound antibodies were visualized using the Bond™ Polymer Refine Detection System (Leica Biosystems, Newcastle, UK). Following scanning with the Axio Scan.Z1 (200 × magnification, Carl Zeiss Microscopy GmbH, Jena, Germany), the CD45-positive stained area was determined using HALO™ (Indica Labs, Corrales, NM, USA). Histological scoring was performed on HE- and Picro-Sirius Red-stained sections by a trained histopathologist. The NAFLD activity score (NAS) and fibrosis staging system were applied to liver pre-biopsies and terminal samples, according to Kleiner et al. [42]. Quantitative data were expressed as percent staining area relative to whole sectional area (fractional area; HE, α-SMA, collagen, CD45), whole liver content (multiplication of fractional area with corresponding total liver weight; HE, Col1a1), and number of immunopositive cells (cells per mm2; CD45). All histological assessments were performed by a pathologist blind to treatment.
RNA Isolation and Quantification
As previously described [41], liver samples (50 mg) were homogenized (3000 × g 3 min, Precellys Evolution, Bertin Technologies S.A.S, Montigny Le Bretonneux, France) in Lysing Matrix D Tubes (MP Biomedicals, Eschwege, Germany) containing RNeasy lysis buffer (Qiagen, Hilden, Germany) with 1% 2-mercaptoethanol added. The supernatant was collected, and phenol–chloroform isoamyl alcohol was added. Tubes were mixed and centrifuged at 12,000 × g for 5 min, and chloroform isoamyl alcohol was added and incubated for 3 min at room temperature. After a second centrifugation step, the upper phase was used for RNA extraction. Total RNA was isolated according to the manufacturer’s protocol (RNeasy, Qiagen, Hilden, Germany). RNA concentrations (260 nm) and purity (260/280 nm ratio) were analyzed using a NanoDrop ND-1000 UV–Vis Spectrophotometer (Thermo Scientific, Karlsruhe, Germany), and samples were then stored at − 80 °C until further analysis. RNA was reverse transcribed into cDNA (High-capacity cDNA Archive Kit, Applied Biosystems, Foster city, CA). PCR amplification was carried out on a thermal cycler, and the cDNA was stored at − 20 °C. For real-time qPCR analysis, sample reactions were carried out in triplicate with specific primers (Itgam Rn00709342_m1, Emr1 Rn01527631_m1, Tnfa Rn01525859_g1, Col1a1 Rn01463848_m1, Acta2 Rn01759928_g1, Tgfb Rn00572010_m1, Pai1 Rn01481341_m1, Ctgf Rn00573960_g1, Ehhadh Rn00592368_m1, Acox1 Rn01460628_m1 from Applied Biosystems) and mRNA data were evaluated with the software provided with the instrument (SDS v.2.2, Applied Biosystems). mRNA levels were calculated with reference to Ct-values of a dilution series of a standard total RNA sample and normalized to corresponding 18S rRNA levels. mRNA data were expressed as fold change to CSAA dieting for 4 weeks. For the drug treatment study, all mRNA data were expressed as fold change relative to control levels.
Statistical Analysis
All data were analyzed using either GraphPad Prism or RStudio software. All results are shown as mean ± standard error of mean (SEM). For the comparative study on different CDAA diet compositions, time-course data were analyzed using a two-way ANOVA with Tukey’s post hoc test. Treatment effects were analyzed using either one-way ANOVA with Tukey’s post hoc test or Fisher’s exact test with Bonferroni’s post hoc analysis (pre-post-analysis of fibrosis stage and NAS).
Results
Characterization of a Cholesterol-Supplemented CDAA Rat Model of NASH
Body Weight, Liver Weight, and Plasma/Liver Biochemistry
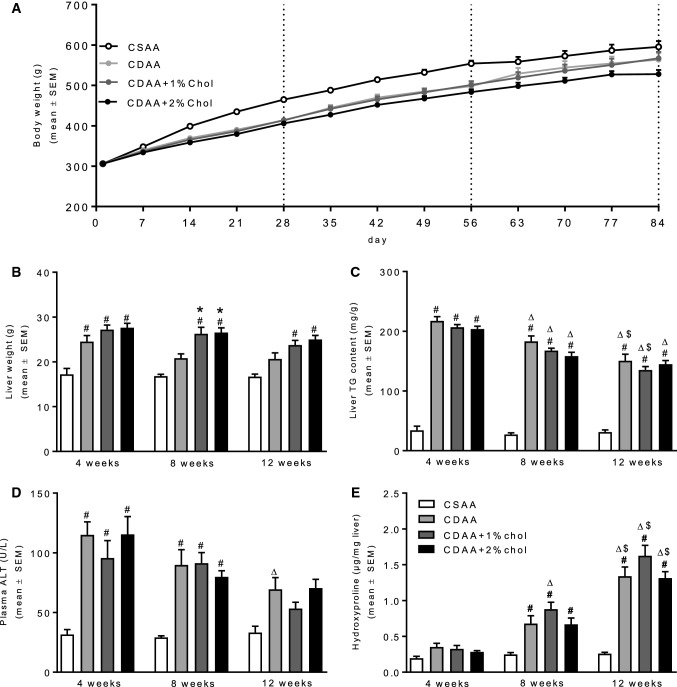
Rats fed a CDAA diet with or without cholesterol supplementation showed an initial slower body weight gain as compared to CSAA-fed controls (Fig. 1a). At 12 weeks of dieting, no significant weight difference was observed between the CSAA, CDAA, and CDAA + 1%chol groups, whereas rats fed CDAA + 2%chol exhibited a slight, however, nonsignificant, reduction in body weight gain compared to CSAA controls (Fig. 1a). CDAA rats showed significantly increased liver weight compared to the CSAA rats with hepatomegaly being even more robust in rats fed cholesterol-supplemented CDAA diets (Fig. 1b). All CDAA-fed groups had markedly elevated liver TG levels irrespectively of cholesterol supplementation which became less pronounced with increased duration of the dieting period (Fig. 1c). Similar dynamics were also noted for plasma ALT levels (Fig. 1d). While liver HP content progressively increased in CDAA-fed rats attaining statistical significance in dieting week 8 and 12, dietary cholesterol supplementation to the CDAA diet did not further influence liver HP levels (Fig. 1e).
Fig. 1.
Metabolic parameters during NASH progression. a Weekly body weight throughout the diet induction. b Liver weight at termination. c Liver TG content at termination. d Plasma alanine aminotransferase (ALT) at termination. e Liver HP content at termination. #P < 0.05 versus CSAA, *P < 0.05 versus CDAA, ∆P < 0.05 versus same diet at 4 weeks, $P < 0.05 versus same diet at 8 weeks
Histology and Gene Expression Analyses
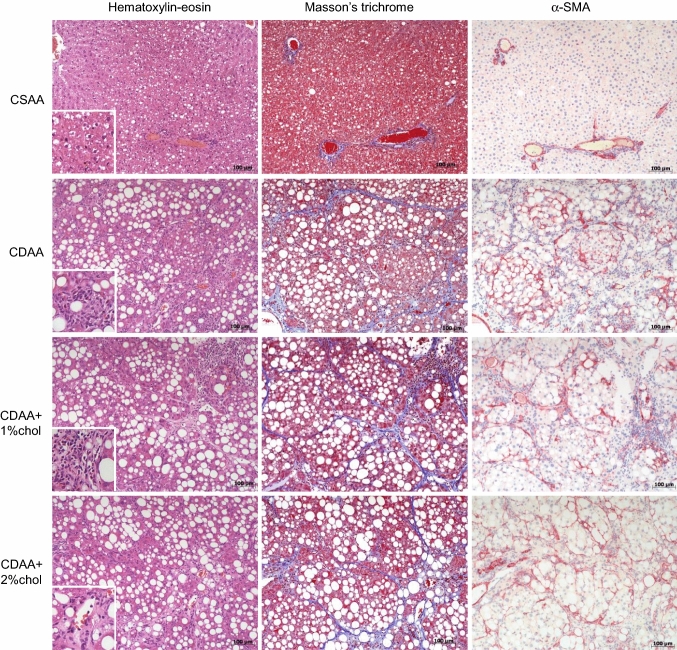
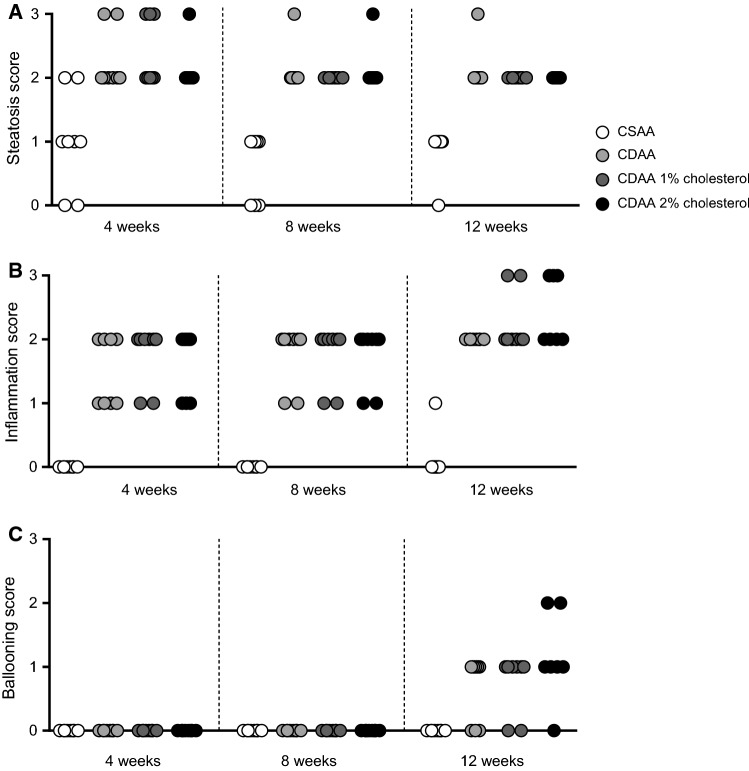
Representative images of liver HE, Masson’s trichrome, and α-SMA staining following 12 weeks of dieting are shown in Fig. 2. In general, the CDAA diet regimen led to marked alterations in liver pathology as evident by increased steatosis (primarily as macrovesicular steatosis), with inflammatory changes and increased fibrosis. Fibrosis consisted of fibers forming periportal–periportal, periportal–centrolobular, or centrolobular–centrolobular bridges with frequent nodule formations. Periportal inflammation and ballooning degeneration were observed, indicative of a progression from simple steatosis to steatohepatitis. Histopathological scores indicated onset of marked steatosis and mild-to-moderate lobular inflammation after 4 weeks of CDAA dieting irrespectively of cholesterol supplementation (Fig. 3a, b). Whereas steatosis severity tended to be reduced with prolonged CDAA dieting, inflammation scores were further elevated following 12 weeks of CDAA dieting. Hepatocyte ballooning was only consistently detected after 12 weeks of CDAA dieting (Fig. 3c).
Fig. 2.
Liver histopathology during NASH progression. Representative images of hematoxylin–eosin, Masson’s trichrome and α-SMA staining after 12 weeks on the respective diets. Figure inserts in hematoxylin–eosin photomicrographs for visualizing inflammatory cell infiltrates upon CDAA dieting. Scale bar, 100 µm
Fig. 3.
Histopathological scores during NASH progression. a Steatosis, b inflammation, c hepatocyte ballooning degeneration
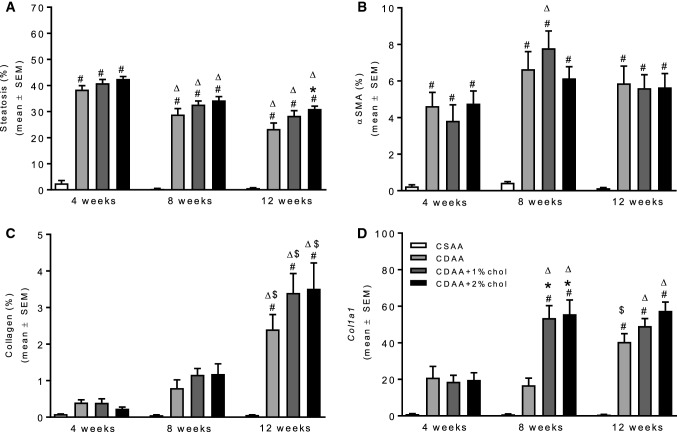
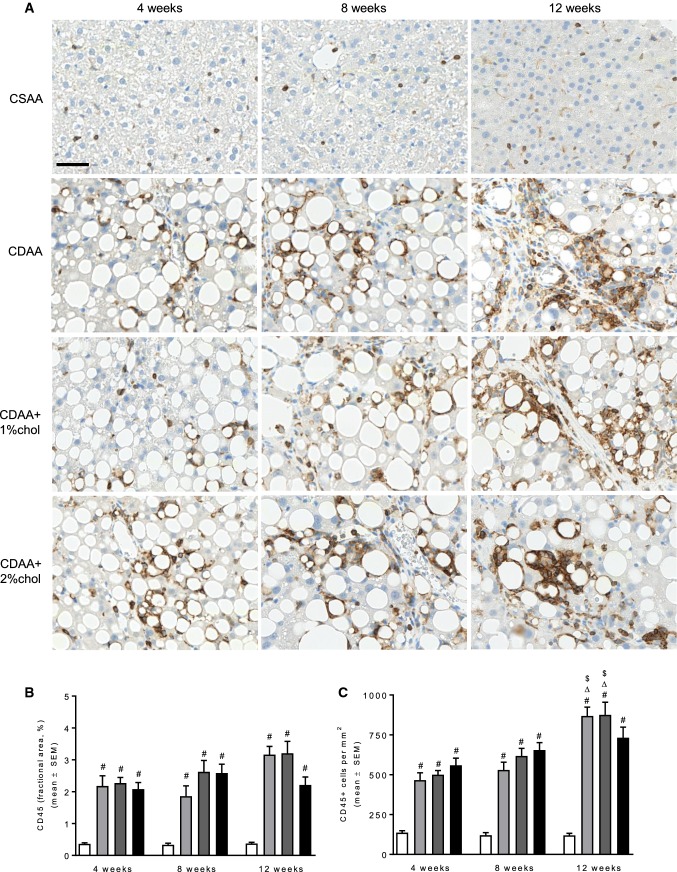
As compared to CSAA controls, quantitative liver lipid deposition was markedly increased in all individual CDAA dieting periods. The steatosis-inducing effect of the CDAA diet was unaffected by cholesterol supplementation (Fig. 4a). As for steatosis scores, the effect of CDAA dieting on quantitative liver lipid deposition was gradually reduced with increased dieting periods and, however, remained significantly elevated throughout the experiment (~ 30% fat) as compared to CSAA controls (~ 0.7% fat). Hepatic α-SMA levels (marker of activated hepatic stellate cells) were markedly upregulated in CDAA rats after 4 weeks dieting and remained stable at 8 and 12 weeks of dieting (Fig. 4b). Cholesterol supplementation did not stimulate α-SMA expression as compared to CDAA dieting alone. Liver collagen levels (based on Masson’s trichrome analysis) were also increased with CDAA dieting, showing a clear temporal progression with the highest levels observed after 12 weeks of dieting (Fig. 4c). Compared to CDAA dieting alone, cholesterol supplementation promoted more robust increases in collagen levels at dieting weeks 8 and 12. This temporal effect was closely paralleled by substantial increases in the expression of Col1a1 mRNA (Fig. 4d), as well as other transcripts associated with signaling pathways that stimulate fibrogenesis (Acta2, Ctgf) or inhibit fibrinolysis (Pai1) (see Table 1). Alterations in liver inflammation upon CDAA dieting were further suggested by markedly elevated levels of CD45-immunostained fractional area, numbers of CD45-immunopositive cells (Fig. 5), as well as mRNA levels of Itgam (implicated in leukocyte adhesive interactions), Emr1 (T cell regulatory protein), and Tnfα (inflammatory cytokine) (see Table 1). Cholesterol supplementation to the CDAA diet promoted further increments in the expression of these genes, being particularly evident for Itgam and Tnfa.
Fig. 4.
Histomorphometric changes during NASH progression. Fractional area of a steatosis, b α-SMA, c collagen. dCol1a1 mRNA expression. #P < 0.05 versus CSAA, *P < 0.05 versus CDAA. ∆P < 0.05 versus same diet at 4 weeks, $P < 0.05 versus same diet at 8 weeks
Table 1.
mRNA expression of Itgam, Emr1, and Tnfα from progression study
| Itgam | Emr1 | Tnfα | ||||||||||
|---|---|---|---|---|---|---|---|---|---|---|---|---|
| CSAA | CDAA | CDAA +1%chol | CDAA +2%chol | CSAA | CDAA | CDAA +1%chol | CDAA +2%chol | CSAA | CDAA | CDAA +1%chol | CDAA +2%chol | |
| 4 weeks | 1.0 ± 0.2 | 17.4 ± 2.5 | 19.0 ± 2.8# | 22.9 ± 3.5# | 1.0 ± 0.1 | 3.1 ± 0.5# | 4.1 ± 0.5# | 3.9 ± 0.4# | 1.0 ± 0.1 | 4.6 ± 0.8# | 5.5 ± 0.9# | 5.3 ± 0.6# |
| 8 weeks | 0.9 ± 0.2 | 15.0 ± 2.7 | 43.2 ± 5.4#*∆ | 36.0 ± 3.6#* | 0.7 ± 0.1 | 2.7 ± 0.4# | 4.6 ± 0.3#* | 4.8 ± 0.4#* | 0.6 ± 0.2 | 3.5 ± 0.5# | 7.7 ± 0.6#* | 8.1 ± 0.6#* |
| 12 weeks | 1.7 ± 0.2 | 34.1 ± 4.7#∆$ | 45.2 ± 5.3#∆ | 52.3 ± 4.3#*∆ | 1.3 ± 0.1 | 3.3 ± 0.4# | 3.9 ± 0.3# | 4.8 ± 0.2# | 1.4 ± 0.4 | 7.9 ± 0.8#$ | 9.9 ± 1.0#∆ | 9.9 ± 0.7#∆ |
| Acta2 | Pai1 | Ctgf | ||||||||||
|---|---|---|---|---|---|---|---|---|---|---|---|---|
| CSAA | CDAA | CDAA +1%chol | CDAA +2%chol | CSAA | CDAA | CDAA +1%chol | CDAA +2%chol | CSAA | CDAA | CDAA +1%chol | CDAA +2%chol | |
| 4 weeks | 1.0 ± 0.1 | 10.2 ± 1.4# | 10.2 ± 1.5# | 12.4 ± 1.2# | 1.0 ± 0.3 | 11.7 ± 2.4 | 15.9 ± 2.9 | 20.6 ± 2.6 | 1.0 ± 0.2 | 9.8 ± 1.6 | 21.6 ± 3.6 | 27.8 ± 3.3# |
| 8 weeks | 0.8 ± 0.2 | 7.9 ± 1.3 | 16.7 ± 1.9#* | 20.3 ± 3.0#* | 1.1 ± 0.4 | 10.3 ± 2.2 | 32.4 ± 6.4# | 36.2 ± 5.3# | 1.7 ± 0.6 | 16.1 ± 3.6 | 47.1 ± 7.7#*∆ | 51.1 ± 5.8#*∆ |
| 12 weeks | 1.6 ± 0.2 | 20.0 ± 2.9#∆$ | 19.5 ± 1.9#∆ | 20.1 ± 2.4# | 1.7 ± 0.7 | 32.9 ± 4.2# | 55.0 ± 14.4#∆ | 59.5 ± 13.0#∆ | 2.4 ± 0.4 | 58.3 ± 5.4#∆$ | 82.3 ± 6.3#*∆$ | 67.4 ± 7.6#∆ |
#P < 0.05 versus CSAA, *P < 0.05 versus CDAA, ∆P < 0.05 versus same diet at 4 weeks, $P < 0.05 versus same diet at 8 weeks
Fig. 5.
Leukocyte infiltration during NASH progression. a Representative images of CD45-positive leukocyte staining after 4–12 weeks on the respective diets. b Quantitative analysis of CD45-positive fractional area. c Quantitative analysis of the number of CD45-positive cells. Scale bar, 50 µm. #P < 0.05 versus CSAA, ∆P < 0.05 versus same diet at 4 weeks, $P < 0.05 versus same diet at 8 weeks
Drug Treatment in Rats Fed Cholesterol-Supplemented CDAA Diet
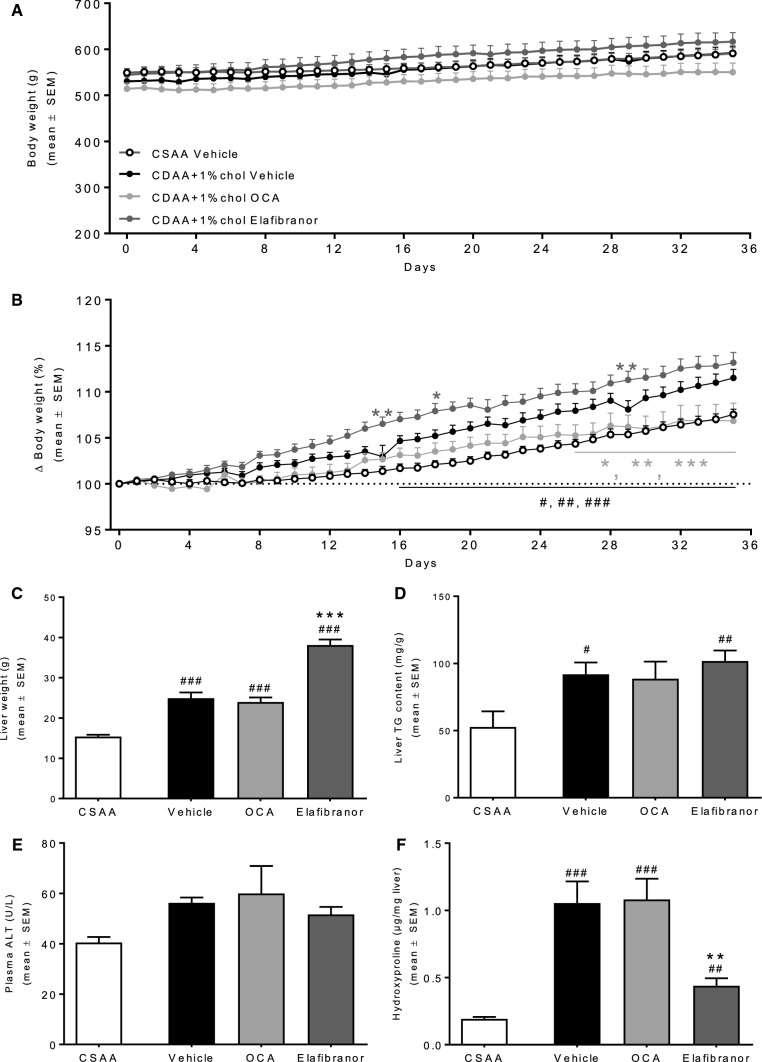
The effects of OCA and elafibranor treatment were evaluated in rats fed CDAA + 1%chol diet. All animals underwent liver biopsy 3 weeks before dosing start. Randomization and stratification to treatment were performed based on a quantitative histological assessment of individual baseline levels of liver Col1a1 and lipid deposition (fractional area). Vehicle-dosed CSAA and CDAA + 1%chol controls exhibited similar growth curves (Fig. 6a). When expressed relative to baseline, CDAA + 1%chol controls exhibited a slightly higher body weight gain compared to CSAA controls (Fig. 6b). Treatment with OCA (30 mg/kg/day) and elafibranor (30 mg/kg/day) did not affect absolute body weight in CDAA + 1%chol fed rats (Fig. 6a). When expressed as body weight gain relative to treatment start, OCA treatment marginally reduced the rate of body weight gain from treatment day 26 and onwards (Fig. 6b). In contrast, elafibranor treatment initially led to a modest increase in body weight gain, which gradually wore off during the remainder of the treatment period (Fig. 6b).
Fig. 6.
Metabolic parameters following drug treatment. a Daily body weight. b Body weight relative to day 0. c Liver weight. d Liver TG. e Plasma alanine aminotransferase (ALT). f Liver HP. #P < 0.05, ##P < 0.01, ###P < 0.001 versus CSAA vehicle, **P < 0.01, ***P < 0.001 versus CDAA + 1%chol vehicle
At study termination, CDAA + 1%chol fed rats had a significantly increased liver weight and TG content, as compared to CSAA controls (Fig. 6c, d). Plasma ALT levels were similar in CSAA and CDAA + 1%chol rats (Fig. 6e), whereas liver HP levels were markedly elevated in CDAA + 1%chol rats (Fig. 6f). While OCA treatment had no effect on hepatomegaly in CDAA + 1%chol rats, elafibranor treatment resulted in a marked increase in liver weight compared to CSAA controls (Fig. 6c), accompanied by increased mRNA expression of the peroxisomal enzymes, Acox1 and Ehhadhm (Table 2). OCA and elafibranor did not affect liver TG and plasma ALT levels in CDAA + 1%chol rats (Fig. 6d, e). In contrast, elafibranor, but not OCA, resulted in a significant reduction in liver HP levels (Fig. 6f).
Table 2.
mRNA expression of Acox1, Ehhadh, Itgam, Emr1, Tnfα, Tgfβ, Col1a1, and Acta2 from drug treatment study
| Gene | CSAA | Vehicle | OCA | Elafibranor |
|---|---|---|---|---|
| Acox1 | 1.0 ± 0.3 | 0.6 ± 0.0 | 0.6 ± 0.0 | 4.4 ± 0.7*** |
| Ehhadh | 1.0 ± 0.3 | 1.0 ± 0.1 | 0.9 ± 0.1 | 21.9 ± 1.9*** |
| Itgam | 1.0 ± 0.1## | 12.8 ± 3.4 | 14.9 ± 2.4 | 4.0 ± 0.6* |
| Emr1 | 1.0 ± 0.2## | 1.8 ± 0.2 | 2.0 ± 0.2 | 0.9 ± 0.0** |
| Tnfα | 1.0 ± 0.2### | 5.3 ± 0.6 | 6.7 ± 1.0 | 2.3 ± 0.3** |
| Tgfβ | 1.0 ± 0.1### | 4.7 ± 0.5 | 5.1 ± 0.7 | 2.0 ± 0.1*** |
| Col1a1 | 1.0 ± 0.2## | 21.3 ± 4.3 | 28.0 ± 6.7 | 6.0 ± 1.0* |
| Acta2 | 1.0 ± 0.3 | 2.2 ± 0.3 | 2.8 ± 0.5 | 0.9 ± 0.2 |
##P < 0.01, ###P < 0.001 versus CSAA vehicle, *P < 0.05, **P < 0.01, ***P < 0.001 versus CDAA + 1%chol vehicle
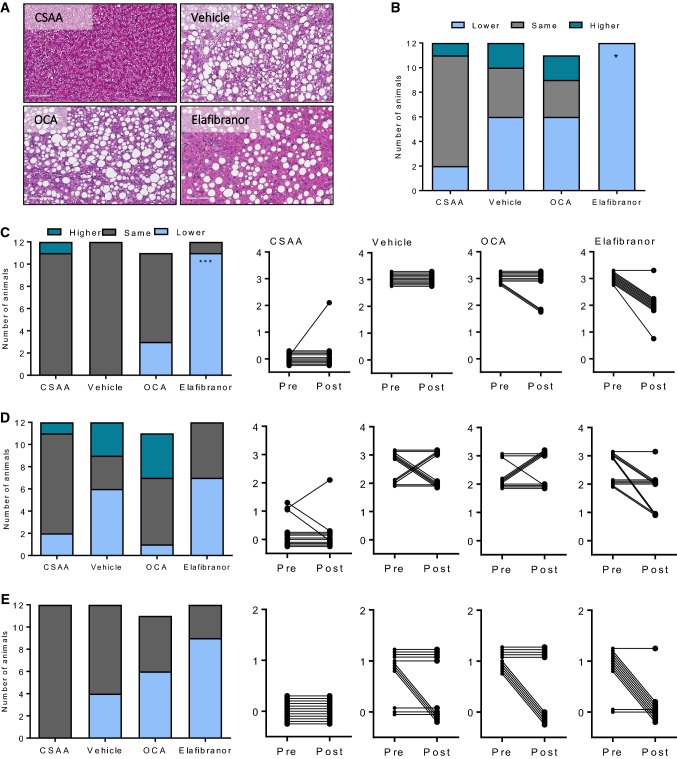
A comparative analysis of pre-biopsy (from dieting week 6) and terminal hepatopathology (dieting week 14) was performed in all rats (Fig. 7). Baseline hepatic steatosis (score 3) and lobular inflammation (score ≥ 2) were prominent histopathological features in CDAA + 1%chol rats. When present, ballooning was mild in CDAA + 1%chol rats (score 1). CSAA rats generally showed normal liver histopathology and remained nonfibrotic (score 0, 12/12). As compared to baseline, the temporal dynamics in NASH were not uniform in CDAA + 1%chol control rats (NAS, lower 6/12, same 4/12, higher 2/12, Fig. 7b). While pre-post steatosis scores remained unchanged in all CDAA + 1%chol rats (Fig. 7c), a subset of vehicle-dosed CDAA + 1%chol rats showed reduced inflammation (5/12 rats, Fig. 7d) and ballooning scores (4/12 rats, Fig. 7e) at termination compared to baseline. Compared to CDAA + 1%chol controls, OCA treatment did not influence NAS (lower 6/11, same 3/11, higher 2/11). In contrast, elafibranor significantly improved NAS (lower 12/12, P < 0.05) in CDAA + 1%chol rats (Fig. 7a, b). Improved NAS in elafibranor-treated CDAA + 1%chol rats was driven by consistent reductions in steatosis scores (11/12 rats, P < 0.001, Fig. 7a, c), and to a lesser extent, by resolution of ballooning scores (9/12 rats, P > 0.05, Fig. 7e). Compared to vehicle CDAA + 1%chol controls, inflammation scores were not significantly changed in elafibranor-treated CDAA + 1%chol rats (Fig. 7d). However, transcriptional levels of inflammation markers (Itgam, Emr1, Tnfα, Tgfβ) were significantly reduced following elafibranor treatment (Table 2).
Fig. 7.
NASH pathology after drug treatment. a Representative images of hematoxylin–eosin stainings. b Composite NAFLD Activity Score (NAS). c Steatosis score. d Inflammation score. e Ballooning degeneration score. *P < 0.05, ***P < 0.001 versus CDAA + 1%chol vehicle
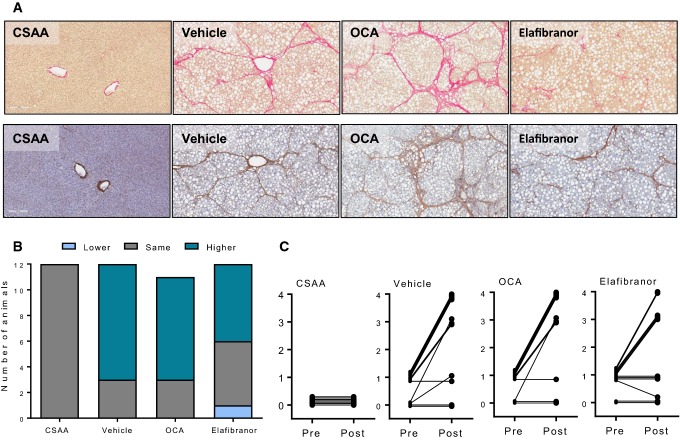
Fibrosis staging indicated that almost all vehicle-dosed CDAA + 1%chol rats (11/12) progressed in fibrosis severity over the course of the experiment (Fig. 8). Most CDAA + 1%chol controls exhibited severe liver fibrosis morphology (score 0, 1/12; score 1, 3/12; score 3, 3/12 rats; score 4, 5/12 rats), i.e., bridging fibrosis or cirrhosis histopathology was predominant at study termination (Fig. 8a, c). Irrespective of treatment, fibrosis stage 2 (combined perisinusoidal and portal/periportal fibrosis) was not observed in rats fed CDAA + 1%chol diet (n = 33). CSAA control rats remained nonfibrotic (score 0, 12/12). Fibrosis scores were not significantly altered upon OCA (lower 0/11, same 3/11, higher 8/11) and elafibranor (lower 1/12, same 5/12, higher 6/12) treatment, as compared to vehicle controls (lower 0/12, same 3/12, higher 9/12).
Fig. 8.
Liver fibrosis after drug treatment. a Representative images of Picro-Sirius red and Col1a1 staining. b Fibrosis stage. c Individual tracking of fibrosis stage
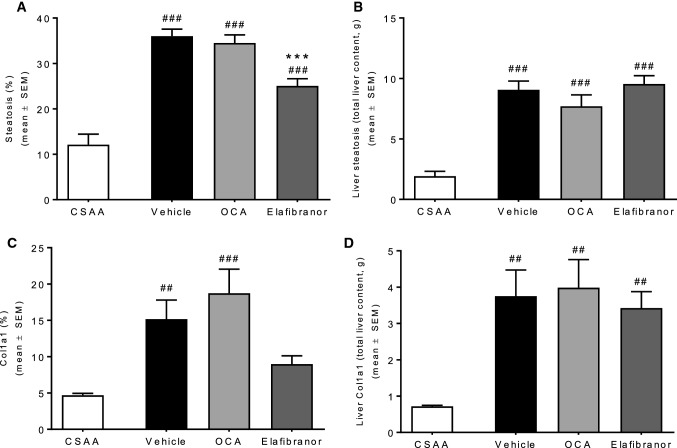
Quantitative liver fat analysis indicated that elafibranor, but not OCA, significantly reduced the fractional area of fat in CDAA + 1%chol rats (Fig. 9a, P < 0.001). In contrast, elafibranor had no significant effect on liver fat deposition when expressed as whole liver content (Fig. 9b, P > 0.05). The fractional area of Col1a1 was similar in vehicle and OCA-dosed CDAA + 1%chol rats and, however, tended to be reduced with elafibranor treatment (Fig. 9c). No changes were observed when expressed as total liver Col1a1 content (Fig. 9d). Elafibranor, but not OCA, significantly reduced Col1a1 mRNA levels (Table 2).
Fig. 9.
Quantitative histology after drug treatment a Steatosis %. b Steatosis in grams. c Collagen 1a1%. d Collagen 1a1 in grams. ##P < 0.01, ###P < 0.001 versus CSAA vehicle, ***P < 0.001 versus CDAA + 1%chol vehicle
Discussion
The present study characterized the impact of cholesterol supplementation in a CDAA diet-induced rat model of NASH. In agreement with previous studies [22, 23, 43], the standard CDAA diet was weight neutral in Wistar rats over a 12-week dieting period compared to rats receiving the CSAA control diet. Hepatomegaly, hepatic steatosis, and TG accumulation were prominent in rats fed the standard CDAA diet. Dietary cholesterol supplementation did not affect body weight gain, but accentuated hepatomegaly in CDAA diet-fed rats. Choline-deficient diets, including CDAA, are highly lipotrope and considered to promote steatosis as a result of increased fatty acid uptake and impaired hepatic TG secretory capacity [20, 44–46]. Similarly, increased dietary cholesterol intake is suggested to aggravate high-fat diet-induced steatosis by comparable mechanisms [13, 47, 48]. However, cholesterol supplementation did not lead to corresponding increases in hepatic TG deposition and steatosis in the present study, potentially due to a maximal suppression of hepatic TG secretion afforded by the CDAA diet alone. As choline deficiency has been reported to reduce biliary cholesterol excretion in rats [49], enhanced hepatomegaly may therefore tentatively be explained by hepatic cholesterol accumulation per se. Irrespective of cholesterol supplementation, liver TG levels and steatosis severity peaked early in the CDAA dieting period and became less prominent over time. In contrast, hepatic HP content, Col1a1 levels, and fibrogenic activity increased during the diet induction period. Similar opposing dynamics in liver TG and collagen deposition have also been reported in Fischer rats and C57BL/6J mice fed a standard CDAA diet for 12–14 weeks [20, 50].
It is well established that hepatocyte integrity is increasingly affected when NASH advances [51, 52]. This is also evident in CDAA diet-fed rats that show morphological features of hepatocellular damage, apoptosis (cell shrinkage/condensed nuclei), and connective tissue formation already after 4 weeks of dieting [53]. In rats fed the various CDAA diet types, hepatic inflammatory activity was suggested by significantly upregulated gene expression of Itgam, Emr1, and Tnfα, being in agreement with previous reports on recruitment of various immune cell populations [54–57] and increased hepatic TNF-α levels [58, 59] in other rodent CDAA diet-based models of NASH. The progressive increase in CD45-positive cells closely paralleled corresponding inflammation scores, indicating that leukocyte-mediated inflammation plays an integral role in development of the NASH phenotype of CDAA diet-fed rats. Although the specific composition of immune cell infiltrates was not characterized in the present study, activated liver-resident Kupffer cells and recruitment of extrahepatic macrophages have been suggested to play an important role in the initiation and progression of CDAA diet-induced liver inflammation [58–60], being consistent with the finding that the hepatic macrophage pool undergoes substantial changes during development of NASH [61–63].
Interestingly, the cholesterol-supplemented CDAA diet promoted more robust increases in Col1a1 expression, particularly at the mRNA level, and further stimulated mRNA expression of Itgam, Emr1, and Tnfα. The cholesterol-supplemented CDAA diet formulations tested in the present study were equally effective in promoting fibrotic NASH in rats. Collectively, these findings extend data recently reported by our research group [41] and suggest that cholesterol supplementation enhances the lipotrope properties of the CDAA diet, thereby further compromising liver function in the rat.
To further characterize the modified CDAA diet-induced rat model of NASH, a comparative pharmacological study was performed to determine effects of OCA and elafibranor treatment in rats fed a CDAA diet added 1% cholesterol. Because disease state heterogeneity is a critical confounding factor in the evaluation of treatment efficacy in both human NASH and animal models of the disease [9, 64], a baseline liver biopsy was sampled to enable within-subject analysis of treatment responses upon study termination. Moreover, the diagnostic liver pre-biopsy allowed for stratification of individual treatments based on baseline liver Col1a1 and fat deposition. Morphometric and quantitative histological analyses confirmed that rats rapidly developed NASH when fed a cholesterol-supplemented CDAA diet. The human NAFLD activity scoring (NAS) system is previously reported largely reproducible in rodent models of NASH [65], including standard CDAA diet-induced models [43, 66], and was therefore applied in the present study.
Rats fed a cholesterol-enriched CDAA diet for 6 weeks, i.e., 3 weeks prior to treatment start, fulfilled morphological criteria of NASH by the conspicuous presence of severe steatosis (score 3), moderate to marked lobular inflammation (score 2–3), and mild ballooning (score 1). Within-subject analysis in vehicle controls indicated sustained steatosis scores upon completion of dosing (14 weeks on diet), however, with a net reduction in inflammation and ballooning scores. These histopathological scoring data indicate spontaneous regression of inflammation and hepatocyte ballooning in a subset of rats fed the modified CDAA diet. Similar dynamics have previously been reported in mice fed a high-fat CDAA diet without cholesterol supplementation [20]. Most rats fed the cholesterol-supplemented CDAA diet were mildly fibrotic at baseline, and fibrosis progression was evident by markedly elevated fibrosis scores at study termination. Irrespectively of treatment, a subset of rats remained nonfibrotic or did not progress in fibrosis stage over the course of the study. These findings are in close agreement with previous reports on marked individual differences in the rate of NASH progression in rats fed a standard CDAA diet [41, 43], which argues for the importance of controlling for individual disease progression in CDAA diet-based models of NASH.
Drug treatment had very modest effects on body weight in rats fed the modified CDAA diet. Elafibranor, but not OCA, further increased liver weight without affecting hepatic TG deposition. A similar effect of elafibranor has been reported in diet-induced obese mouse models of NASH [13, 67], considered to be a rodent-specific PPAR-α stimulatory effect on hepatocyte peroxisome proliferation [68–70]. Elafibranor treatment led to a consistent reduction in NAS, predominantly associated with significantly reduced steatosis scores. This observation was also supported by a lower percentage of liver fat content. However, when corrected for the higher liver mass no changes in total liver fat content were observed in elafibranor-treated rats compared to vehicle controls. Likewise, total liver TG content remained unchanged, signifying that elafibranor treatment altered liver fat morphology but had no overall effect on liver fat content. Although liver HP content was significantly reduced, fibrosis scores were unaltered after 5 weeks of elafibranor treatment. Whereas liver Col1a1 protein levels were not sufficiently reduced to attain statistical significance, Col1a1 gene transcription was significantly downregulated and corresponding Col1a1 protein expression remained low, albeit this effect did not attain statistical significance. In combination with the reduction in transcriptional markers associated with inflammation and stellate cell activation, this indicates that several disease-associated gene expression programs were markedly suppressed by elafibranor treatment. The lack of improved histopathology in the context of notable reductions in transcriptional markers of inflammation and fibrogenesis invites the possibility that prolonged treatment with elafibranor might lead to reduced inflammatory and fibrotic pathology in the present rat model of NASH, thereby more closely recapitulating clinical effects of elafibranor [31]. Accordingly, a similar dose of elafibranor has previously been shown to reduce steatohepatitis and liver fibrosis following 7 weeks of treatment to MCD diet-fed db/db mice [67], and other PPAR agonists can reduce fibrotic NASH when administered for 10–12 weeks in mouse and rat CDAA models [23, 71]. Previous studies have reported anti-steatotic, anti-inflammatory, and anti-fibrotic effects of PPAR subtype-selective agonists for the α [72, 73], δ [74, 75], and γ [76, 77] isoforms, making it conceivable that elafibranor, a dual PPAR-α/δ agonist, exerts its therapeutic effects through various PPAR-associated signaling mechanisms.
OCA did not affect hepatopathology in Wistar rats fed a modified CDAA diet, which contrasts a recent clinical phase-II trial, reporting significant improvements in all NAS components following OCA treatment [30]. A previous study reported that OCA significantly lowered hepatic collagen deposition, in a CDAA model in Fischer rats [24], possibly suggesting strain-dependent effects of OCA in the rat CDAA model of NASH, whereas another FXR agonist, WAY-362450, had no effect on steatosis, however reduced hepatic inflammatory cell infiltration, pro-fibrotic gene expression and collagen deposition in MCD diet-fed mice [78]. Both studies administered FXR agonists during the whole dieting period (i.e., before onset of NASH), implying that this drug class may only prevent, and not reverse, liver fibrosis in nutrient-deficient diet-induced models of NASH.
In conclusion, we have characterized a novel cholesterol-supplemented CDAA rat model of NASH with robust hepatic fibrosis. Biopsy-confirmed histopathology was applied to control for individual rates of disease progression, which provided a unique opportunity to study within-subject treatment responses in the model. The model reflects the human NASH phenotype and disease progression, and due to the stable induction of the phenotype within a short time frame, this model could serve as a valuable tool to characterize novel treatments in NASH.
Acknowledgments
The authors would like to thank Dan Hemmingsen, Camilla Malec, Louise Fensholdt, Martin Illemann, Anke Voigt, Lena Geiselmann, Sabrina Hummel, Lars Pischzan, and Gerald Birk for skillful technical assistance.
Funding
KST received a grant from Innovation Fund Denmark (5016-00168B).
Compliance with ethical standards
Conflict of interest
KST, SSV, KGTR, HHH, NV, JJ, and MF are full-time employees at Gubra Aps. BS, JFR, TS, and AB are full-time employees at Boehringer-Ingelheim Pharma GmbH & Co. KG.
Contributor Information
Kirstine S. Tølbøl, Email: kst@gubra.dk
Birgit Stierstorfer, Email: birgit.stierstorfer@boehringer-ingelheim.com.
Jörg F. Rippmann, Email: joerg.rippmann@boehringer-ingelheim.com
Sanne S. Veidal, Email: ssv@gubra.dk
Kristoffer T. G. Rigbolt, Email: kri@gubra.dk
Tanja Schönberger, Email: tanja.schoenberger@boehringer-ingelheim.com.
Matthew P. Gillum, Email: gillum@sund.ku.dk
Henrik H. Hansen, Email: hbh@gubra.dk
Niels Vrang, Email: niels@gubra.dk.
Jacob Jelsing, Email: jacob@gubra.dk.
Michael Feigh, Email: mfe@gubra.dk.
Andre Broermann, Phone: +49 (7351) 54-141051, Email: andre.broermann@boehringer-ingelheim.com.
References
- 1.Bellentani S. The epidemiology of non-alcoholic fatty liver disease. Liver Int. 2017;37:81–84. doi: 10.1111/liv.13299. [DOI] [PubMed] [Google Scholar]
- 2.Townsend SA, Newsome PN. Non-alcoholic fatty liver disease in 2016. Br Med Bull. 2016;119:143–156. doi: 10.1093/bmb/ldw031. [DOI] [PMC free article] [PubMed] [Google Scholar]
- 3.Bedossa P. Pathology of non-alcoholic fatty liver disease. Liver Int. 2017;37:85–89. doi: 10.1111/liv.13301. [DOI] [PubMed] [Google Scholar]
- 4.Angulo P, Kleiner DE, Dam-Larsen S, et al. Liver fibrosis, but no other histologic features, is associated with long-term outcomes of patients with nonalcoholic fatty liver disease. Gastroenterology. 2015;149:389.e10–397.e10. doi: 10.1053/j.gastro.2015.04.043. [DOI] [PMC free article] [PubMed] [Google Scholar]
- 5.Michelotti GA, Machado MV, Diehl AM. NAFLD, NASH and liver cancer. Nat Rev Gastroenterol Hepatol. 2013;10:656–665. doi: 10.1038/nrgastro.2013.183. [DOI] [PubMed] [Google Scholar]
- 6.Agopian VG, Kaldas FM, Hong JC, et al. Liver transplantation for nonalcoholic steatohepatitis. Ann Surg. 2012;256:624–633. doi: 10.1097/SLA.0b013e31826b4b7e. [DOI] [PubMed] [Google Scholar]
- 7.Musso G, Cassader M, Gambino R. Non-alcoholic steatohepatitis: emerging molecular targets and therapeutic strategies. Nat Rev Drug Discov. 2016;15:249–274. doi: 10.1038/nrd.2015.3. [DOI] [PubMed] [Google Scholar]
- 8.Fagone P, Mangano K, Pesce A, et al. Emerging therapeutic targets for the treatment of hepatic fibrosis. Drug Discov Today. 2016;21:369–375. doi: 10.1016/j.drudis.2015.10.015. [DOI] [PubMed] [Google Scholar]
- 9.Hansen HH, Feigh M, Veidal SS, et al. Mouse models of nonalcoholic steatohepatitis in preclinical drug development. Drug Discov Today. 2017;22:1707–1718. doi: 10.1016/j.drudis.2017.06.007. [DOI] [PubMed] [Google Scholar]
- 10.Kristiansen MNB, Veidal SS, Rigbolt KTG, et al. Obese diet-induced mouse models of nonalcoholic steatohepatitis-tracking disease by liver biopsy. World J Hepatol. 2016 doi: 10.4254/wjh.v8.i16.673. [DOI] [PMC free article] [PubMed] [Google Scholar]
- 11.Clapper JR, Hendricks MD, Gu G, et al. Diet-induced mouse model of fatty liver disease and nonalcoholic steatohepatitis reflecting clinical disease progression and methods of assessment. AJP Gastrointest Liver Physiol. 2013;305:G483–G495. doi: 10.1152/ajpgi.00079.2013. [DOI] [PubMed] [Google Scholar]
- 12.Trevaskis JL, Griffin PS, Wittmer C, et al. Glucagon-like peptide-1 receptor agonism improves metabolic, biochemical, and histopathological indices of nonalcoholic steatohepatitis in mice. AJP Gastrointest Liver Physiol. 2012;302:G762–G772. doi: 10.1152/ajpgi.00476.2011. [DOI] [PubMed] [Google Scholar]
- 13.Tølbøl KS, Kristiansen MNB, Hansen HH, et al. Metabolic and hepatic effects of liraglutide, obeticholic acid and elafibranor in diet-induced obese mouse models of biopsy-confirmed nonalcoholic steatohepatitis. World J Gastroenterol. 2018 doi: 10.3748/wjg.v24.i2.179. [DOI] [PMC free article] [PubMed] [Google Scholar]
- 14.Asgharpour A, Cazanave SC, Pacana T, et al. A diet-induced animal model of non-alcoholic fatty liver disease and hepatocellular cancer. J Hepatol. 2016;65:579–588. doi: 10.1016/j.jhep.2016.05.005. [DOI] [PMC free article] [PubMed] [Google Scholar]
- 15.Krishnan A, Abdullah TS, Mounajjed T, et al. A longitudinal study of whole body, tissue, and cellular physiology in a mouse model of fibrosing NASH with high fidelity to the human condition. Am J Physiol Gastrointest Liver Physiol. 2017;312:G666–G680. doi: 10.1152/ajpgi.00213.2016. [DOI] [PMC free article] [PubMed] [Google Scholar]
- 16.Roth CL, Elfers CT, Figlewicz DP, et al. Vitamin D deficiency in obese rats exacerbates nonalcoholic fatty liver disease and increases hepatic resistin and Toll-like receptor activation. Hepatology. 2012;55:1103–1111. doi: 10.1002/hep.24737. [DOI] [PubMed] [Google Scholar]
- 17.Koteish A, Mae Diehl A. Animal models of steatohepatitis. Best Pract Res Clin Gastroenterol. 2002;16:679–690. doi: 10.1053/bega.2002.0332. [DOI] [PubMed] [Google Scholar]
- 18.Jacobs A, Warda A-S, Verbeek J, et al. An overview of mouse models of nonalcoholic steatohepatitis: from past to present. Curr Protoc Mouse Biol. 2016;6:185–200. doi: 10.1002/cpmo.3. [DOI] [PubMed] [Google Scholar]
- 19.Tamaki Y, Nakade Y, Yamauchi T, et al. Angiotensin II type 1 receptor antagonist prevents hepatic carcinoma in rats with nonalcoholic steatohepatitis. J Gastroenterol. 2013;48:491–503. doi: 10.1007/s00535-012-0651-7. [DOI] [PubMed] [Google Scholar]
- 20.Matsumoto M, Hada N, Sakamaki Y, et al. An improved mouse model that rapidly develops fibrosis in non-alcoholic steatohepatitis. Int J Exp Pathol. 2013;94:93–103. doi: 10.1111/iep.12008. [DOI] [PMC free article] [PubMed] [Google Scholar]
- 21.De Minicis S, Agostinelli L, Rychlicki C, et al. HCC development is associated to peripheral insulin resistance in a mouse model of NASH. PLoS ONE. 2014;9:e97136. doi: 10.1371/journal.pone.0097136. [DOI] [PMC free article] [PubMed] [Google Scholar]
- 22.Hayashizaki-Someya Y, Kurosaki E, Takasu T, et al. Ipragliflozin, an SGLT2 inhibitor, exhibits a prophylactic effect on hepatic steatosis and fibrosis induced by choline-deficient l-amino acid-defined diet in rats. Eur J Pharmacol. 2015;754:19–24. doi: 10.1016/j.ejphar.2015.02.009. [DOI] [PubMed] [Google Scholar]
- 23.Kawaguchi K, Sakaida I, Tsuchiya M, et al. Pioglitazone prevents hepatic steatosis, fibrosis, and enzyme-altered lesions in rat liver cirrhosis induced by a choline-deficient l-amino acid-defined diet. Biochem Biophys Res Commun. 2004;315:187–195. doi: 10.1016/j.bbrc.2004.01.038. [DOI] [PubMed] [Google Scholar]
- 24.Namisaki T, Moriya K, Kitade M, et al. Effect of combined farnesoid X receptor agonist and angiotensin II type 1 receptor blocker on hepatic fibrosis. Hepatol Commun. 2017;1:928–945. doi: 10.1002/hep4.1104. [DOI] [PMC free article] [PubMed] [Google Scholar]
- 25.Yoshiji H, Noguchi R, Namisaki T, et al. Combination of sorafenib and angiotensin-II receptor blocker attenuates preneoplastic lesion development in a non-diabetic rat model of steatohepatitis. J Gastroenterol. 2014;49:1421–1429. doi: 10.1007/s00535-013-0906-y. [DOI] [PubMed] [Google Scholar]
- 26.Aihara Y, Yoshiji H, Noguchi R, et al. Direct renin inhibitor, aliskiren, attenuates the progression of non-alcoholic steatohepatitis in the rat model. Hepatol Res. 2013;43:1241–1250. doi: 10.1111/hepr.12081. [DOI] [PubMed] [Google Scholar]
- 27.Uto H, Nakanishi C, Ido A, et al. The peroxisome proliferator-activated receptor-γ agonist, pioglitazone, inhibits fat accumulation and fibrosis in the livers of rats fed a choline-deficient, -amino acid-defined diet. Hepatol Res. 2005;32:235–242. doi: 10.1016/j.hepres.2005.05.008. [DOI] [PubMed] [Google Scholar]
- 28.Marra F, Svegliati-Baroni G. Lipotoxicity and the gut-liver axis in NASH pathogenesis. J Hepatol. 2018;68:280–295. doi: 10.1016/j.jhep.2017.11.014. [DOI] [PubMed] [Google Scholar]
- 29.Ioannou GN. The role of cholesterol in the pathogenesis of NASH. Trends Endocrinol Metab. 2016;27:84–95. doi: 10.1016/j.tem.2015.11.008. [DOI] [PubMed] [Google Scholar]
- 30.Neuschwander-Tetri BA, Loomba R, Sanyal AJ, et al. Farnesoid X nuclear receptor ligand obeticholic acid for non-cirrhotic, non-alcoholic steatohepatitis (FLINT): a multicentre, randomised, placebo-controlled trial. Lancet. 2015;385:956–965. doi: 10.1016/S0140-6736(14)61933-4. [DOI] [PMC free article] [PubMed] [Google Scholar]
- 31.Ratziu V, Harrison SA, Francque S, et al. Elafibranor, an agonist of the peroxisome proliferator-activated receptor-α and -δ, induces resolution of nonalcoholic steatohepatitis without fibrosis worsening. Gastroenterology. 2016;150:1147–1159e5. doi: 10.1053/j.gastro.2016.01.038. [DOI] [PubMed] [Google Scholar]
- 32.Asgharpour A, Kumar D, Sanyal A. Bile acids: emerging role in management of liver diseases. Hepatol Int. 2015;9:527–533. doi: 10.1007/s12072-015-9656-7. [DOI] [PMC free article] [PubMed] [Google Scholar]
- 33.Pellicciari R, Fiorucci S, Camaioni E, et al. 6alpha-ethyl-chenodeoxycholic acid (6-ECDCA), a potent and selective FXR agonist endowed with anticholestatic activity. J Med Chem. 2002;45:3569–3572. doi: 10.1021/jm025529g. [DOI] [PubMed] [Google Scholar]
- 34.Markham A, Keam SJ. Obeticholic acid: first global approval. Drugs. 2016;76:1221–1226. doi: 10.1007/s40265-016-0616-x. [DOI] [PubMed] [Google Scholar]
- 35.Armstrong LE, Guo GL. Role of FXR in liver inflammation during nonalcoholic steatohepatitis. Curr Pharmacol Rep. 2017;3:92–100. doi: 10.1007/s40495-017-0085-2. [DOI] [PMC free article] [PubMed] [Google Scholar]
- 36.Haczeyni F, Poekes L, Wang H, et al. Obeticholic acid improves adipose morphometry and inflammation and reduces steatosis in dietary but not metabolic obesity in mice. Obesity (Silver Spring) 2017;25:155–165. doi: 10.1002/oby.21701. [DOI] [PMC free article] [PubMed] [Google Scholar]
- 37.Roth JD, Feigh M, Veidal SS, et al. INT-767 improves histopathological features in a diet-inducedob/obmouse model of biopsy-confirmed non-alcoholic steatohepatitis. World J Gastroenterol. 2018;24:195–210. doi: 10.3748/wjg.v24.i2.195. [DOI] [PMC free article] [PubMed] [Google Scholar]
- 38.Jouihan H, Will S, Guionaud S, et al. Superior reductions in hepatic steatosis and fibrosis with co-administration of a glucagon-like peptide-1 receptor agonist and obeticholic acid in mice. Mol Metab. 2017;6:1360–1370. doi: 10.1016/j.molmet.2017.09.001. [DOI] [PMC free article] [PubMed] [Google Scholar]
- 39.Pawlak M, Lefebvre P, Staels B. Molecular mechanism of PPARα action and its impact on lipid metabolism, inflammation and fibrosis in non-alcoholic fatty liver disease. J Hepatol. 2017;62:720–733. doi: 10.1016/j.jhep.2014.10.039. [DOI] [PubMed] [Google Scholar]
- 40.Tanaka N, Aoyama T, Kimura S, Gonzalez FJ. Targeting nuclear receptors for the treatment of fatty liver disease. Pharmacol Ther. 2017 doi: 10.1016/j.pharmthera.2017.05.011. [DOI] [PMC free article] [PubMed] [Google Scholar]
- 41.Baader M, Bretschneider T, Broermann A, et al. Characterisation of the properties of a selective, orally bioavailable autotaxin inhibitor in preclinical models of advanced stages of liver fibrosis. Br J Pharmacol. 2017;31:693–707. doi: 10.1111/bph.14118. [DOI] [PMC free article] [PubMed] [Google Scholar]
- 42.Kleiner DE, Brunt EM, Van Natta M, et al. Design and validation of a histological scoring system for nonalcoholic fatty liver disease. Hepatology. 2005;41:1313–1321. doi: 10.1002/hep.20701. [DOI] [PubMed] [Google Scholar]
- 43.Fujita K, Nozaki Y, Wada K, et al. Effectiveness of antiplatelet drugs against experimental non-alcoholic fatty liver disease. Gut. 2008;57:1583–1591. doi: 10.1136/gut.2007.144550. [DOI] [PubMed] [Google Scholar]
- 44.Raubenheimer PJ, Nyirenda MJ, Walker BR. A choline-deficient diet exacerbates fatty liver but attenuates insulin resistance and glucose intolerance in mice fed a high-fat diet. Diabetes. 2006;55:2015–2020. doi: 10.2337/db06-0097. [DOI] [PubMed] [Google Scholar]
- 45.Rinella ME, Elias MS, Smolak RR, et al. Mechanisms of hepatic steatosis in mice fed a lipogenic methionine choline-deficient diet. J Lipid Res. 2008;49:1068–1076. doi: 10.1194/jlr.M800042-JLR200. [DOI] [PMC free article] [PubMed] [Google Scholar]
- 46.Vance JE, Vance DE. The role of phosphatidylcholine biosynthesis in the secretion of lipoproteins from hepatocytes. Can J Biochem Cell Biol. 1985;63:870–881. doi: 10.1139/o85-108. [DOI] [PubMed] [Google Scholar]
- 47.Henkel J, Coleman CD, Schraplau A, et al. Induction of steatohepatitis (NASH) with insulin resistance in wildtype B6 mice by a western-type diet containing soybean oil and cholesterol. Mol Med. 2017;23:1. doi: 10.2119/molmed.2016.00203. [DOI] [PMC free article] [PubMed] [Google Scholar]
- 48.Ma K, Malhotra P, Soni V, et al. Overactivation of intestinal SREBP2 in mice increases serum cholesterol. PLoS ONE. 2014;9:e84221. doi: 10.1371/journal.pone.0084221. [DOI] [PMC free article] [PubMed] [Google Scholar]
- 49.Robins S, Russo A. Regulation of body cholesterol pools. Influence of cholesterol input and excretion in an animal model. Biochim Biophys Acta. 1979;573:343–353. doi: 10.1016/0005-2760(79)90067-5. [DOI] [PubMed] [Google Scholar]
- 50.Nakae D, Mizumoto Y, Andoh N, et al. Comparative changes in the liver of female fischer-344 rats after short-term feeding of a semipurified or a semisynthetic l-amino acid-defined choline-deficient diet. Toxicol Pathol. 1995;23:583–590. doi: 10.1177/019262339502300504. [DOI] [PubMed] [Google Scholar]
- 51.Brunt EM, Wong VW-S, Nobili V, et al. Nonalcoholic fatty liver disease. Nat Rev Dis Prim. 2015;1:15080. doi: 10.1038/nrdp.2015.80. [DOI] [PubMed] [Google Scholar]
- 52.Lackner C. Hepatocellular ballooning in nonalcoholic steatohepatitis: the pathologist’s perspective. Expert Rev Gastroenterol Hepatol. 2011;5:223–231. doi: 10.1586/egh.11.8. [DOI] [PubMed] [Google Scholar]
- 53.Nakae D. Endogenous liver carcinogenesis in the rat. Pathol Int. 1999;49:1028–1042. doi: 10.1046/j.1440-1827.1999.00990.x. [DOI] [PubMed] [Google Scholar]
- 54.Wree A, McGeough MD, Peña CA, et al. NLRP3 inflammasome activation is required for fibrosis development in NAFLD. J Mol Med. 2014;92:1069–1082. doi: 10.1007/s00109-014-1170-1. [DOI] [PMC free article] [PubMed] [Google Scholar]
- 55.Kawaratani H, Tsujimoto T, Kitazawa T, et al. Innate immune reactivity of the liver in rats fed a choline-deficient l-amino-acid-defined diet. World J Gastroenterol. 2008;14:6655–6661. doi: 10.3748/wjg.14.6655. [DOI] [PMC free article] [PubMed] [Google Scholar]
- 56.Denda A, Kitayama W, Murata A, et al. Increased expression of cyclooxygenase-2 protein during rat hepatocarcinogenesis caused by a choline-deficient, l-amino acid-defined diet and chemopreventive efficacy of a specific inhibitor, nimesulide. Carcinogenesis. 2002;23:245–256. doi: 10.1093/carcin/23.2.245. [DOI] [PubMed] [Google Scholar]
- 57.Amano Y, Shimizu F, Yasuno H, et al. Non-alcoholic steatohepatitis-associated hepatic fibrosis and hepatocellular carcinoma in a combined mouse model of genetic modification and dietary challenge. Hepatol Res. 2017;47:103–115. doi: 10.1111/hepr.12709. [DOI] [PubMed] [Google Scholar]
- 58.Miura K, Yang L, van Rooijen N, et al. Hepatic recruitment of macrophages promotes nonalcoholic steatohepatitis through CCR2. Am J Physiol Liver Physiol. 2012;302:G1310–G1321. doi: 10.1152/ajpgi.00365.2011. [DOI] [PMC free article] [PubMed] [Google Scholar]
- 59.Tsujimoto T, Kawaratani H, Kitazawa T, et al. Immunotherapy for nonalcoholic steatohepatitis using the multiple cytokine production modulator Y-40138. World J Gastroenterol. 2009;15:5533–5540. doi: 10.3748/wjg.15.5533. [DOI] [PMC free article] [PubMed] [Google Scholar]
- 60.Miura K, Kodama Y, Inokuchi S, et al. Toll-like receptor 9 promotes steatohepatitis by induction of interleukin-1β in mice. Gastroenterology. 2010;139:323.e7–334.e7. doi: 10.1053/j.gastro.2010.03.052. [DOI] [PMC free article] [PubMed] [Google Scholar]
- 61.Baffy G. Kupffer cells in non-alcoholic fatty liver disease: the emerging view. J Hepatol. 2009;51:212–223. doi: 10.1016/j.jhep.2009.03.008. [DOI] [PMC free article] [PubMed] [Google Scholar]
- 62.Reid DT, Reyes JL, McDonald BA, et al. Kupffer cells undergo fundamental changes during the development of experimental NASH and are critical in initiating liver damage and inflammation. PLoS ONE. 2016;11:e0159524. doi: 10.1371/journal.pone.0159524. [DOI] [PMC free article] [PubMed] [Google Scholar]
- 63.Gadd VL, Skoien R, Powell EE, et al. The portal inflammatory infiltrate and ductular reaction in human nonalcoholic fatty liver disease. Hepatology. 2014;59:1393–1405. doi: 10.1002/hep.26937. [DOI] [PubMed] [Google Scholar]
- 64.Bedossa P. Diagnosis of non-alcoholic fatty liver disease/non-alcoholic steatohepatitis: why liver biopsy is essential. Liver Int. 2018;38:64–66. doi: 10.1111/liv.13653. [DOI] [PubMed] [Google Scholar]
- 65.Liang W, Menke AL, Driessen A, et al. Establishment of a general NAFLD scoring system for rodent models and comparison to human liver pathology. PLoS ONE. 2014;9:e115922. doi: 10.1371/journal.pone.0115922. [DOI] [PMC free article] [PubMed] [Google Scholar]
- 66.Ikawa-Yoshida A, Matsuo S, Kato A, et al. Hepatocellular carcinoma in a mouse model fed a choline-deficient, l-amino acid-defined, high-fat diet. Int J Exp Pathol. 2017;98:221–233. doi: 10.1111/iep.12240. [DOI] [PMC free article] [PubMed] [Google Scholar]
- 67.Staels B, Rubenstrunk A, Noel B, et al. Hepatoprotective effects of the dual peroxisome proliferator-activated receptor alpha/delta agonist, GFT505, in rodent models of nonalcoholic fatty liver disease/nonalcoholic steatohepatitis. Hepatology. 2013;58:1941–1952. doi: 10.1002/hep.26461. [DOI] [PubMed] [Google Scholar]
- 68.Gonzalez FJ, Shah YM. PPARα: mechanism of species differences and hepatocarcinogenesis of peroxisome proliferators. Toxicology. 2008;246:2–8. doi: 10.1016/j.tox.2007.09.030. [DOI] [PubMed] [Google Scholar]
- 69.Tailleux A, Wouters K, Staels B. Roles of PPARs in NAFLD: potential therapeutic targets. Biochim Biophys Acta Mol Cell Biol Lipids. 2012;1821:809–818. doi: 10.1016/j.bbalip.2011.10.016. [DOI] [PubMed] [Google Scholar]
- 70.Brocker CN, Yue J, Kim D, et al. Hepatocyte-specific PPARA expression exclusively promotes agonist-induced cell proliferation without influence from nonparenchymal cells. Am J Physiol Liver Physiol. 2017;312:G283–G299. doi: 10.1152/ajpgi.00205.2016. [DOI] [PMC free article] [PubMed] [Google Scholar]
- 71.Jain MR, Giri SR, Bhoi B, et al. Dual PPARα/γ agonist saroglitazar improves liver histopathology and biochemistry in experimental NASH models. Liver Int. 2017 doi: 10.1111/liv.13634. [DOI] [PMC free article] [PubMed] [Google Scholar]
- 72.Kim SM, Lee B, An HJ, et al. Novel PPARα agonist MHY553 alleviates hepatic steatosis by increasing fatty acid oxidation and decreasing inflammation during aging. Oncotarget. 2017;8:46273–46285. doi: 10.18632/oncotarget.17695. [DOI] [PMC free article] [PubMed] [Google Scholar]
- 73.Janssen AWF, Betzel B, Stoopen G, et al. The impact of PPARα activation on whole genome gene expression in human precision cut liver slices. BMC Genom. 2015;16:760. doi: 10.1186/s12864-015-1969-3. [DOI] [PMC free article] [PubMed] [Google Scholar]
- 74.Haczeyni F, Wang H, Barn V, et al. The selective peroxisome proliferator-activated receptor-delta agonist seladelpar reverses nonalcoholic steatohepatitis pathology by abrogating lipotoxicity in diabetic obese mice. Hepatol Commun. 2017;1:663–674. doi: 10.1002/hep4.1072. [DOI] [PMC free article] [PubMed] [Google Scholar]
- 75.Lee HJ, Yeon JE, Ko EJ, et al. Peroxisome proliferator-activated receptor-delta agonist ameliorated inflammasome activation in nonalcoholic fatty liver disease. World J Gastroenterol. 2015;21:12787. doi: 10.3748/wjg.v21.i45.12787. [DOI] [PMC free article] [PubMed] [Google Scholar]
- 76.Luo W, Xu Q, Wang Q, et al. Effect of modulation of PPAR-γ activity on Kupffer cells M1/M2 polarization in the development of non-alcoholic fatty liver disease. Sci Rep. 2017;7:44612. doi: 10.1038/srep44612. [DOI] [PMC free article] [PubMed] [Google Scholar]
- 77.Collino M, Aragno M, Castiglia S, et al. Pioglitazone improves lipid and insulin levels in overweight rats on a high cholesterol and fructose diet by decreasing hepatic inflammation. Br J Pharmacol. 2010;160:1892–1902. doi: 10.1111/j.1476-5381.2010.00671.x. [DOI] [PMC free article] [PubMed] [Google Scholar] [Retracted]
- 78.Zhang S, Wang J, Liu Q, Harnish DC. Farnesoid X receptor agonist WAY-362450 attenuates liver inflammation and fibrosis in murine model of non-alcoholic steatohepatitis. J Hepatol. 2009;51:380–388. doi: 10.1016/j.jhep.2009.03.025. [DOI] [PubMed] [Google Scholar]


