

Abstract
Severe fever with thrombocytopenia syndrome phlebovirus (SFTSV), listed in the World Health Organization Prioritized Pathogens, is an emerging phlebovirus with a high fatality1–4. Owing to the lack of therapies and vaccines5,6, there is a pressing need to understand SFTSV pathogenesis. SFSTV non-structural protein (NSs) has been shown to block type I interferon induction7–11 and facilitate disease progression12,13. Here, we report that SFTSV-NSs targets the tumour progression locus 2 (TPL2)-A20-binding inhibitor of NF-κB activation 2 (ABIN2)-p105 complex to induce the expression of interleukin-10 (lL-10) for viral pathogenesis. Using a combination of reverse genetics, a TPL2 kinase inhibitor and Tpl2−/− mice showed that NSs interacted with ABIN2 and promoted TPL2 complex formation and signalling activity, resulting in the marked upregulation of ll10 expression. Whereas SFTSV infection of wild-type mice led to rapid weight loss and death, Tpl2−/− mice or ll10−/− mice survived an infection. Furthermore, SFTSV-NSs P102A and SFTSV-NSs K211R that lost the ability to induce TPL2 signalling and IL-10 production showed drastically reduced pathogenesis. Remarkably, the exogenous administration of recombinant IL-10 effectively rescued the attenuated pathogenic activity of SFTSV-NSs P102A, resulting in a lethal infection. Our study demonstrates that SFTSV-NSs targets the TPL2 signalling pathway to induce immune-sup-pressive IL-10 cytokine production as a means to dampen the host defence and promote viral pathogenesis.
Severe fever with thrombocytopenia syndrome phlebovirus (SFTSV) contains three segments of negative or ambisense RNA genome designated as large (L), medium (M) and small (S). The S segment encodes a nucleoprotein (N) and a non-structural protein (NSs) via an ambisense coding strategy2. As SFTSV infection has been demonstrated to lead to the suppression of host antiviral immunity, work has shown that NSs plays an important role in immune evasion by interacting with type I interferon (IFN) signalling effectors retinoic acid-inducible gene I (RIG-I), mitochondrial antiviral-signalling protein (MAVS), TRIM25, TBK1 and signal transducer and activator of transcription 1 (STAT1), leading to their sequestration to virus-induced inclusion bodies, resulting in the inhibition of IFN and nuclear factor-κB (NF-κB) responses7–11. Similar to SFTSV-NSs, the NSs protein of other phleboviruses, including Heartland, Bhanja, Granada and Lone Star viruses, except for an apathogenic Uukuniemi virus, were able to effectively suppress the activation of the IFN-β (Ifnbl) promoter induced by Sendai virus (SeV) infection (Supplementary Fig. 1a). Surprisingly, when aligned with the NSs of other pathogenic phleboviruses, SFTSV-NSs exhibited limited homology, except for two conserved sequences (S97xLRWPxG104 and D282WP284). SFTSV-NSs also carries two potential protein-interacting motifs (P66xxP69 for SRC homology 3 (SH3) interaction and W133xxL136 for light chain 3 (LC3) interaction) (Supplementary Fig. 1b). When NSs mutants carrying changes at these four sequences were examined for inclusion body formation and IFN signalling suppression, three mutants (NSs-WxxL, NSs-PxxP and NSs-DWP) formed cytoplasmic inclusion bodies similar to NSs wild type (WT), whereas a NSs-8A mutant carrying alanine substitutions of the S97xLRWPxG104 eight amino acids could no longer form inclusion bodies (Supplementary Fig. 2a). NSs-WT and three mutants that retained the ability to form inclusion bodies potently suppressed SeV-induced Ifnbl promoter activation, whereas the NSs-8A mutant that did not form inclusion bodies did not suppress promoter activation (Supplementary Fig. 2b). Furthermore, a NSs-P102A (PA) mutant carrying an alanine replacement within the SxLRWPxG sequence neither formed inclusion bodies, nor suppressed the expression and secretion of IFN-β upon SeV infection (Fig. 1a,b and Supplementary Fig. 2c, respectively). These results indicate the direct correlation between the inclusion body formation and the IFN signalling-inhibition ability of SFTSV-NSs.
Fig. 1 |. SFTSV-NSs-mediated alteration of host gene expression.
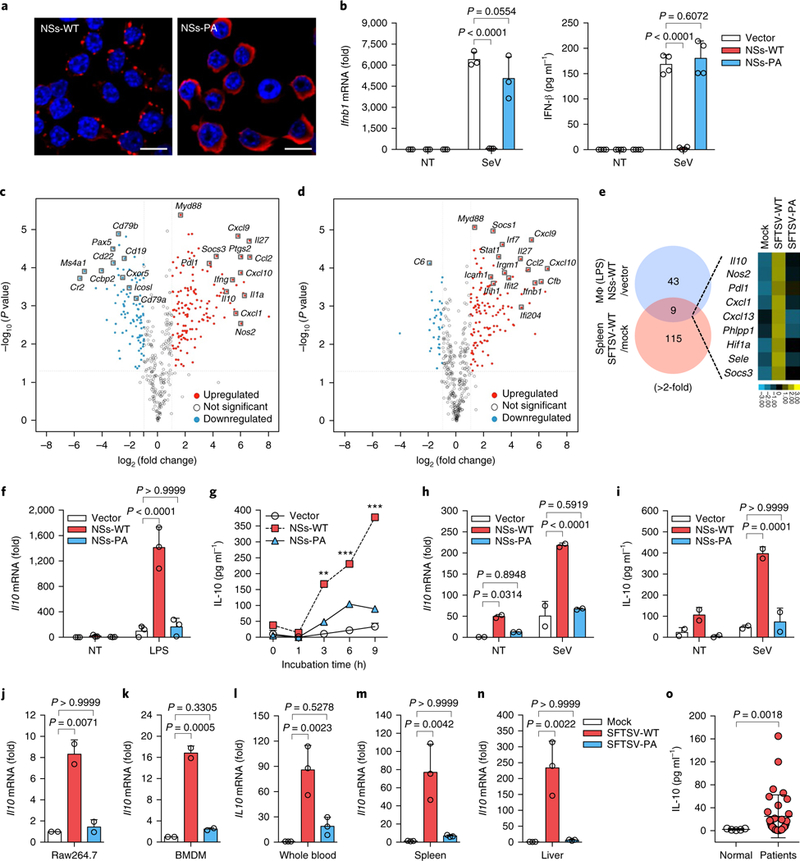
a, Inclusion body formation of NSs in Raw264.7 cells expressing vector, NSs-WT or NSs-PA was shown by confocal microscopy. NSs was detected by Alexa Fluor 568 (red) and nuclear DNA was stained with Hoechst (blue). Scale bars, 10 μm. Three independent experiments are represented. b, Expressions of IFN-β mRNA (left) and protein (right) in Raw264.7 cells expressing vector, NSs-WT or NSs-PA (n = 3 each) were measured by qRT-PCR and ELISA upon SeV stimulation for 12 h. c,d, Immune profiling in spleens. RNA from splenocytes of Ifnar−/− mice infected by SFTSV-WT (n = 2) or SFTSV-PA (n = 2) at 105 p.f.u. per mice for 4days was subjected to NanoString analysis. Differential gene expression in SFTSV-WT (c) and SFTSV-PA (d) infection compared to mock (n = 2) infection was presented as a volcano plot. e, Comparison of gene expression between macrophages expressing NSs-WT and spleens infected with SFTSV-WT in a Venn diagram and heat map. f, ll10 mRNA expression levels in Raw264.7 cells (n = 3) were measured by qRT-PCR. g, IL-10 levels measured by ELISA in Raw264.7 cells at various time points (n = 2 each) after LPS (20 ng ml−1) treatment. h, ll10 mRNA expression levels in Raw264.7 cells (n = 2) were measured by qRT-PCR after SeV infection for 9h. i, IL-10 levels measured by ELISA in Raw264.7 cells (n = 2) after SeV infection for 12h. j-l, ll10 mRNA levels were measured by qRT-PCR in Raw264.7 cells (n = 2) (j), mouse BMDMs (n = 2) (k) and human whole blood (n = 3) (l) after SFTSV-WT or SFTSV-PA infection (MOI: 0.1) for 48h. m,n, Il10 mRNA expression was assessed by qRT-PCR in spleens (n = 3) (m) and livers (n = 3) (n) at 4days after infection of 105 p.f.u. of SFTSV-WT or SFTSV-PA infection. o, IL-10 expression in healthy participant sera (n = 5) and SFTSV-infected patient sera (n = 32) was measured by the Bio-Plex human cytokine assay. Data are represented as the mean±s.d. P values for multiple t-test (two tailed, between vector and NSs-WT) in g (**P = 0.00156, at 3 h; ***P = 0.00098, at 6 h; ***P = 0.00049, at 9 h), one-way or two-way ANOVA using Bonferroni’s multiple comparisons test in b,f,h-n and unpaired t-test (two sided) with Welch’s correction in o are shown. Statistical information is described in Supplementary Table 3. NT, no treatment.
We next investigated the effects of NSs on host immune gene expression either in Raw264.7 cells expressing NSs or upon WT or mutant SFTSV infection of Ifnar−/− mice. Using a reverse genetic system14, we rescued WT virus (SFTSV-WT) and NSs-PA-mutant virus (SFTSV-PA) (Supplementary Fig. 2d). Although SFTSV-WT produced larger plaques than SFTSV-PA, both viruses had similar replication kinetics in IFN-negative Vero E6 cells (Supplementary Fig. 2ef). Total RNA isolated from the spleens of mock-, SFTSV-WT- or SFTSV-PA-infected Ifnar−/− mice or from Raw264.7-vector or Raw264.7-NSs-WT cells with or without lipo-polysaccharide (LPS) stimulation was subjected to NanoString analysis (Supplementary Fig. 3a and Supplementary Data). SFTSV-WT infection of Ifnar−/− mice not only broadly induced immune response genes but also markedly suppressed IFN-responsible genes compared to SFTSV-PA infection (Fig. 1c,d and Supplementary Fig. 3b,c). Remarkably, the majority of downregulated host genes in SFTSV-WT-infected mouse spleens were B cell-specific genes (Fig. 1c and Supplementary Fig. 3d), which seems to be consistent with recent reports15,16. Interestingly, nine genes (Il10 (encoding interleukin-10 (IL-10)) Pdl1 (encoding programmed cell death 1 ligand 1 (PD-L1)) Phlpp1, Sele, Socs3, Nos2, Cxcl1, Cxcl13 and Hif1a), which were comprehensively induced by SFTSV-WT infection in Ifnar−/− mice or by NSs-WT expression in Raw264.7 cells, but not by SFTSV-PA infection, function in immune-suppressive pathways (Fig. 1e and Supplementary Table 1).
In particular, IL-10 is an anti-inflammatory cytokine that limits host immune responses to pathogens to prevent its own damage17 and is induced by many viruses to dampen the host defence18–20. Real-time quantitative RT-PCR (qRT-PCR) showed that NSs-WT markedly increased Il10 expression in Raw264.7 cells by ~50-fold under no stimulation and by ~200- and ~1,300-fold upon SeV infection or LPS stimulation, respectively, whereas NSs-PA induced little or no Il10 expression under any conditions (Fig. 1f–i). Furthermore, SFTSV-WT infection, but not SFTSV-PA infection, considerably induced Il10 expression in Raw264.7 cells, mouse bone marrow-derived macrophages (BMDMs) and human whole blood in vitro (Fig. 1j–l). In addition, SFTSV-WT infection led to increased Il10 expression in spleens and livers of Ifnar−/− mice by ~70- and −200-fold, respectively, whereas SFTSV-PA infection showed little or no increase of Il10 expression (Fig. 1m,n). Finally, we also found highly elevated levels of IL-10 in the blood of SFTSV-infected patients along with IL-6 and tumour necrosis factor-α (TNF-α) (Fig. 1o and Supplementary Fig. 3e). These findings collectively indicate that the SFTSV-NSs robustly induces Il10 expression.
The yeast two-hybrid screen found that NSs interacted with A20-binding inhibitor of NF-κB 2 (ABIN2; also known as TNIP2). Co-immunoprecipitation showed the specific interaction of NSs with exogenous ABIN2 in HEK293T cells and endogenous ABIN2 in Raw264.7 cells (Fig. 2a,b), as well as the interaction of virally produced NSs with ABIN2 in SFTSV-infected Raw264.7 cells (Fig. 2c). Furthermore, NSs specifically bound to ABIN2, but not to ABIN1 and ABIN3 despite their high homology21 (Fig. 2d). By using truncation mutagenesis, the middle region (148–220) of NSs was found to be responsible for ABIN2 binding (Supplementary Fig. 4a). Yeast two-hybrid mapping and glutathione S-transferase (GST) pulldown assays revealed the ABIN homology domains of ABIN2 for efficient NSs interaction (Supplementary Fig. 4b,c). The singlemolecule pull-down (SiMPull) assay22 also revealed that SFTSV-NSs effectively bound to ABIN2 (Supplementary Fig. 4d). Finally, the NSs protein of other phleboviruses showed interaction with ABIN2 as strongly as the SFTSV-NSs (Supplementary Fig. 4e). However, the Uukuniemi virus NSs neither bound ABIN2 nor induced Il10 expression (Supplementary Fig. 4f,g). In parallel, Uukuniemi virus infection failed to induce Il10 expression compared to SFTSV and Heartland virus infections (Supplementary Fig. 4h). These suggest a strong correlation between NSs-induced Il10 expression and phlebovirus pathogenesis.
Fig. 2 |. NSs activates TPL2 ternary complex formation through interaction with ABIN2.
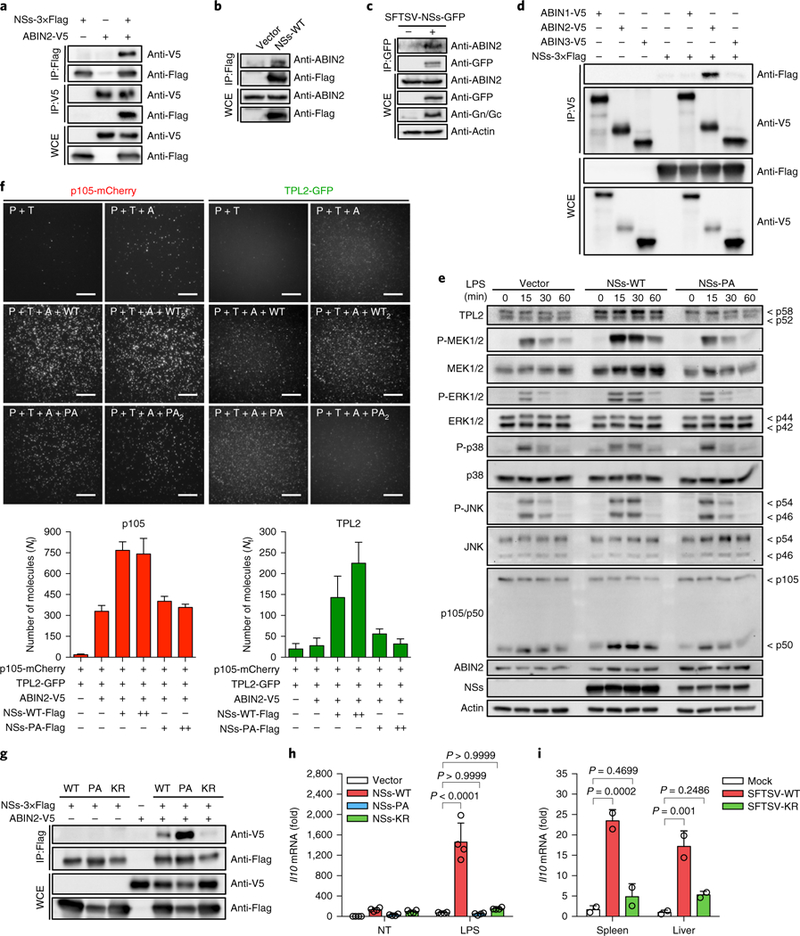
a, HEK293T cells were transfected by NSs-3xFlag and ABIN2-V5, and whole-cell extracts (WCEs) were immunoprecipitated (IP) by anti-Flag antibody or anti-V5 antibody, followed by immunoblotting with the indicated antibody. b, Lysates of Raw264.7 cells expressing NSs-WT were used for immunoprecipitation with anti-Flag antibody, followed by immunoblotting with anti-ABIN2 antibody. c, Raw264.7 cells were infected with SFTSV-NSs-GFP for 24h and immunoprecipitated by anti-GFP antibody, followed by immunoblotting with anti-ABIN2 antibody. d, HEK293T cells were transfected by NSs-3xFlag, ABIN1-V5, ABIN2-V5 and ABIN3-V5 and immunoprecipitated by anti-V5 antibody, followed by immunoblotting with anti-Flag antibody. e, Raw264.7 cells expressing vector, NSs-WT or NSs-PA were treated with LPS (1 μgml−1) for 0, 15, 30 and 60min and cell lysates were immunoblotted for the indicated proteins. f, HEK293T cells were transfected by p105-mCherry (P), TPL2-GFP (T), ABIN2-V5 (A), NSs-WT-3xFlag (NSs) or NSs-PA-3xFlag (PA) and cell lysates were applied to the SiMPull analysis. Six representative images are shown in the upper panels and the molecular numbers are counted in the lower panels. Bar graphs with the average number of fluorophores per image are also shown. Error bars represent the s.d. of the mean across >20 images. Three independent experiments are represented. Scale bars, 5μm. g, HEK293T cells were transfected by NSs-3xFlag (WT, PA and KR) and ABIN2-V5 and immunoprecipitated by anti-Flag antibody, followed by immunoblotting with anti-V5 antibody. h, Il10 mRNA levels in Raw264.7 cells expressing NSs (WT, PA and KR; n = 4) were measured by qRT-PCR. i, Il10 mRNA expression was measured by qRT-PCR in spleens and livers (n = 2 each) at 4days after infection with 105 p.f.u. of SFTSV-WT and SFTSV-KR. Data are represented as the mean ± s.d. P values for two-way ANOVA using Bonferroni’s multiple comparisons test in h and i are shown. Statistical information is described in Supplementary Table 3. Western blots in a-e,g are representative of three independent experiments.
ABIN2 preferentially forms a ternary complex with tumour progression locus 2 (TPL2; also known as MAP3K8) kinase and p105 (also known as NF-κB1) that is required to maintain TPL2 stability23. Differential translational initiation of the Tpl2 mRNA gives rise to two isoforms (p58 and p52)24. Upon LPS stimulation, p58 TPL2 is preferentially released from p105 relative to p52 TPL2 and released p58 TPL2 initiates downstream signalling and subsequently undergoes rapid degradation24. NSs-WT-expressing Raw264.7 cells showed increased amounts of TPL2 (p58/p52) and rapid degradation of p58 TPL2 compared to vector-expressing or NSs-PA-expressing Raw264.7 cells (Fig. 2e). The SiMPull assay also revealed that NSs-WT, but not NSs-PA, increased the TPL2-ABIN2-p105 ternary complex formation (Fig. 2f). As this ternary complex formation governs TPL2 stability and its signalling activity, expression of NSs-WT but not NSs-PA increased TPL2 amounts, ultimately resulting in enhanced activation of downstream MAP-kinase kinase ½ (MEK½) and extracellular signal-regulated kinase ½ (ERK½) upon LPS stimulation as evidenced by increased reactivity of their activation-dependent phospho-specific antibodies (Fig. 2e). Thus, SFTSV-NSs stabilizes and activates the TPL2 signalling complex through its specific interaction with ABIN2 (Supplementary Fig. 4i). Indeed, depletion of ABIN2 expression not only abrogated the interaction between NSs-WT and TPL2-p105 (Supplementary Fig. 5a,b) but also led to the reduction of NSs-mediated induction of Il10 expression (Supplementary Fig. 5c).
ABIN2 alone formed cytoplasmic punctate structures similar to NSs (Supplementary Fig. 6a). When NSs and ABIN2 were co-expressed, they showed partial co-localization. Surprisingly, NSs-PA showed much higher levels of ABIN2 binding and colocalization than NSs-WT (Fig. 2g and Supplementary Fig. 6a,b). Increasing the expression of NSs-PA suppressed NSs-WT activity to induce TPL2-mediated Il10 expression, despite its increased ABIN2 binding (Supplementary Fig. 7a,b). Additional mutation analyses identified that the NSs-K211R (KR) mutant, carrying replacement of the lysine 211 with arginine (Supplementary Fig. 1b), neither bound ABIN2 (Fig. 2g) nor induced Il10 expression upon LPS stimulation or SeV infection (Fig. 2h and Supplementary Fig. 7c). Although the NSs-WT and NSs-PA interacted with TpL2 and p105 through ABIN2 binding, the NSs-KR showed no interaction with TPL2 and p105 due to its lack of ABIN2 binding (Supplementary Fig. 7d,e). Moreover, the PA and KR double-mutant (NSs-PK) also showed the loss of ABIN2 interaction (Supplementary Fig. 7f). Functionally, NSs-KR did not activate downstream MEK½ and ERK½ upon LPS stimulation (Supplementary Fig. 7g). Moreover, SFTSV-KR infection of Raw264.7 cells and mice led to a little or no increase of Il10 expression (Fig. 2i and Supplementary Fig. 7h). Conversely, NSs-KR interacted with TBK1 and suppressed SeV-induced Ifnb1 promoter activation as strongly as NSs-WT, whereas NSs-PA could not do both (Supplementary Fig. 7i,j), suggesting that NSs-mediated regulation of TPL2 signalling is genetically separable from its regulation of IFN signalling.
As the TPL2 signalling pathway is important for Il10 expression in macrophages25, treatment with a TPL2 inhibitor (CAS1186649–59-1) not only suppressed the basal level of Il10 expression but also abrogated the NSs-mediated upregulation of Il10 expression (Fig. 3a). Consistently, a MEK inhibitor, but not a c-Raf kinase inhibitor, suppressed the NSs-mediated Il10 upregulation (Fig. 3b). Moreover, NSs-WT markedly induced Il10 expression in WT BMDMs, but not in Tpl2−/− BMDMs. By contrast, NSs-PA did not induce Il10 expression in either WT or Tpl2−/− BMDMs (Fig. 3c). Correspondingly, SFTSV-WT infection upregulated Il10 expression in WT or Ifmr−/− BMDMs, but not in Tpl2−/− BMDMs, whereas SFTSV-PA infection did not upregulate Il10 expression under any conditions (Fig. 3d). Treatment with the TPL2 inhibitor also abrogated Il10 expression in SFTSV-WT-infected Ifnar−/−- BMDMs (Fig. 3e). Finally, Il10 expression was considerably upregulated in spleens of SFTSV-WT-infected mice compared to those of SFTSV-WT-infected Tpl2−/− mice in which both mice were pre-treated with anti-IFN-α/β receptor 1 (IFNAR1)-blocking antibody prior to infection (Fig. 3f). As an activated p58 TPL2 undergoes rapid degradation24, SFTSV-WT-infected BMDMs showed reduced p58 TPL2 along with MEK½ and ERK½ activation compared to mock-infected or SFTSV-PA-infected BMDMs, resulting in the marked increase of Il10 expression (Fig. 3g,h). Intriguingly, the TPL2 inhibitor did not affect the degradation of p58 TPL2, whereas it detectably reduced MEK½ phosphorylation (Fig. 3i), suggesting that NSs specifically targets TPL2-ABIN2-p105 complex formation, not p58 TPL2 degradation. Of note, the TPL2 signalling pathway was not required for SeV-induced or LPS-induced IFN-β expression, nor for NSs-mediated IFN-β suppression (Supplementary Fig. 8a,b). Moreover, NSs did not affect Tpl2 expression upon several stimulation conditions (Supplementary Fig. 8c,d). These results indicate that SFTSV-NSs specifically enhances TPL2 complex formation and its signalling activity, resulting in the upregula-tion of Il10 expression.
Fig. 3 |. SFTSV-NSs induces IL-10 expression by activating the TPL2 signalling pathway.
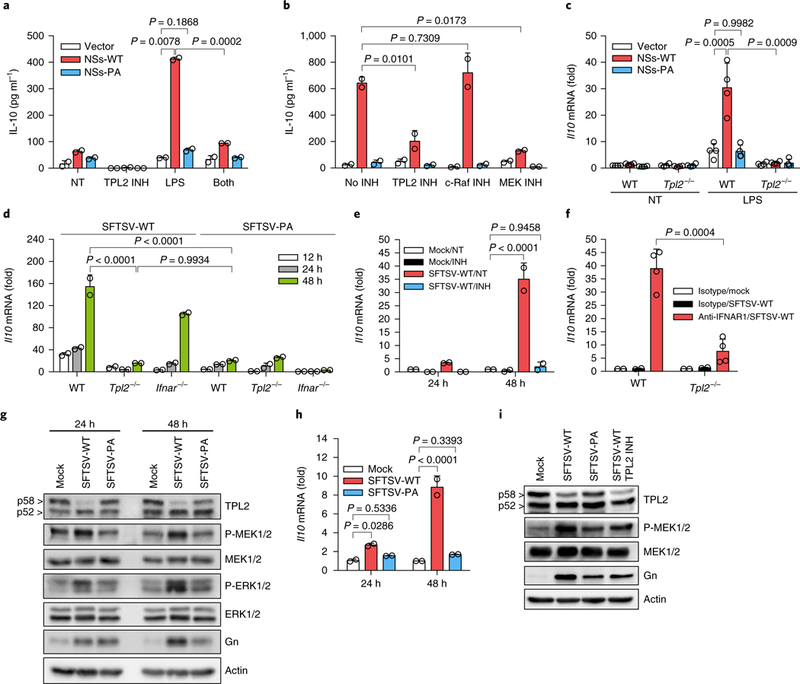
a, IL-10 levels measured by ELISA of Raw264.7 cells expressing vector, NSs-WT or NSs-PA with DMSO (NT), a TPL2 inhibitor (INH; 5 μM), LPS (20 ngml−1) or LPS + TPL2 inhibitor (both; n = 2 each) for 12 h. b, IL-10 levels measured by ELISA of LPS (20 ngml−1)-treated Raw264.7 cells (n = 2) as described in a for 12 h with DMSO, a TPL2 inhibitor (5μM), a c-Raf inhibitor (10 μM) and a MEK inhibitor (U0126; 10 μM). c, Il10 mRNA levels were measured by qRT-PCR in WT and Tpl2-- BMDMs (n = 4) infected with vector, NSs-WT or NSs-PA lentivirus, followed by LPS (1 μg ml−1) treatment for 6h. d, Il10 mRNA levels were measured by qRT-PCR in WT, Tpl2−/− and Ifnar−/− BMDMs (n = 2) upon SFTSV-WT or SFTSV-PA infection for 12, 24 and 48h. e, Ifnar−/− BMDMs (n = 2) were infected by mock and SFTSV-WT for 24 and 48 h with or without the TPL2 inhibitor (INH; 10 μM), and Il10 mRNA levels were then measured by qRT-PCR. f, Il10 mRNA levels were measured by qRT-PCR in the spleens of WT C57BL/6 and Tpl2-- mice (n = 4) pre-treated with anti-IFNAR1 or isotype IgG at 4days post-infection with mock and SFTSV-WT. g,h, Ifnar−/− BMDMs were infected with mock, SFTSV-WT and SFTSV-PA (n = 2 each) for 24 and 48h, and cell lysates were analysed by immunoblotting for the indicated proteins (g) and Il10 mRNA levels were assessed by qRT-PCR (h). i, Ifnar−/− BMDMs were infected by mock, SFTSV-WT and SFTSV-PA for 48 h with or without the TPL2 inhibitor (10 μM), and cell lysates were immunoblotted for the indicated proteins. Data are represented as the mean±s.d. P values for one-way or two-way ANOVA using Dunnett’s multiple comparisons test in a-e,h and unpaired f-test (two sided) in a,c,f are shown. Statistical information is described in Supplementary Table 3. Western blots in g,i are representative of two independent experiments.
Whereas SFTSV-WT and SFTSV-PA replicated in IFN-negative Vero E6 cells at similar kinetics (Supplementary Fig. 2f), the viral copy numbers of SFTSV-WT were approximately 1.5-logs higher in vitro than those of SFTSV-PA in WT, Tpl2−/− and Ifnar−/− BMDMs, as well as in human whole blood (Supplementary Fig. 9a,b). SFTSV-WT also replicated slightly higher than SFTSV-PA in the spleens and livers of Ifnar−/− mice (Supplementary Fig. 9c). Conversely, treatment with a TPL2 inhibitor did not significantly affect SFTSV-WT replication in Ifnar−/− BMDMs (Supplementary Fig. 9d), suggesting that the TPL2 pathway does not directly influence SFTSV in vitro replication. To test the role of NSs in SFTSV pathogenesis, we used two lethal challenge mouse models: Ifnar−/− mice and anti-IFNARl-blocking antibody-treated WT mice or Tpl2−/− mice that were passively administered 2 mg anti-IFNARl-blocking antibody or isotype control IgG antibody 1 day before infection. Upon SFTSV-WT infection, Ifnar−/− mice or anti-IFNAR1 antibody-treated WT mice rapidly lost weight, showed severe symptoms and died over a period of 4–5 days or 5–6 days post-infection, respectively (Fig. 4a,g). Remarkably, 100% of anti-IFNAR1 antibody-treated Tpl2−/− mice recovered from the initial weight loss and survived SFTSV-WT infection (Fig. 4b). Control IgG-treated WT or Tpl2−/− mice did not show any symptoms and weight loss, and survived SFTSV infection (Fig. 4a,b). Furthermore, SFTSV-WT copy numbers were approximately 5-logs lower in the spleens of anti-IFNARI antibody-treated Tpl2−/− mice at 4 days post-infection than in those of anti-IFNARI antibody-treated WT mice (Supplementary Fig. 9e). Remarkably, the administration of a TPL2 inhibitor (CAS871307–18-5) substantially improved the survival of anti-IFNARI antibody-treated WT mice infected with SFTSV: 80% of TPL2 inhibitor-treated mice (9 out of 11) survived SFTSV infection (Fig. 4c,d). These data indicate that the NSs- mediated activation of the TPL2 signalling pathway is required for the SFTSV-induced lethal phenotype and that the inhibition of the TPL2 signalling pathway is a potent therapeutic approach to treat SFTSV pathogenesis.
Fig. 4 |. NSs-mediated activation of the TPL2 signalling pathway is required for SFTSV-induced lethal phenotype.
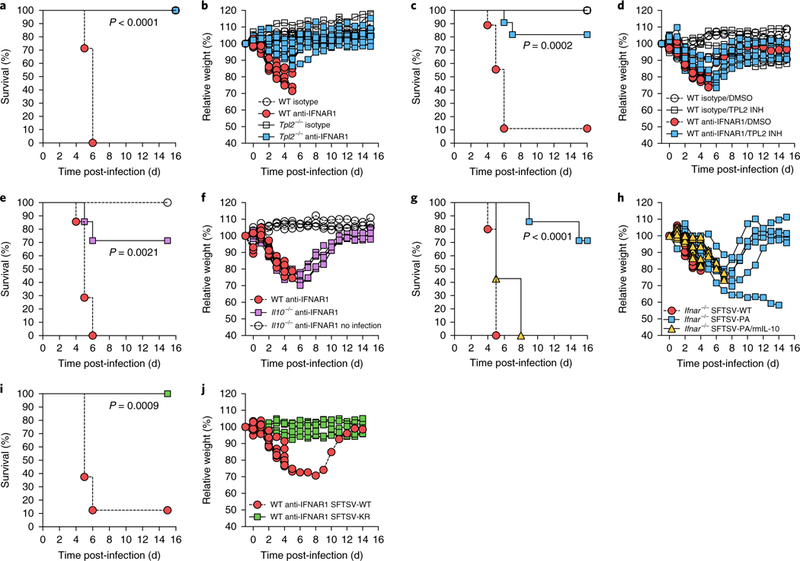
a,b, WT C57BL/6 and Tpl2−/− mice were treated with anti-IFNAR1 (n = 7 for WT, n = 10 for Tpl2−/−) or isotype IgG (n = 3 for each) intraperitoneally 1 day prior to intramuscular infection with 105 p.f.u. of SFTSV-WT. Mice were then monitored (a) and weighed (b) for 15 days. c,d, WT C57BL/6 mice were treated with anti-IFNAR1 IgG or isotype IgG intraperitoneally 1 day prior to intramuscular infection with 105 p.f.u. of SFTSV-WT. Subsequently, infected mice were treated with a TPL2 inhibitor (INH; 10 mg per kg at days 1, 2 and 3 post-infection, n = 3 for isotype, n = 11 for anti-IFNAR1) or DMSO (n = 3 for each), and then monitored (c) and weighed (d) for 15 days. e,f, WT C57BL/6 and Il10−/− mice were treated with anti-IFNAR1 IgG or isotype IgG intraperitoneally 1 day prior to intramuscular infection with 105 p.f.u. of SFTSV-WT (n = 7 for each). For infection control, three mice (n = 3) were only treated with anti-IFNAR1 IgG (no infection). Mice were then monitored (e) and weighed (f) for 15 days. g,h, Ifnar−/− mice were intramuscularly infected with 102 p.f.u. of SFTSV-WT (n = 10), SFTSV-PA (n = 7) or SFTSV-PA together with recombinant mouse IL-10 (rmIL-10; 1 μg per mouse at days 1, 2 and 3 post-infection, n = 7) intraperitoneally, and mice were monitored (g) and weighed (h) for 15 days. i,j, WT C57BL/6 mice were treated with anti-IFNAR1 IgG or isotype IgG intraperitoneally 1 day prior to intramuscular infection with 105 p.f.u. of SFTSV-WT (n = 8) or SFTSV-KR (n = 7) and then monitored (i) and weighed (j) for 15 days. The survival curves were estimated using the Kaplan–Meier method and analysed by log-rank analysis with P values (two sided). Statistical information is described in Supplementary Table 3.
To further investigate the role of the NSs-mediated IL-10 production in viral pathogenesis, anti-IFNAR1 antibody-treated Il10−/− mice were infected with SFTSV-WT. Compared to WT mice that succumbed to infection, 70% of Il10−/− mice (5 out of 7) recovered from weight loss and survived SFTSV-WT infection (Fig. 4e,f). Moreover, Ifnar−/− mice were infected with SFTSV-WT or SFTSV-PA. By striking contrast to SFTSV-WT-infected Ifnar−/− mice that died over a period of 4–5 days post-infection, 70% of SFTSV-PA-infected Ifna−/−- mice showed minor symptoms, recovered from weight loss and survived, whereas 30% of them showed moderate symptoms and died over a period of 8–15 days post-infection (Fig. 4g,h). Remarkably, the administration of recombinant mouse IL-10 to SFTSV-PA-infected Ifnar−/− mice promptly led to severe symptoms, rapid weight loss and death at 5–8 days post-infection (Fig. 4g,h, yellow triangle). The recombinant mouse IL-10 treatment of mock-infected Ifnar−/− mice did not lead to any symptoms or death. Finally, compared to SFTSV-WT-infected mice, SFTSV-KR-infected mice showed no symptoms and weight loss, and ultimately survived (Fig. 4 i,j). In summary, NSs-WT binds to ABIN2 and induces TPL2-mediated IL-10 production; NSs-PA strongly binds to ABIN2 but cannot induce TPL2-mediated IL-10 production; and NSs-KR neither binds to ABIN2 nor induces TPL2-mediated IL-10 production (Supplementary Table 2). Correlated with TPL2 activation and IL-10 production, SFTSV-WT induces pathogenesis, but SFTSV-KR and SFTSV-PA do not induce pathogenesis. Thus, NSs-WT binds to ABIN2 to enhance TPL2-ABIN2-p105 signalling activity to induce IL-10 production for viral pathogenesis.
As seen in SFTSV-infected patients (Fig. 1o), IL-10 levels were increased in the acute phase of SFTS patients and further induced to higher levels in fatal cases12,26. This suggests that, upon SFTSV infection, NSs targets the TPL2 signalling pathway to produce IL-10 cytokine that creates a local immune-suppressive environment to allow high viral replication, ultimately leading to viral pathogenesis. Thus, the SFTSV-NSs and the host’s TPL2 signalling pathway are potential therapeutic targets to treat SFTSV-infected patients.
Methods
Bacterial strains, mammalian cell lines and culturing conditions.
Escherichia coli Top10 and DH10B were grown in LB (Lenox, Sigma) medium for genetic manipulations with appropriate antibiotics (50 μg ml−1 ampicillin and 50 μg ml−1 kanamycin). HEK293T, HeLa and mouse macrophage Raw264.7 cells were cultured in DMEM (Gibco) supplemented with 10% FBS (Seradigm), 100 U ml−1 penicillin and 100 μg ml−1 streptomycin (1% Pen/Strep, Gibco). All cells were maintained at 37 °C with 5% CO2. SFTSV-NSs-WT, NSs-PA and NSs-KR stably expressing Raw264.7 cells were generated by transfection with pIRES-NSs-3×Flag-puro, followed by selection with puromycin (0.5 μgml−1; Gibco). For viral infection study, Heartland virus, MO-4 (NR-49771) was obtained through BEI Resources, National Institute of Allergy and Infectious Diseases, National Institutes of Health (Bethesda, MD, USA), as part of the WRCEVA program, and Uukuniemi virus was kindly provided by B. B.
Preparation of BMDMs.
Bone marrow cells were removed from the femur and tibia, and red blood cells were lysed. For differentiation into BMDMs, bone marrow cells were suspended in DMEM supplemented with 20% MCSF containing L929 supernatants, 10% FBS (Seradigm) and 1% Pen/Strep (Gibco) and plated in a 10-cm non-treated plate (1.5 × 10⁷ cells per plate). On day 3 or 4, the fresh media containing 10% MCSF were added. After 7 days, BMDMs were used for the experiment (3 ×10⁵ cells per well of a 24-well culture plate).
Plasmids and reagents.
DNA encoding NSs from SFTS, Heartland, Bhanja, Granada or Lone Star phleboviruses were synthesized by Integrated DNA Technologies. cDNAs for human ABIN1, ABIN2, ABIN3, TPL2 and p105 were obtained from Addgene and Origene. All constructs for transient and stable expression in mammalian cells include pEF-MCS-IRES-puro, pEBG-GST-MCS and pCDH-CMV-MCS-EF1-puro (System Biosciences, Dual promoter) vectors. All NSs-expression plasmids contain a carboxy-terminal 3×Flag epitope tag, ABIN½/3-expression plasmids have a C-terminal V5 epitope tag, TPL2-expression plasmids have an amino-terminal Myc epitope tag or C-terminal green fluorescent protein (GFP) tag for the SiMPull assay, and the p105-expression plasmid contains a C-terminal mCherry tag for SiMPull assay. Substitution and deletion mutants were constructed by a standard PCR cloning strategy. For the generation of recombinant viruses, five plasmids were transfected to BHK21-T7 cells. pTVT7-ppL, pTVT7-ppM and pTVT7-S encode three viral antigenomic segments under the T7 promoter and pTM1-ppL and pTM1-N produce RNA-dependent RNA polymerase and N protein, respectively, to support viral replication. For mitogen-activated protein kinase inhibition, TPL2 kinase inhibitors (616404, Calbiochem, and sc-204351, Santa Cruz), a MEK kinase inhibitor (U0126, Calbiochem), and a c-Raf1 kinase inhibitor (475958, Calbiochem) were used along with DMSO as a control.
Mouse infection.
The USC Institutional Animal Care and Use Committee approved all animal studies. Tpl2−/− mice (C57BL/6 background) and Pdl1−/− mice (BALB/c background) were bred as littermate controls. C57BL/6 WT, BALB/c WT, Ifnar−/− mice (A129, C57BL/6 background) and Il10−/− mice (C57BL/6 background) were purchased from the Jackson Laboratory. All mice were maintained in a pathogen-free barrier at the USC animal facilities (Los Angeles, CA, USA) and were transferred into the Biosafety Level 3 (BSL3) facility immediately prior to and for the duration of the infection study.
Mice were 8–12-weeks old during the course of the experiments and were age and sex matched in each experiment. Sample size was based on empirical data from pilot experiments and publications. No additional randomization or blinding was used to allocate experimental groups. Immediately prior to infection, frozen SFTSV stock was thawed and centrifuged. Mice were intramuscularly infected with 105 plaque-forming units (p.f.u.) or 102 p.f.u. of SFTSV per mouse in 150 μl total volume of inoculum. For disease reconstitution, recombinant mouse IL-10 (BioLegend; at 1 μg per mouse) was injected intraperitoneally three times daily. To block the IFN signalling, anti-mouse IFNAR1 IgG (MAR1–5A3, BioXcell; at 2 μg per mouse) and its isotype IgG (MOPC-21, BioXcell; at 2 μg per mouse) were injected intraperitoneally 1 day prior to virus infection. The TPL2 inhibitor CAS871307–18-5 (a naphthyridine ATP-competitive inhibitor) was dissolved in DMSO, and sesame oil (S3547, Sigma) was used as a vehicle to inject mice. To neutralize the PD-L1 signalling, anti-mouse PD-L1 IgG (B7-H1, 10 F.9G2, BioXcell) and its isotype IgG (LTF-2, BioXcell) were injected intraperitoneally 1 day after virus infection. For the survival experiment, mice were weighed daily after infection. Spleen and liver tissues were collected and used for qPCR.
Co-immunoprecipitation and GST pull-down.
HEK293T or Raw264.7 cells were transfected with indicated DNA plasmids using standard polyethylenimine or ViromerR RED, respectively. For SFTSV-NSs-GFP infection, NSs-GFP-FUSE virus27 was kindly provided by B. B. Raw264.7 cells were infected by SFTSV-NSs-GFP for 24 h. Cells were collected at 48 h post-transfection followed by PBS washing, and cell pellets were resuspended in 1% NP-40 lysis buffer containing 50 mM Tris-HCl (pH 8.0), 150 mM NaCl and 1% NP-40 (Sigma) supplemented with complete protease inhibitor EDTA-free cocktail (Roche). After sonication or freeze-thaw three times, whole-cell extracts were pre-cleared with Sepharose beads rotating at 4 °C for 2 h, followed by filtering through a 0.45-μm polyethersulfone filter (Thermo Fisher). For co-immunoprecipitation, pre-cleared whole-cell extracts were incubated with indicated antibodies at 4 °C for 3–12 h, followed by further incubation with protein A/G agarose beads (Thermo Fisher) at 4 °C for 3 h. For GST pull-down, pre-cleared whole-cell extracts were incubated with GST-conjugated Sepharose beads (GE) at 4 °C for 2 h. Immobilized immune complexes or GST complexes containing beads were extensively washed five times using lysis buffer containing 1% NP-40 buffer with various concentrations of NaCl (150–500 mM). Beads were eluted in 2× Laemmli dye and heated for 5 min at 95 °C and then subjected to immunoblotting analysis.
Immunoblotting analysis.
Whole-cell lysates were lysed in 1% NP-40 buffer and measured for protein concentration by Bradford protein assay (Thermo Fisher) to equalize protein loading. Proteins were resolved on SDS-PAGE gels and transferred to a PVDF (polyvinylidene difluoride) membrane by semi-dry transfer at 25 V for 30 min (Trans-Blot Turbo, Bio-Rad). All membranes were blocked in 5% milk in TBS with Tween 20 (TBST; pH 8.0; Sigma) and probed with indicated antibodies in 5% milk or 5% BSA in TBST. Primary antibodies included: ABIN2 (H-300; Santa Cruz), TPL2 (Cot, M-20; Santa Cruz), NF-κB1 (also known as p105/p50, D4P4D; Cell Signaling), NF-κB (also known as p65, D14E12; Cell Signaling), ERK½ (also known as p44/42; Cell Signaling), phospho-ERK½ (P-ERK½; also known as P-p44/42, E10; Cell Signaling), MEK½ (9122, Cell Signaling), P-MEK½ (Ser 217/221; Cell Signaling) and c-Jun N-terminal kinase (JNK; SAPK, Cell Signaling). P-JNK (P-SAPK, Thr 183/Tyr 185; Cell Signaling), p38 (Cell Signaling), P-p38 (Thr 180/Tyr 182; Cell signaling), inhibitor of NK-κB kinase subunit-β (IKK-β) (L570; Cell Signaling), P-IKK-α/β (Ser 176/180, 16A6; Cell Signaling), GFP (B-2; Santa Cruz), GST (B-14; Santa Cruz), β-actin (C4; Santa Cruz), Flag (rabbit-Flag; F7425; Sigma, and mouse-Flag; F1804, Sigma), haemagglutinin (HA; rabbit-HA; PRB-101P; Covance, and mouse-HA; 16B12; BioLegend), V5 (rabbit-V5; A190; Bethyl, and mouse-V5; Invitrogen), Myc (rabbit-Myc; Poly9063, BioLegend, and mouse-Myc; 9E10, BioLegend). For the detection of the viral proteins NSs and Gn, rabbit anti-SFTSV-NSs antibody14 and mouse anti-SFSTV-Gn antibody28 were kindly provided from collaborators. Appropriate horseradish peroxidase-conjugated secondary antibodies were incubated on membranes in 5% milk in TBST at room temperature for 1 h and bands were developed with enhanced chemiluminescence reagent (Thermo Fisher) and imaged on an LAS-4000 imager (Fuji) or a ChemiDoc Touch (Bio-Rad). All source gels with uncropped blots are available in the Supplementary Information.
Yeast two-hybrid assay.
The yeast two-hybrid assay was performed using the Matchmaker GAL4 Two-Hybrid System 3 (Clontech Laboratories) per manufacturer’s instructions. SFTSV-NSs (2–293 amino acids) was subcloned into the vector pGBKT7 as bait. Saccharomyces cerevisiae AH109 cells expressing NSs were transformed with a human leukocyte matchmaker cDNA library. To test the interactions between proteins, the transformants were grown onto low-stringency (lacking leucine and tryptophan) and high-stringency (lacking adenine, histidine, leucine and tryptophan) selection plates.
Luciferase reporter assay.
HEK293T cells were seeded in 12-well plates at 4 ×10⁵ cells per well in the growth medium and cultured overnight. To measure IFN-β, HEK293T cells were co-transfected with 100 ng IFN-β luciferase reporter plasmid, 20 ng TK-Renilla luciferase plasmid and 100 ng plasmid encoding NSs proteins. Forty-eight hours after transfection, whole-cell lysates were prepared and subjected to the Dual-Glo luciferase assay per manufacturer’s instructions (Promega). Results are presented with Renilla luciferase levels normalized by the firefly luciferase levels. The luciferase report assay was performed in triplicate with at least three independently transfected cell populations.
Immunofluorescence confocal microscopy.
HeLa cells and Raw264.7 stable cells were seeded onto glass coverslips. After 24 h, cells were transfected using Lipofectamine 2000 (Invitrogen). Cells were washed 18 h after transfection, fixed in 4% paraformaldehyde, permeabilized with 0.5% Triton X-100 and blocked with 5% BSA for 1 h. Cells were stained with the designated primary antibodies, followed by labelling with anti-mouse Alexa Fluor 568 or 488 and anti-rabbit Alexa Fluor 568 or 488 (Molecular Probes). After antibody labelling, cells were counterstained with Hoechst (33342, Molecular Probes). Cells were imaged with a confocal microscope (Nikon) and were processed with NIS-elements confocal (Nikon).
qRT-PCR.
Total RNA was extracted using TRI reagent (Sigma) and digested with DNase I (Sigma). Total RNA (1 μg) was reverse transcribed into cDNA using iScript cDNA synthesis kit (Bio-Rad). Diluted cDNAs (1:5 or 1:10) were quantified using the iQ SYBR Green Supermix kit (Bio-Rad) per manufacturer’s instructions. DNase and RNase free water (Sigma W4502) and filter tips were used. CFX96 PCR machine (Bio-Rad) was used for qRT-PCR analysis with the following thermocycler conditions: 95 °C for 3 min (95 °C for 10 s, 59 °C for 20 s and 72 °C for 20 s) × 40 cycles, 95 °C for 10 s, melt curve analysis with 65–95 °C, increment 0.5 °C for 5 s, plate read added. Threshold cycle (Ct) of each gene was normalized to the internal reference gene (either the gene encoding p-actin or GAPDH); ΔCt = Ct, target gene – Ct, reference gene. Gene expression results are presented as relative mRNA level or fold change. Relative mRNA levels are calculated using the 2-ΔCt method. Fold changes are calculated using the 2-(ΔΔCt) method; in which the target gene relative to the control gene is determined by: ΔΔCt = ΔCt, target sample –ΔCt control sample. Gene-specific probes (5’ to 3’) for qRT- PCR are mouse Il10 (NM_010548, forward-CCCTGGGTGAGAAGCTGAAG and reverse-CACTGCCTTGCTCTTATTTTCACA), mouse Ifnb1 (NM_010510, forward-GCACTGGGTGGAATGAGACT and reverse-AGTGGAGAGCAGTTGAGGACA), gene encoding mouse actin (NM_007393, forward-TGAGAGGGAAATCGTGCGTGAC and reverse-AAGAAGGAAGGCTGGAAAAGAG), human IL10 (NM_000572, forward-GGTTGCCAAGCCTTGTCTGA and reverse-AGGGAGTTCACATGCGCCT) and human GAPDH (NM_002046, forward-GAAGGTGAAGGTCGGAGTC and reverse-GAAGATGGTGATGGGATTTC).
Knockdown of gene expression.
Small interfering RNA (siRNA) targeting human ABIN2 (isoform accession numbers: NM_024309, NM_001161527 and NM_001292016, purchased from Santa Cruz, sc-44638) was transfected into HEK293T cells using Lipofectamine 2000 (Invitrogen). After 24 h of incubation, the co-immunoprecipitation experiment was performed as described earlier. For control, siRNA-A (sc-37007, Santa Cruz) was included as a non-targeting 20–25-nt siRNA. Short hairpin RNA (shRNA) targeting the mouse Abin2 gene (5’-GCAGGAAGTTGAAAGACTTAC-3’) was introduced into Raw264.7 cells by lentivirus-mediated transduction. shRNA was cloned into the pLKO.1 vector and lentivirus was produced by transfection of HEK293T cells with a shRNA plasmid, packaging plasmid and envelope plasmid. Raw264.7 cells were spin infected by lentivirus with polybrene (8 μgml−1) and were subjected to gene expression assay.
ELISA.
Secreted cytokines in supernatants were quantified by the VeriKine mouse IFN-β ELISA kit (PBL Biomedical Laboratories) and the OptEIA mouse IL-10 ELISA kit (BD Biosciences) per manufacturer’s protocols. Raw264.7 cells were treated with LPS priming (20 ng ml−1; 0111:B4, Sigma) or SeV infection and the cell culture supernatants were collected at indicated time points. Control healthy participant sera and SFTSV-infected patient sera collected from Chungbuk National University College of Medicine and Korea National Research Institute of Health (Cheongju, South Korea) were subjected to Lumina Bio-Plex Multiplex Immunoassay to measure cytokines.
SiMPull assay.
The SiMPull technique combines the principles of a conventional pull-down assay with single-molecule fluorescence microscopy and enables direct visualization of individual protein-protein interactions22. Protein-protein interaction and TPL2 complex formations were assessed using the SiMPull assay. Briefly, HEK293T cells were transfected with the indicated DNA plasmids (NSs-Flag, ABIN2-V5, TPL2-GFP and p105-mCherry) and lysates were applied to slides coated with biotinylated anti-V5 antibody (GTX77436, GeneTex) for ABIN2-V5 pull-down. For binding, anti-Flag-Cy3 antibody (Sigma) was used for detecting NSs-Flag. For complex formations, GFP and mCherry fluorescence were imaged for TPL2-GFP and p105-mCherry, respectively. Proteins immobilized on the slides were visualized by a TIRF microscope equipped with excitation laser 488 nm (GFP) and 561 nm (mCherry or RFP). Twenty different regions of the imaging surface were imaged and molecular numbers were quantified by IDL and MATLAB programs.
Reverse genetics.
Recombinant viruses were generated as previously described14. Briefly, BHK21-T7 cells (1.5 × 10⁵ ml−1) were transfected with 0.1 μg pTM1-HB29ppL, 0.5 μg pTM1-HB29N and 1 μg of each pTVT7-based plasmid expressing cDNA copies of the viral antigenomic segments, using 3 μl TransIT-LT1 (Mirus Bio LLC) per μg of DNA as transfection reagent. After 7 days, the virus-containing supernatants were collected, clarified by low-speed centrifugation and stored at −80 °C. Stocks of recombinant viruses were grown in Vero E6 cells (1.5 × 10⁵ ml−1) at 37 °C by infecting at multiplicity of infection (MOI) = 0.01 and harvesting culture medium at 7 days post-infection. The genome segments of recovered viruses were amplified by RT-PCR (M-MLV Reverse Transcriptase, Promega) and their nucleotide sequences were determined to confirm the lack of mutations. pTVT7-S-NSs-PA and pTVT7-S-NSs-KR plasmids were constructed by using site-direct mutagenesis according to the manufacturer’s protocol and subsequently used to make SFTSV-PA or SFTSV-KR viruses (GENEART Site-Directed Mutagenesis System, Invitrogen).
Virus titration by plaque assay.
Vero E6 cells were infected with serial dilutions of virus and incubated under an overlay consisting of DMEM supplemented with 2.5% FBS, 0.5% minimum essential amino acids, 0.5% sodium pyruvate, 0.5% Glutamax, 1% Pen/Strep and 1.2% Avicel (FMC BioPolymer) at 37 °C for 14 days. Cell monolayers were fixed with 10% formaldehyde in PBS. Following fixation, cell monolayers were stained with 1% crystal violet in 20% ethanol to visualize plaques.
Viral copy number.
Viral loads of SFTSV-infected cells or tissues of infected mice were determined by qPCR. For M segment, the forward primer was SFTS-M-F: 5’-AAGAAGTGGCTGTTCATCATTATTG-3’, the reverse primer was SFTS-M-R: 5’-GCCTTAAGGACATTGGTGAGTA-3’ and the probe was SFTS-M-Probe: 5’−6FAM-TCATCCTCCTTGGATATGCAGGCCTCA-TAM-3’ (synthesized by Sigma). qPCR cycling was performed using 10 ng total RNA with SsoAdvanced Universal Probes Supermix (Bio-Rad) per manufacturer’s instructions. The copy numbers were calculated as a ratio of the copy numbers to the standard control.
Whole-blood infection.
Peripheral blood specimens were obtained from healthy donors and stored temporarily at 37 °C in a lithium heparin-containing tube (BD Biosciences) prior to infection. Blood specimens used in Fig. 1i were obtained from male and female subjects of equal distribution. SFTSV infections of whole blood were performed using MOI = 1. Each infection mix consisted of 1 ml blood and 1 ml virus suspension prepared in serum-free DMEM. Samples were incubated at 37 °C for 24 h with intermittent shaking. Mock infections using the cell-free fractions from Vero E6 cultures were performed in parallel. All procedures performed in studies using human whole blood were in accordance with the ethical standards of the USC code of ethics.
NanoString analysis.
Total RNA was isolated from Raw264.7 cells expressing NSs with or without LPS treatment and spleens of Ifnar−/− mice infected by SFTSV, and 100 ng was used to determine the absolute levels of gene expression through a nCounter mouse immunology panel (~550 immune-related genes). Hybridization and nCounter were performed by the Molecular Genomics Core of USC, according to the manufacturer’s protocol (NanoString Technologies). In brief, reactions were hybridized for 20 h at 65 °C, after which the products were used to run on the nCounter preparation station for the removal of excess probes. Data were collected with the nCounter digital analyzer by counting individual barcodes. Data generated from the nCounter digital analyzer were examined with the nSolver Analysis software 3.0 (NanoString Technologies). Data were normalized to the geometric means of spiked-in positive controls for assay efficiency and spiked-in negative controls to normalize for background. The data were further normalized to the housekeeping genes, such as Gapdh, Hprt and Tubb5, and reported as normalized RNA counts (means ± s.e.m. (standard error of the mean)). For further analysis, differential expression of genes in response to SFTSV-WT or SFTSV-PA infection versus the mock infection sample was performed and visualized as a volcano plot using the Advanced Analysis module. In the volcano plot, the –log10 P value of each gene is plotted (on the vertical axis) against its log2 fold change (on the horizontal axis). For each gene, a single linear regression was fit using all selected covariates to predict expression. Output is shown with a non-adjusted P value as well as Benjamini-Hochberg false discovery rate. The genes of interest were both high in the graph (corresponding to a very small P value) and at either the right or the left side (corresponding to increased or decreased expression).
Biosafety.
All work with infectious agents for SFTSV was done in the Wright Foundation and Hasting Foundation Laboratories Animal BSL3 (ABSL3) Facility at the Keck School of Medicine of USC.
Statistical analysis.
All results are presented as the mean ± s.d. (standard deviation). All experiments were repeated at least twice with a representative gel or plot being shown. Statistical analysis was performed using Prism 6.0 (Graph Pad Software). The n values in the figure legends indicate the number of independent experiments and each experiment was conducted with two to three technical replicates. Where appropriate, column analyses were performed using an unpaired, two-tailed t-test with Welch’s correction or one-way analysis of variance (ANOVA) with Bonferroni’s or Dunnett’s test was used for multi-component comparisons. For grouped analyses, two-way ANOVA with Bonferroni’s or Dunnett’s test was performed. P < 0.05 (95% confidence interval) were considered significant. Comparison of mouse survival was estimated using the Kaplan-Meier method and analysed by log-rank analysis.
Reporting Summary.
Further information on research design is available in the Nature Research Reporting Summary linked to this article.
Supplementary Material
Acknowledgements
This work was partly supported by CA200422, CA180779, DE023926, DE027888, AI073099, AI116585, AI129496, AI140718, AI140705, the Hastings Foundation and the Fletcher Jones Foundation (J.U.J.), the Wellcome Trust Senior Investigator Award 099220/Z/12/Z and the Wellcome Trust/Royal Society Henry Dale Fellow (B.B.), the Korean National Research Foundation MEST 2015020957 (J.-S.L.), the National Science and Technology Major Project China 2013ZX09509102 (W.L.) and the Korea Health Industry Development Institute HI15C2817 (Y.-K.C.).
Footnotes
Data availability
The data that support the findings of this study are available from the corresponding author upon request.
Competing interests
The authors declare no competing interests.
Additional information
Supplementary information is available for this paper at https://doi.org/10.1038/s41564–018-0329-x.
Publisher’s note: Springer Nature remains neutral with regard to jurisdictional claims in published maps and institutional affiliations.
References
- 1.Gai ZT et al. Clinical progress and risk factors for death in severe fever with thrombocytopenia syndrome patients. J. Infect. Dis. 206, 1095–1102 (2012). [DOI] [PubMed] [Google Scholar]
- 2.Liu S et al. Systematic review of severe fever with thrombocytopenia syndrome: virology, epidemiology, and clinical characteristics. Rev. Med. Virol. 24, 90–102 (2014). [DOI] [PMC free article] [PubMed] [Google Scholar]
- 3.Guardado-Calvo P & Rey FA The envelope proteins of the Bunyavirales. Adv. Virus Res. 98, 83–118 (2017). [DOI] [PubMed] [Google Scholar]
- 4.Yu XJ et al. Fever with thrombocytopenia associated with a novel bunyavirus in China. N. Engl. J. Med. 364, 1523–1532 (2011). [DOI] [PMC free article] [PubMed] [Google Scholar]
- 5.Oh WS et al. Plasma exchange and ribavirin for rapidly progressive severe fever with thrombocytopenia syndrome. Int. J. Infect. Dis. 18, 84–86 (2014). [DOI] [PubMed] [Google Scholar]
- 6.Xie QX, Li X, Cheng J & Shao Y Multiple organ damage caused by a novel tick-borne bunyavirus: a case report. J. Vector Borne Dis. 50, 314–317 (2013). [PubMed] [Google Scholar]
- 7.Chaudhary V et al. Suppression of type I and type III IFN signalling by NSs protein of severe fever with thrombocytopenia syndrome virus through inhibition of STAT1 phosphorylation and activation. J. Gen. Virol. 96, 3204–3211 (2015). [DOI] [PubMed] [Google Scholar]
- 8.Ning YJ et al. Disruption of type I interferon signaling by the nonstructural protein of severe fever with thrombocytopenia syndrome virus via the hijacking of STAT2 and STAT1 into inclusion bodies. J. Virol. 89, 4227–4236 (2015). [DOI] [PMC free article] [PubMed] [Google Scholar]
- 9.Qu B et al. Suppression of the interferon and NF-κB responses by severe fever with thrombocytopenia syndrome virus. J. Virol. 86, 8388–8401 (2012). [DOI] [PMC free article] [PubMed] [Google Scholar]
- 10.Santiago FW et al. Hijacking of RIG-I signaling proteins into virus-induced cytoplasmic structures correlates with the inhibition of type I interferon responses. J. Virol. 88, 4572–4585 (2014). [DOI] [PMC free article] [PubMed] [Google Scholar]
- 11.Moriyama M et al. Two conserved amino acids within the NSs of severe fever with thrombocytopenia syndrome phlebovirus are essential for anti-interferon activity. J. Virol. 92, e00706–18 (2018). [DOI] [PMC free article] [PubMed] [Google Scholar]
- 12.Liu MM, Lei XY, Yu H, Zhang JZ & Yu XJ Correlation of cytokine level with the severity of severe fever with thrombocytopenia syndrome. Virol. J. 14, 6 (2017). [DOI] [PMC free article] [PubMed] [Google Scholar]
- 13.Deng B et al. Cytokine and chemokine levels in patients with severe fever with thrombocytopenia syndrome virus. PLoS ONE 7, e41365 (2012). [DOI] [PMC free article] [PubMed] [Google Scholar]
- 14.Brennan B et al. Reverse genetics system for severe fever with thrombocytopenia syndrome virus. J. Virol. 89, 3026–3037 (2015). [DOI] [PMC free article] [PubMed] [Google Scholar]
- 15.Matsuno K et al. Animal models of emerging tick-borne phleboviruses: determining target cells in a lethal model of SFTSV infection. Front. Microbiol. 8, 104 (2017). [DOI] [PMC free article] [PubMed] [Google Scholar]
- 16.Song P et al. Deficient humoral responses and disrupted B-cell immunity are associated with fatal SFTSV infection. Nat. Commun. 9, 3328 (2018). [DOI] [PMC free article] [PubMed] [Google Scholar]
- 17.Iyer SS & Cheng G Role of interleukin 10 transcriptional regulation in inflammation and autoimmune disease. Crit. Rev. Immunol. 32, 23–63 (2012). [DOI] [PMC free article] [PubMed] [Google Scholar]
- 18.Brooks DG, Lee AM, Elsaesser H, McGavern DB & Oldstone MB IL-10 blockade facilitates DNA vaccine-induced T cell responses and enhances clearance of persistent virus infection. J. Exp. Med. 205, 533–541 (2008). [DOI] [PMC free article] [PubMed] [Google Scholar]
- 19.Brooks DG et al. Interleukin-10 determines viral clearance or persistence in vivo. Nat. Med. 12, 1301–1309 (2006). [DOI] [PMC free article] [PubMed] [Google Scholar]
- 20.Redpath S, Ghazal P & Gascoigne NR Hijacking and exploitation of IL-10 by intracellular pathogens. Trends Microbiol. 9, 86–92 (2001). [DOI] [PubMed] [Google Scholar]
- 21.Wagner S et al. Ubiquitin binding mediates the NF-κB inhibitory potential of ABIN proteins. Oncogene 27, 3739–3745 (2008). [DOI] [PubMed] [Google Scholar]
- 22.Jain A et al. Probing cellular protein complexes using single-molecule pull-down. Nature 473, 484–488 (2011). [DOI] [PMC free article] [PubMed] [Google Scholar]
- 23.Lang V et al. ABIN-2 forms a ternary complex with TPL-2 and NF-κB 1 p105 and is essential for TPL-2 protein stability. Mol. Cell. Biol. 24, 5235–5248 (2004). [DOI] [PMC free article] [PubMed] [Google Scholar]
- 24.Aoki M et al. The human cot proto-oncogene encodes two protein serine/ threonine kinases with different transforming activities by alternative initiation of translation. J. Biol. Chem. 268, 22723–22732 (1993). [PubMed] [Google Scholar]
- 25.Saraiva M & O’Garra A The regulation of IL-10 production by immune cells. Nat. Rev. Immunol. 10, 170–181 (2010). [DOI] [PubMed] [Google Scholar]
- 26.Peng C et al. Decreased monocyte subsets and TLR4-mediated functions in patients with acute severe fever with thrombocytopenia syndrome (SFTS). Int. J. Infect. Dis. 43, 37–42 (2016). [DOI] [PubMed] [Google Scholar]
- 27.Brennan B, Rezelj VV & Elliott RM Mapping of transcription termination within the S segment of SFTS phlebovirus facilitated generation of NSs deletant viruses. J. Virol. 91, e00743–17 (2017). [DOI] [PMC free article] [PubMed] [Google Scholar]
- 28.Sun YY et al. Nonmuscle myosin heavy chain IIA is a critical factor contributing to the efficiency of early infection of severe fever with thrombocytopenia syndrome virus. J. Virol. 88, 237–248 (2014). [DOI] [PMC free article] [PubMed] [Google Scholar]
Associated Data
This section collects any data citations, data availability statements, or supplementary materials included in this article.