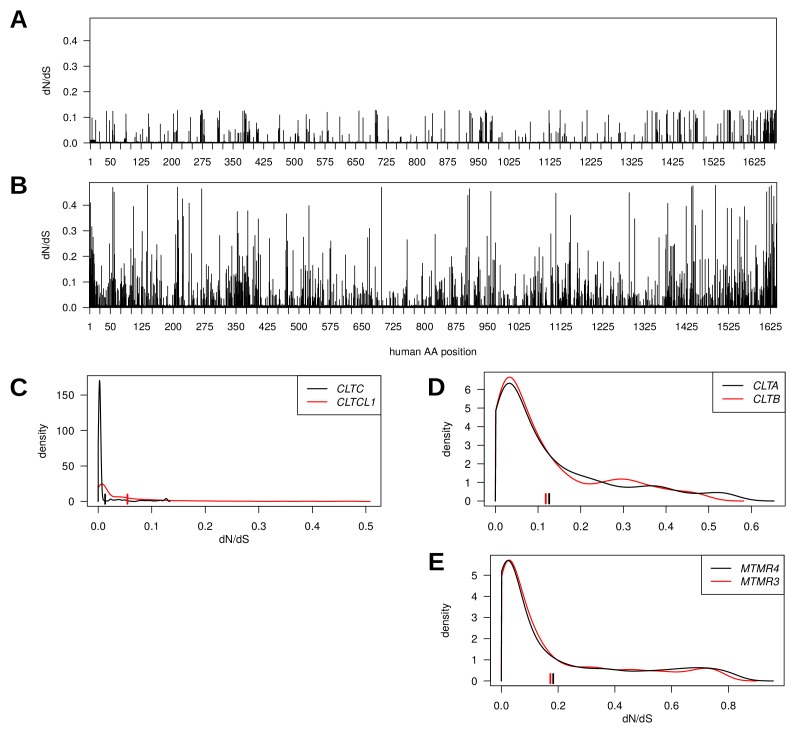
Figure 2. Genes encoding clathrin heavy chains show evidence for purifying selection with CLTCL1 (CHC22-encoding) being more variable than CLTC (CHC17-encoding) over evolutionary time.
Evolutionary rates expressed as dN/dS ratios are shown for each position in CLTC (A) and CLTCL1 (B). Rates are averages over an entire phylogenetic tree and therefore not specific to the human proteins. However, to assist interpretation, only rates for residues present in the human proteins are shown. Kernel density estimates of the distributions of dN/dS ratios per paralogous pair of proteins (C–E). CLTA and CLTB encode clathrin light chains A and B, respectively. MMTR3 and MMTR4 encode myotubularin lipid phosphatases. Mean dN/dS ratios averaged over all sites are shown as hatched marks.

